Article

Using Spatial Analysis to Design a Solid Waste Collection System

by
Juan Antonio Araiza-Aguilar
1,*,
María Neftalí Rojas-Valencia
2,
Hugo Alejandro Nájera-Aguilar
1,
Rubén Fernando Gutiérrez-Hernández
3 and
Carlos Manuel García-Lara
1
1
School of Environmental Engineering, University of Science and Arts of Chiapas, Tuxtla Gutierrez 29000, Mexico
2
Institute of Engineering, National Autonomous University of Mexico, External Circuit, Mexico City 04510, Mexico
3
Chemical and Biochemical Engineering Department, National Technology of México—Technological Institute of Tapachula, Tapachula 30700, Mexico
*
Author to whom correspondence should be addressed.
Urban Sci. 2024, 8(3), 95; https://doi.org/10.3390/urbansci8030095
Submission received: 11 May 2024 / Revised: 4 July 2024 / Accepted: 16 July 2024 / Published: 23 July 2024
(This article belongs to the Special Issue Advances in Urban Spatial Analysis, Modeling and Simulation)

Abstract

:
In this paper, a proposal was presented to improve the MSW collection service in the municipality of Reforma, in Chiapas, Mexico. Specific field work was developed and various spatial analysis techniques were applied in the GIS environment. The application of a multivariate analysis technique (Grouping Analysis) allowed the study area to be clustered into three waste collection sectors with common characteristics, which were the basis for generating three collection route scenarios. Scenario 1 corresponds to the current situation, where 478 waste collection points are served, with an average travel distance of 60.30 km and a collection time of 8.00 h. Scenario 2 was generated through the “maximize coverage” algorithm and vehicle route modeling in ArcGis 10.8. In this scenario, 1220 waste collection points are served, with an average travel distance of 143.21 km and an average collection time of 12.38 h. Scenario 3 was created using the “minimize facilities” algorithm, as well as collection modeling in ArcGis 10.8. Using this algorithm, impedances (distances) were automatically minimized so that 697 waste collection points could be served, with an average travel distance of 100.00 km and an average collection time of 9.66 h. In terms of improvement, scenario 3 gives the best results, because it minimizes distances and average travel times.

1. Introduction

Collection and transportation are fundamental components of Municipal Solid Waste (MSW) management systems, which can cause increases or decreases in the costs and associated environmental emissions [1,2]. It is estimated that these stages of waste management can represent between 10 and 90% of the operating costs of public sanitation, thus depending on various factors such as the size of the locality, population density, level of equipment, planning, and financial management, among others [3,4,5]. Emissions of greenhouse gases such as carbon dioxide (CO2) and nitrogen oxides (NOx), as well as particulate matter, are also associated with the collection and transportation of waste [6].
According to Martinho et al. [7], the provision of waste collection services varies between developed and developing countries. In the first case, collection is carried out with highly specialized equipment (stationary or vacuum containers), but also incorporating separation procedures for potentially recoverable materials, such as plastics or metals [8,9]. In developing countries, collection systems are basic, because they use manual loading of waste in most cases, traditional storage methods, and non-specialized vehicles [10,11]. Additionally, the coverage and collection frequency of localities in these latter countries tend to decrease, either due to the degree of urbanization of the locality or due to the distance from the municipal seat [12].
Through optimal route design, fuel consumption, distances traveled, associated costs, and gaseous emissions can be minimized [13], and collection service to distant locations or increased service areas in urban settlements can also be provided. The studies conducted by Carranza and Antón [14] and Rodrigues et al. [15] identify several factors that can influence the design of waste collection routes, for example, (i) the patterns of urban settlements, which are the basis for a balanced collection design; (ii) labor and worker capacity, which can reduce the workforce and restrict work schedules; (iii) detailed MSW production rates, which are useful for determining collection zones and points; (iv) physical routing restrictions such as narrow or unpaved streets, which also limit the travel of vehicles through the streets; and (v) storage and collection equipment, which limit the scope of collection systems. To the above we should add subjectivity and technical ignorance in the design of collection routes, which cause biases and deficiencies, particularly in developing countries [16].
Several of the problems mentioned above can be solved through the use of computer tools such as Geographic Information Systems (GISs). Today, this technology is cited in the literature as a useful instrument to model the various stages of solid waste management, ranging from generation to final disposal [17,18]. In Rybova et al. [19] and Mahmood et al. [20], these tools were used in the generation stage. In Khorsandi et al. [21], Damasceno et al. [22], and Ağacsapan and Cabuk [23], these technologies were used for the placement of treatment and final disposal infrastructure. In Amal et al. [24], Fennonato et al. [25], and Kinobe et al. [26], these tools were used to model efficient waste collection routes using different algorithms or including pollutant calculation methods. GISs also offer a visual output that is easily understandable and interpretable by decision makers. Unfortunately, these tools are infrequently disseminated and applied in medium- or small-size settlements, which are generally characterized by high dispersion patterns or a lack of data.
In this research, an MSW collection system was designed for the municipality of Reforma, in the state of Chiapas, Mexico. Currently, the municipality MSW collection service is operated by the City Council. However, because of the lack of knowledge and information, it is not carried out correctly and urgently needs to be improved. The most notable deficiencies are the following: (i) the lack of data regarding waste production at the municipal level; (ii) not using containers on roads, which causes the dispersion of waste due to the action of animals or the wind; and (iii) the lack of municipal sectorization, which causes unbalanced collection and low coverage.
In this research, spatial analysis techniques were used in the GIS environment to improve the current collection service. Initially, a database was generated through specific field work and spatial analysis (the generation, storage, and collection stages were modeled). Subsequently, these collected data were used as input parameters to model different scenarios of the collection system. This investigation differs from others mainly because GIS tools were used not only to model waste collection routes, but they were also used to sectorize and determine the number and location of waste collection points. The sources of MSW production were also analyzed spatially. This paper is expected to serve as a guide for future work and can be replicated in other localities or municipalities near the study area.

2. Materials and Methods

2.1. Study Area and Context

This research was developed in the municipality of Reforma, in the state of Chiapas, located in the southeast of Mexico. Its location coordinates are 17°51′51.18″ north latitude and 93°13′45.79″ west longitude (Figure 1). The study area has a territorial extension of 434.55 km2, and it also has 35 localities, of which only the municipal seat is urban. In 2020, the municipal population was 44,829 inhabitants, of which 65% lived in the municipal seat [27,28]. Commerce and services, highly influenced by the presence of oil complexes in the area, are the main economic activities.

2.2. Collection of Starting Data

An MSW collection system can be divided into three stages. The first stage focuses on the estimation and knowledge of the sources and quantities of waste generated. The second stage relates to the process of collecting this waste, thus considering the characteristics of the roads and collection vehicles, as well as the storage system (collection points). The final stage involves the treatment or elimination of the waste; specifically, the transportation distances to those places are analyzed [29]. In Latin America, and specifically in Mexico, these stages are related and are known as macro and micro routing.

2.2.1. Waste Generation

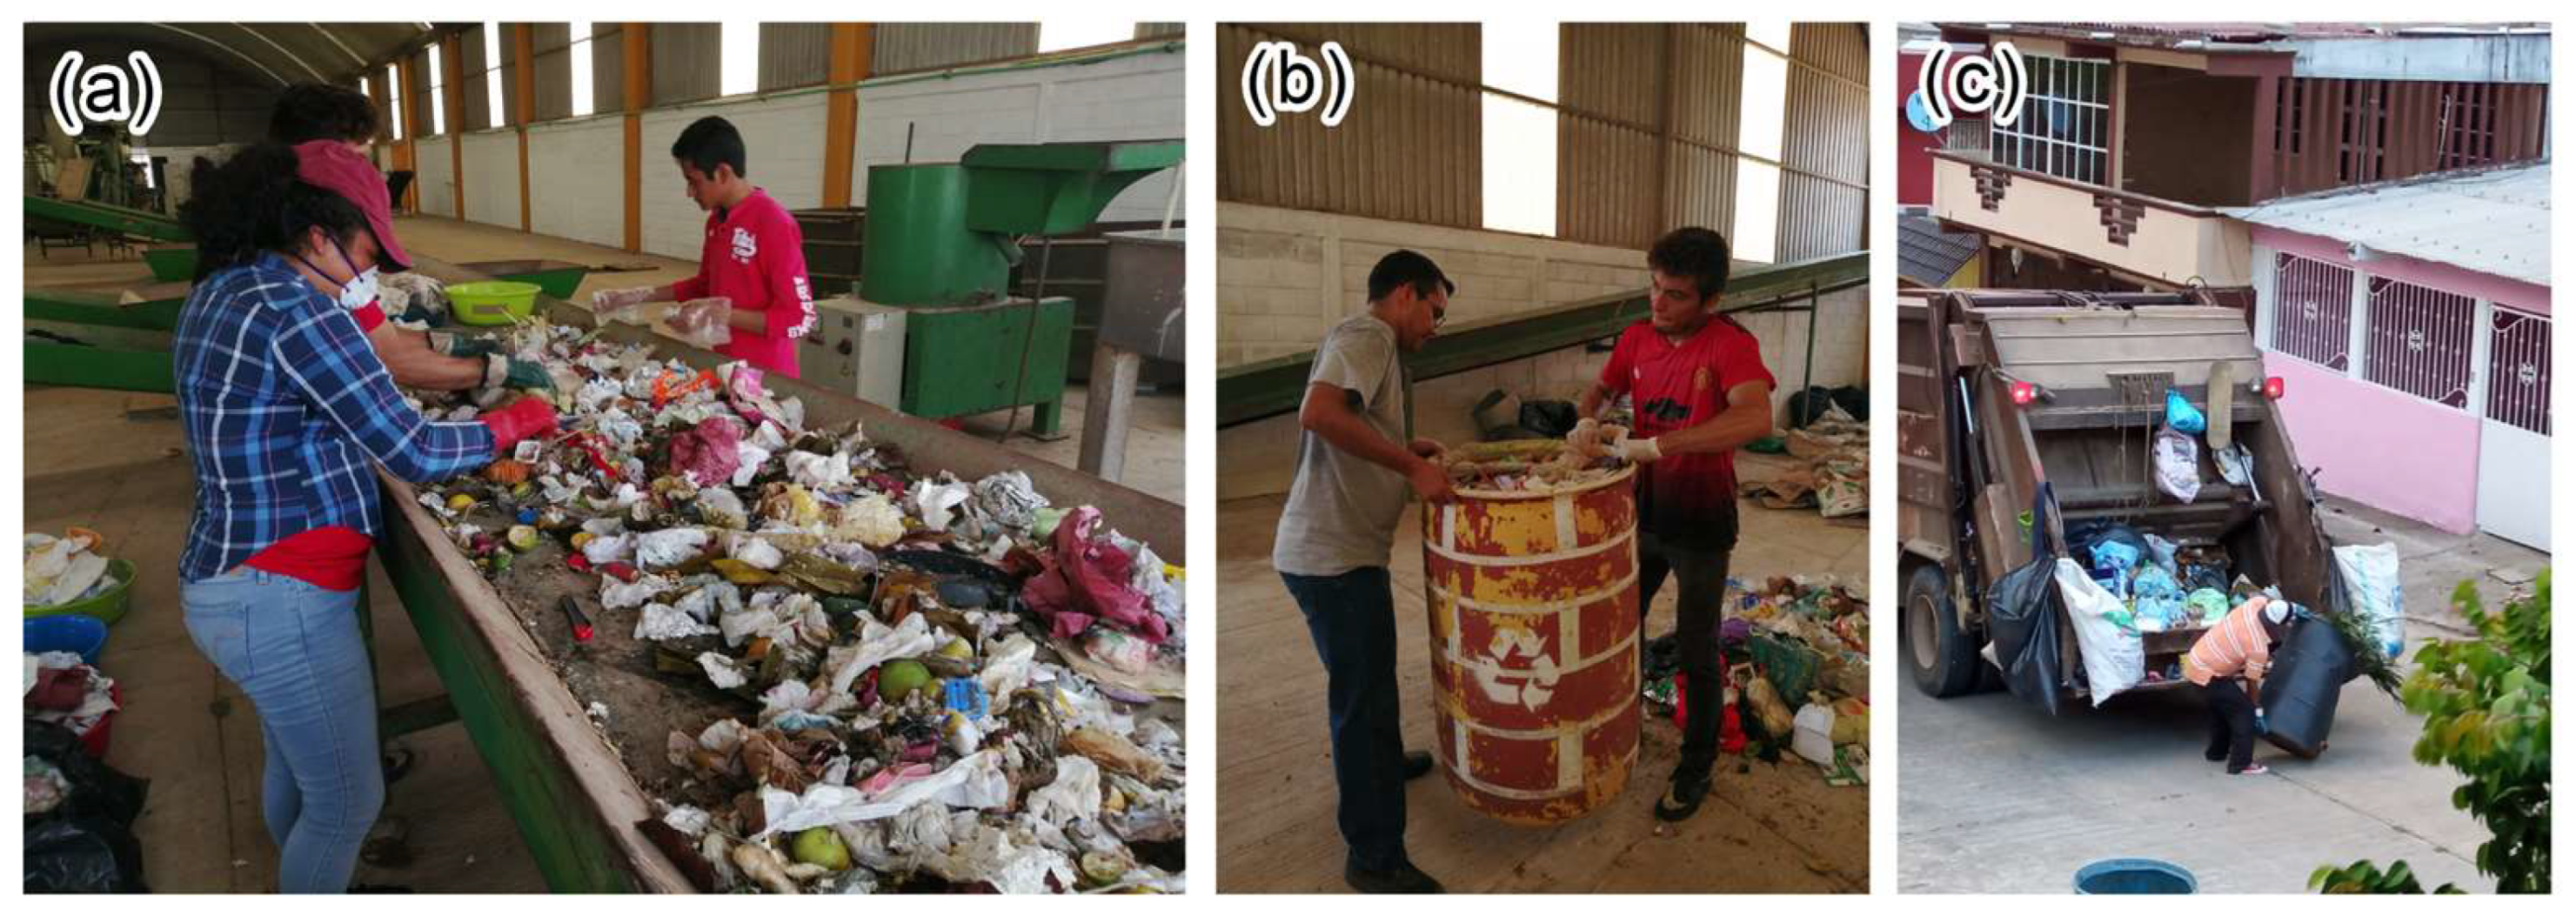
In order to obtain the waste composition of the study area (Figure 2a), the volumetric weights (Figure 2b) and the production rates of household waste (Figure 2c), as well as the procedures proposed by Araiza et al. [30], were applied, together with the Mexican technical standards [31,32,33]. Regarding the production of non-domiciliary waste, some reference rates presented in Araiza et al. [34] were used, as well as the spatial location of such sources within the study area. Finally, Equations (1)–(3) were used to extend the information collected in the field of the entire study area.
T W G = H W G + N H W G + W U S
P W G = T W G T P
W G S = P W G P S
In these Equations,  T W G  is the total waste generation of the study area in tons/day;  H W G  is the waste generation from household sources in tons/day;  N H W G  is the waste generation from non-household sources (e.g., schools and small businesses) in tons/day;  W U S  is the waste generation from urban services (for example, parks, gardens, and roads) in tons/day;  P W G  is the urban generation per capita in kg/inhabitant-day;  T P  is the total population of the study area;  W G S  is the waste generation by sector or collection area in tons/day;  P S  is the population of each sector or collection area.

2.2.2. Current Waste Collection System

Given the lack of information regarding current waste management, data were collected from field trips and through interviews with waste management operational personnel. Specifically, the number and characteristics of the collection vehicles (type of load, box volume) were analyzed (Figure 3a), as well as the waste collection points and roads (width, type of paving, and direction of road) (Figure 3b). All this information was used to determine the road network in the GIS environment.

2.3. Grouping of Waste Production Areas (Waste Collection Sectors)

The collection sectors or areas refer to those places to which the collection vehicles will be assigned to carry out their primary function [35]. In small settlements, the number of sectors can be equivalent to the number of existing collection vehicles. In large settlements, the design of sectors also involves analyzing the operating shifts and collection frequencies, in addition to the topographic characteristics of the study area.
The analysis of the collection sectors is essential to balance the number of collection vehicles within each sector. In this work, GIS tools were used to analyze the behavior of each sector, particularly waste production rates, distances from the municipal seat, and socioeconomic characteristics, such as Generation of MSW ( G _ M S W ) , Economically Active Population ( E A P ), Population Born in Another Municipality ( P B A M ), Economic Units per Census Area ( E U C A ), Total Inhabited Homes ( T I H s ) and Distance from Municipal Seat ( D M S ). The analysis was carried out through “Grouping Analysis Tools” of ArcGis 10.8, which uses an unsupervised classification algorithm to determine natural clusters (collection sectors) in the initial data in such a way that all entities within of each group are as similar as possible, and all groups are as different as possible from each other.
Grouping Analysis uses a spatially constrained multivariate technique called SKATER (Spatial “k” luster Analysis by Tree Edge Removal). This technique is a variation of the k-means algorithm, which is used to efficiently choose initial centroids and separates features so that differences within the cluster are minimized [36]. The fundamental equations of this algorithm are shown in Equations (4) and (5), where  S S E  determines the similarity within the groups, while  S S T  reflects the difference between the groups;  n  is the number of features;  n i  is the number of features in cluster  i n c  is the number of classes (clusters);  n v  is the number of variables used to cluster features;  V i j k  is the value of the  k t h  variable of the  j t h  feature in the  i t h  cluster;  V k ¯  is the mean value of the  k t h  variable;  V t k ¯  is the mean value of the  k t h  variable in cluster  i .
S S E = i = 1 n c j = 1 n i k = 1 n v V i j k V t k ¯ 2
S S T = i = 1 n c j = 1 n i k = 1 n v V i j k V k ¯ 2
It is important to mention that when the Grouping Analysis tools is run, an  R 2  value is calculated for each variable (Equation (6)). This  R 2  value reflects how much of the variation in the variable’s original data is maintained after the clustering process, so the higher the  R 2  value for a specific variable, the better that variable is at discriminating between entities [36].
R 2 = S S T S S E S S T
In addition to the above, Equation (7) proposed by Benitez [37] is used to choose the number of initial clusters. In that empirical equation,  Z M S W  is the number of waste collection sectors;  T C C  is the total collection capacity in tons/day, and  T W G  was previously described as the total MSW generation in tons/day.
Z M S W = T W G T C C

2.4. Analysis of Waste Generation Sources

Fixed MSW production sources, such as homes, schools, shopping centers, small businesses, parks, and gardens, were analyzed through two spatial analysis metrics. The first technique used was Kernel Density, which allows us to visualize where the sources of MSW production are concentrated within the study area. The kernel function is shown in Equation (8), which is based on the quartic kernel function described by Silverman [38]. In that equation,  i = 1 n  are the entry points;  p o p i  is the population field value of point  i  (optional parameter);  d i j  is the distance between point  i  and location  j  (x, y);  r  is the bandwidth.
D = 1 r 2 i = 1 n 3 π · p o p i 1 d i j 2 r 2 2
On the other hand, the Cluster and Outlier Analysis tool (Anselin Local Moran’s I), which uses a set of entities (generation sources) and an analysis field (waste production rate), was used to identify spatial clusters with high values, low values, and outliers. This statistical tool was developed by Anselin [39] as a local indicator of spatial association or LISA statistic, which calculates a local Moran’s i value, a Z score, a pseudo-p value, and a code representing the cluster type for each statistically significant entity. Z scores and pseudo-P values represent the statistical significance of the calculated index values [40]. This tool uses Equation (9), where  x i  is an attribute of entity  i X ¯  is the average of the corresponding attribute;  w i , j  is the spatial weight between entity  i  and  j S i 2  is the variance determined through Equation (10), and  n  equals the total number of entities.
I i = x i X ¯ S i 2     j = 1 ,     j i n w i , j x j X ¯
S i 2 = j = 1 ,     j i n     x j X ¯ 2 n 1

2.5. Analysis of Waste Collection Routes

In order to analyze the current collection routes, including the waste collection points (location of containers or corners), as well as generate the scenarios, a network analysis was carried out in the GIS environment. Initially, a database of the roads in the study area was created through ArcGis 10.8 software and information from INEGI [41]. The GIS database contains several types of feature classes such as primary and secondary roads (line-point and arc nodes). Inside, there are 2073 nodes and 2473 arcs, with the latter having a total length of 672.37 km. This database was reviewed through a topological analysis in order to eliminate errors.
The length of each arc was determined through the software mentioned above using the “Calculate Geometry” function. To obtain the transport times, Equation (11) was used, where  F T   o r   T F   m i n u t e s  corresponds to the transport time in both directions of the analyzed arc;  S H A P E _ L e n g t h  is the length of the analyzed arc in meters;  F T   o r   T F _ S p e e d  is the speed allowed in both directions of the arc analyzed in km/hr; finally, 0.06 is the conversion factor to obtain transport times in minutes (quotient resulting from dividing the 60 min in an hour by the 1000 m in 1 km).
F T   o r   T F   m i n u t e s = 0.06 S H A P E _ L e n g t h   ( m ) F T   o r   T F _ S p e e d   ( k m / h r )

2.5.1. Location–Allocation of Waste Collection Points

The analysis of the waste collection points (location of containers or corners) was carried out using the ArcGIS 10.8 location–allocation tool, whose purpose is to search suitable waste collection points and assign MSW production sources to those waste collection points. The solution to the location–allocation problems is based on a combinatorial analysis (Equation (12)), where given  N  candidate facilities and  M  demand points with a weight, a subset of facilities  P  must be chosen (with P < N) such that the sum of the weighted distances from each  M  to the nearest  P  is minimized [42]. The location–allocation problems to be solved in this paper are briefly explained below:
N P = N ! P ! N P !  
  • Maximize coverage: This model chooses the facilities (waste collection points) so that the maximum number of possible demand locations (MSW production sources) are served within a specified impedance value, which can be the distance or service time [42]. This location–allocation problem was developed by Church and Reveille [43], and its objective function is the one presented in Equations (13)–(15).
M a x i m i z e     Z = i I a i y i
It is subject to the following restrictions:
j N i x j   y i   f o r   a l l   i I
j J x j   = P    
where  a i  is the quantity of demand at point  i I  is the set of demand points;  J  is the set of facilities;  P  is the number of facilities to be located;  N i  is the set of facilities capable of covering the demand of point  i . Finally, the variables  x j y i , and  S  are defined by the Equations (16)–(18):
x j = 1 0   i f   a   f a c i l i t y   i s   l o c a t e d   a t   s i t e   j O t h e r w i s e
y i = 1 0   i f   t h e   d e m a n d   p o i n t   i   i s   c o v e r e d   b y   a   f a c i l i t y   w i t h i n   t h e   i m p e d a n c e   S O t h e r w i s e
S = i s   t h e   d i s t a n c e   o r   t h e   m a x i m u m   s e r v i c e   t i m e
Equation (13) maximizes the number of demand points covered within a specified impedance value. Equation (14) ensures that demand point  i  is assigned to a selected facility, and it also ensures that all facilities assigned to demand point  i  are located within the specified distance or time limit. Equation (15) indicates that there are  P  facilities to be located.
  • Minimize facilities: This location–allocation problem is similar to the problem of maximizing coverage, with the exception that the number of facilities to be located is determined by the solver of the software used, in this case, ArcGis 10.8 [42]. The “Minimize facilities” model has received multiple contributions from researchers who study the location of public and private services [44,45,46]. Its objective function is presented in Equations (19) and (20).
M i n i m i z e     Z = j = 1 m x j
It is subject to the following restrictions:
j N i x j = 1               i = 1 , . . , n
where  N i  is the set of eligible facility sites located within the distance limit and that can serve demand point  i  ( j | c i j S );  c i j  is the distance between demand site  i  and candidate site  j S  is the maximum service distance or time;  x j  is a Boolean variable defined similarly to the localization problem above.

2.5.2. Waste Collection Vehicles Routes

The analysis of collection vehicle routes was carried out through the Network Analyst module of ArcGis 10.8, which uses the classic Dijkstra algorithm to solve the problem of the shortest path in an undirected, non-negative, and weighted graph to later be used within the context of real-world transportation data [47]. This algorithm has been modified within the software used to respect user configurations, such as one-way restrictions, turning restrictions, and barrier and streetside restrictions, thereby trying to minimize the specified cost attribute.
One of the options of the software used is to be able to reorder the stops to find the optimal routes, which can have 2 possible variants: (i) reorder all the stops and obtain the optimal route, or (ii) respect the origin and destination, thus reordering only intermediate stops. It should be noted that, by selecting this last option, the analysis is no longer considered a shortest route problem and is now considered a traveling agent problem. The specific routing option used in the ArcGis environment was “New Vehicle Routing Problem”.
Other important metrics were also determined; for example, the number of collection vehicles in each sector or collection area  N w c v , was calculated by means of Equation (21), while the number of waste collection points  N w c p  and the volume of waste in those waste collection points  V w c p  were determined by means of Equations (22) and (23).  W G S  was previously defined as the waste production per sector or collection area in tons/day;  w c f  is the waste collection frequency factor (dimensionless), which is shown in Table 1 W c c  is the capacity of the waste collection truck in tons;  ρ w  is the density or volumetric weight of the waste in tons/m3; and  S c R f , and  ε  are safety coefficients that range between 0 and 1 (service coefficient, reserve factor, and filling coefficient, respectively). All these metrics were adapted from SEDESOL [48].
N w c v = W G S w c f W c c w d t S c R f
V w c p = W G S ρ w w c f
N w c p = W G S w c f V w c p ρ w ε

2.5.3. Impedances and Other Aspects Considered in the Analysis

Impedance is the specific property that indicates the cost of traveling along a network, which can be time or distance. In this paper, the analysis of the waste collection points was carried out considering only distance as the impedance factor, with a cutoff value of 100 m. Additionally, the calculation of displacement costs was determined only in the direction of transportation that goes from the MSW production sources to the waste collection points. The impedance decay or transformation was considered linear (value = 1). Regarding the collection routes, three modeling scenarios were analyzed by means of Equation (24), particularly in terms of km traveled, service times, and waste collection points attended.
%   i m p r o v e m e n t = C u r r e n t   s t a t e   d a t a m o d e l   r e s u l t C u r r e n t   s t a t e   d a t a   100

3. Results and Discussion

3.1. Waste Production in the Study Area

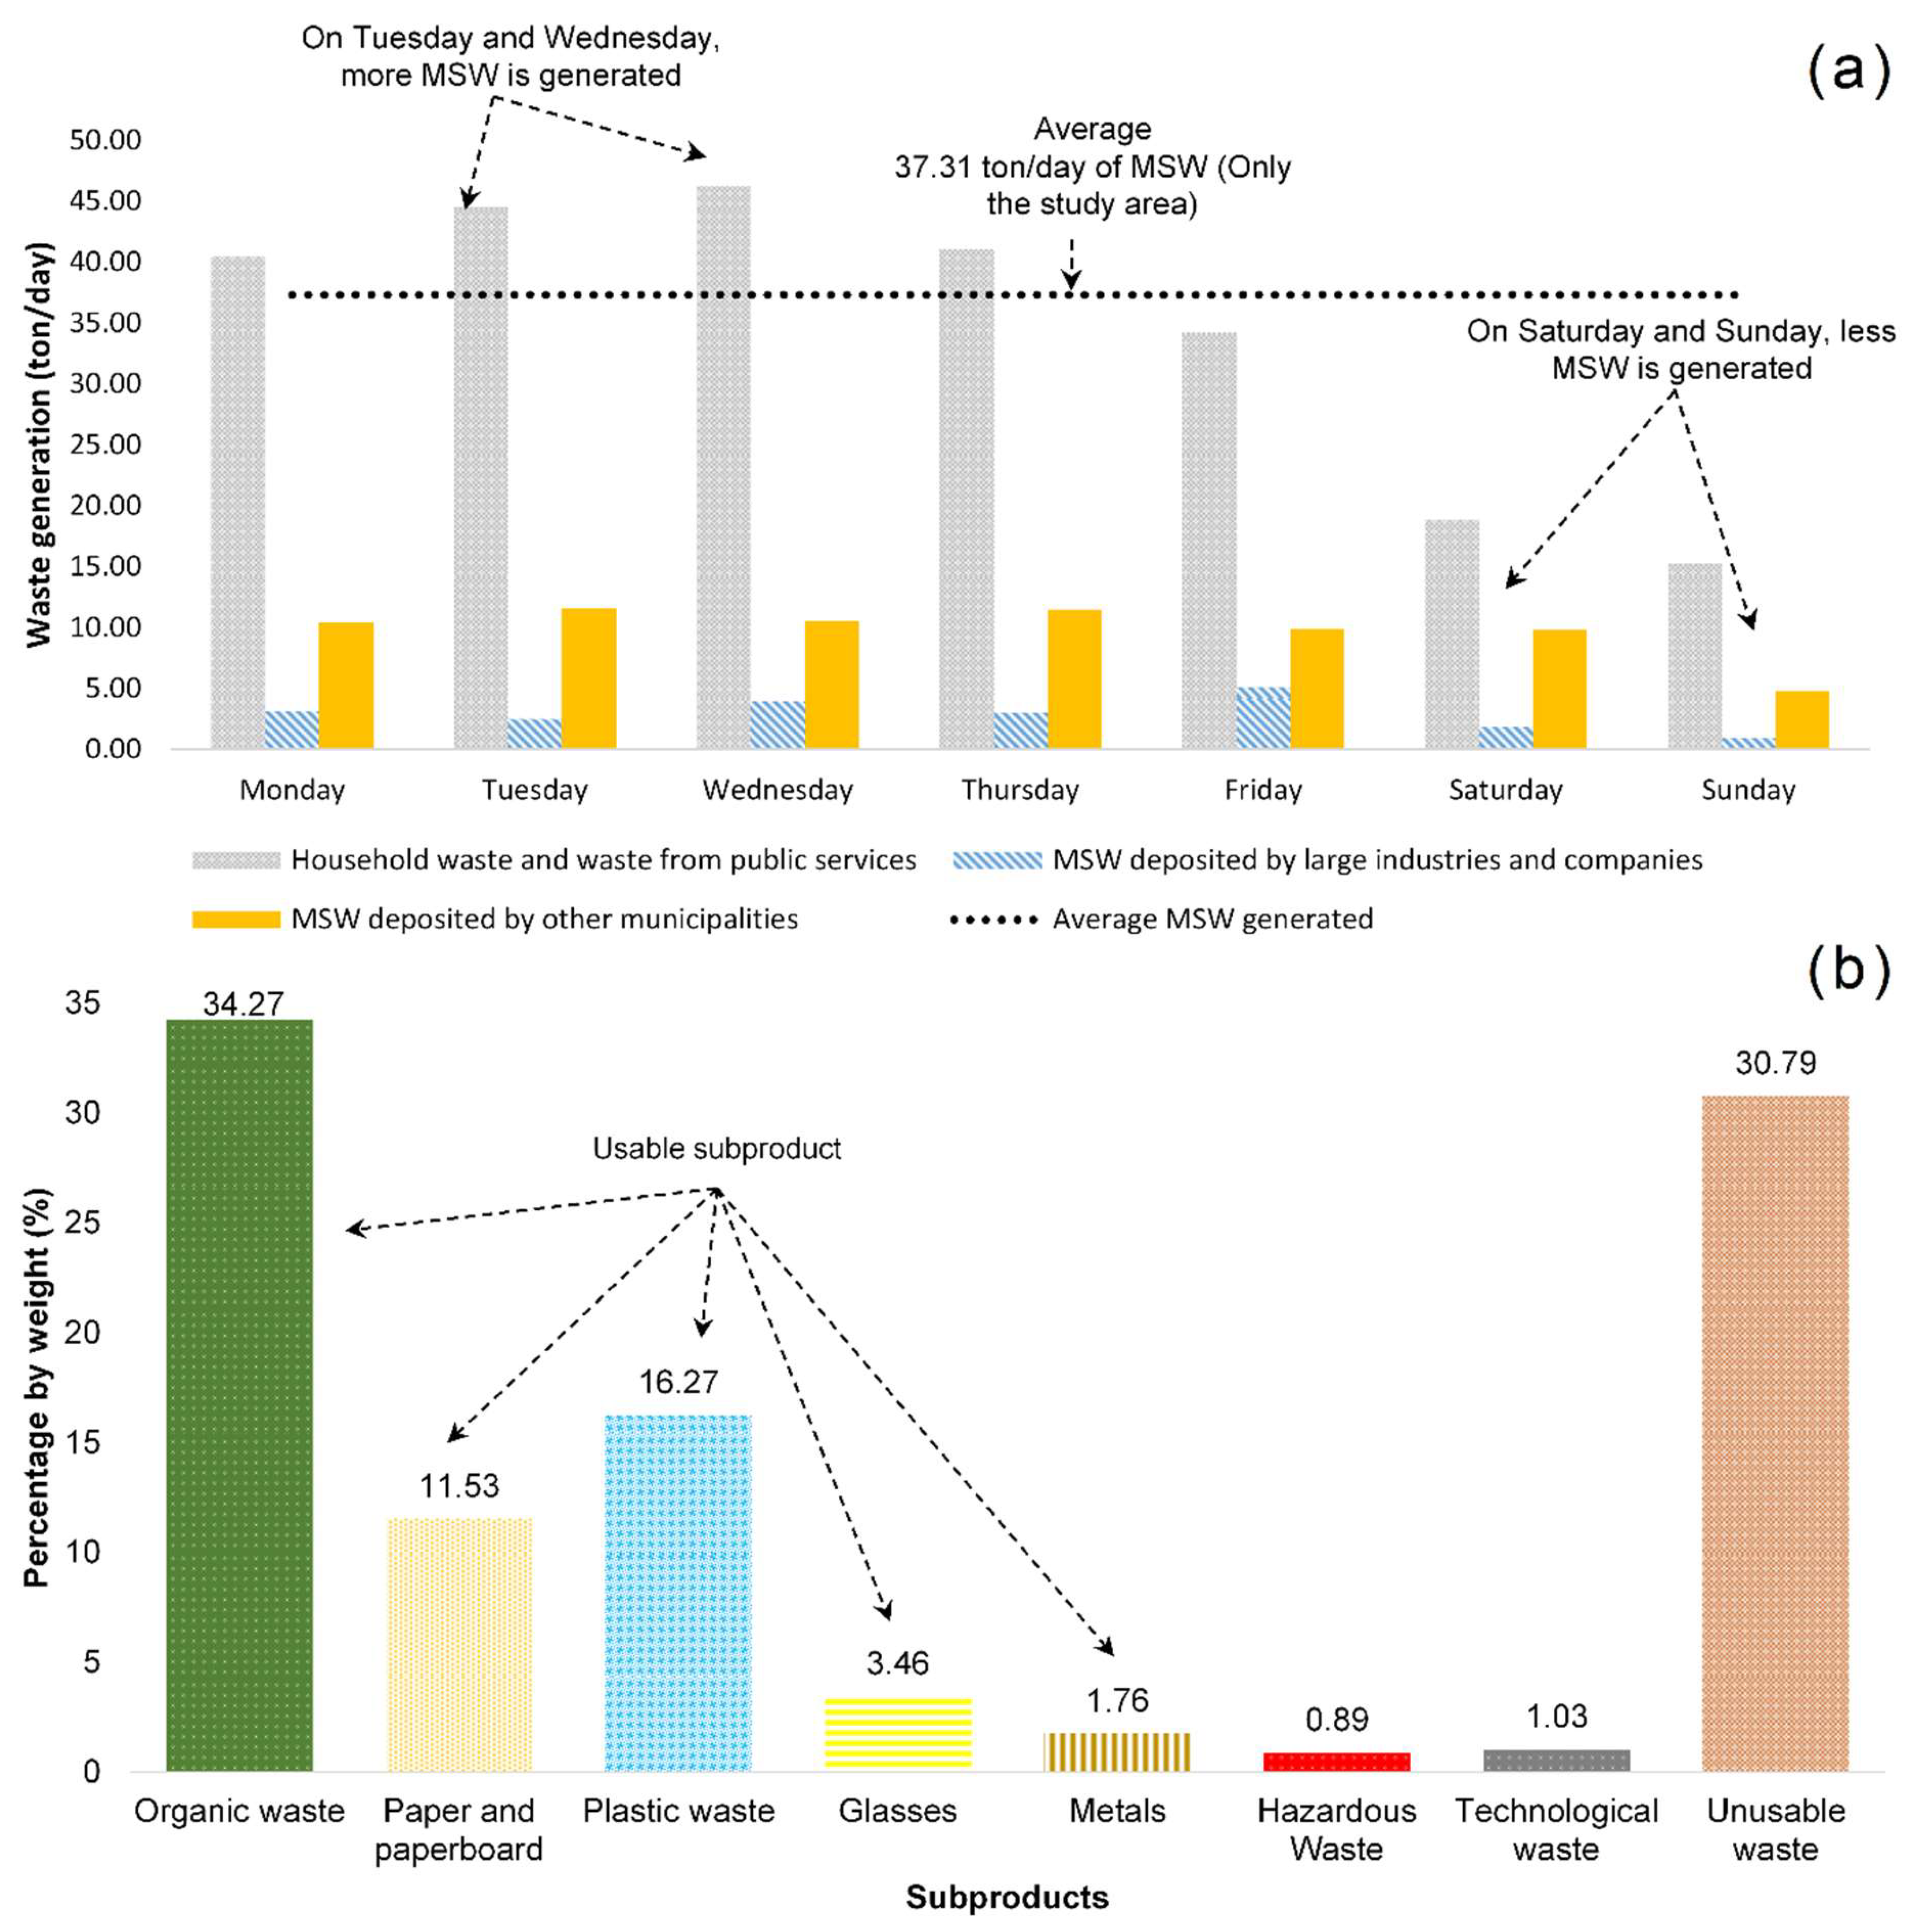
Through field work, it was determined that an average of 37.31 tons/day is currently generated in the study area, (equivalent to 0.832 kg/inhabitant-day with respect to a population of 44,829 inhabitants), of which 92.16% (34.38 tons/day) comes from household sources and public services, while 7.84% (2.93 tons/day) comes from commercial sources. The days of greatest waste generation and, therefore, of greatest activity of the collection service, are Tuesday and Wednesday (46.99 and 50.12 tons/day, respectively), while on Saturday and Sunday, the rates usually decrease (20.71 and 16.24 tons/day, respectively). In Araiza et al. [49], it was also found that the wastes generated in two nearby municipalities (Juárez and Pichucalco) arrive at the final disposal site of the study area, which causes variation in the generation and final disposal rates of the MSW. The average arrival rates of the MSW from other municipalities to the study area is around 9.78 tons/day. All this information can be seen in Figure 4a.
Figure 4b shows that the composition of the waste in the study area is mostly organic (34.27%). There was also the presence of byproducts that can be recycled, such as plastics, paper, metals, and glass (33.02%). If this waste is recycled, the useful life at the final disposal site can be increased, and the number of collection vehicles used can also be reduced. The volumetric weight of the waste was 217.43 kg/m3, which is high compared to what was determined in other similar works, such as in Araiza et al. [30] and Araiza et al. [50], with values lower than 170 kg/m3. The high volumetric weight determined in the field work is due to the humidity provided by the precipitation in the study area.

3.1.1. Analysis of Waste Collection Sectors and Their Characteristics

The variables used through Grouping Analysis were of great importance to define the clusters (sectors or collection areas), since there is currently no sectorization of the study area. The variable  G _ M S W  refers to the amount of waste produced in a sector. This variable is the most obvious to sectorize, but it is not the only one. The  E A P  and  P B A M  variables are socioeconomic variables. The  E A P  refers to the people who supply the available labor for the production of goods and services and who therefore produce MSW in the clusters. The  P B A M  refers to people who travel from one place to another (municipality to municipality) carrying with them different consumption patterns that alter the quantities of MSW generated in the sectors. The  E U C A  and  T I H  variables are related to the number of inhabited homes and economic units (businesses and services) existing in each of the sectors or collection areas, which are the elements that directly contribute to MSW generation. Finally, the  D M S  variable refers to the distance of the centroid of each sector with respect to the centroid of the municipal seat. The logic of this variable is that the closer a sector is to the municipal seat, the greater the benefits of the MSW collection service.
It is important to highlight that many of these variables have been used in MSW studies with satisfactory results. For example, Araiza [12] found that the  D M S  variable is crucial for the provision of collection and final disposal services, particularly the distance threshold of 20 km. Araiza et al. [51] and Kamdar et al. [52] also used socioeconomic variables such as Distances to Commerce and Industries, Land Uses, or Community Acceptance to locate final disposal sites. Finally, in the papers by Liu and Wu [53] and Araiza et al. [54], the most important socioeconomic variables related to MSW production were identified, thus highlighting the  P B A M  and other similar variables, such as gross domestic product per person and daily per capita income.
The results obtained by this multivariate technique in this work show that the study area can be clustered into three sectors with common characteristics. Of the six variables used to form the clusters, the  E A P  had the highest  R 2  value (0.8117), which means that it is the variable that to a greater extent allowed discrimination between sectors or collection areas, while the  E U C A  is the variable that provides less information to form sectors or collection areas, since its  R 2  value was the lowest (0.6298). The variables  T I H D M S , and  G _ M S W  also presented high values (0.8077, 0.7990, and 0.7936, respectively), so they are also important variables to form groupings (see Figure 5a,e).
Waste collection sector 1 is located entirely within the municipal seat of the study area. This group is made up of eight elements (polygons), which correspond to an urban block, where the socioeconomic dynamics are totally different from the rural area. In this sector, the variables  E A P T I H G _ M S W E U C A , and  P B A M  had the highest values compared to the other sectors. The  D M S  had the lowest values because, it is located in the municipal seat itself. The attention of this sector is a priority, since despite being relatively small (986.08 Ha), 50% of the total population of the study area resides here (see Figure 5b).
Waste collection sector 2 is made up of 18 elements (25,252.22 Ha), which were created using Thiessen polygons. In this group, the  D M S  variable had the highest value of the three sectors, which means that their locations are farther away from the municipal seat, and therefore, the coverage of the collection service may be low. Compared to the other sectors, the  E A P T I H G _ M S W E U C A , and  P B A M  had the lowest values, mainly because of the small number of inhabitants and their social dynamics that influence the production of MSW (see Figure 5c). In this sector, the homes are mainly located in scattered rural blocks.
Finally, Waste collection sector 3 is made up of 22 elements, which were also created using Thiessen polygons (17,217.36 Ha), therein having variables with values lower than sector 1 but higher than sector 2. This sector is also a priority, mainly because of its proximity to the municipal seat (3.87 km on average) (see Figure 5d).

3.1.2. Analysis of Waste Production Sources

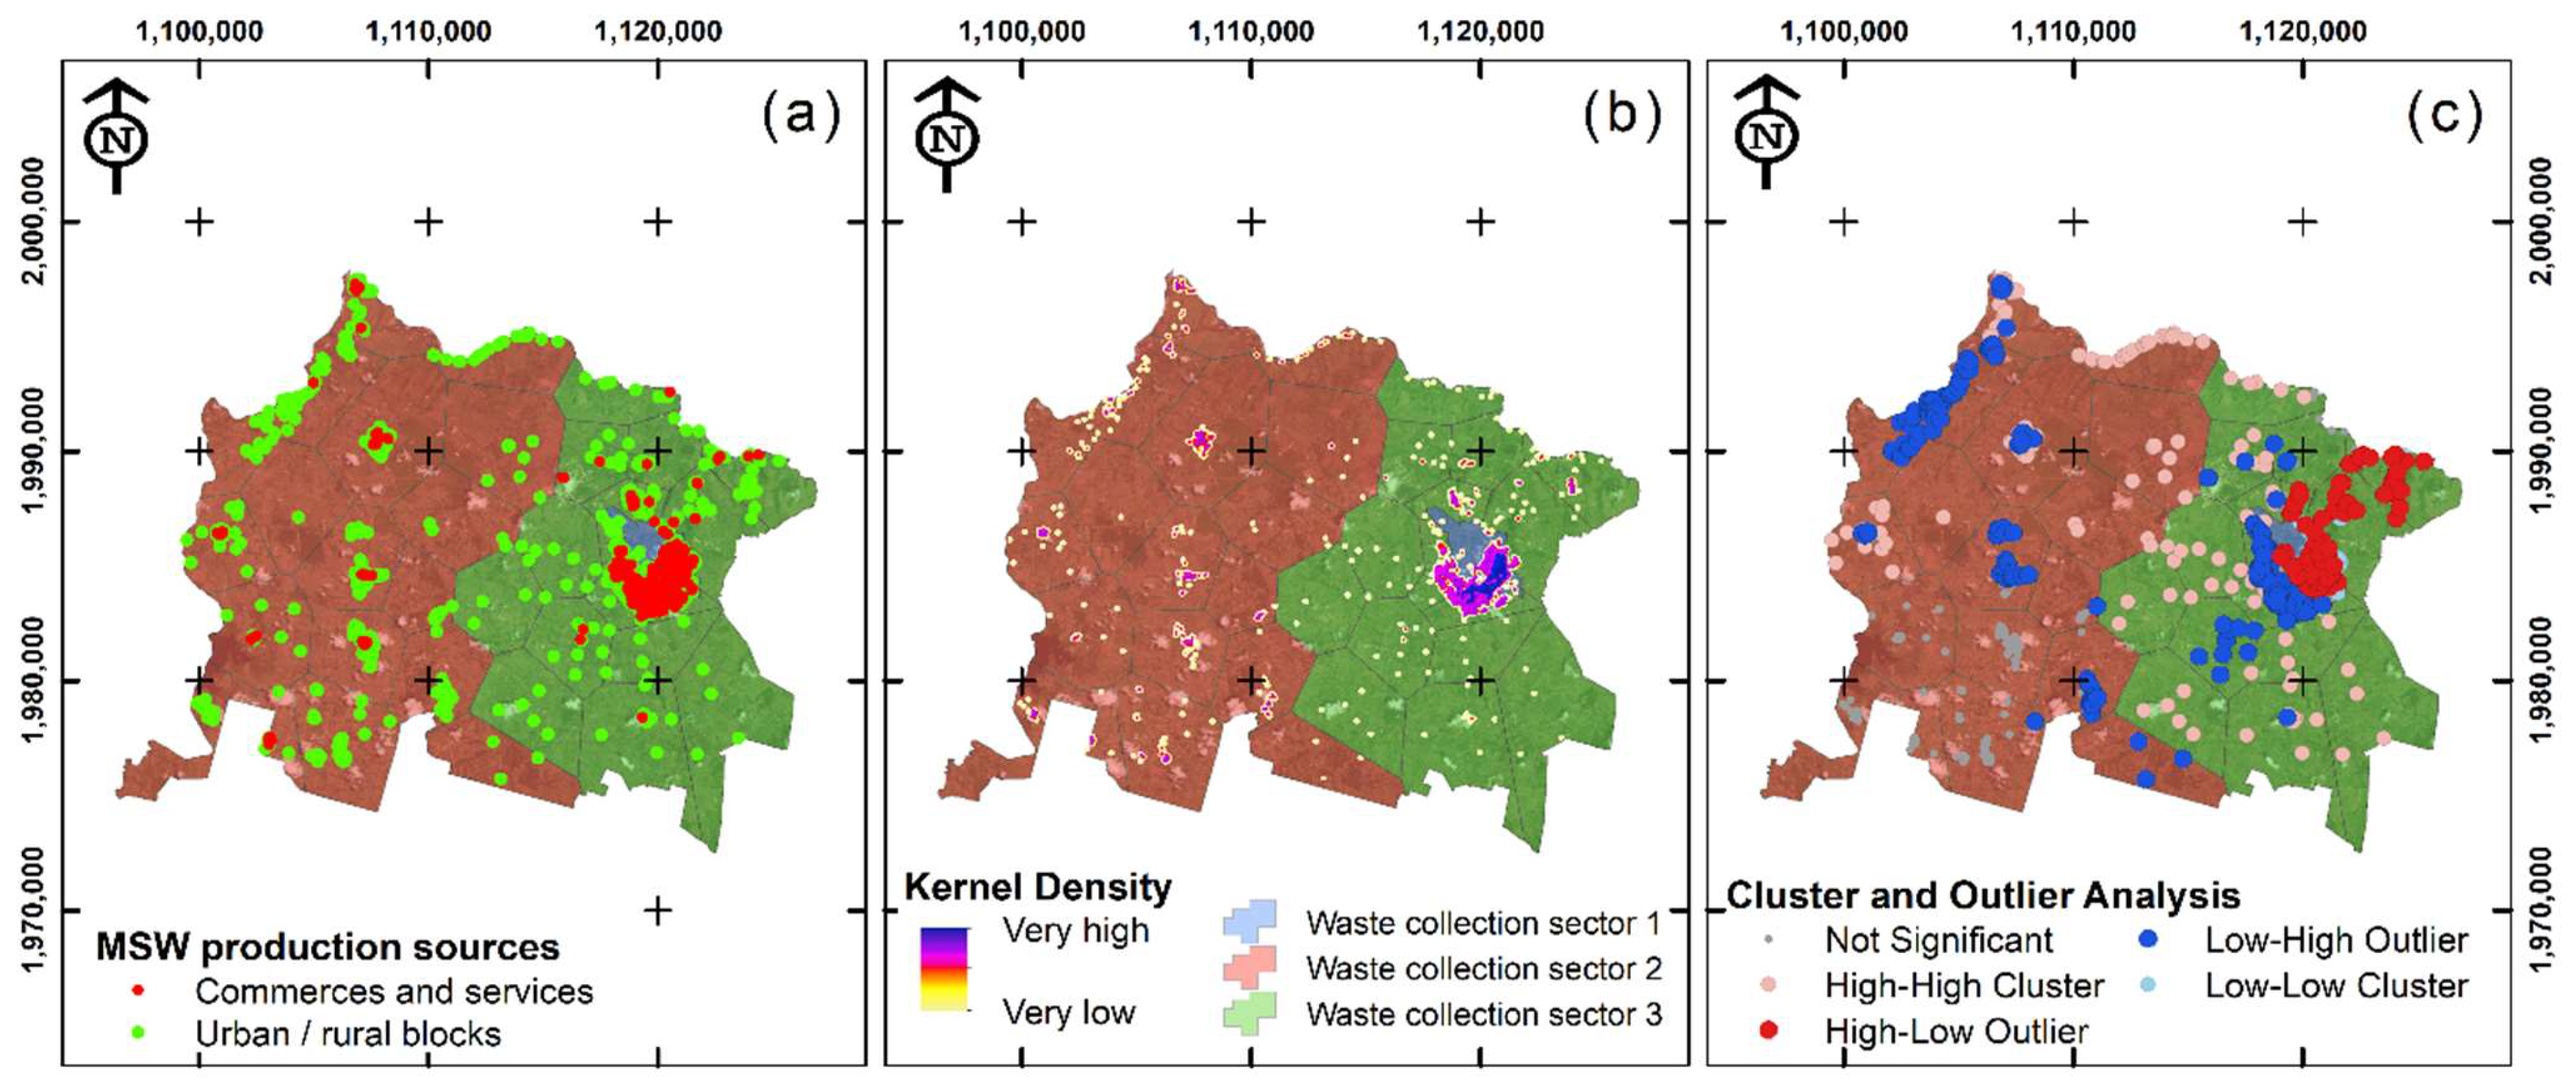
As previously indicated, domestic and commercial sources are the main generators of MSW in the study area, thus producing approximately 34.38 tons/day and 2.93 tons/day, respectively (92.16% and 7.84%, respectively). Household generation sources are usually houses located within urban or rural blocks, while commercial generation sources are businesses or establishments, such as schools, markets, commercial stores, etc. Urban blocks are located mainly in collection sector 1 (489 urban blocks), while rural blocks are more common in collection sectors 2 and 3 (107 and 301 urban blocks, respectively). Commercial sources are more prevalent in sector 1. All this information can be seen in Figure 6a.
Figure 6b shows the density analysis of the MSW generation sources. A high concentration is observed in collection sector 1, particularly in the central area, while in sectors 2 and 3, the concentration is very low. The distance between detected MSW production sources was 135 m, which means that, on average, an MSW production source has its closest neighbor at that distance.
Figure 6c shows the Cluster and Outlier Analysis (Anselin Local Moran’s I). MSW generation sources were categorized into four clusters based solely on the  G _ M S W  variable. The MSW generation sources were found to be statistically non-significant. In the municipal seat of the study area, particularly in the south and southwest of collection sector 1, there are statistically significant clusters with  G _ M S W  attributes having high values (HHs), which are equivalent to the MSW generation sources that have positive values in the Anselin Local Moran’s I index. In collection sector 3, there are also dispersed HH clusters, while in collection sector 2, they were found clustered to the east and north.
The low-low (LL) values, equivalent to MSW generation sources with positive values in the Anselin Local Moran’s I index but with  G _ M S W  attributes having low values, are concentrated to the east of collection sectors 1 and 2. Finally, the outliers with negative Anselin Local Moran’s I index values and neighboring entities with different values were found on the peripheries of the study area.

3.2. Provision of the Current Waste Collection Service

The study area has poor infrastructure to carry out the MSW collection service. They currently use two specialized trucks with a capacity of 15.29 m3 (20 yd3) and compaction systems, in addition to a 7 m3 dump truck. Each specialized vehicle makes two trips per day, while the dump truck makes one trip per day for a total of five trips, with travel times to the final disposal site ranging from 20 to 30 min, as well as average transportation speeds ranging between 30 and 40 km/h (for a loaded vehicle).
The collection is carried out mainly in the municipal capital and important localities, which are located in the previously defined waste collection sectors 1 and 3. Collection coverage or efficiencies vary between 50 and 80%, and they normally decrease as distances from the municipal seat increase. Waste collection sectors 2 and 3 are less covered because of the remoteness of the areas and the scarcity of collection vehicles.
The collection method commonly used in neighborhoods or subdivisions of urban or rural blocks is the fixed stop or corner method, while in central areas with high population and vehicular density, the sidewalk method is used. The  w c f  results are variable; for example, waste collection sectors 1 and 3 each have a wcf of 4.00, which is equivalent to a collection frequency of two times per week, while waste collection sector 2, on the other hand, has a very high  w c f  (7.50), which is equivalent to a collection frequency of once a week. The collection crews are made up of two or four people (driver and assistants), completing an 8 h work day (one work shift).
Waste collection sector 1 of the study area presents physical restrictions for waste collection, because it has narrow streets that limit vehicle travel. In waste collection sectors 2 and 3, this does not occur, but there are other problems, such as the existence of unpaved streets. It is important to indicate that the MSW generation sources in waste collection sector 1 are highly concentrated, while they are highly dispersed in sectors 2 and 3.

3.3. Proposal for MSW Collection in the Study Area

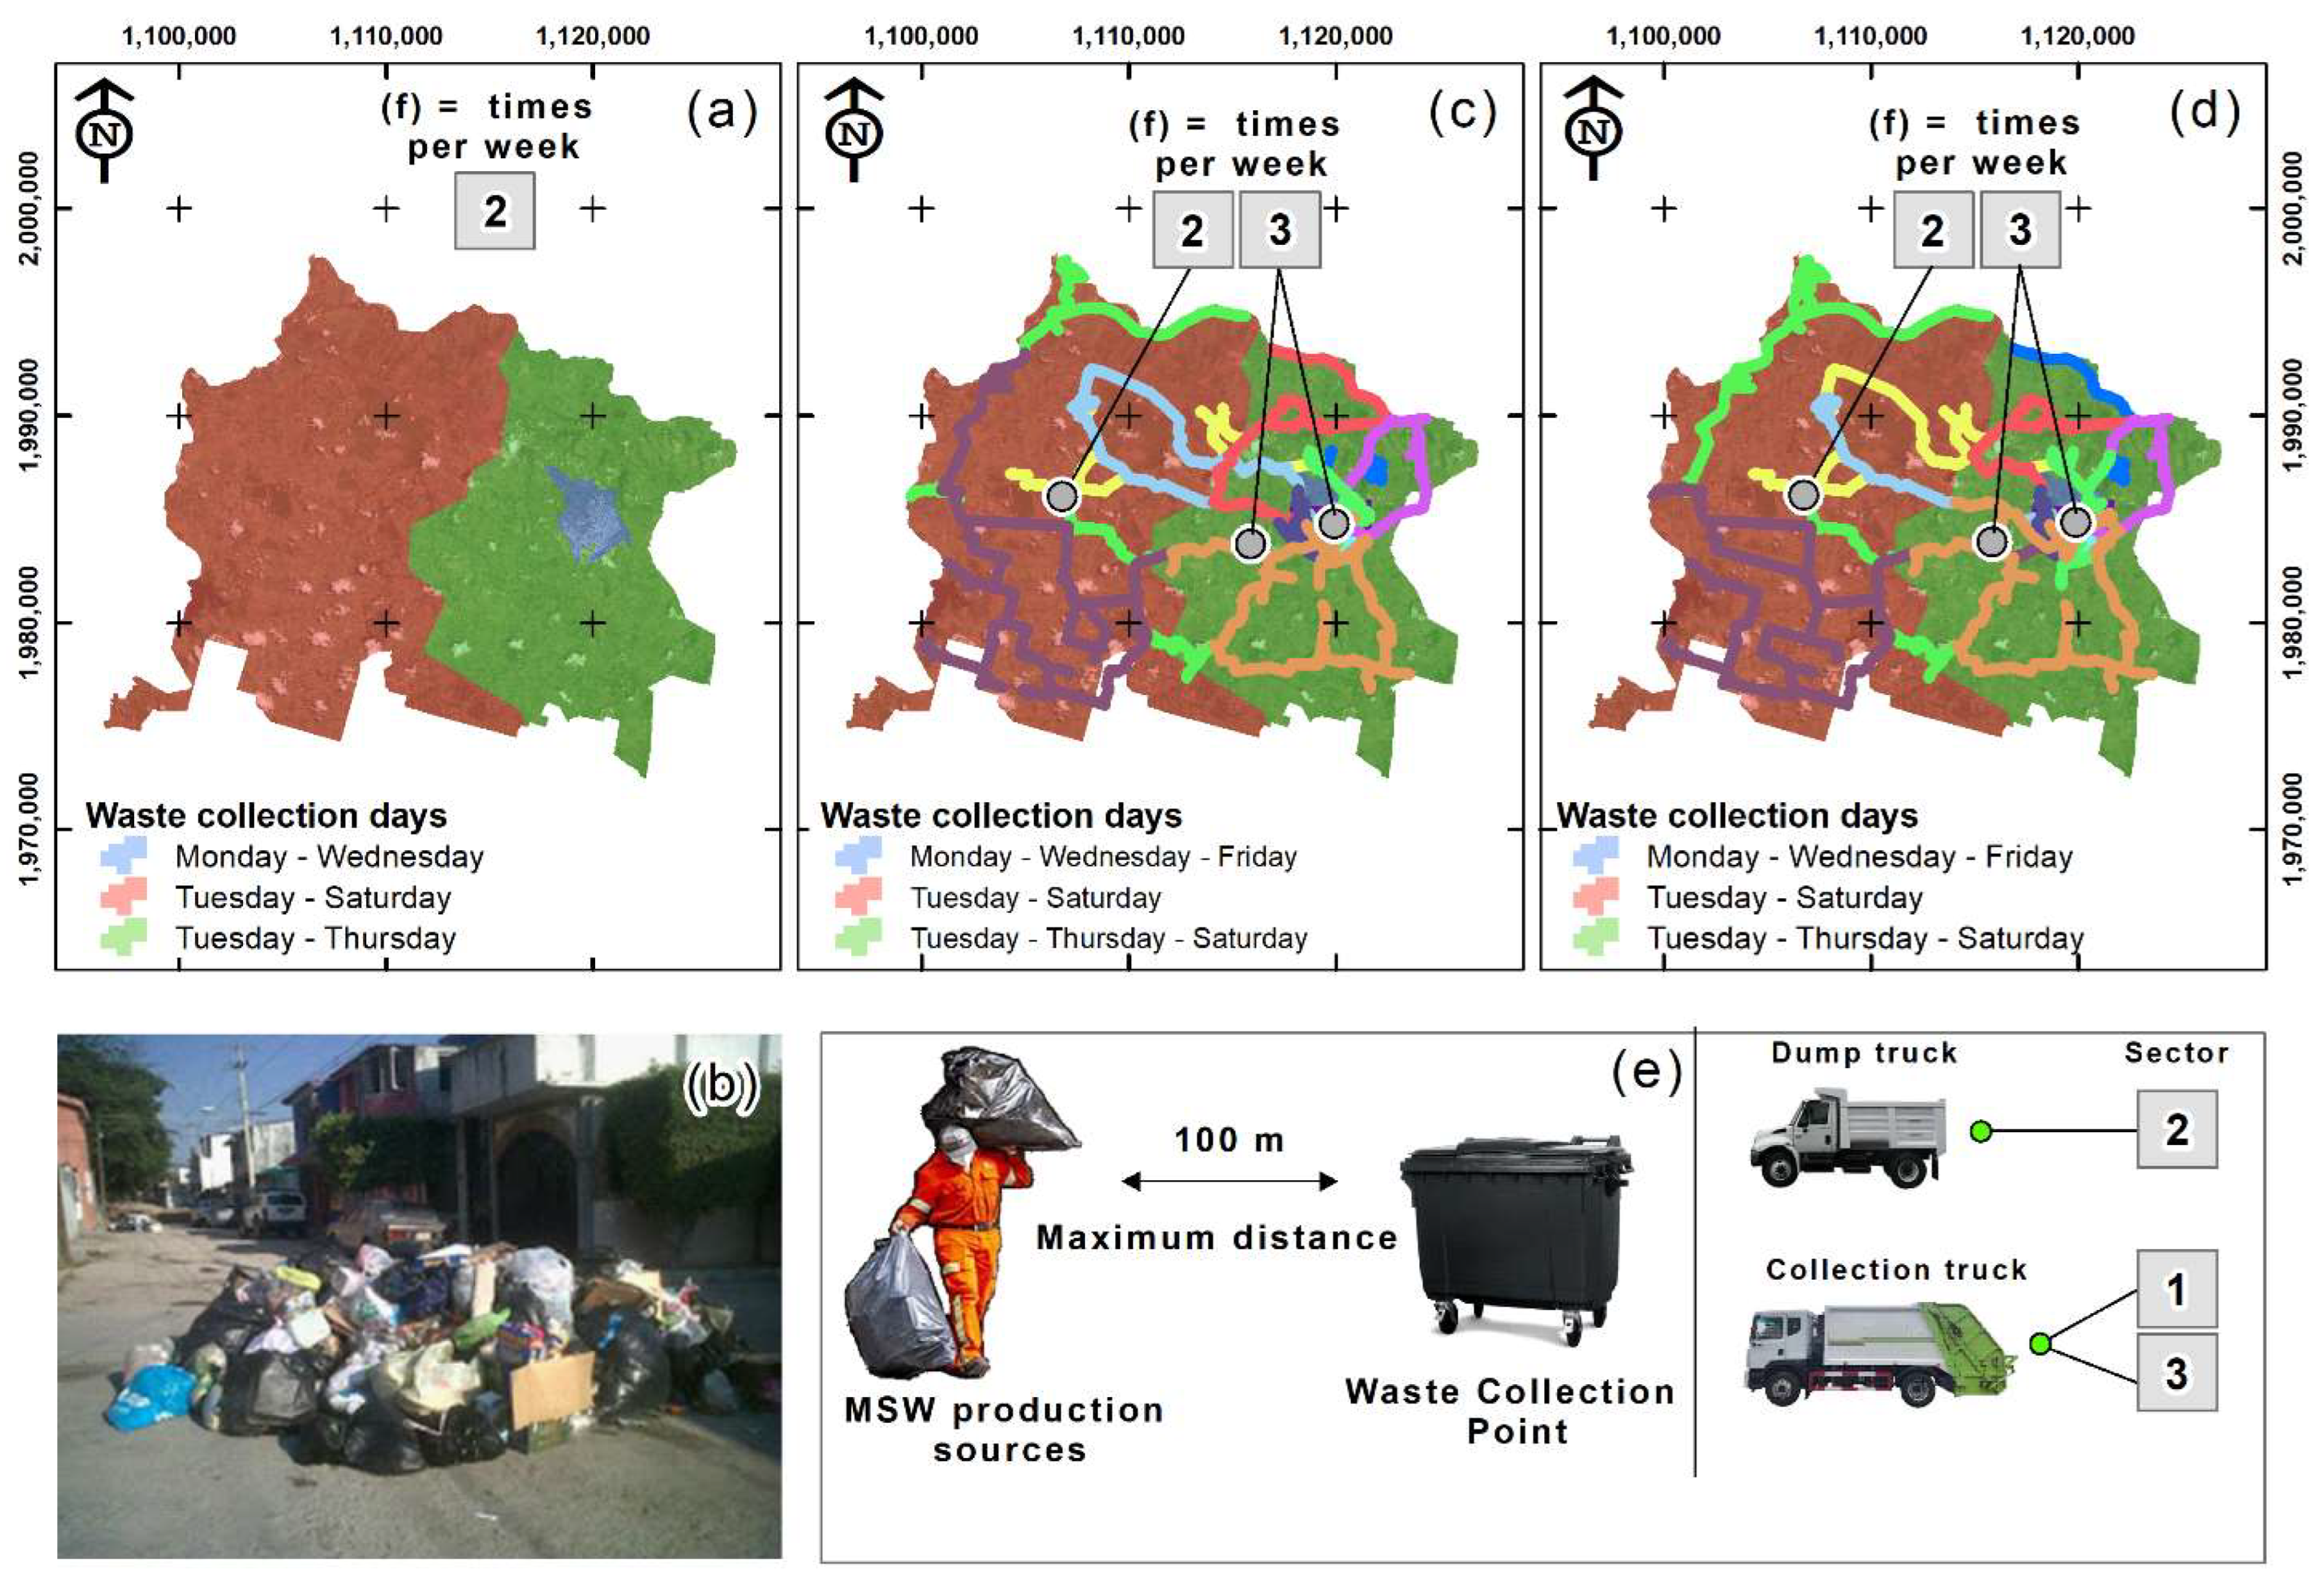
The proposal of this paper is based on using the previously defined waste collection sectors, and on providing waste collection service to all of them, using the number of current collection vehicles. Through the algorithms shown in the methodological section and also through the data collected in the field, three analysis scenarios were generated. Scenario 1 corresponds to the current situation previously described in Section 3.2 and shown in Figure 7a. In this scenario, 478 waste collection points are served. The average travel distance is 60.30 km (27.01 km in sector 1, 81.21 km in sector 2, and 72.68 km in sector 3), with an 8 h collection time, corresponding to one work shift. It is important to highlight that, in this scenario, waste is placed on street corners or even in the middle of the street (Figure 7b), which generates waste dispersion problems because of the action of wind or animals.
Scenario 2 was generated through Equations (21)–(23), as well as the “maximize coverage” location–allocation algorithm and vehicle route modeling in ArcGis 10.8 (Figure 7c). In this scenario, 557 waste collection points and three micro routes are proposed for sector 1, while 296 waste collection points and two micro routes are proposed for sector 2, and 367 waste collection points and two micro routes are proposed for sector 2. The average travel distance is 143.21 km (39.40 km in sector 1, 174.56 km in sector 2, and 215.67 km in sector 3), with an average collection time of 12.38 h (greater than one work shift).
Finally, scenario 3 was built using the location–allocation algorithm “minimize facilities”, as well as the vehicle route in ArcGis 10.8. Using these tools, the impedances (distances) were automatically minimized (Figure 7d). In this scenario, 294 waste collection points are proposed for sector 1, while 195 and 208 are proposed for sectors 2 and 3, respectively. The number of micro routes in this scenario did not vary with respect to that proposed in scenario 2, with an average travel distance of 100.00 km (33.76 km in sector 1, 162.42 km in sector 2, and 103.83 km in sector 3), and an average collection time of 9.66 h.
It is important to highlight that, in scenarios 2 and 3, the use of containers was proposed at each waste collection point, which can prevent the dispersion of waste and significantly improve the situation observed in scenario 1. Furthermore, in these scenarios, the travel distance from each waste production source to the closest waste collection point is no greater than 100 m, which means that the distance is relatively short for users (Figure 7e). Additionally, the collection frequencies were higher than those proposed in scenario 1, thus decreasing the  w c f  from 4.00 to 2.83 for sector 1 and 3, and from 7.5 to 4.00 for sector 2. In terms of improvement, scenario 3 gives the best results, thus minimizing the distances (by 24.38% compared to scenario 2) and average travel times (by 21.74% compared to scenario 2) and offering a greater attention to each waste collection point compared to scenario 2 (by 45% on average). Scenario 1, despite having shorter travel distances and shorter service times, delivers results that are worse than scenarios 2 and 3, because it proposes a very low collection coverage and an underutilization of the collection vehicles. All this information can be seen in Table 2.
The optimization carried out in this work through GIS tools can contribute to reduced costs and possible environmental impacts in the study area. The results obtained are similar to those reported in other works, such as Malakahmad et al. [55], Das and Bhattacharyya [56], and Singh and Agrawal [57], which showed that planning collection routes with GIS tools can reduce between 22 and 30% of both the total length of the waste collection path and the time spent. The use of GIS tools also optimizes waste collection points. For example, in Vijay et al. [58] and López et al. [59], GIS tools were used both to reduce the number and to determine the most precise location in terms of reducing the time for users.

4. Limitations and Comments

This work proposes to optimize the current MSW collection system in the study area. The proposed actions can even be replicated in nearby municipalities or towns; however, to have a correct operation, it will be necessary to consider the following topics:
  • According to Araiza [12], in Chiapas, Mexico, there are currently several municipalities that lack local laws and regulations regarding MSW management, so the development of such regulatory mechanisms should be promoted.
  • Although this work produces information about the urban population served by the waste collection service, about the lengths traveled by each collection truck, and about the service times associated with waste collection, there is still a lack of many other data that do not allow us to analyze aspects related to the efficiency, quality, and costs of waste collection services. For this reason, it will be necessary to promote the development of a greater number of studies to collect more information.
  • MSW containers are not currently used in the study area due to costs but also due to the lack of knowledge about the benefits of using these temporary MSW storage methods. For this reason, it will be necessary to create economic instruments such as the payment of fees to allow the purchase and replacement of these implements. Additionally, environmental education talks should be given to both the general population and waste management workers about the efficient use and benefits of these containers.
  • The technical principles of this work can be applicable to several municipalities in the state of Chiapas, Mexico, and other states of the Mexican Republic, as well as other Latin countries, not only due to similarities in socioeconomic characteristics but also due to the similarity in the use of the MSW collection infrastructure used. However, certain adaptations must be made to consider variants such as patterns of urban settlements, narrow or unpaved streets, and others.

5. Conclusions

In this paper, a proposal was presented to improve the MSW collection service in the municipality of Reforma, in Chiapas, Mexico. Specific field work was developed, and various spatial analysis techniques were applied in the GIS environment. Firstly, the work carried out allowed us to obtain information on the sources of MSW generation in the study area and on the operation of the current waste collection service, which is characterized by the underutilization of the current infrastructure, poor maintenance, and low collection coverage.
On the other hand, the analysis in the GIS environment allowed us not only to observe the spatial behavior of MSW generation sources but also to create waste collection scenarios, which can be useful for decision making. It is important to highlight that, although it is true that the use of GIS technology can be expensive for small- or medium-sized towns, it offers enormous benefits in the design of macro and micro routes, as it minimizes calculation times and costs, avoids biases, and favors an increased coverage of the collection service. In this paper, such improvements ranged from 21.74% to 24.38% in terms of the minimization of distances and average travel times, respectively (compared to other scenarios).
Finally, it is worth commenting that waste management projects should always involve citizen participation to improve collection schedules, establish new waste collection points, and implement waste separation practices at home. This approach may also directly impact consumption habits and behaviors related to waste generation.

Author Contributions

Conceptualization, J.A.A.-A.; methodology, J.A.A.-A. and H.A.N.-A.; investigation, R.F.G.-H.; writing—original draft preparation, C.M.G.-L.; writing—review and editing, M.N.R.-V. All authors have read and agreed to the published version of the manuscript.

Funding

This research received no external funding.

Data Availability Statement

The data used for this research are available upon request to the corresponding author.

Conflicts of Interest

The authors declare no conflicts of interest.

References

  1. Akhtar, M.; Hannan, M.; Begum, R.; Basri, H.; Scavino, E. Backtracking search algorithm in CVRP models for efficient solid waste collection and route optimization. Waste Manag. 2017, 61, 117–128. [Google Scholar] [CrossRef]
  2. Jaunich, M.; Levis, J.; DeCarolis, J.; Barlaz, M.; Bartelt-Hunt, S.; Jones, E.; Jaikumar, R. Characterization of municipal solid waste collection operations. Resour. Conserv. Recycl. 2016, 114, 92–102. [Google Scholar] [CrossRef]
  3. Hoornweg, D.; Bhada-Tata, P. What A Waste: A Global Review of Solid Waste Management; Urban Development Series; World Bank: Washington, DC, USA, 2012; p. 98. [Google Scholar]
  4. Owolabi, S.; Mmereki, D.; Baldwin, A.; Li, B. A comparative analysis of solid waste management in developed, developing and lesser developed countries. Environ. Technol. Rev. 2016, 5, 120–141. [Google Scholar] [CrossRef]
  5. Rızvanoğlu, O.; Kaya, S.; Ulukavak, M.; Yeşilnacar, M. Optimization of municipal solid waste collection and transportation routes, through linear programming and geographic information system: A case study from Şanlıurfa, Turkey. Environ. Monit. Assess. 2020, 192, 9. [Google Scholar] [CrossRef]
  6. Tavares, G.; Zsigraiova, Z.; Semiao, V.; Carvalho, M. Optimisation of MSW collection routes for minimum fuel consumption using 3D GIS modelling. Waste Manag. 2009, 29, 1176–1185. [Google Scholar] [CrossRef] [PubMed]
  7. Martinho, G.; Gomes, A.; Santos, P.; Ramos, M.; Cardoso, J.; Silveira, A.; Pires, A. A case study of packaging waste collection systems in Portugal—Part I: Performance and operation analysis. Waste Manag. 2017, 61, 96–107. [Google Scholar] [CrossRef] [PubMed]
  8. Tallentire, C.; Steubing, B. The environmental benefits of improving packaging waste collection in Europe. Waste Manag. 2020, 103, 426–436. [Google Scholar] [CrossRef] [PubMed]
  9. Bernstad, A.; Jansen, J. Separate collection of household food waste for anaerobic degradation—Comparison of different techniques from a systems perspective. Waste Manag. 2012, 32, 806–815. [Google Scholar] [CrossRef]
  10. Coffey, M.; Coad, A. Collection of Municipal Solid Waste in Developing Countries; United Nations Human Settlements Programme (UN HABITAT): Nairobi, Kenya, 2010; p. 200. Available online: https://unhabitat.org/collection-of-municipal-solid-waste-in-developing-countries-2 (accessed on 10 June 2023).
  11. Abarca, L.; Maas, G.; Hogland, W. Solid waste management challenges for cities in developing countries. Waste Manag. 2013, 33, 220–232. [Google Scholar] [CrossRef]
  12. Araiza-Aguilar, J.A. Spatial Modeling of the Sanitary-Ecological Risk, Derived from the Poor Management of Municipal Solid Waste, in the Municipalities of the Cuenca del Cañon del Sumidero, Chiapas. Ph.D. Thesis, National Autonomous University of México, Mexico City, Mexico, 2019; 136p. Available online: https://repositorio.unam.mx/contenidos/3471779 (accessed on 10 June 2023).
  13. Hannan, M.; Lipu, M.; Akhtar, M.; Begum, R.; Al Mamun, M.; Hussain, A.; Mia, M.; Basri, H. Solid waste collection optimization objectives, constraints, modeling approaches, and their challenges toward achieving sustainable development goals. J. Clean. Prod. 2020, 277, 123557. [Google Scholar] [CrossRef]
  14. Carranza, O.; Antón, F. A Continuous Approximation Model for Vehicle Routing in Solid Waste Management Systems. Investig. Oper. 1999, 8, 109–153. [Google Scholar]
  15. Rodrigues, S.; Martinho, G.; Pires, A. Waste collection systems. Part A: A taxonomy. J. Clean. Prod. 2016, 113, 374–387. [Google Scholar] [CrossRef]
  16. Araiza, J.; José, M. Mejora del servicio de recolección de residuos sólidos urbanos empleando herramientas SIG: Un caso de estudio. Ingeniería 2015, 19, 118–128. [Google Scholar]
  17. Lella, J.; Mandla, V.; Zhu, X. Solid waste collection/transport optimization and vegetation land cover estimation using Geographic Information System (GIS): A case study of a proposed smart-city. Sustain. Cities Soc. 2017, 35, 336–349. [Google Scholar] [CrossRef]
  18. Singh, A. Remote sensing and GIS applications for municipal waste management. J. Environ. Manag. 2019, 242, 22–29. [Google Scholar] [CrossRef] [PubMed]
  19. Rybova, K.; Burcin, B.; Slavik, J. Spatial and non-spatial analysis of socio-demographic aspects influencing municipal solid waste generation in the Czech Republic. Detritus 2018, 1, 3–7. [Google Scholar] [CrossRef]
  20. Mahmood, S.; Sharif, F.; Rahman, A. Analysis and forecasting of municipal solid waste in Nankana City using geo-spatial techniques. Environ. Monit. Assess. 2018, 190, 275. [Google Scholar] [CrossRef]
  21. Khorsandi, H.; Faramarzi, A.; Aghapour, A.; Jafari, S. Landfill site selection via integrating multi-criteria decision techniques with geographic information systems: A case study in Naqadeh, Iran. Environ. Monit. Assess. 2019, 191, 730. [Google Scholar] [CrossRef]
  22. Damasceno, I.; Ennes, R.; de Almeida, T.; Zandonadi, L.; Contreras, F. Allocation of sanitary landfill in consortium: Strategy for the Brazilian municipalities in the State of Amazonas. Environ. Monit. Assess. 2019, 191, 39. [Google Scholar] [CrossRef]
  23. Ağacsapan, B.; Cabuk, S. Determination of suitable waste transfer station areas for sustainable territories: Eskisehir case. Sustain. Cities Soc. 2020, 52, 101829. [Google Scholar] [CrossRef]
  24. Amal, L.; Son, L.; Chabchoub, H.; Lahini, H. Analysis of municipal solid waste collection using GIS and multi-criteria decision aid. Appl. Geomat. 2020, 12, 193–208. [Google Scholar] [CrossRef]
  25. Fennonato, N.; Preziosi, G.; Gorritty, M.; Guisbert, E.; Torretta, V. Assessment of municipal solid waste selective collection scenarios with geographic information systems in Bolivia. Waste Manag. 2020, 102, 919–931. [Google Scholar] [CrossRef]
  26. Kinobe, J.; Bosona, T.; Gebresenbet, G.; Niwagaba, C.; Vinnerås, B. Optimization of waste collection and disposal in Kampala city. Habitat. Int. 2015, 49, 126–137. [Google Scholar] [CrossRef]
  27. INEGI. National Institute of Statistic and Geography. Population and Housing Census 2020: Tabulated. 2020. Available online: https://www.inegi.org.mx/programas/ccpv/2020/#tabulados (accessed on 10 June 2023).
  28. CEIEG. State Committee of Statistics and Geographical Information. Municipal Profiles—Reforma, Chiapas. 2023. Available online: https://www.ceieg.chiapas.gob.mx/perfiles/Inicio (accessed on 23 January 2023).
  29. Racero, J.; Eguía, I.; García, J.; Villa, G. Modeling for the design of routes in an urban solid waste collection system. In Proceedings of the II International Conference on Industrial Engineering and Industrial Management, Burgos, Spain, 3–5 September 2008. [Google Scholar]
  30. Araiza, J.; Chávez, J.; Moreno, J.; Rojas, M. Municipal Solid Waste Management in a Municipality of Chiapas, Mexico. Soc. Sci. 2017, 6, 133–140. [Google Scholar] [CrossRef]
  31. Mexican Standard NMX-AA-015-1985; Environmental Protection—Soil Pollution—Municipal Solid Waste—Sampling—Quartering Method. General Directorate of Standards. SECOFI, Secretariat of Commerce and Industrial Development: Mexico City, Mexico, 1985. (In Spanish)
  32. Mexican Standard NMX-AA-019-1985; Environmental Protection—Soil Pollution—Municipal Solid Waste—Volumetric Weight “In Situ”. General Directorate of Standards. SECOFI, Secretariat of Commerce and Industrial Development: Mexico City, Mexico, 1985. (In Spanish)
  33. Mexican Standard NMX-AA-022-1985; Environmental Protection—Soil Pollution—Municipal Solid Waste—Selection and Quantification of Sub-Products. General Directorate of Standards. SECOFI, Secretariat of Commerce and Industrial Development: Mexico City, Mexico, 1985. (In Spanish)
  34. Araiza, J.; Chávez, J.; Moreno, J. Quantification of municipal solid waste generated in the municipal seat of Berriozabal, Chiapas. Rev. Int. Contam. Ambie 2017, 33, 691–699. [Google Scholar] [CrossRef]
  35. SEDESOL. Secretariat of Social Development. Handbook for the Design of Municipal Solid Waste Collection Routes; SEDESOL—Undersecretary of Urban Development and Housing: Mexico City, Mexico, 1997; p. 50. [Google Scholar]
  36. ESRI, Environmental Systems Research Institute. Grouping Analysis. 2023. Available online: https://desktop.arcgis.com/en/arcmap/latest/tools/spatial-statistics-toolbox/grouping-analysis.htm (accessed on 23 January 2023).
  37. Benitez, R. Global Optimization of the Urban Solid Waste Collection System for the Layout of Robust Routes in the Monterrey Metropolitan Area. Ph.D. Thesis, Autonomous University of Nuevo León—Faculty of Chemical Sciences, Nuevo León, México, 2021; 93p. Available online: http://eprints.uanl.mx/22985/ (accessed on 10 June 2023).
  38. Silverman, B. Density Estimation for Statistics and Data Analysis; Chapman & Hall: London, UK; New York, NY, USA, 1986; 175p. [Google Scholar]
  39. Anselin, L. Local Indicators of Spatial Association—LISA. Geogr. Anal. 1995, 27, 93–115. [Google Scholar] [CrossRef]
  40. ESRI, Environmental Systems Research Institute. How Cluster and Outlier Analysis (Anselin Local Moran’s I) Works. 2023. Available online: https://desktop.arcgis.com/es/arcmap/latest/tools/spatial-statistics-toolbox/h-how-cluster-and-outlier-analysis-anselin-local-m.htm (accessed on 23 January 2023).
  41. INEGI, National Institute of Statistic and Geography. Marco Geoestadístico con Censo de Población y Vivienda 2020. 2023. Available online: https://www.inegi.org.mx/app/biblioteca/ficha.html?upc=889463807469 (accessed on 23 January 2023).
  42. ESRI, Environmental Systems Research Institute. Location-Allocation Analysis. 2023. Available online: https://desktop.arcgis.com/en/arcmap/10.5/extensions/network-analyst/location-allocation.htm#ESRI_SECTION1_F8182D9F421E4EA4AEE11E7B360E1340 (accessed on 23 January 2023).
  43. Church, R.; ReVelle, C. The maximal covering location problem. Pap. Reg. Sci. 1974, 32, 101–118. [Google Scholar] [CrossRef]
  44. Toregas, C.; Swain, R.; ReVelle, C.; Bergman, L. The location of emergency service facilities. Oper. Res. 1971, 19, 1363–1373. [Google Scholar] [CrossRef]
  45. Marianov, V.; ReVelle, C. The Queuing Probabilistic Location Set Covering Problem and Some Extensions. Socio-Econ. Plan. Sci. 1994, 28, 167–178. [Google Scholar] [CrossRef]
  46. Rajagopalan, H.; Saydam, C.; Xiao, J. A multiperiod set covering location model for dynamic redeployment of ambulances. Comput. Oper. Res. 2008, 35, 814–826. [Google Scholar] [CrossRef]
  47. ESRI. Environmental Systems Research Institute. Dijkstra’s Algorithm. 2023. Available online: https://desktop.arcgis.com/es/arcmap/latest/extensions/network-analyst/algorithms-used-by-network-analyst.htm#GUID-D50336EC-7FBA-43FA-AD31-4272AB544393 (accessed on 23 January 2023).
  48. SEDESOL. Secretariat of Social Development. Technical Handbook on Generation, Collection and Transfer of Municipal Solid Waste; SEDESOL—Undersecretary of Urban Development and Housing: Mexico City, Mexico, 1996; p. 139. [Google Scholar]
  49. Araiza, J.; Rojas, M.; Nájera, H.; Gutiérrez, R.; García, C. Analysis of a Municipal Solid Waste Disposal Site: Use of Geographic Information Technology Tools for Decision Making. Int. J. Geo-Inf. 2023, 12, 280. [Google Scholar] [CrossRef]
  50. Araiza, J.; López, C.; Ramírez, N. Municipal solid waste management: Case study in Las Margaritas, Chiapas. AIDIS J. Eng. Environ. Sci. Res. Dev. Pract. 2015, 8, 299–311. [Google Scholar]
  51. Araiza, J.; Nájera, H.; Gutiérrez, R.; Rojas, M. Emplacement of solid waste management infrastructure for the Frailesca region, Chiapas, México, using GIS tools. Egypt. J. Remote Sens. Space Sci. 2018, 21, 391–399. [Google Scholar] [CrossRef]
  52. Kamdar, I.; Ali, S.; Bennui, A.; Techato, K.; Jutidamrongphan, W. Municipal solid waste landfill siting using an integrated GIS-AHP approach: A case study from Songkhla, Thailand. Resour. Conserv. Recycl. 2019, 149, 220–235. [Google Scholar] [CrossRef]
  53. Liu, C.; Wu, X. Factors influencing municipal solid waste generation in China: A multiple statistical analysis study. Waste Manag. Res. 2010, 29, 371–378. [Google Scholar] [CrossRef]
  54. Araiza, J.; Rojas, M.; Aguilar, R. Forecast generation model of municipal solid waste using multiple linear regression. Glob. J. Environ. Sci. Manag. 2020, 6, 1–14. [Google Scholar] [CrossRef]
  55. Malakahmad, A.; Bakri, P.; Radin, M.; Mokhtar, M. Solid waste collection routes optimization via GIS techniques in Ipoh city, Malaysia. Procedia Eng. 2014, 77, 20–27. [Google Scholar] [CrossRef]
  56. Das, W.; Bhattacharyya, B. Optimization of municipal solid waste collection and transportation routes. Waste Manag. 2015, 43, 9–18. [Google Scholar] [CrossRef]
  57. Singh, N.; Agrawal, A.K. Route Optimization for Municipal Solid Waste Collection using ArcGIS Application in Gwalior City, Madhya Pradesh. Int. J. Res. Appl. Sci. Eng. Technol. 2018, 6, 392–398. [Google Scholar] [CrossRef]
  58. Vijay, R.; Gupta, A.; Kalamdhad, A.; Devotta, S. Estimation and allocation of solid waste to bin through geographical information systems. Waste Manag. Res. 2005, 23, 479–484. [Google Scholar] [CrossRef]
  59. López, J.V.; Aguilar, M.; Fernandez, S.; Jimenez, A. Optimizing the collection of used paper from small businesses through GIS techniques: The Legane’s case (Madrid, Spain). Waste Manag. 2008, 28, 282–293. [Google Scholar] [CrossRef] [PubMed]
Figure 1. Study area.
Urbansci 08 00095 g001
Figure 2. Analysis of solid waste in the field: (a) waste composition; (b) volumetric weights; (c) waste generation rates based on vehicle characteristics.
Urbansci 08 00095 g002
Figure 3. Current collection system in Reforma, Chiapas: (a) type of collection vehicle; (b) characteristics of the roads.
Urbansci 08 00095 g003
Figure 4. MSW generated in the municipality of Reforma, Chiapas: (a) generation of MSW per day; (b) composition of MSW.
Urbansci 08 00095 g004
Figure 5. Grouping Analysis of the study area: (a) statistical summary of variables; (b) statistical summary of sector 1; (c) statistical summary of sector 2; (d) statistical summary of sector 3; (e) sectorization of the study area.
Urbansci 08 00095 g005
Figure 6. Analysis of MSW generation sources: (a) types of sources; (b) kernel density; (c) Cluster and Outlier.
Urbansci 08 00095 g006
Figure 7. MSW collection proposals: (a) collection scenario 1 (current situation); (b) waste deposit on street corners in scenario 1; (c) collection scenario 2 that maximizes coverage; (d) collection scenario 3 that minimizes facilities; (e) travel distance for user in scenario 3 and infrastructure to be used.
Urbansci 08 00095 g007
Table 1. Waste collection frequencies.
Frequency (f)Days of Normal Waste AccumulationDays of Peak Waste Accumulation w c f   = 7 n ; 1 + 7 n  1
6 times per week12[1.17 to 2.17]
3 times per week23[2.33 to 3.33]
2 times per week34[3.50 to 4.50]
1 time per week67[7.00 to 8.00]
1 High  w c f values are equivalent to low collection frequencies, while low  w c f values are the opposite.
Table 2. Summary of waste collection service indicators.
Route IndicatorsScenario 1Scenario 2Scenario 3
Sector 1Sector 2Sector 3Sector 1Sector 2Sector 3Sector 1Sector 2Sector 3
Waste generation sources2382.00483.00516.002382.00483.00516.002382.00483.00516.00
Collection trucks in use3.001.002.003.002.002.003.002.002.00
Operational shifts1.001.001.002.002.002.002.002.002.00
Micro routes3.002.003.003.002.003.003.002.003.00
Average collection time on route (h)8.008.008.0011.9512.4112.810.659.658.69
Distance traveled (km/route)27.0181.2172.6839.40174.56215.6733.76162.42103.83
Collection times at waste collection point (min)5.005.005.003.003.003.005.005.005.00
Waste collection point by sector235.0098.00146.00557.00296.00449.00294.00195.00208.00
Number of trips per day (trips/day)2.002.002.004.002.003.004.002.003.00
Waste collection point per trip 118.0049.0073.0046.0074.0079.0025.0049.0035.00
MSW collected (tons/day)20.081.945.83125.103.888.3325.13.888.33
Improvement of collected waste (%)---25.00 1100.00 142.86 125.00 1100.00 142.86 1
Improvement of service times (%)------10.88 222.24 232.11 2
Improvement of distances traveled (%)------14.31 26.95 251.86 2
Improvement of waste collection points (%)------47.22 234.12 253.67 2
1 The improvement is with respect to scenario 1; 2 The improvement is with respect to scenario 2.
Disclaimer/Publisher’s Note: The statements, opinions and data contained in all publications are solely those of the individual author(s) and contributor(s) and not of MDPI and/or the editor(s). MDPI and/or the editor(s) disclaim responsibility for any injury to people or property resulting from any ideas, methods, instructions or products referred to in the content.