
Assessing Pedestrian Network Continuity: Insights from Panama City’s Context
 ,
,  ,
,
Abstract
:1. Introduction
Literature Review
2. Materials and Methods
- (i)
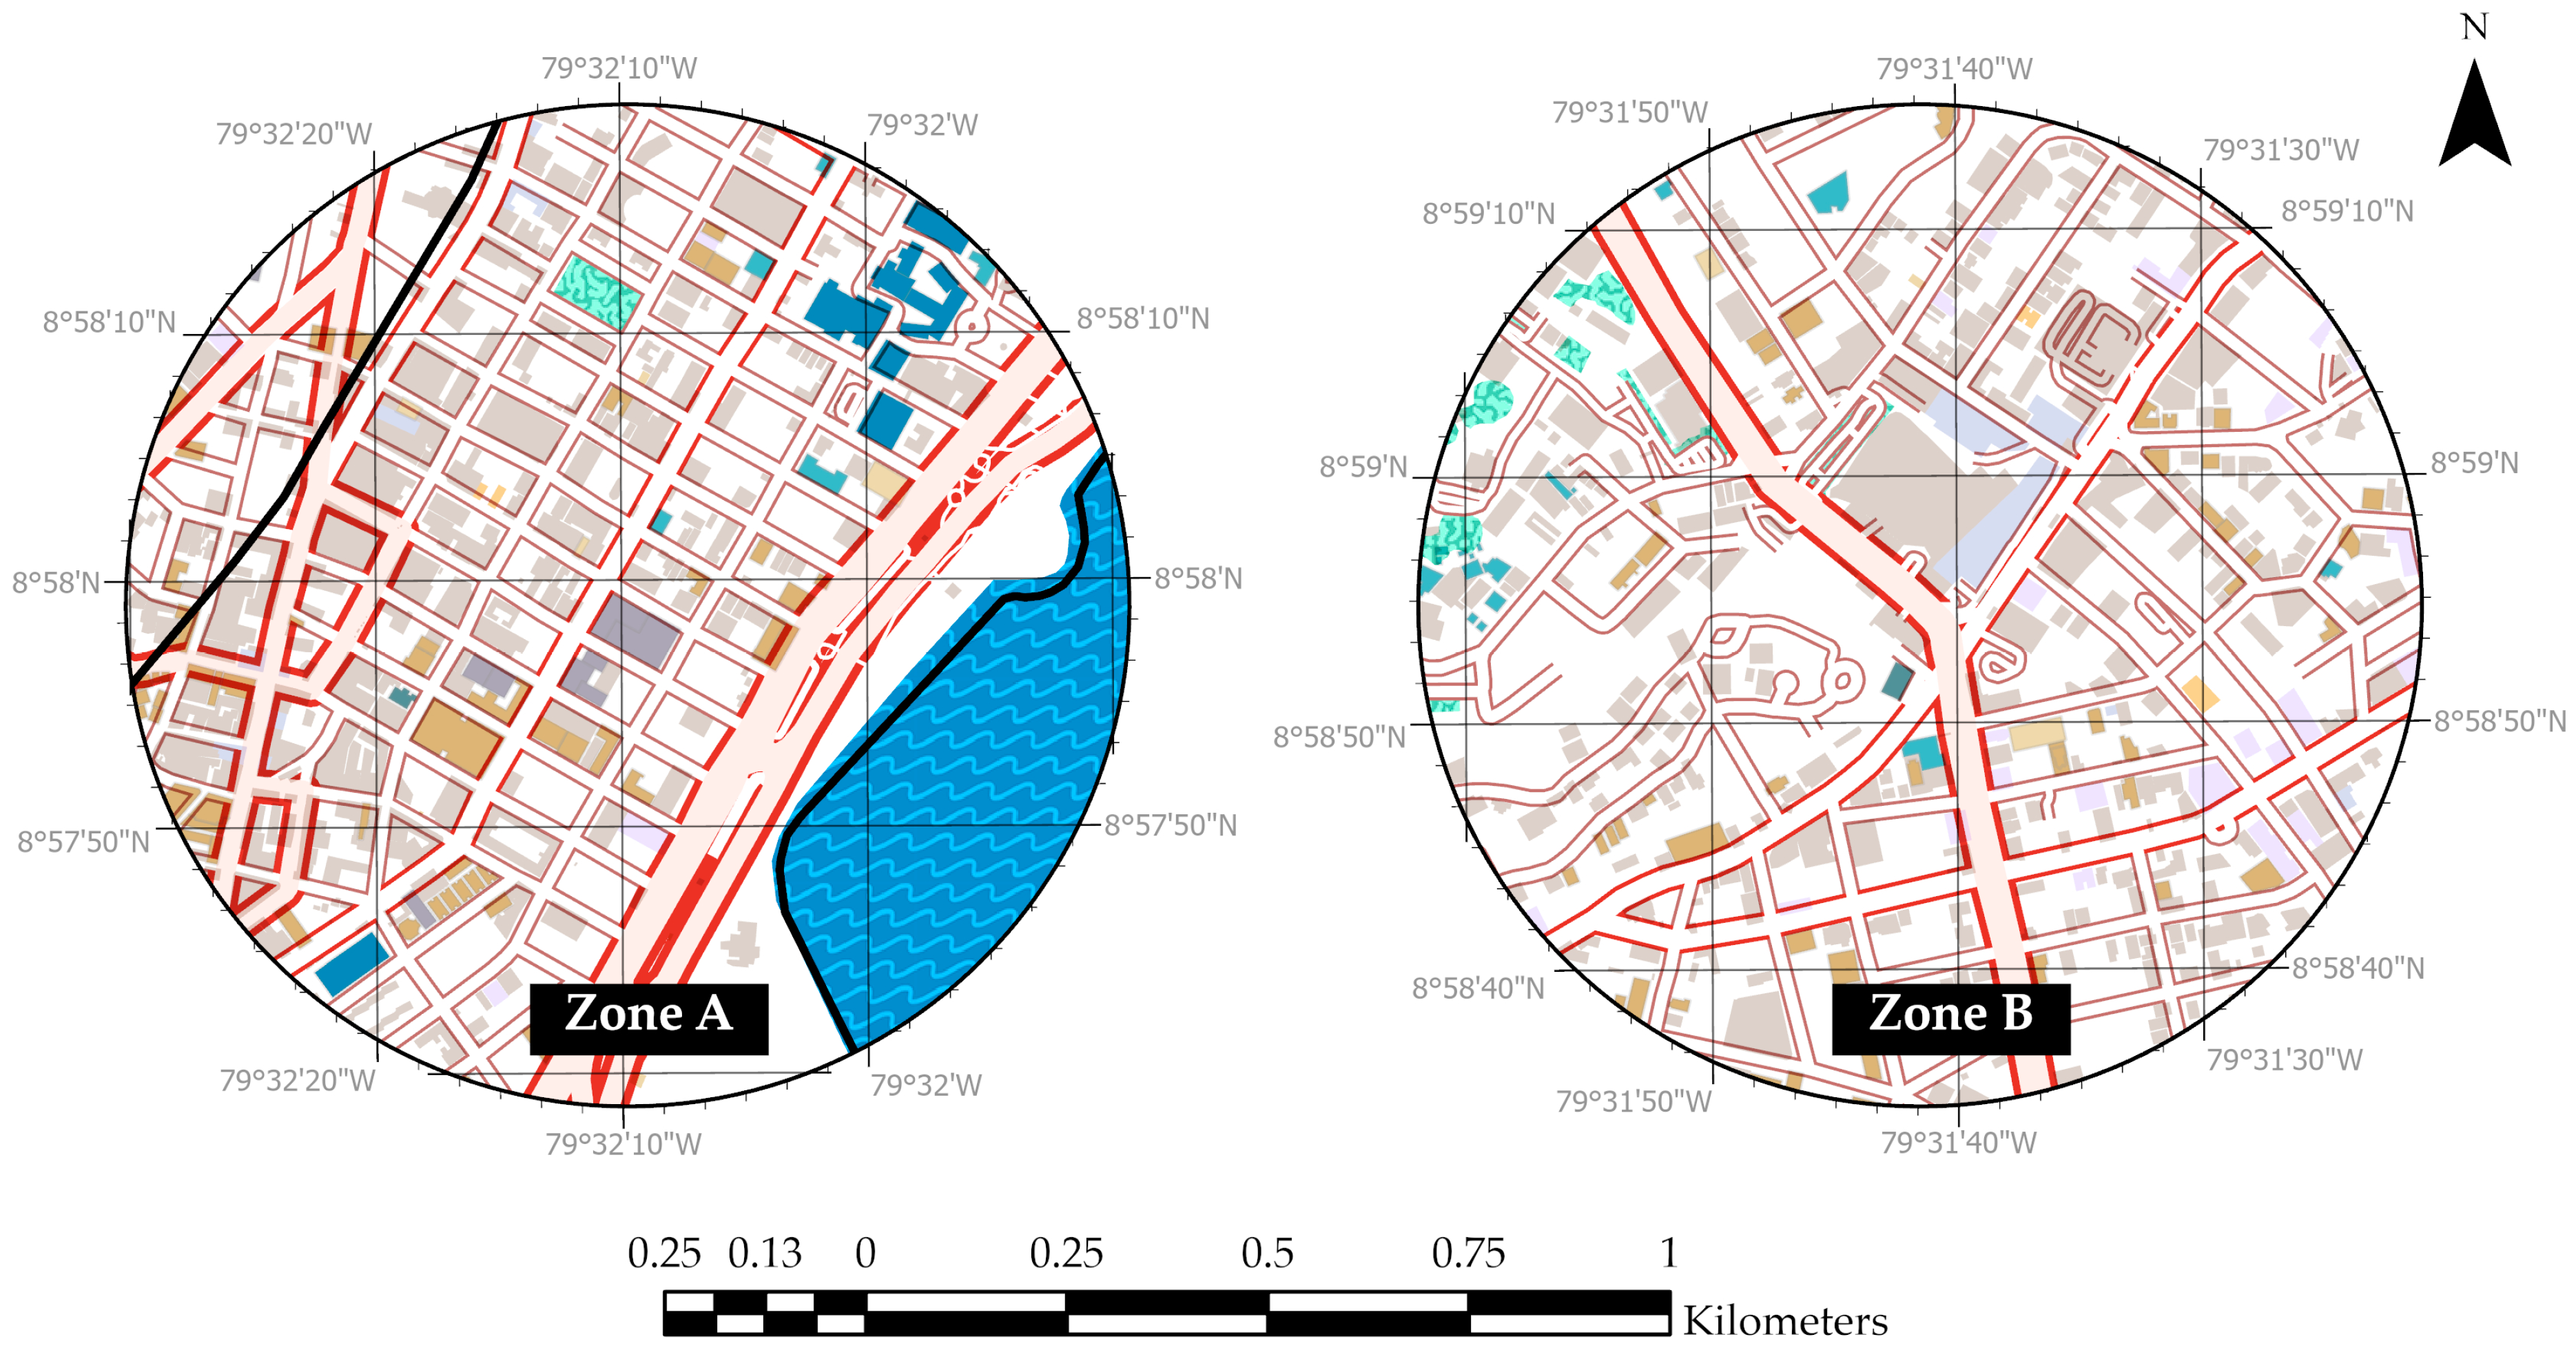
- The research divides the study area of Panama City into two zones.
- (ii)
- The data collection process involves the construction of the pedestrian network, the classification of continuity and discontinuity types, and the mapping of urban elements. This collected information was stored and mapped in GIS.
- (iii)
- The process includes a physical audit to validate the elements used in the construction and classification of the network, as well as the location of urban elements.
- (iv)
- Pedestrian continuity and the spatial distribution of urban elements are analyzed using GIS geoprocessing tools and statistical techniques.
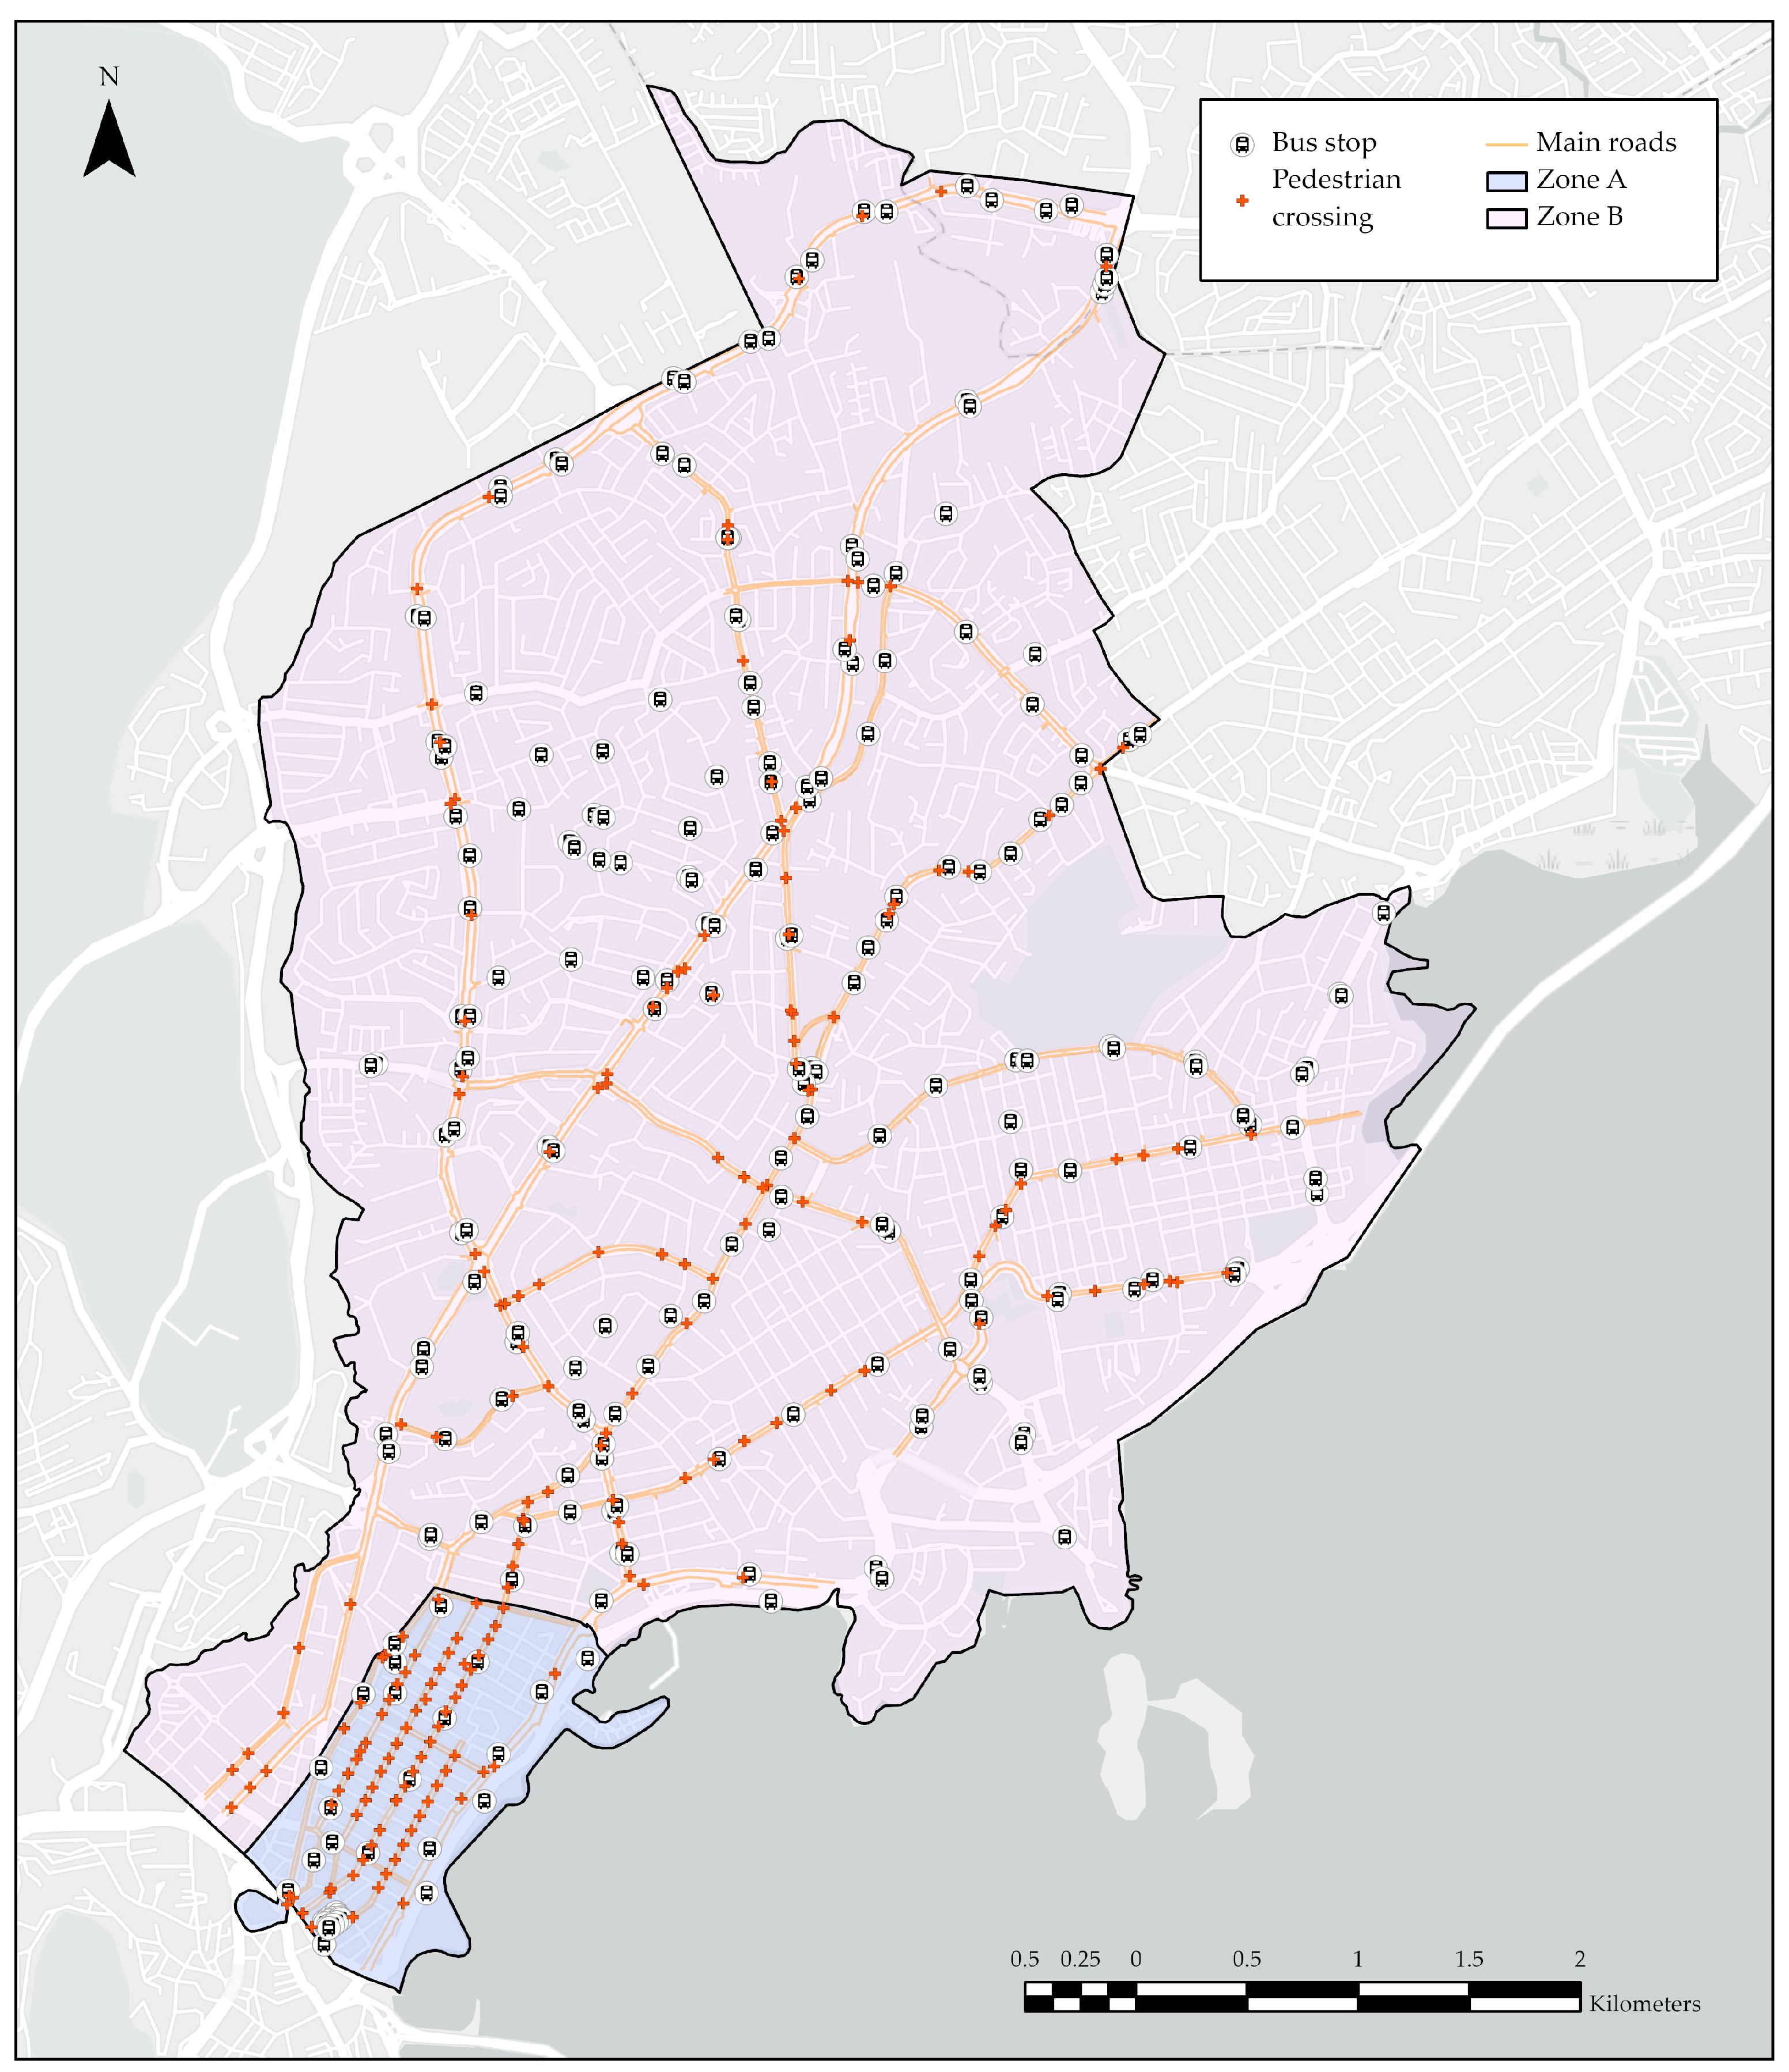
2.1. Study Area
2.1.1. Zone A
2.1.2. Zone B
2.2. Data Collection
2.2.1. Pedestrian Continuity Data Collection
- (i)
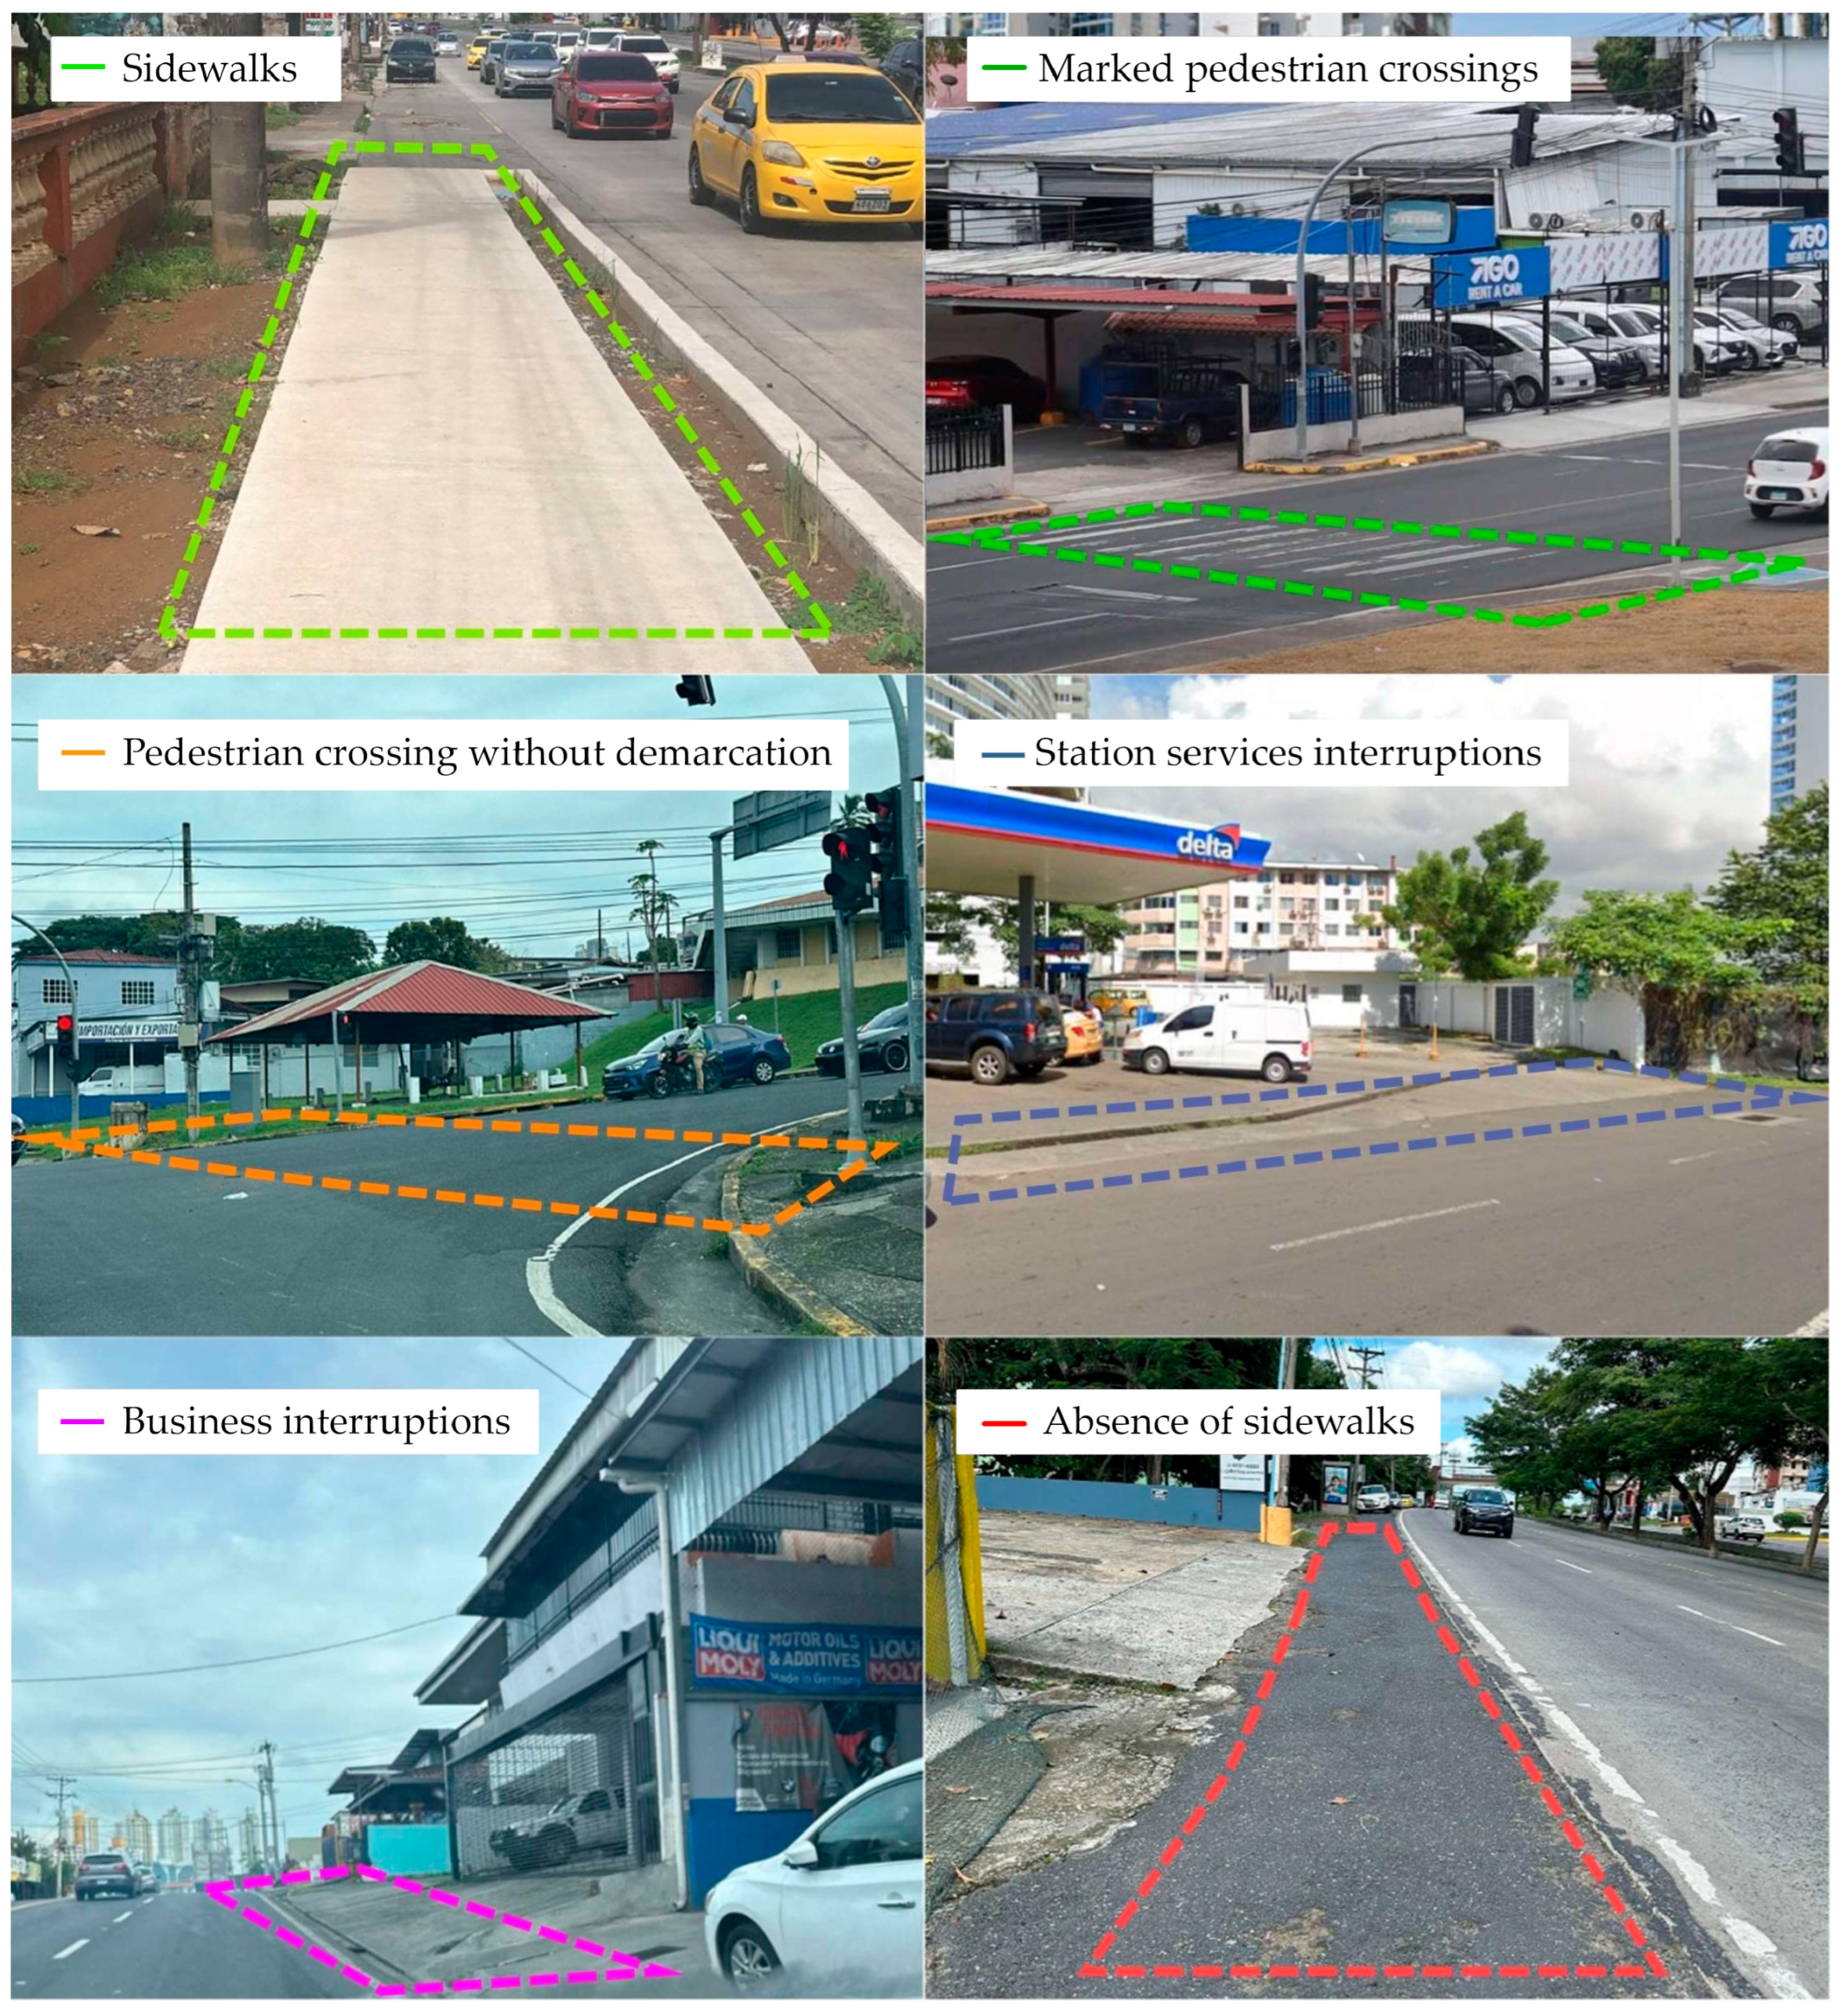
- Sidewalks that are well-maintained and free of abrupt elevation changes or permanent obstructions, allowing a smooth pathway for pedestrians.
- (ii)
- Marked pedestrian crossings, as described by [7], which are formal crossings within the pedestrian network identified by visible horizontal signage. These crossings guide pedestrian movement using elements such as zebra crossings or pelican crossings; however, the latter is not commonly found in Panama City. Additionally, formal crossings may include those regulated by traffic lights and pedestrian bridges.
- (iii)
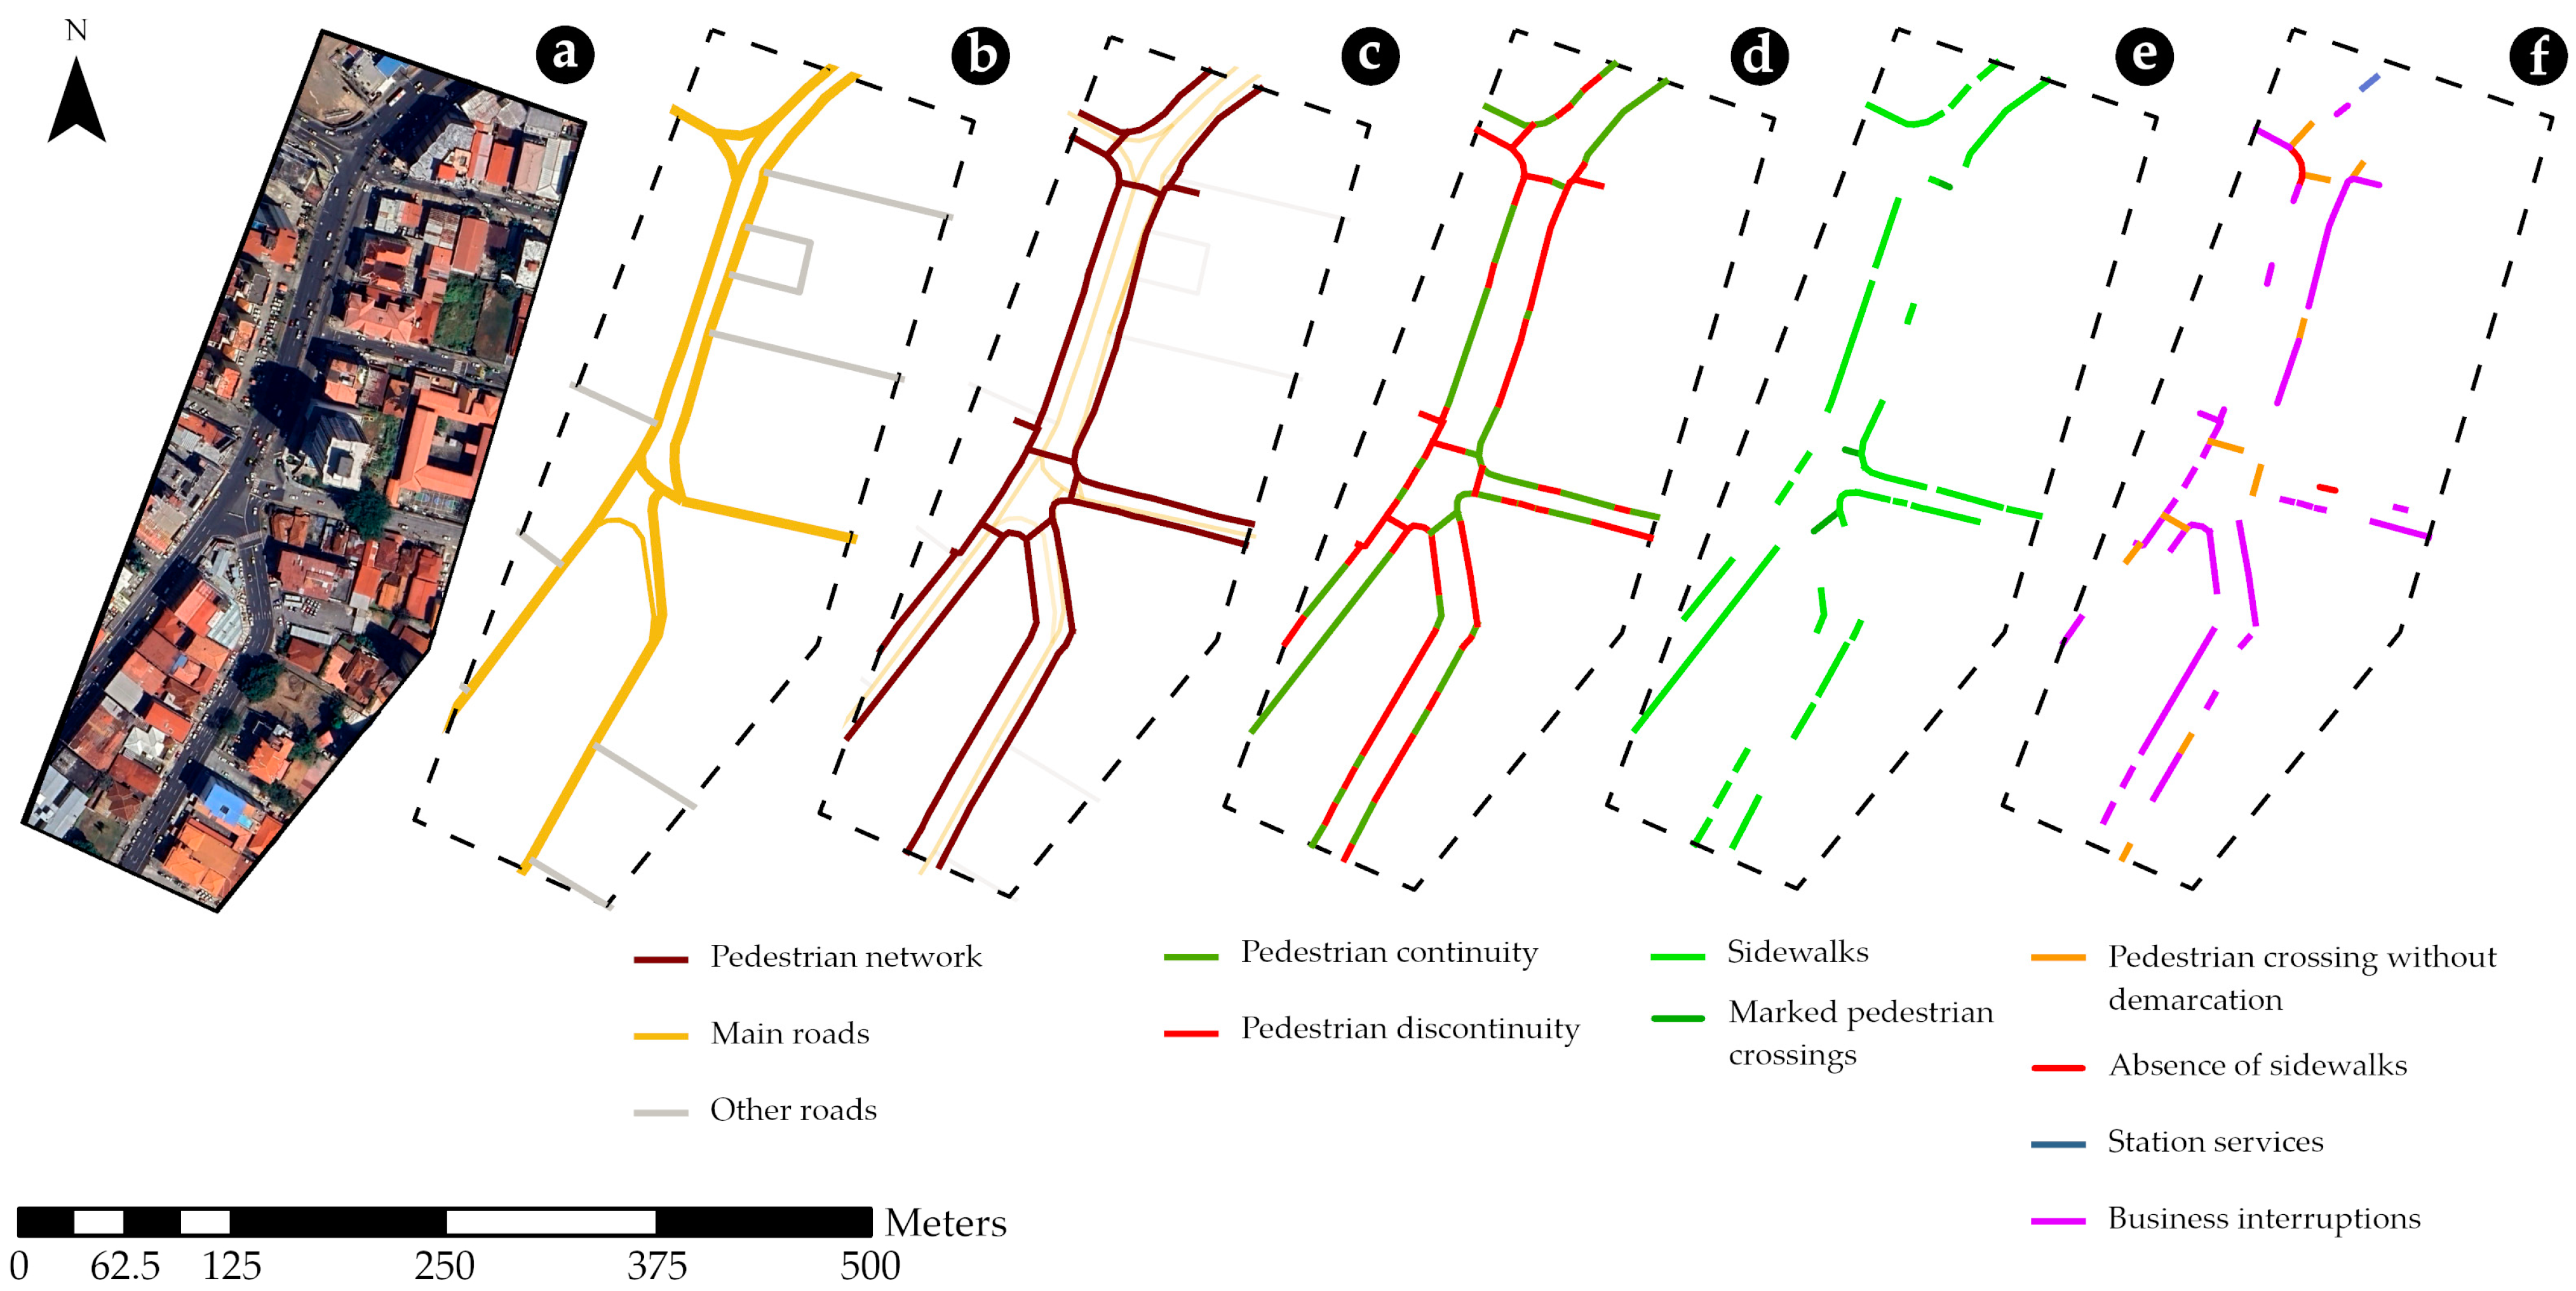
- During the step shown in Figure 3c, these linear entities were constructed by identifying zebra crossings, pedestrian traffic light-regulated intersections, and pedestrian bridges using GEP satellite imagery, as shown in Figure 3a, and then verifying and refining this information through GSV inspections and an existing GDB of formal crossings.
- (i)
- Total absence of sidewalks, forcing pedestrians to walk on the road or in areas not designated for this purpose.
- (ii)
- Interruptions caused by commercial infrastructure, such as business entrances encroaching on pedestrian space.
- (iii)
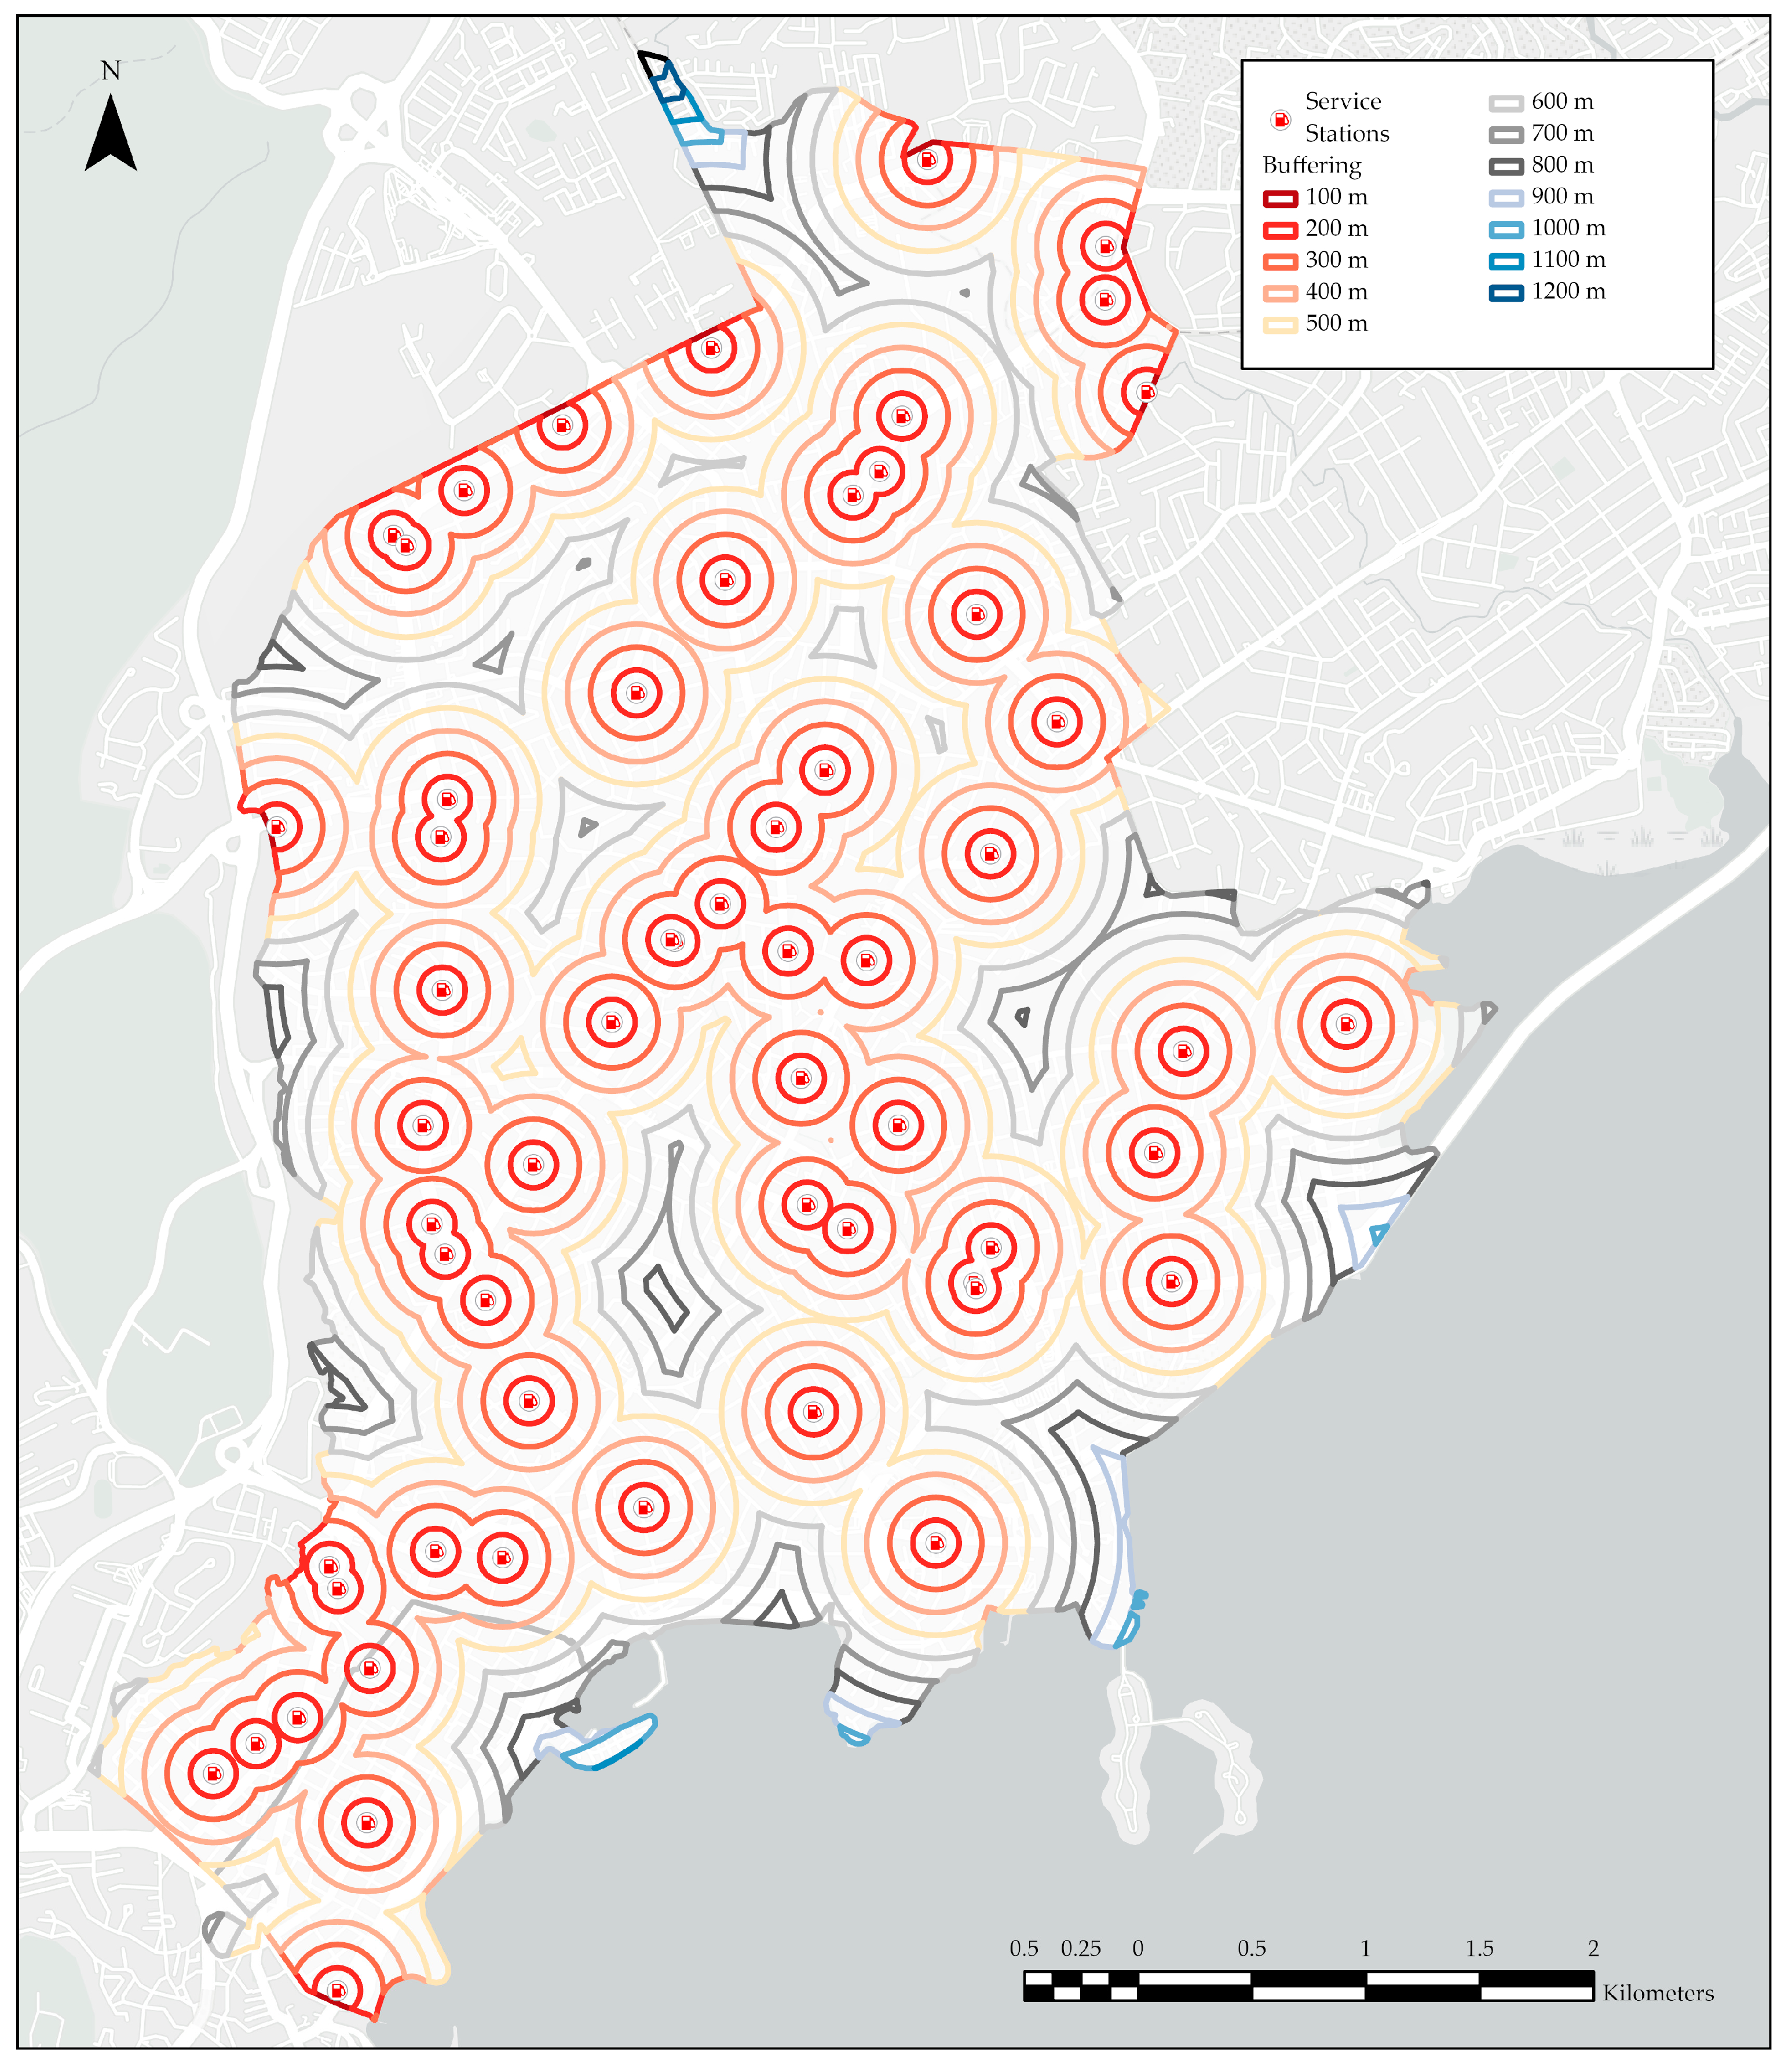
- Service station interruptions, similar to those classified under “caused by commercial infrastructure” but specifically addressing this type of service-oriented establishment. The categorization of these interruptions enables a specific classification and a detailed analysis of their impact on pedestrian continuity.
- (iv)
- Pedestrian crossings without demarcation, where the lack of horizontal signage leads pedestrians to choose their own crossing points, creating multiple informal crossing zones. According to [7], such crossings usually take place at road intersections lacking formal crossings or when they are situated over 50 m away, subject to specific conditions described in their investigation.
- (v)
- Under these guidelines, during the stage shown in Figure 3c, potential informal crossings were identified and constructed using GEP satellite images and GSV inspections. Initially, GEP satellite images were used to locate intersections as shown in Figure 3a, followed by GSV inspections to verify the absence or poor visibility of pedestrian markings.
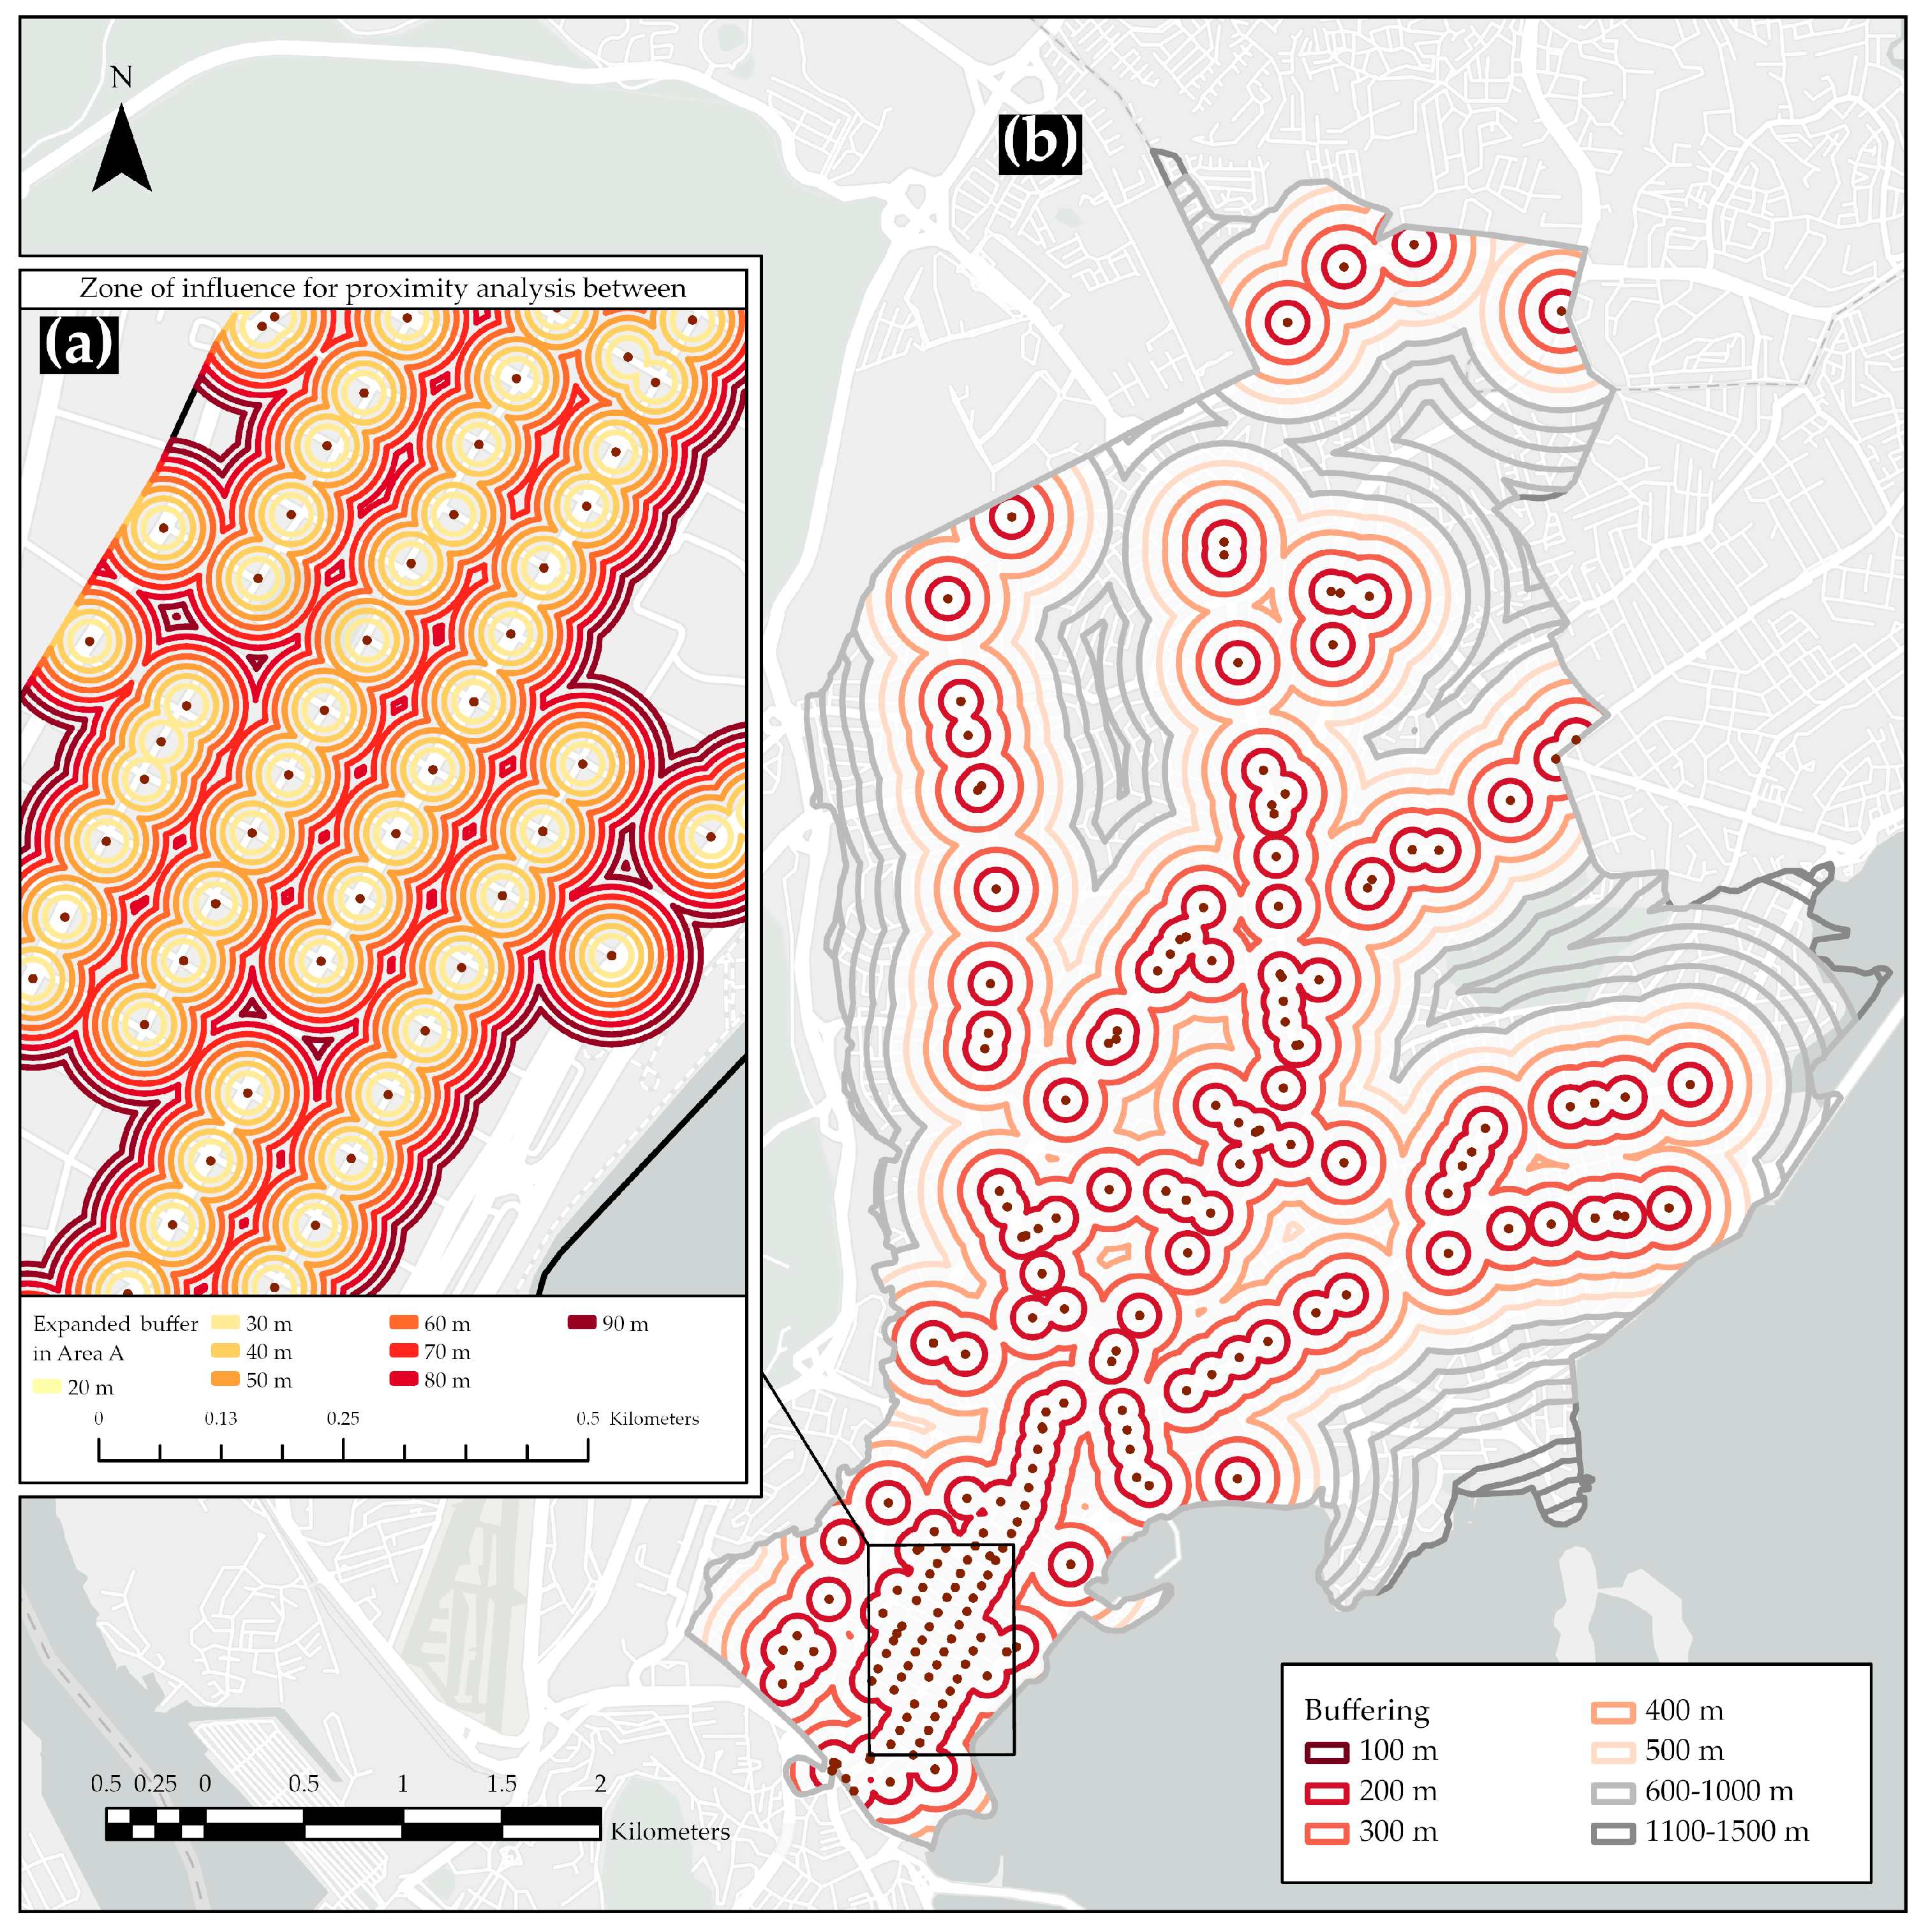
2.2.2. Urban Elements Data Collection
2.3. Data Validation
2.4. Data Processing
2.4.1. Pedestrian Continuity Data Processing
2.4.2. Urban Elements Data Processing
3. Results
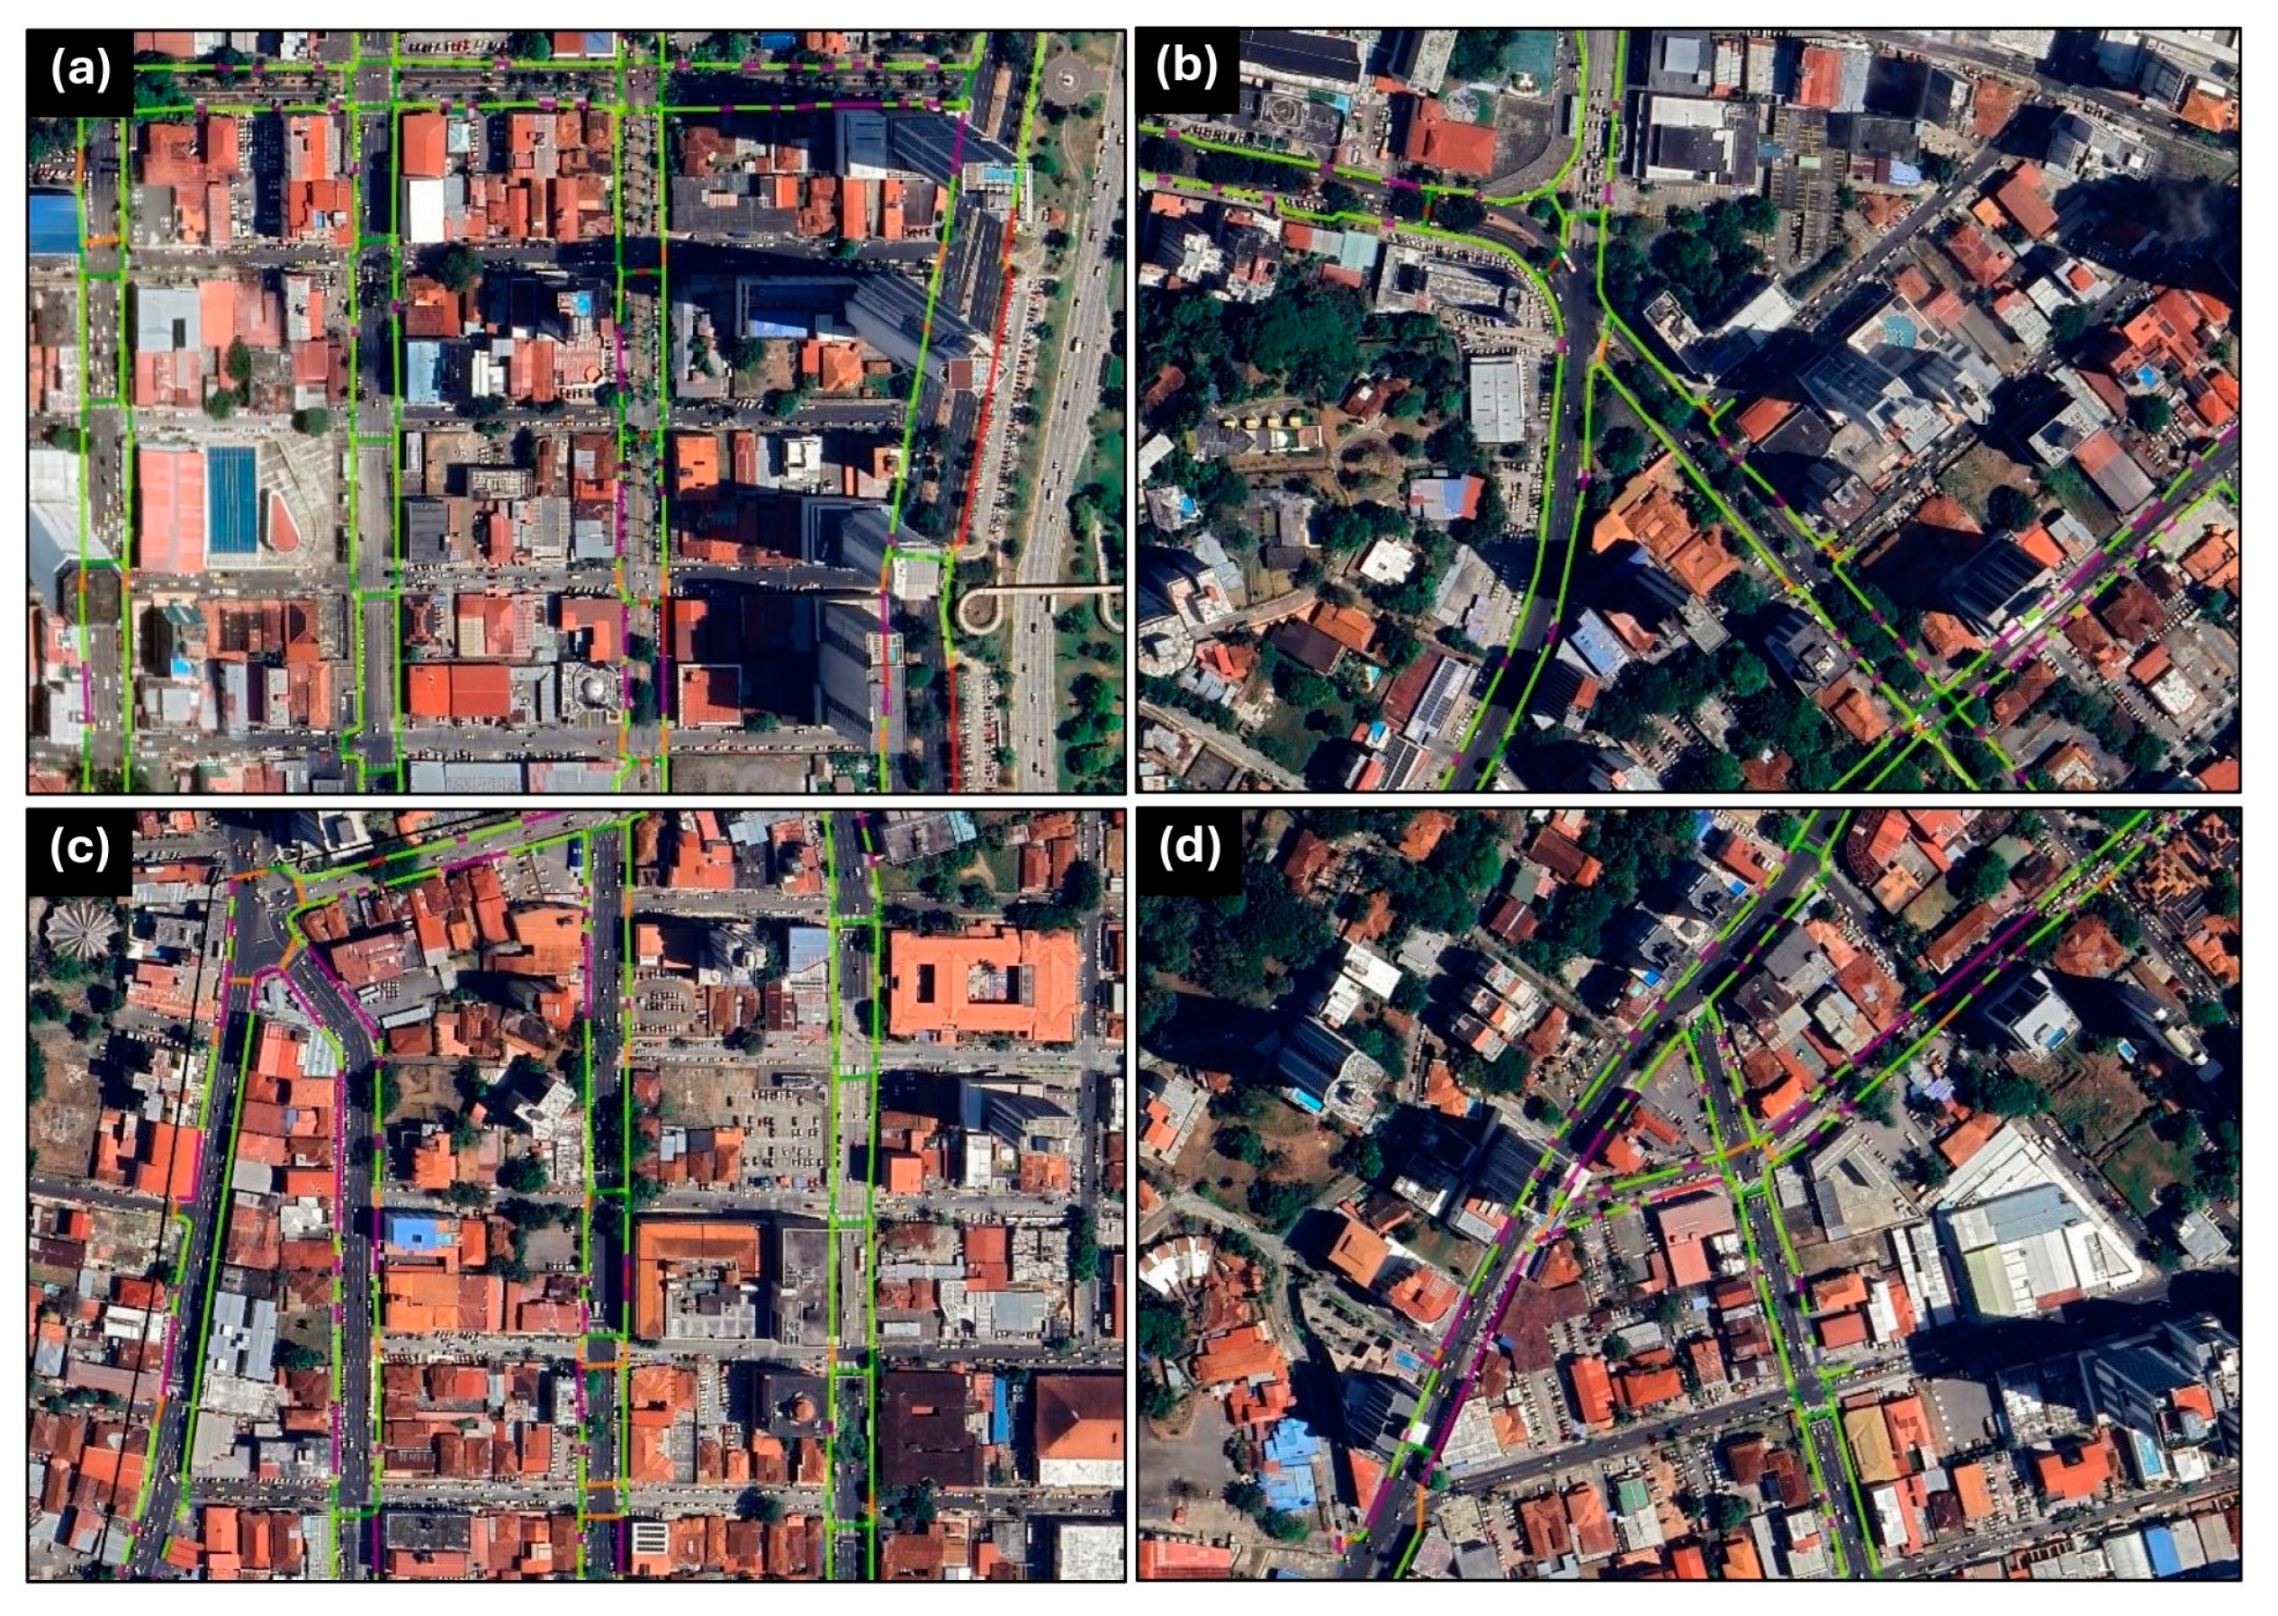
3.1. Pedestrian Continuity
3.2. Urban Elements
4. Discussion
5. Conclusions
Author Contributions
Funding
Data Availability Statement
Conflicts of Interest
References
- Woldegebriel Tessema, M.; Girma Abebe, B. Quantification of Land Use/Land Cover Dynamics and Urban Growth in Rapidly Urbanized Countries: The Case Hawassa City, Ethiopia. Urban Plan. Transp. Res. 2023, 11, 2281989. [Google Scholar] [CrossRef]
- Costa, P.B.; Neto, G.C.M.; Bertolde, A.I. Urban Mobility Indexes: A Brief Review of the Literature. Transp. Res. Procedia 2017, 25, 3645–3655. [Google Scholar] [CrossRef]
- Abdulsamad, Q.; Mohammed, J.; Abdullah, P. Evaluation of the Existing Sidewalks in Duhok City. J. Univ. Duhok 2019, 22, 58–74. [Google Scholar] [CrossRef]
- Vallejo-Borda, J.A.; Cantillo, V.; Rodriguez-Valencia, A. A Perception-Based Cognitive Map of the Pedestrian Perceived Quality of Service on Urban Sidewalks. Transp. Res. Part F Traffic Psychol. Behav. 2020, 73, 107–118. [Google Scholar] [CrossRef]
- Bornioli, A.; Parkhurst, G.; Morgan, P.L. Affective Experiences of Built Environments and the Promotion of Urban Walking. Transp. Res. Part A Policy Pract. 2019, 123, 200–215. [Google Scholar] [CrossRef]
- Valenzuela-Montes, L.M.; Talavera-García, R. Entornos de movilidad peatonal: Una revisión de enfoques, factores y condicionantes. Eure 2015, 41, 5–27. [Google Scholar] [CrossRef]
- Cambra, P.; Gonçalves, A.B.; Moura, F. The Digital Pedestrian Network in Complex Urban Contexts: A Primer Discussion on Typological Specifications. Finisterra 2019, 54, 155–170. [Google Scholar] [CrossRef]
- Nkurunziza, D.; Tafahomi, R.; Faraja, I.A. Pedestrian Safety: Drivers’ Stopping Behavior at Crosswalks. Sustainability 2023, 15, 12498. [Google Scholar] [CrossRef]
- Osama, A.; Sayed, T. Evaluating the Impact of Connectivity, Continuity, and Topography of Sidewalk Network on Pedestrian Safety. Accid. Anal. Prev. 2017, 107, 117–125. [Google Scholar] [CrossRef]
- Sharifi, A. Resilient Urban Forms: A Review of Literature on Streets and Street Networks. Build. Environ. 2019, 147, 171–187. [Google Scholar] [CrossRef]
- Stefanidis, R.-M.; Bartzokas-Tsiompras, A. Pedestrian Accessibility Analysis of Sidewalk-Specific Networks: Insights from Three Latin American Central Squares. Sustainability 2024, 16, 9294. [Google Scholar] [CrossRef]
- Evans, G. Accessibility, Urban Design and the Whole Journey Environment. Built Environ. 2009, 35, 366–385. [Google Scholar] [CrossRef]
- Oviedo Hernandez, D.; Dávila, J.D. Transport, Urban Development and the Peripheral Poor in Colombia—Placing Splintering Urbanism in the Context of Transport Networks. J. Transp. Geogr. 2016, 51, 180–192. [Google Scholar] [CrossRef]
- Caballero, H.; Hidalgo, L.; Quijada-Alarcon, J. Study of Pedestrian Zone According to Superblock Criteria in the Casco Antiguo of Panama. Sustainability 2022, 14, 3459. [Google Scholar] [CrossRef]
- García-Ayllón, S. Rapid Development as a Factor of Imbalance in Urban Growth of Cities in Latin America: A Perspective Based on Territorial Indicators. Habitat Int. 2016, 58, 127–142. [Google Scholar] [CrossRef]
- Quijada-Alarcón, J.; Rodríguez-Rodríguez, R.; González-Cancelas, N.; Bethancourt-Lasso, G. Spatial Analysis of Territorial Connectivity and Accessibility in the Province of Coclé in Panama. Sustainability 2023, 15, 11500. [Google Scholar] [CrossRef]
- Honiball, J.; Burger, E.; Burger, Y. Pedestrian Connectivity: A Focus on Residential Neighbourhood Sidewalks to Promote Accessibility to Public Parks. Spatium 2024, 51, 1–10. [Google Scholar] [CrossRef]
- Lee, J.; Park, S. Investigating Pedestrian Connectivity within Apartment Complexes: A Case Study of Seoul and Singapore. Local Environ. 2022, 27, 697–711. [Google Scholar] [CrossRef]
- Randall, T.A.; Baetz, B.W. Evaluating Pedestrian Connectivity for Suburban Sustainability. J. Urban Plan. Dev. 2001, 127, 1–15. [Google Scholar] [CrossRef]
- Hidayati, I.; Yamu, C.; Tan, W. Realised Pedestrian Accessibility of an Informal Settlement in Jakarta, Indonesia. J. Urban Int. Res. Placemaking Urban Sustain. 2021, 14, 434–456. [Google Scholar] [CrossRef]
- Jabbari, M.; Fonseca, F.; Smith, G.; Conticelli, E.; Tondelli, S.; Ribeiro, P.; Ahmadi, Z.; Papageorgiou, G.; Ramos, R. The Pedestrian Network Concept: A Systematic Literature Review. J. Urban Mobil. 2023, 3, 100051. [Google Scholar] [CrossRef]
- Froehlich, J.E.; Saugstad, M.; Saha, M.; Johnson, M. Towards Mapping and Assessing Sidewalk Accessibility Across Sociocultural and Geographic Contexts. arXiv 2022, arXiv:2207.13626. [Google Scholar]
- Nag, D.; Sen, J.; Goswami, A.K. Measuring Connectivity of Pedestrian Street Networks in the Built Environment for Walking: A Space-Syntax Approach. Transp. Dev. Econ. 2022, 8, 34. [Google Scholar] [CrossRef]
- Pearce, D.M.; Matsunaka, R.; Oba, T. Comparing Accessibility and Connectivity Metrics Derived from Dedicated Pedestrian Networks and Street Networks in the Context of Asian Cities. Asian Transp. Stud. 2021, 7, 100036. [Google Scholar] [CrossRef]
- Jabbari, M.; Fonseca, F.; Ramos, R. Accessibility and Connectivity Criteria for Assessing Walkability: An Application in Qazvin, Iran. Sustainability 2021, 13, 3648. [Google Scholar] [CrossRef]
- Karamitov, K.; Petrova-Antonova, D. Pedestrian Accessibility Assessment Using Spatial and Network Analysis: A Case of Sofia City. Int. Arch. Photogramm. Remote Sens. Spat. Inf. Sci. 2022, 48, 53–60. [Google Scholar] [CrossRef]
- Tal, G.; Handy, S. Measuring Nonmotorized Accessibility and Connectivity in a Robust Pedestrian Network. Transp. Res. Rec. J. Transp. Res. Board 2012, 2299, 48–56. [Google Scholar] [CrossRef]
- Isradi, M.; Fauziah, D.A.A.; Dermawan, W.B.; Mufhidin, A.; Mufhidin, A.; Prasetijo, J. Analysis of Sidewalk User Satisfaction in Alun-Alun Bekasi. ADRI Int. J. Eng. Nat. Sci. 2021, 6, 1–11. [Google Scholar] [CrossRef]
- Scheltema, E.B. ReCYCLE City: Strengthening the Bikeability from Home to the Dutch Railway Station. Master’s Thesis, Delft University of Technology, Delft, The Netherlands, 2012. [Google Scholar]
- Quijada-Alarcón, J.; Rodríguez-Rodríguez, R.; Icaza, A.; González-Cancelas, N.; Bethancourt-Lasso, G. Social Perception of the Connectivity and Quality of Sidewalks in the Metropolitan Area of Panama. J. Maps 2024, 20, 2349167. [Google Scholar] [CrossRef]
- Appolloni, L.; Corazza, M.V.; D’Alessandro, D. The Pleasure of Walking: An Innovative Methodology to Assess Appropriate Walkable Performance in Urban Areas to Support Transport Planning. Sustainability 2019, 11, 3467. [Google Scholar] [CrossRef]
- Badland, H.M.; Opit, S.; Witten, K.; Kearns, R.A.; Mavoa, S. Can Virtual Streetscape Audits Reliably Replace Physical Streetscape Audits? J. Urban Health 2010, 87, 1007–1016. [Google Scholar] [CrossRef]
- Santilli, D.; D’apuzzo, M.; Evangelisti, A.; Nicolosi, V. Towards Sustainability: New Tools for Planning Urban Pedestrian Mobility. Sustainability 2021, 13, 9371. [Google Scholar] [CrossRef]
- INEC XII Censo Nacional de Población y VIII de Vivienda 2023; Instituto Nacional de Estadística y Censo: Panama City, Panamá, 2023.
- Trute, M.; Treuherz, A.; Rodriguez, C.E.; Terraza, H.; Leano, J.M.; Bilbao, F.S.; Gaitan, N.M. Plan de Renovación Urbana Para el Corregimiento de Calidonia; Urban Design Lab: Panama City, Panamá, 2015; pp. 1–144. [Google Scholar]
- Dietrich, U. The Pleasure of Walking in a Neighbourhood: The Pedestrian Route Network and Its Fractal Dimension as a Tool for the Assessment of the Right Balance between Chaos and Order. Int. J. Transp. Dev. Integr. 2022, 6, 155–167. [Google Scholar] [CrossRef]
- Liu, Y.; Ding, X.; Ji, Y. Enhancing Walking Accessibility in Urban Transportation: A Comprehensive Analysis of Influencing Factors and Mechanisms. Information 2023, 14, 595. [Google Scholar] [CrossRef]
- Angel, S. Urban Expansion: Theory, Evidence and Practice. Build. Cities 2023, 4, 124–138. [Google Scholar] [CrossRef]
- Richter, S.M.; Bixler, R.P. Complexifying Urban Expansion: An Exploratory, Gradient-Based Approach. Build. Cities 2022, 3, 792–807. [Google Scholar] [CrossRef]
- Saha, M.; Saugstad, M.; Maddali, H.T.; Zeng, A.; Holland, R.; Bower, S.; Dash, A.; Chen, S.; Li, A.; Hara, K.; et al. Project Sidewalk: A Web-Based Crowdsourcing Tool for Collecting Sidewalk Accessibility Data at Scale. In Proceedings of the C2019 CHI Conference on Human Factors in Computing Systems, Glasgow, UK, 4–9 May 2019. [Google Scholar] [CrossRef]
- Fonseca, F.; Fernandes, E.; Ramos, R. Walkable Cities: Using the Smart Pedestrian Net Method for Evaluating a Pedestrian Network in Guimarães, Portugal. Sustainability 2022, 14, 10306. [Google Scholar] [CrossRef]
- Mäki-Opas, T.E.; Borodulin, K.; Valkeinen, H.; Stenholm, S.; Kunst, A.E.; Abel, T.; Härkänen, T.; Kopperoinen, L.; Itkonen, P.; Prättälä, R.; et al. The Contribution of Travel-Related Urban Zones, Cycling and Pedestrian Networks and Green Space to Commuting Physical Activity among Adults—A Cross-Sectional Population-Based Study Using Geographical Information Systems. BMC Public Health 2016, 16, 760. [Google Scholar] [CrossRef]
- Chudyk, A.M.; McKay, H.A.; Winters, M.; Sims-Gould, J.; Ashe, M.C. Neighborhood Walkability, Physical Activity, and Walking for Transportation: A Cross-Sectional Study of Older Adults Living on Low Income. BMC Geriatr. 2017, 17, 82. [Google Scholar] [CrossRef]
- Alshalalfah, B.W.; Shalaby, A.S. Case Study: Relationship of Walk Access Distance to Transit with Service, Travel, and Personal Characteristics. J. Urban Plan. Dev. 2007, 133, 114–118. [Google Scholar] [CrossRef]
- Dai, D.; Taquechel, E.; Steward, J.; Strasser, S. The Impact of Built Environment on Pedestrian Crashes and the Identification of Crash Clusters on an Urban University Campus. West J. Emerg. Med. 2010, 11, 294–301. [Google Scholar]
- Martinuzzi, C.; Lahoud, C. Public Space Site-Specific Assessment: Guidelines to Achieve Quality Public Spaces at Neighbourhood Level; UN Habitat: Nairobi, Kenya, 2020. [Google Scholar]
- Talpur, M.A.H.; Khahro, S.H.; Abro, S.; Shaikh, H. Measuring GIS-Based Pedestrian Accessibility to Bus Stops: A Sustainable Approach to Ease Urban Traffic Problems at Hyderabad, Pakistan. Discov. Cities 2024, 1, 28. [Google Scholar] [CrossRef]
- Yang, Y.; Diez-Roux, A.V. Walking Distance by Trip Purpose and Population Subgroups. Am. J. Prev. Med. 2012, 43, 11–19. [Google Scholar] [CrossRef] [PubMed]
- Sevtsuk, A.; Kalvo, R.; Ekmekci, O. Pedestrian Accessibility in Grid Layouts: The Role of Block, Plot and Street Dimensions. Urban Morphol. 2016, 20, 89–106. [Google Scholar] [CrossRef]
- Busquets, J.; Yang, D.; Keller, M. Urban Grids: Handbook for Regular City Design; Harvard University Graduate School of Design: Cambridge, MA, USA, 2019; ISBN 9781940743950. [Google Scholar]
- Battisti, F.; Pisano, C.; Crosas, C.; Gómez-Escoda, E.; Villavieja, E. Interplay between Land Use Planning and Functional Mix Dimensions: An Assemblage Approach for Metropolitan Barcelona. Sustainability 2024, 16, 7734. [Google Scholar] [CrossRef]
- Assmann, C. The Emergence of the Car-Oriented City: Entanglements and Transfer Agents in West-Berlin, East-Berlin and Lyon, 1945–1975. J. Transp. Hist. 2020, 41, 328–352. [Google Scholar] [CrossRef]
- Heinonen, J.; Czepkiewicz, M.; Árnadóttir, Á.; Ottelin, J. Drivers of Car Ownership in a Car-Oriented City: A Mixed-Method Study. Sustainability 2021, 13, 619. [Google Scholar] [CrossRef]
- Brownrigg-Gleeson, M.L.; Monzon, A.; Cortez, A. Reasons to Pedestrianise Urban Centres: Impact Analysis on Mobility Habits, Liveability and Economic Activities. Sustainability 2023, 15, 16472. [Google Scholar] [CrossRef]
- Newman, P.; Kosonen, L.; Kenworthy, J. Theory of Urban Fabrics: Planning the Walking, Transit/Public Transport and Automobile/Motor Car Cities for Reduced Car Dependency. Town Plan. Rev. 2016, 87, 429–458. [Google Scholar] [CrossRef]
- Global Designing Cities Initiative Pedestrian Crossings. In Global Street Design Guide; Island Press: Washington, DC, USA, 2016; pp. 112–113.
- Ewing, R.; Cervero, R. Travel and the Built Environment. J. Am. Plan. Assoc. 2010, 76, 265–294. [Google Scholar] [CrossRef]
- Lewis McConville, M. Defining Mixed-Use: Which Land Uses Promote Walking? Master’s Thesis, University of North Carolina at Chapel Hill, Chapel Hill, NC, USA, 2009. [Google Scholar] [CrossRef]


| Data | Types | Zone A (%) a | Relative A (%) b | Zone B (%) a | Relative B (%) b | Study Area (%) a | Rel. Study Area (%) b |
|---|---|---|---|---|---|---|---|
| Pedestrian continuity | Sidewalks | 62.63 | 88.11 | 61.74 | 92.52 | 61.91 | 91.65 |
| Marked pedestrian crossings | 8.45 | 11.89 | 4.99 | 7.48 | 5.64 | 8.35 | |
| Pedestrian discontinuity | Pedestrian crossings without demarcation | 6.23 | 21.52 | 3.27 | 9.81 | 3.83 | 11.80 |
| Business interruptions | 15.66 | 54.13 | 23.64 | 71.04 | 22.13 | 68.20 | |
| Service station interruptions | 0.36 | 1.25 | 1.76 | 5.28 | 1.49 | 4.59 | |
| Absence of sidewalks | 6.68 | 23.10 | 4.61 | 13.87 | 5.00 | 15.41 |
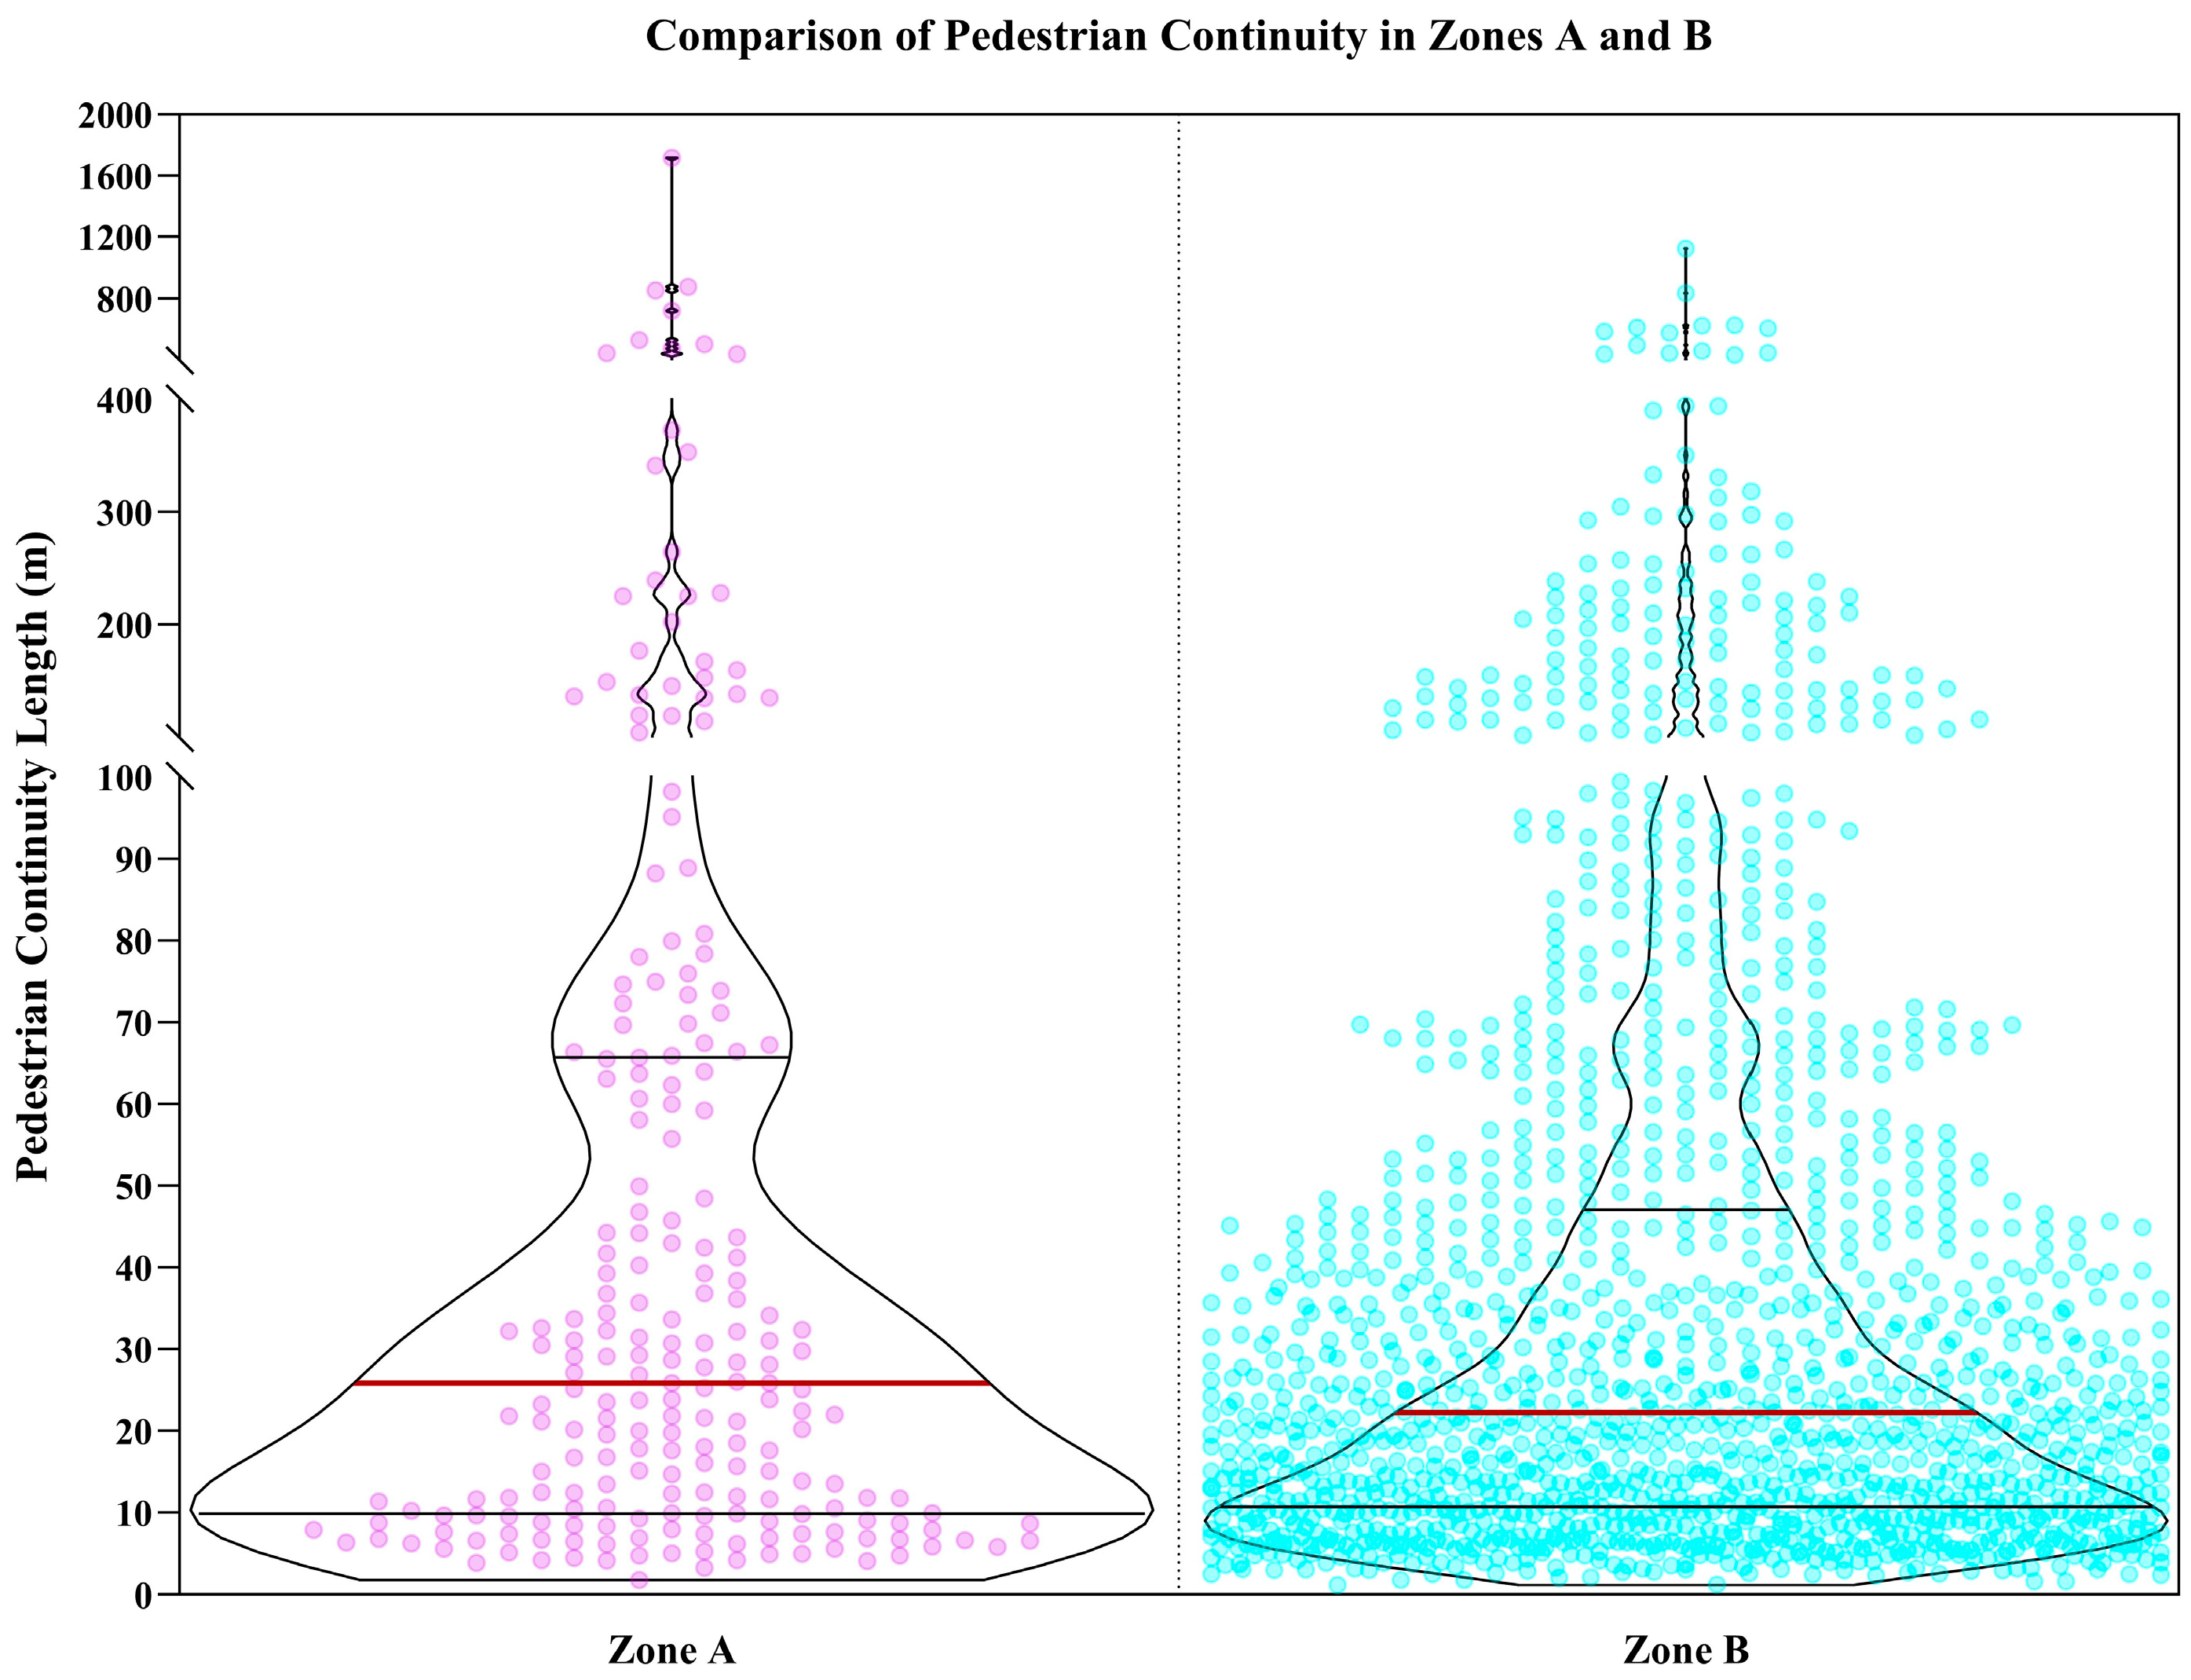
| Statistic | Mean (m) | Median (m) | σ (m) | Lmax (m) | 95% CI (m) |
|---|---|---|---|---|---|
| Zone A | 73.37 | 25.88 | 166.15 | 1716.14 | [51.45, 95.3] |
| Zone B | 45.60 | 22.27 | 77.40 | 1122.41 | [41.61, 49.6] |
| Zone | Max. (m) | Min. (m) | Average (m) |
|---|---|---|---|
| Zone A | 741.78 | 674.07 | 696.64 |
| Zone B | 860.96 | 17.51 | 361.31 |
| Zone | 0–100 m | >100–150 m | >150–200 m | >200 m |
|---|---|---|---|---|
| Zone A | 78.95% | 15.79% | 5.26% | 0% |
| Zone B | 47.27% | 17.58% | 8.48% | 26.67% |
| Case of study | 53.20% | 17.24% | 7.88% | 21.67% |
| Zone | 0–100 m | >100–150 m | >150–200 m | >200 m |
|---|---|---|---|---|
| Zone A | 87.67% | 8.22% | 2.74% | 1.37% |
| Zone B | 38.33% | 20.83% | 16.67% | 24.17% |
| Case of study | 56.99% | 16.06% | 11.40% | 15.54% |
Disclaimer/Publisher’s Note: The statements, opinions and data contained in all publications are solely those of the individual author(s) and contributor(s) and not of MDPI and/or the editor(s). MDPI and/or the editor(s) disclaim responsibility for any injury to people or property resulting from any ideas, methods, instructions or products referred to in the content. |
© 2025 by the authors. Licensee MDPI, Basel, Switzerland. This article is an open access article distributed under the terms and conditions of the Creative Commons Attribution (CC BY) license (https://creativecommons.org/licenses/by/4.0/).
Share and Cite
Quijada-Alarcón, J.; Rodríguez-Rodríguez, R.; Maylin, A.; Adames, M.; Zeballos, J.; Icaza, A.; Harris, A. Assessing Pedestrian Network Continuity: Insights from Panama City’s Context. Urban Sci. 2025, 9, 58. https://doi.org/10.3390/urbansci9030058
Quijada-Alarcón J, Rodríguez-Rodríguez R, Maylin A, Adames M, Zeballos J, Icaza A, Harris A. Assessing Pedestrian Network Continuity: Insights from Panama City’s Context. Urban Science. 2025; 9(3):58. https://doi.org/10.3390/urbansci9030058
Chicago/Turabian StyleQuijada-Alarcón, Jorge, Roberto Rodríguez-Rodríguez, Anshell Maylin, Marcelo Adames, Jaffet Zeballos, Analissa Icaza, and Angelino Harris. 2025. "Assessing Pedestrian Network Continuity: Insights from Panama City’s Context" Urban Science 9, no. 3: 58. https://doi.org/10.3390/urbansci9030058
APA StyleQuijada-Alarcón, J., Rodríguez-Rodríguez, R., Maylin, A., Adames, M., Zeballos, J., Icaza, A., & Harris, A. (2025). Assessing Pedestrian Network Continuity: Insights from Panama City’s Context. Urban Science, 9(3), 58. https://doi.org/10.3390/urbansci9030058