Article

Technical and Policy Analysis: Time Series of Land Subsidence for the Evaluation of the Jakarta Groundwater-Free Zone

1
Research Center for Geoinformatics, National Research and Innovation Agency (BRIN), Jakarta 10340, Indonesia
2
Graduate School of Engineering, Muroran Institute of Technology, Muroran 050-0071, Japan
3
Japan Aerospace Exploration Agency, Tokyo 181-0015, Japan
4
Department of Geography, Faculty of Social Sciences and Political Science, Universitas Negeri Semarang, Semarang 50229, Indonesia
5
Directorate General of Water Resources, Ministry of Public Works and Housing, Jakarta 12110, Indonesia
6
Faculty of Art, Udayana University, Denpasar 80361, Indonesia
*
Author to whom correspondence should be addressed.
Urban Sci. 2025, 9(3), 67; https://doi.org/10.3390/urbansci9030067
Submission received: 17 January 2025 / Revised: 16 February 2025 / Accepted: 17 February 2025 / Published: 4 March 2025

Abstract

:
Jakarta faces a critical challenge of extensive land subsidence, ranking prominently globally. This research employs a combined technical and policy evaluation approach to analyze the issue, incorporating sustainability considerations to assess the efficacy of Governor Regulation of Jakarta Number 93 of 2021, focusing on how the groundwater-free zone relates to land subsidence in the city. We processed 81 ALOS-2 PALSAR-2 synthetic aperture radar (SAR) data using persistent scatterer interferometric synthetic aperture radar (PS-InSAR) with HH polarization from 2017 to 2022 and ground truthing with 255 global positioning system (GPS) real-time kinematic (RTK) validation points. Our findings reveal a significant misalignment in the designated groundwater-free zone in the central part of Jakarta. At the same time, severe land subsidence primarily affects northern and northwestern Jakarta, with an average land subsidence rate of 5–6 cm/year. We strongly advocate for a thorough evaluation to rectify and redefine the boundaries of groundwater-free zones, improve regulatory frameworks, and effectively address land subsidence mitigation in the study area. The impact of domestic water needs on land subsidence highlights the urgency of action. Based on a combination of land subsidence velocity rates and domestic water demand, we have classified the cities in Jakarta into three levels of recommendations for groundwater-free zones. The cities are ranked in order of priority from highest to lowest: (1) West Jakarta, (2) North Jakarta, (3) South Jakarta, (4) East Jakarta, and (5) Central Jakarta, which holds the lowest priority.

1. Introduction

Currently, fifty-three percent of the world’s population resides in coastal areas [1,2,3,4,5]. Consequently, coastal regions are urbanizing at unprecedented rates, particularly in low-and middle-income countries [6,7]. Furthermore, because of the geophysical processes (i.e., coastal erosion and accretion [8], saltwater intrusion [9], and sea level rise [10]) occurring in coastal areas, they are regarded as the most dynamic areas on the Earth’s surface [11,12,13]. These factors collectively render coastal areas particularly vulnerable to various hazards. Due to the crucial role that coastal areas play in supporting numerous people’s livelihoods, the challenges coastal areas face are worsening. Among these challenges, land subsidence in coastal areas has received little attention compared to climate change. Research has reported that subsidence-induced sea level rise is three to four times faster than climate-induced sea level rise; globally, it reaches 7.8–9.9 mm/year [14]. This evidence underscores the urgent need for global attention to land subsidence, given its significant impact on sea level rise, comparable with climate change.
Land subsidence is a gradual occurrence characterized by the slow descent of the land surface, resulting from a decrease in the volume of material beneath the surface and an increase in subterranean voids stemming from both natural and human-induced activities [15,16,17,18,19,20,21]. Land subsidence in urban areas is caused by various factors, including excessive groundwater extraction [22,23], soil layer consolidation [24], building loads [23,25], and tectonic influences [26,27]. Despite the various factors contributing to land subsidence, these studies consistently agree that excessive groundwater extraction is the primary cause. This aligns with statistical analysis, which revealed a direct relationship between land subsidence and groundwater extraction with a correlation coefficient of 0.886 [17]. This phenomenon suggests that regulating groundwater extraction is suitable for reducing subsidence.
Groundwater depletion and land subsidence are closely interconnected. A study utilizing GRACE and InSAR data confirmed a strong correlation between a significant decline in groundwater storage and land subsidence in Bangladesh [28]. Consequently, the study recommends prohibiting groundwater extraction by designating critical zones in areas experiencing severe subsidence. This concept aligns well with groundwater-free zone policy in several countries, as described in [29]. Additionally, subsidence studies in the Mekong Delta have demonstrated a direct relationship between land use and subsidence rates, with rates increasing following land-use changes that either intensify groundwater extraction or otherwise accelerate land subsidence [30]. The fact that subsidence is correlated with groundwater extraction and land-use changes proves that the importance of regulating groundwater and land use cannot be overlooked.
There are currently several technologies available for analyzing land subsidence, including (1) leveling [31,32]; (2) GNSS core [33,34]; and (3) InSAR [25,35]. InSAR technology is increasingly regarded as the most reliable technique compared to leveling and GNSS because it provides extensive analysis results from a single measurement, making spatial analysis feasible [36,37]. InSAR technology has evolved with the introduction of methods such as D-InSAR [38,39] and multi-temporal InSAR [40,41]. The multi-temporal InSAR approach has advanced in addressing analysis challenges in various field conditions. For instance, the PS-InSAR method was developed to mitigate atmospheric disturbances and temporal decorrelation [42,43].
Satellite-based measurements using interferometric synthetic aperture radar (InSAR) techniques provide a cost-effective and accurate tool for investigating land subsidence over large-scale areas [44]. InSAR is a widely used technique and is successfully employed to detect land subsidence in various types of areas, such as urban areas [23,27,45,46,47,48,49,50], peri-urban areas [51], volcanic regions [52,53], and vegetated peatlands [54,55,56,57]. Compared to other InSAR techniques, persistent scatterer interferometry (PS-InSAR) offers the highest accuracy in surface deformation measurement (centimeter and even subcentimeter) at a very high spatial resolution because of its ability to overcome spatial–temporal decorrelations and mitigate atmospheric delay effects [58]. Due to its capabilities, we use PS-InSAR to investigate land subsidence in this research.
The accuracy of PS-InSAR technology has been thoroughly examined, yielding favorable results. For instance, validation using in situ benchmarks showed an 83% agreement with PS-InSAR results [59]; relative errors were below 20% based on accuracy assessments comparing PS-InSAR with GNSS and geodetic leveling data [60]; and the deformation results obtained from PS-InSAR showed a strong correlation with GPS data and remained within an acceptable range of error [61]. Hence, due to its accuracy in land subsidence analysis, PS-InSAR is a highly effective method.
As the capital of Indonesia, Jakarta ranks among the top list globally for severe land subsidence [62,63]. Between 1982 and 2010, the rate of land subsidence in Jakarta ranged from 1 to 15 cm per year. In specific locations, this rate increases to 20–28 cm/year [64]. Subsidence is increasing steadily, leading to significant subsidence of the city [15,64,65]. Thus, land subsidence has become a silent killer in Jakarta. Natural and human factors cause land subsidence in Jakarta. Jakarta’s heavy reliance on groundwater has made this a key factor in subsidence [64]. Additionally, the weight of infrastructure and buildings worsens the issue, especially in areas with soft, compressible soil [66]. These combined factors have led to subsidence in the city, threatening infrastructure, public safety, and long-term sustainability [26].
The Indonesian government has implemented extensive measures to address land subsidence issues. A key policy response is evident in Governor Relation No. 93 of 2021 of the Special Capital Region of Jakarta, which explicitly addresses groundwater-free zones. This governor’s regulation is a legal alternative to anticipate increasingly severe land subsidence by establishing groundwater-free zones. Within these zones, strict monitoring of groundwater extraction is enforced, and groundwater extraction and/or utilization are prohibited. However, since the regulation was enacted, a policy evaluation to assess its effectiveness has not been conducted. Considering the intricate challenges posed by land subsidence in Jakarta and the importance of Governor Regulation of DKI Jakarta Number 93 of 2021 on groundwater-free zones, it is imperative to evaluate governor regulations using a comprehensive approach. This research involves conducting a thorough technical analysis of land subsidence and evaluating the practical implementation of the policies outlined in the gubernatorial regulation.
In-SAR techniques for investigating land subsidence commonly use open-source data, which are limited by their ability to penetrate the clouds and vegetation and their sensitivity to surface conditions, e.g., Sentinel-1A [17,67,68,69,70,71] and Landsat [72]. Nevertheless, advanced imagery such as the Phased Array type L-band Synthetic Aperture Radar (PALSAR) onboard ALOS-2 has been utilized to analyze land subsidence [22,73,74,75,76,77,78,79,80]. However, these studies typically employed a limited number of L-band scenes, ranging from 3 to 24, with relatively narrow temporal coverage. This limitation highlights a gap in the literature, as no studies have employed a larger dataset of L-band scenes (exceeding 50 scenes) to investigate land subsidence. Moreover, integrating L-band SAR data for comprehensive land subsidence analysis, particularly in the context of policy evaluation concerning groundwater-free zone regulations in Jakarta, remains unexplored. Although several papers have linked land subsidence in Jakarta to provincial government policies [81,82], no paper has examined land subsidence and linked it to the governor’s regulation on groundwater extraction. Our study addresses this gap by utilizing ALOS PALSAR data with extended temporal coverage of five years and incorporating 81 scenes to evaluate groundwater-free zone policies in Jakarta, representing the first effort of its kind.
Based on various studies on land subsidence in Jakarta, groundwater extraction has been identified as the dominant factor contributing to land subsidence in the province [64,83,84]. These findings have led this research to prioritize groundwater extraction data, which limits the analysis of other factors contributing to land subsidence. As a result, building load factors and geological conditions have not been thoroughly considered. Although Jakarta comprises five administrative cities and one district, this study focuses solely on urban areas, excluding the Thousand Islands Regency from the analysis. As a result, conclusions regarding the evaluation of groundwater-free zone regulation in the Thousand Islands Regency cannot be drawn.
The urgency of this research stems from the fact that since the gubernatorial regulation was established, its implementation has never been evaluated. Therefore, this study aims to clarify the effectiveness and impact of the regulatory measures outlined in the Governor Regulation of DKI Jakarta Number 93 of 2021, which was established to address land subsidence by designating groundwater-free zones. This research offers novel contributions by integrating technical analysis with policy evaluation, including new recommendations from groundwater-free zones supported by the longest ALOS-2 PALSAR-2 datasets available in this study area. These findings can guide future strategies, interventions, and potential policy improvements to protect the region from the ongoing challenges of land subsidence in Jakarta.
In studying the governor’s regulation, our initial step involves thoroughly examining the regulation and its associated policies. Next, we perform a technical analysis to determine the time series velocity of land subsidence in Jakarta using the PS-InSAR technique. Then, we compare the subsidence velocity in Jakarta with that in the designated groundwater-free zones outlined in the governor’s regulation. Finally, we propose the evaluation of groundwater-free zone regulations in Jakarta. Our proposed evaluation represents a sustainable initiative to safeguard the environment from the severe effects of land subsidence by implementing groundwater-free zone management.

2. Materials and Methods

2.1. Study Area

Jakarta, the capital of Indonesia, presents a compelling subject for analysis, as it includes five administrative city regions and one administrative district. It has a total area of around 664 km2 and a population of 10,672,100 people [85]. The administrative regions of Central Jakarta, North Jakarta, West Jakarta, South Jakarta, East Jakarta, and the Thousand Islands Administrative District are delineated to the south and east by Depok City, Bogor Regency, Bekasi City, and Bekasi Regency; to the west by Tangerang City and Tangerang Regency; and to the north by the Java Sea (Figure 1). DKI Jakarta Province is situated at 6°12′ south latitude and 106°48′ east longitude, characterized as a lowland area with an average elevation of +7 m above sea level.
A city’s physical appearance generally develops and evolves with time because of development activities for civic facilities and infrastructure. This condition is linked to the growing population, increasing population mobility, and urban activity. Geologically, the entire area is made up of Pleistocene sediments located +50 m below the Earth’s surface. The southern section comprises an alluvial layer, while the coastal lowlands extend inland for approximately 10 km. Jakarta is a lowland area because 40% of its land is below the high tide line. Jakarta is located in the Artoris Basin. The following 13 rivers flow through Jakarta: the Mookevart River, Angke River, Pesanggrahan River, Grogol River, Krukut River, West Baru River, Ciliwung River, East Baru River, Cipinang River, Sunter River, Buaran River, Kramat Jati River, and Cakung River.
The DKI Jakarta area is divided into two geomorphological units: coastal plain morphology in the north and Bogor volcanic fan morphology in the south. Because the southern part is higher in elevation, it serves as a recharge area under natural conditions, whereas the northern area serves as a discharge area. Natural calamities lurking in Jakarta can be evident in the physical conditions of the region, including flooding and land subsidence; therefore, understanding the relationships between human activity, urban development, and the physical elements of land is critical for overcoming these issues.
Our research area covers five administrative regions in Jakarta. These five administrative regions were chosen because they correspond to the ALOS-2 PALSAR-2 satellite data coverage from 2017 to 2022. These data are used to process land subsidence using the PS-InSAR method.

2.2. Land Subsidence Mapping Materials

This study utilized 81 ALOS-2 PALSAR-2 spaceborne L-band SAR images obtained from the Japan Aerospace Exploration Agency (JAXA) in single-look complex (SLC) format (the data specifications are shown in Table S1). SAR data were collected between 12 June 2017 and 6 June 2022 using an ascending retrieval mode (Table S2). The data were acquired using dual polarimetric mode, although only the horizontal–horizontal polarimetric mode was utilized for this study. The study period was selected based on Jakarta’s rapid urban development and increasing water demand, which are assumed to be key drivers of land subsidence. Between 2017 and 2022, Jakarta experienced significant infrastructure expansion, population growth, and economic activities that have intensified groundwater extraction, widely recognized as a significant factor contributing to subsidence. By analyzing deformation in this period, we aim to capture the correlation between urbanization, groundwater dependency, and subsidence trends, providing insights into the long-term impact of these factors on Jakarta’s land stability.

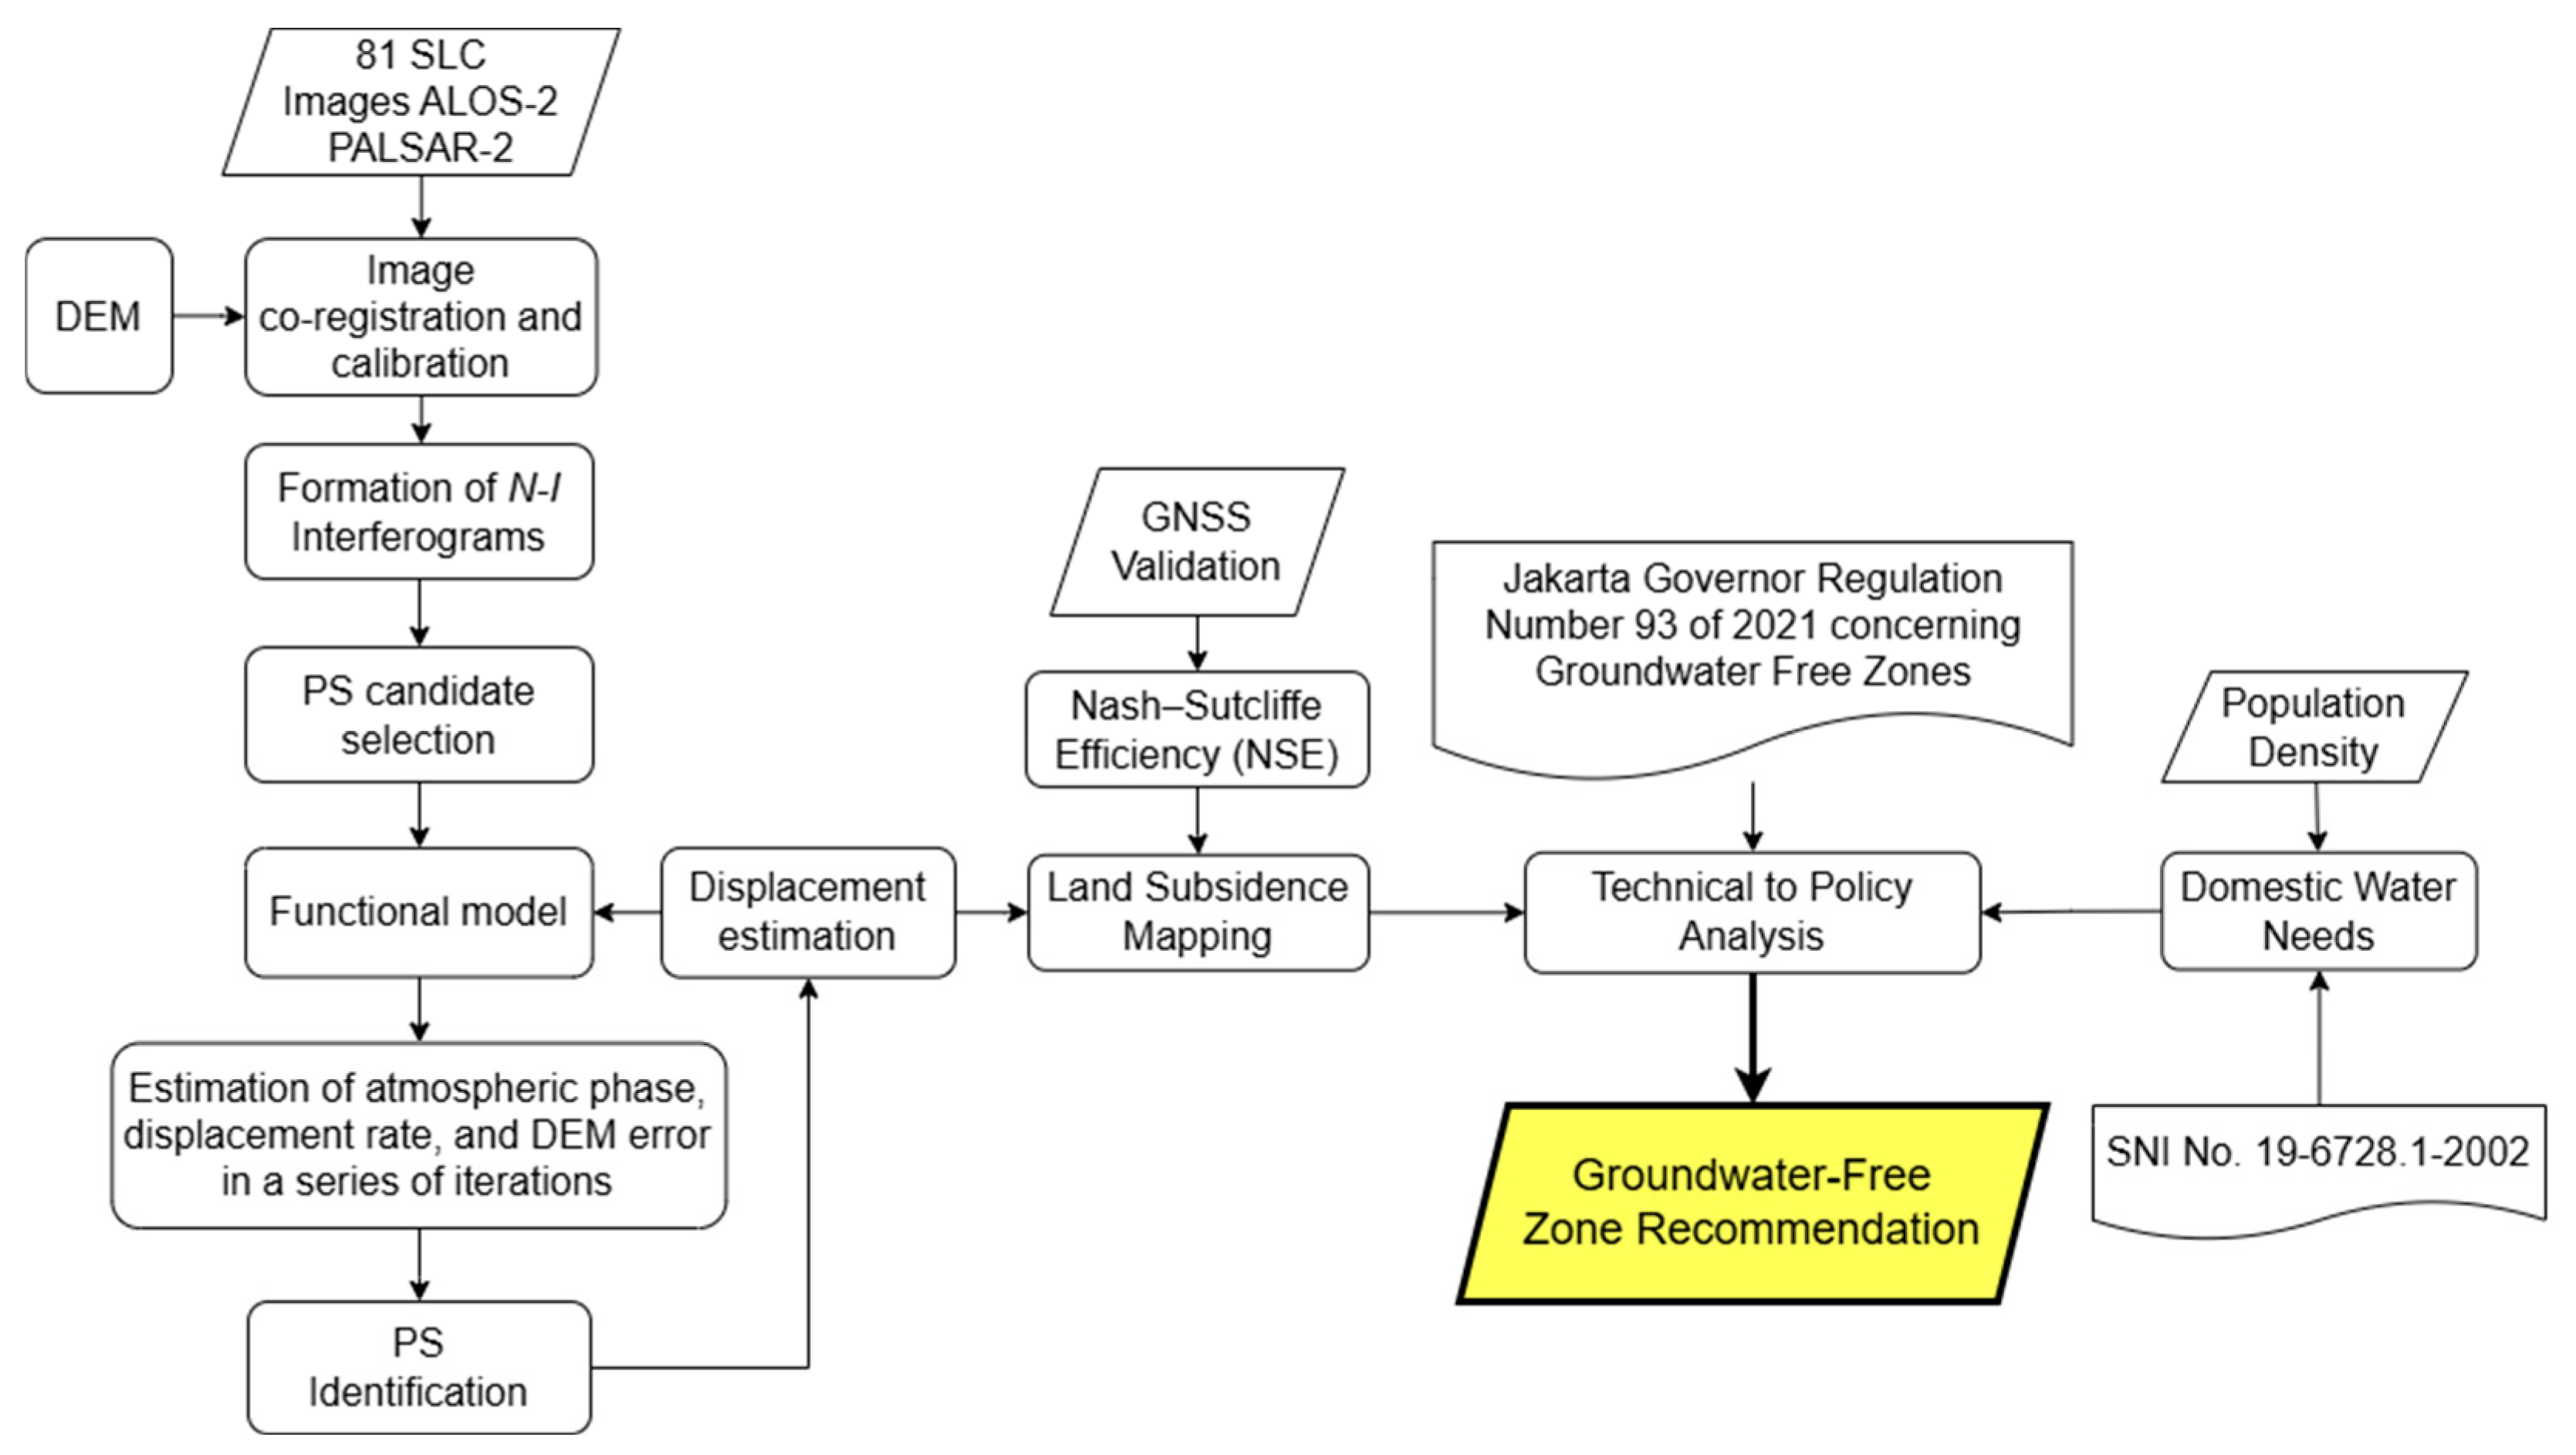
2.3. Data Processing with PS-InSAR Technique

Data preparation, analysis of data, the interferometric phase, atmospheric phase screen calculation, and land subsidence mapping were all part of the PS-InSAR process.

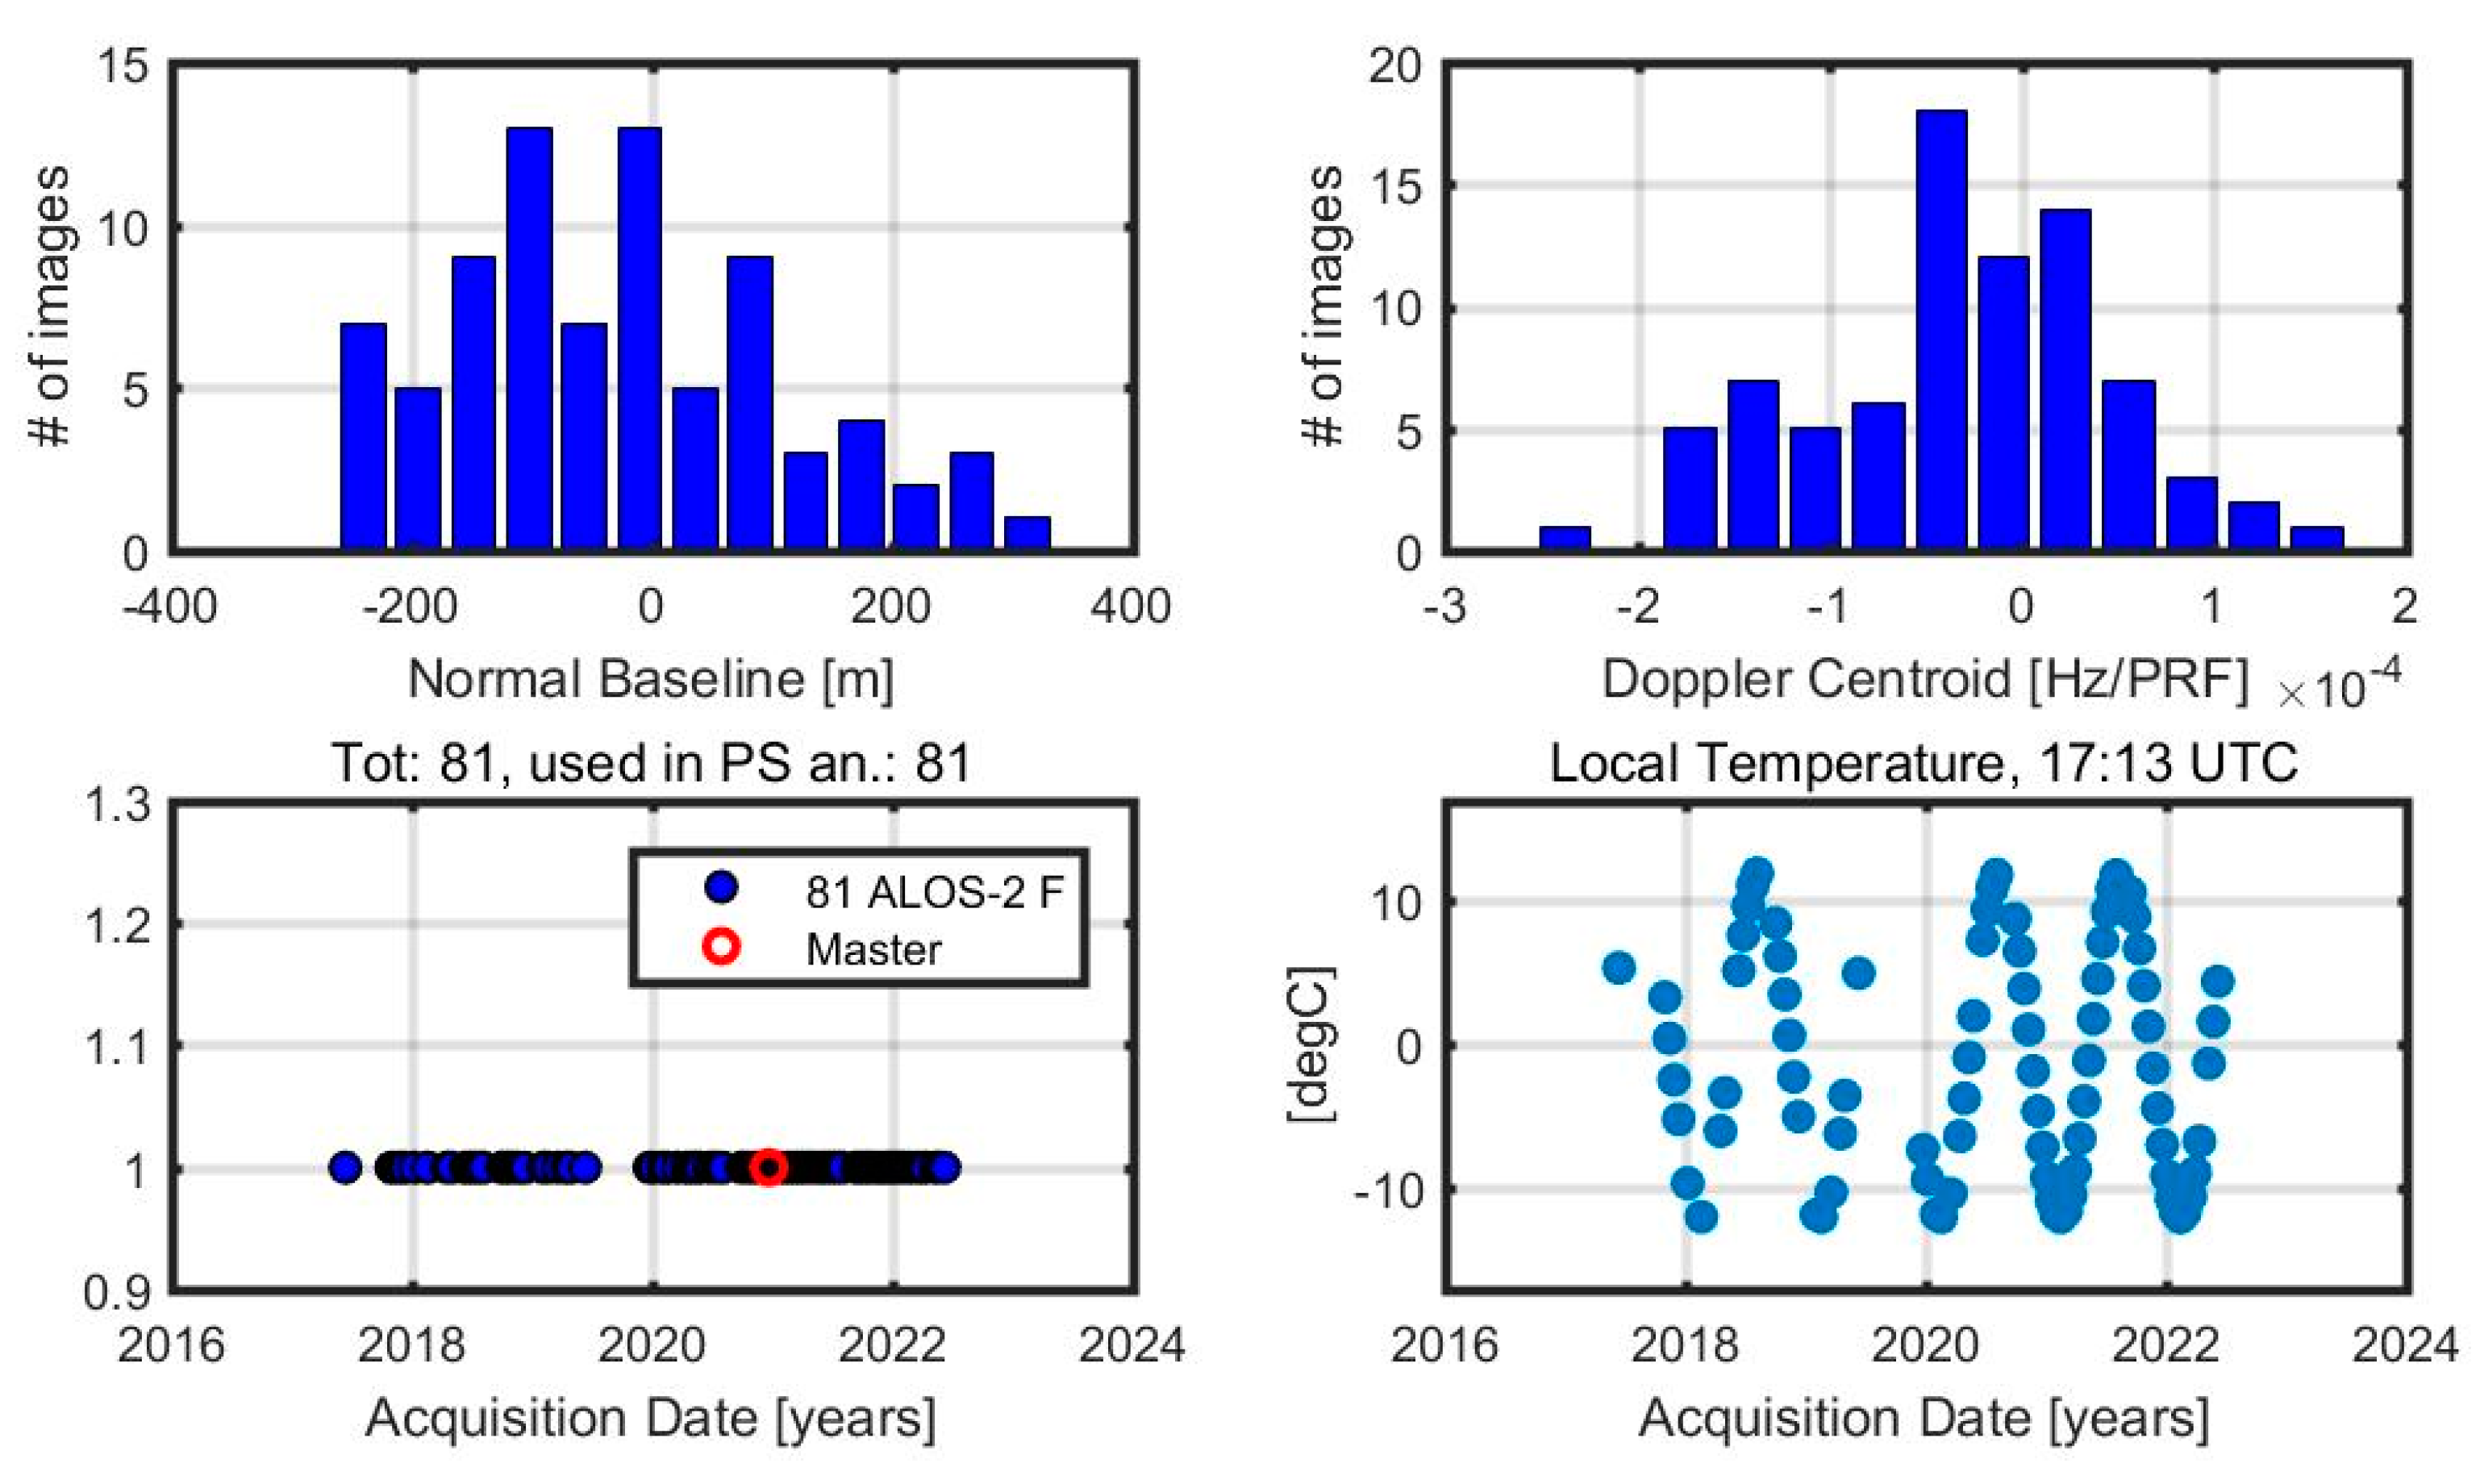
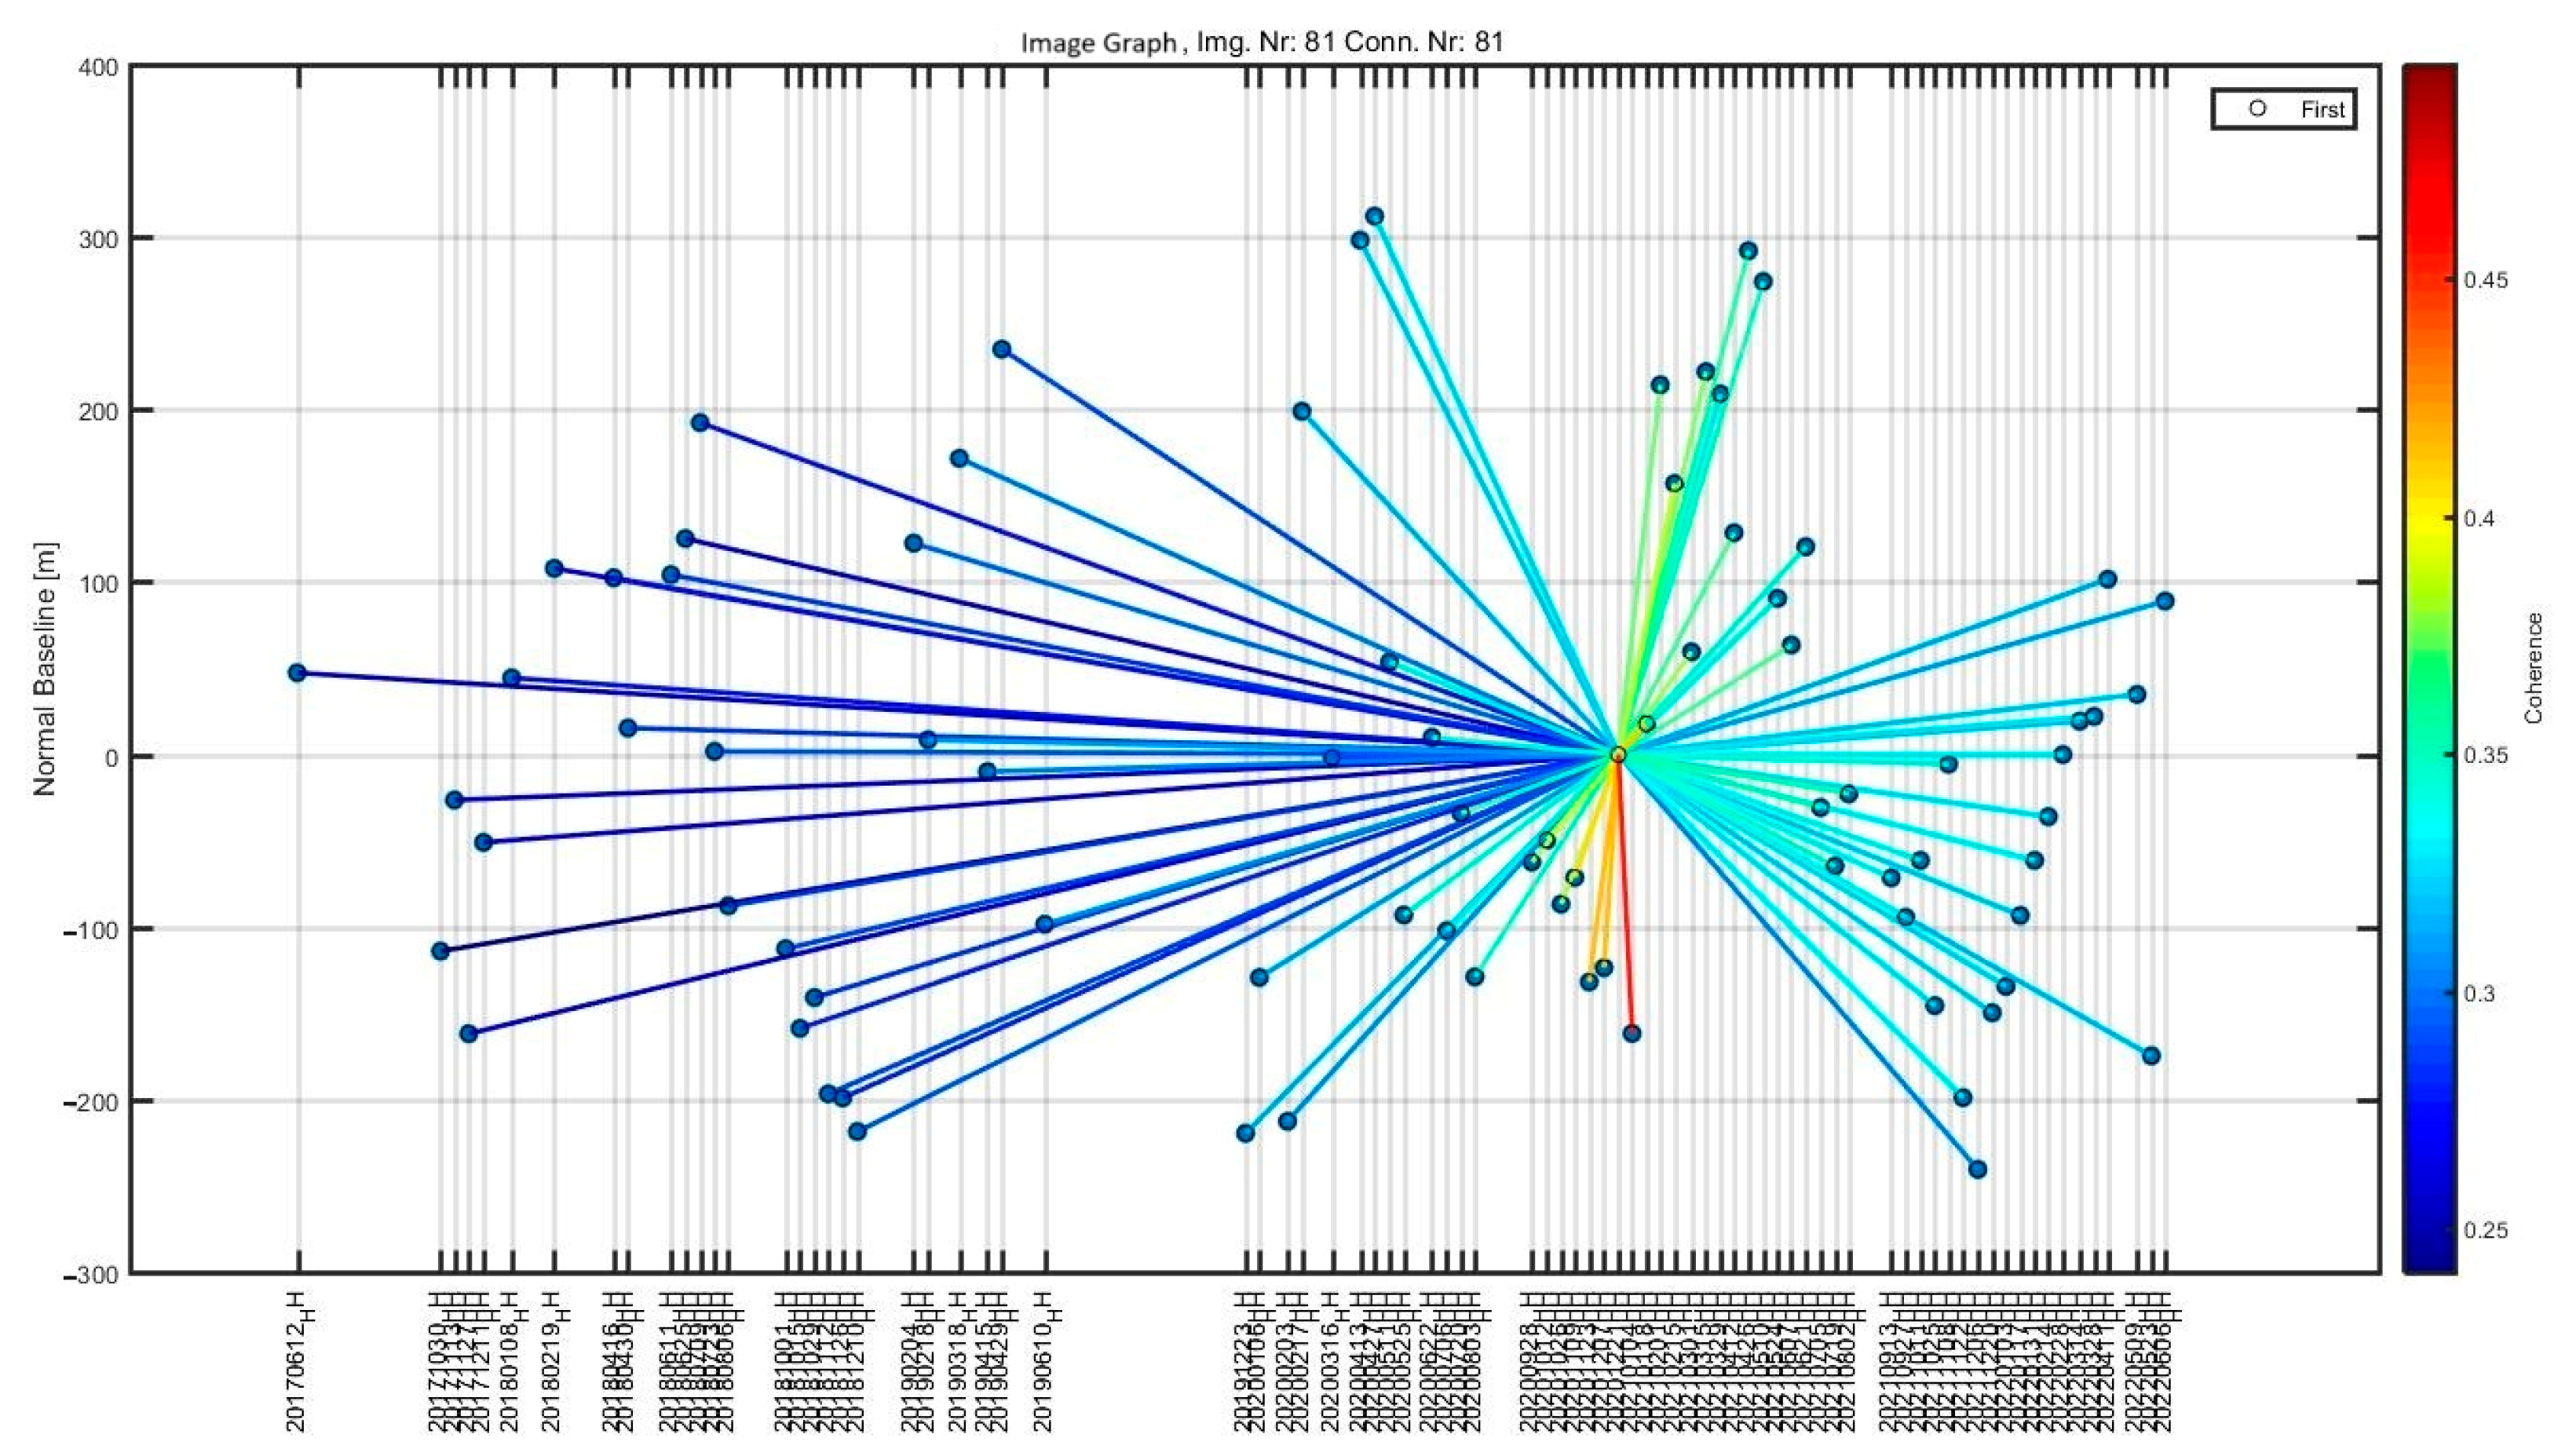
2.3.1. Data Preparation

Importing single-look complex data, as detailed in the Land Subsidence Mapping Material section, is the first step in data preparation. Interferometry requires images captured with consistent nominal geometry, of precisely the same orbit and incidence angle. Therefore, at the beginning, co-registration is carried out on the SAR images to ensure that the corresponding pixels in the two images represent the same portion of the imaged terrain.
We conducted network configuration between the master scenes and each of the slave scenes. The master images for the study were obtained first, followed by slave images that cover the same area as the master image. In this study, we utilized data obtained on 4 January 2021 as the master dataset and the others as the slave dataset. The slave images are aligned with the master image using precise orbits, which are obtained from satellite data in this study. This co-registration process ensures that corresponding pixels in the slave images match the pixels in the master image accurately.
This approach forms a star graph (on the right of Figure 2); each image is connected to form an interferogram with the master image, chosen at the barycenter of normal and temporal baseline distribution. Generally, reducing the normal baseline enhances the precision of land subsidence analysis. We consider the baseline normal distribution of all the data employed. From the upper left corner of Figure 2 on the left, in clockwise order, we show the histogram of the normal baselines, the histogram of the Doppler Centroids, the temperature at the acquisition time, and the sensors that acquired the data (ALOS-2 F).
The interferograms are sensitive to the topography of the observed area [86]. Thus, we performed further co-registration (co-registration refinement) using the National Digital Elevation Model (DEMNAS) data provided by the Indonesian Geospatial Agency (BIG), which was applied to the previous co-registered SAR images.

2.3.2. Interferometric Phase

The co-registered stack (SAR data that have undergone two rounds of co-registration) is utilized to generate the interferogram. The interferogram is derived from the interferometric phase, which represents the phase difference of radar waves reflected from the Earth’s surface and captured by the SAR sensor at two distinct times. The interferometric phase is composed of five components: flat terrain, elevation, potential displacement, atmospheric delay, and noise (Equation (1)) [86].
i , k p = i , k f l a t p + i , k h e i g h t p + i , k d i s p p + i , k a t m o p + η i , k p

2.3.3. Atmospheric Phase Screen Calculation

Once the interferogram is generated, the atmospheric phase screen is eliminated by utilizing a high amplitude stability index value, resulting in the production of coherent data. We eliminated the atmospheric phase screen by applying a high amplitude stability index (ASI), resulting in coherent data. Since PS-InSAR targets stable scatterers, known as persistent scatterers (PSs), with consistent phase history for precise long-term displacement monitoring, we also used the ASI to choose PS from the interferograms. In addition, we employed a Delaunay graph to establish links between scattered data points, guaranteeing a high degree of correlation for all connections.
Generation of land subsidence map
A time series dataset of land subsidence data was generated from the PS in either the KMZ or CSV format, and a map illustrating the extent of land subsidence in the Jakarta region was generated.

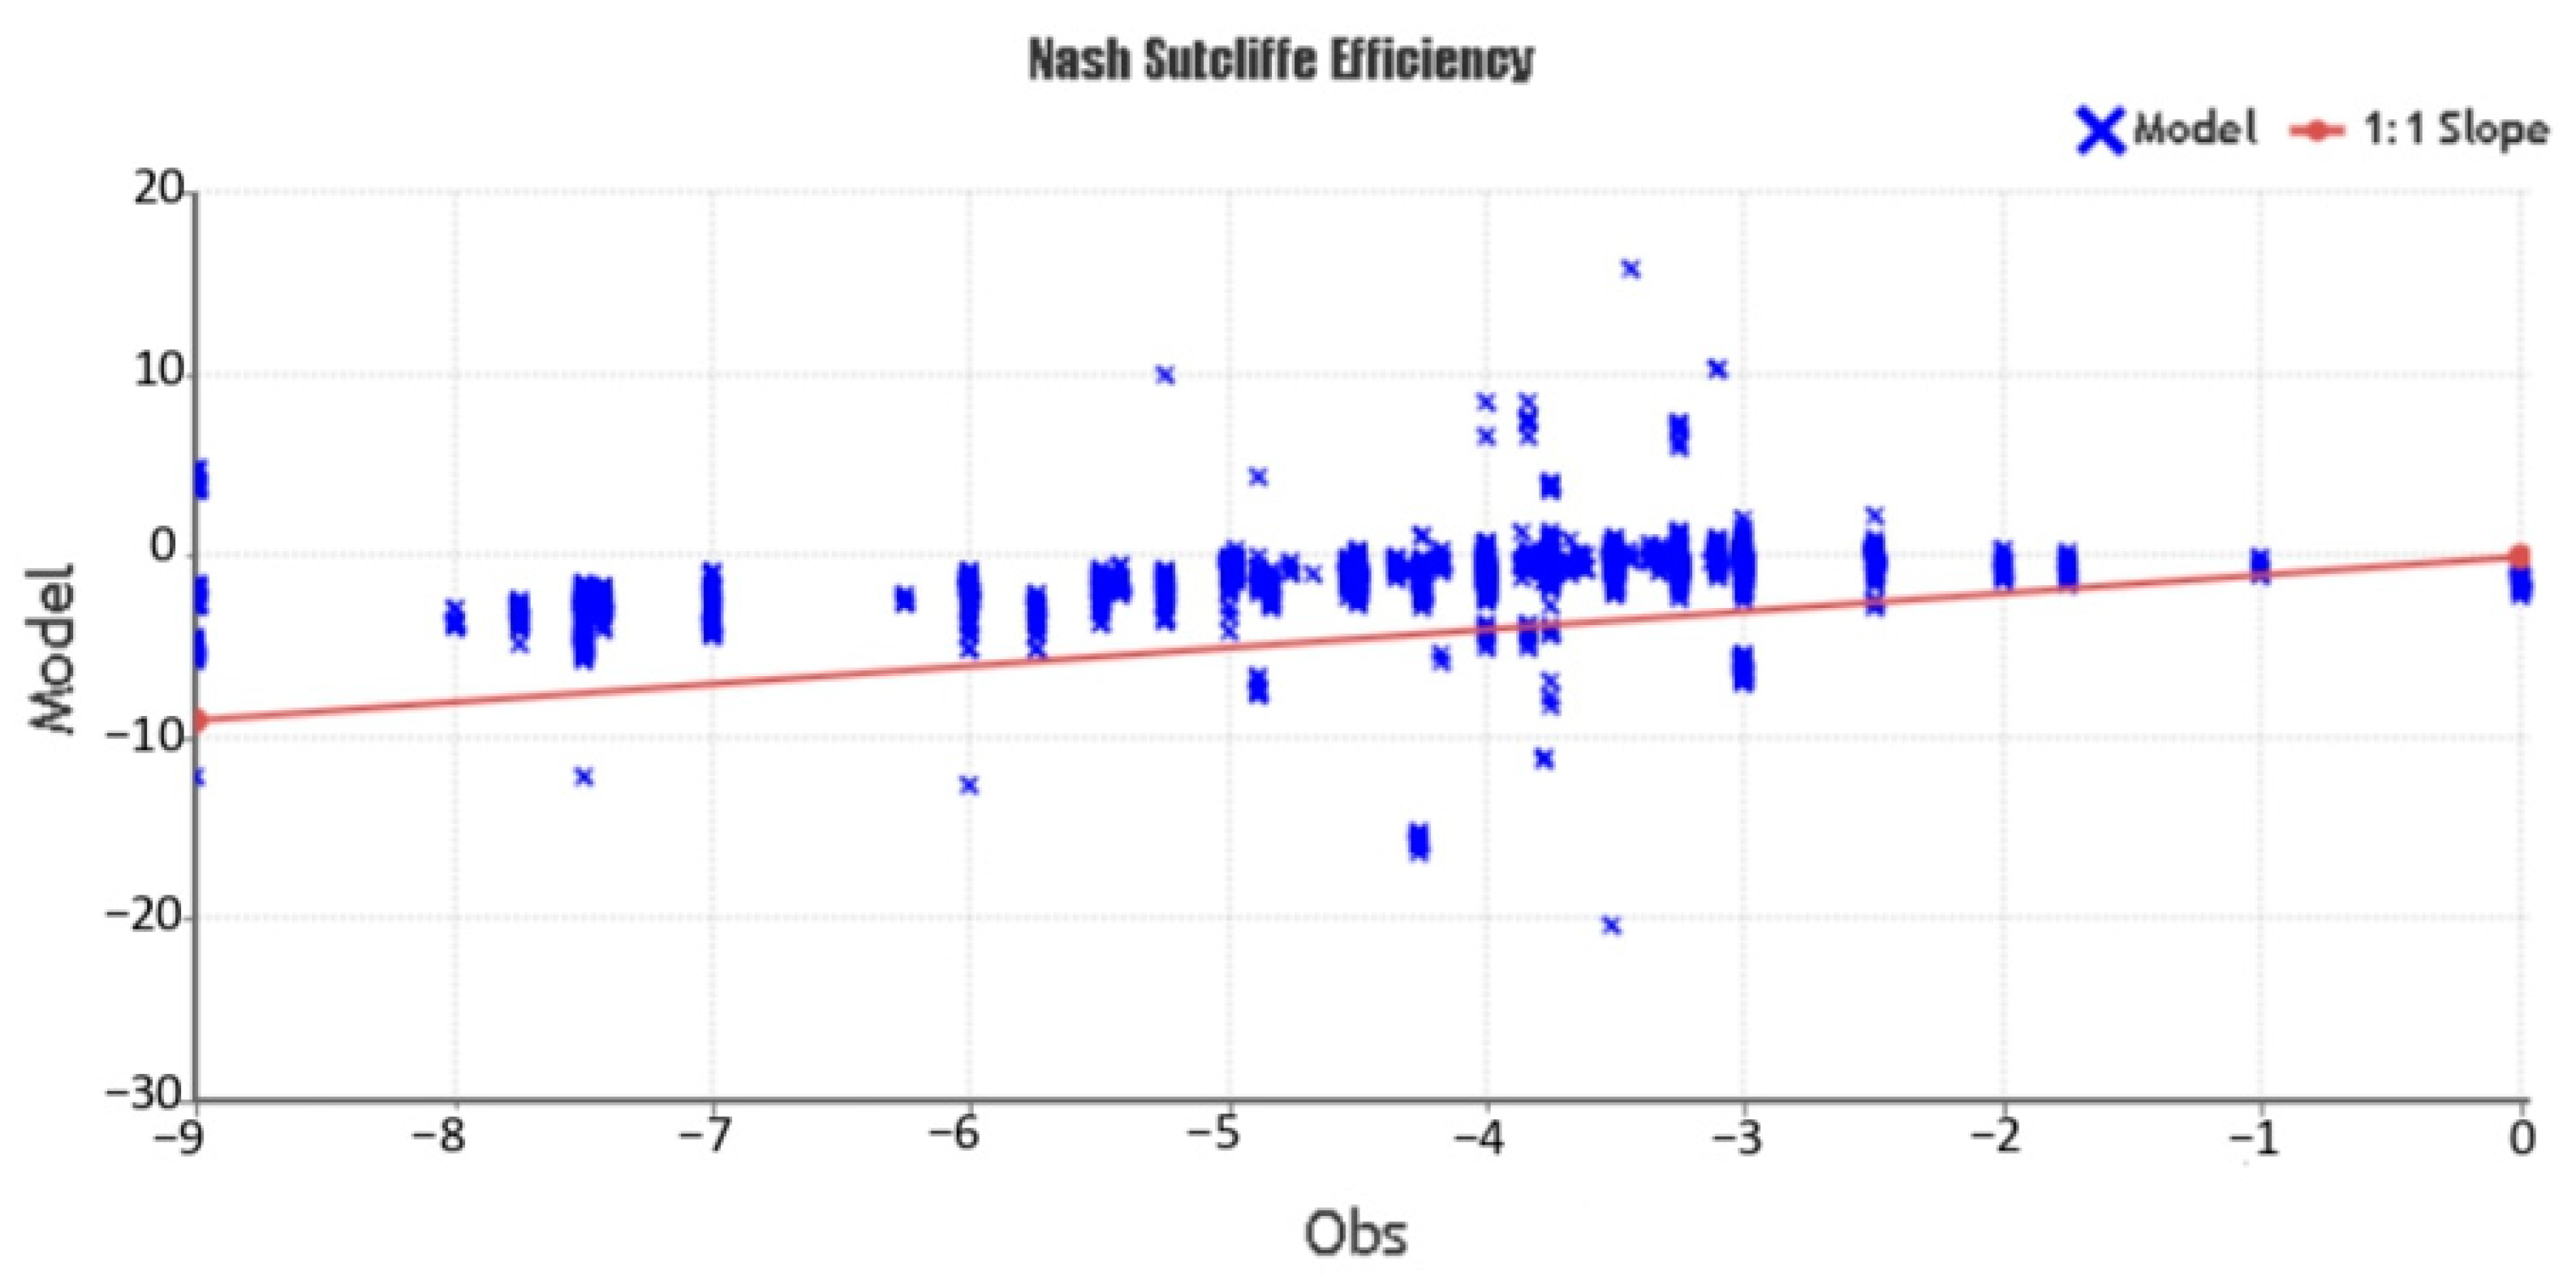
2.4. GNSS Validation

In this study, GNSS validation refers to the process of assessing and confirming the accuracy, reliability, and performance of PS-InSAR data through validation with Global Navigation Satellite System (GNSS) data. GNSS validation for this research was executed through GPS RTK surveys conducted in 2021, involving X, Y, and elevation of 255 points strategically distributed across the province. A GPS real-time kinematic (GPS RTK) survey is a precise and advanced surveying technique that utilizes global positioning system (GPS) technology to provide highly accurate real-time positioning information. Meanwhile, the PS-InSAR data consist of 14,800 PS points derived from the ASI analysis (see Data Processing section). The collected data underwent rigorous sub-setting to be validated with GNSS data. PS-INSAR data were scrutinized using near analysis with a 100 m buffer from GNSS data.
Subsequently, the GNSS and a subset of PS-InSAR data derived from the near analysis were evaluated using the Nash–Sutcliffe efficiency (NSE) matrix. The NSE, a normalized statistical measure, quantifies the relative magnitude of residual variance compared to the measured data’s variance [87]. The Nash–Sutcliffe efficiency serves as a crucial indicator, gauging the fidelity of the plot representing observed versus simulated data concerning the 1:1 line. An NSE value of 1 signifies a flawless alignment between the PS-InSAR model and GPS RTK data, while an NSE value of 0 suggests that the PS-InSAR model is as accurate as the mean of the GPS RTK data. For NSE values below 0, the observed mean emerges as a more reliable predictor than the model itself. The model is defined as follows (Equation (2)):
N S E = 1 t = 1 T ( Q o t Q m t ) 2 t = 1 T ( Q o t Q ¯ o ) 2
Q ¯ o represents the mean of the observed discharges, while Q m signifies the modeled discharge. Q o t denotes the observed discharge at time t . Table 1 shows the detailed properties and values of the - N S E .

2.5. Time Series of Domestic Water Needs Mapping and Analysis

To comprehensively evaluate the governor’s regulation on groundwater-free zones, we incorporated an analysis of domestic water needs into the research process. The methodology employed in this section is rooted in SNI No. 19-6728.1-2002 [89], a standard issued by the Indonesian National Standardization Agency (BSN) that focuses on developing resource balances, particularly in reference to domestic water needs. The study framework integrates key components from the standard to establish a comprehensive method for utilizing the total population as a metric to measure domestic water requirements obtained from the Statistics Agency of Indonesia (BPS) with the following formula (Equation (3)).
Q = 365   d a y s   × 120   l × P ( u )
The initial phase systematically gathers data on the entire population, denoted as P ( u ) . An essential component of this process is determining the urban population’s annual per capita water consumption, which is set at 120 L and plays a critical role in assessing the overall domestic water requirements in urban areas such as Jakarta ( Q ) . Historical data on individual water consumption are thoroughly examined, establishing a foundational framework for estimating individual water needs. These estimates are then visualized using ArcGIS Pro 3.4 to analyze the domestic water needs of each city. Domestic water needs, subsidence, and groundwater-free zone maps were overlaid and imported into a Geographic Information System (GIS) to assess the position of DWNs in relation to land subsidence and groundwater-free zones.

2.6. Analysis of the Groundwater-Free Zone Regulation

The land subsidence map and groundwater-free zone from the Governor Regulation of DKI Jakarta were overlaid and imported into Geographical Information System (GIS) software for the regulation analysis. The GIS investigation involved merging PS-InSAR results with groundwater-free zones and domestic water needs to assess the detected subsidence zones. These layers were used to determine the effectiveness of the designated groundwater-free zones in the governor regulation and their impact to address the complex issue of land subsidence in the research area. The findings from this assessment serve as the basis for proposing a judicial review initiative.
The primary objective of judicial review, encompassing both material and formal aspects, is to assess the legitimacy and effectiveness of legal outcomes generated by the legislative, executive, and judicial branches when confronted with higher-level laws and regulations in the hierarchy. The material aspect does not directly shape the law if not formally acknowledged by the legal system. Conversely, the formal element is a recognized source within the legal system capable of directly establishing legal provisions.
In Indonesia, the judicial review process is conducted by two legal enforcement bodies, namely the Constitutional Court (MK) and the Supreme Court (MA), each with distinct spheres of authority. The Constitutional Court holds the power to conduct judicial reviews of laws in the 1945 Constitution. In contrast, the Supreme Court is empowered to conduct judicial reviews of statutory regulations beneath the laws. Nonetheless, this study is an integral part of every citizen’s entitlement to submit a judicial review initiative, allowing individuals who perceive deficiencies or harms in applicable laws and regulations to address them, as stated in Constitutional Court Regulation Number 2 in 2021 on the Procedural Steps Involved in Cases of Judicial Review.
We recommend new groundwater-free zones in Jakarta based on the findings from the policy evaluation. We used the velocity intensity from PS-InSAR procedures during 2017–2022 as a parameter to describe the intensity of land subsidence and total DWNs in Jakarta. According to the rule, the higher the intensity of land subsidence and DWNs, the higher the recommendation for the area to be designated as a GFZ. We performed classification and scoring for these two parameters. PS points with high scores are identified as areas with strong recommendations for GFZ designation.
The research flowchart is shown in Figure 3.

3. Results

3.1. Land Subsidence Analysis

3.1.1. Atmospheric Phase Screen (APS) Calculation

The ultimate result of the high temporal correlation of PS points, derived from the atmospheric phase screen removal results, has an average value greater than 0.8. The coherence graph after atmospheric correction is shown in Figure S1. The final interferograms are shown in Figure 4.

3.1.2. The Second Selection of PS Points

An ASI threshold of >0.85 was applied for the second selection of PS points. The same criteria used to estimate the APS in the previous stage were employed to remove the APS. Finally, the PS points were imported into GIS software to generate the subsidence map.

3.1.3. GNSS Validation

GNSS validation revealed a robust NSE modeling result of 0.8 in the context of monitoring land subsidence (Figure 5). This noteworthy outcome is based on integrating 168 data points, incorporating GPS RTK and the selected PS points from the previous stage (Figure 6). The high NSE value underscores the effectiveness of the PS-InSAR model in accurately depicting the complex processes associated with land subsidence. Including diverse datasets enhances our analysis’s comprehensiveness, showcasing the model’s reliability across various monitoring techniques.

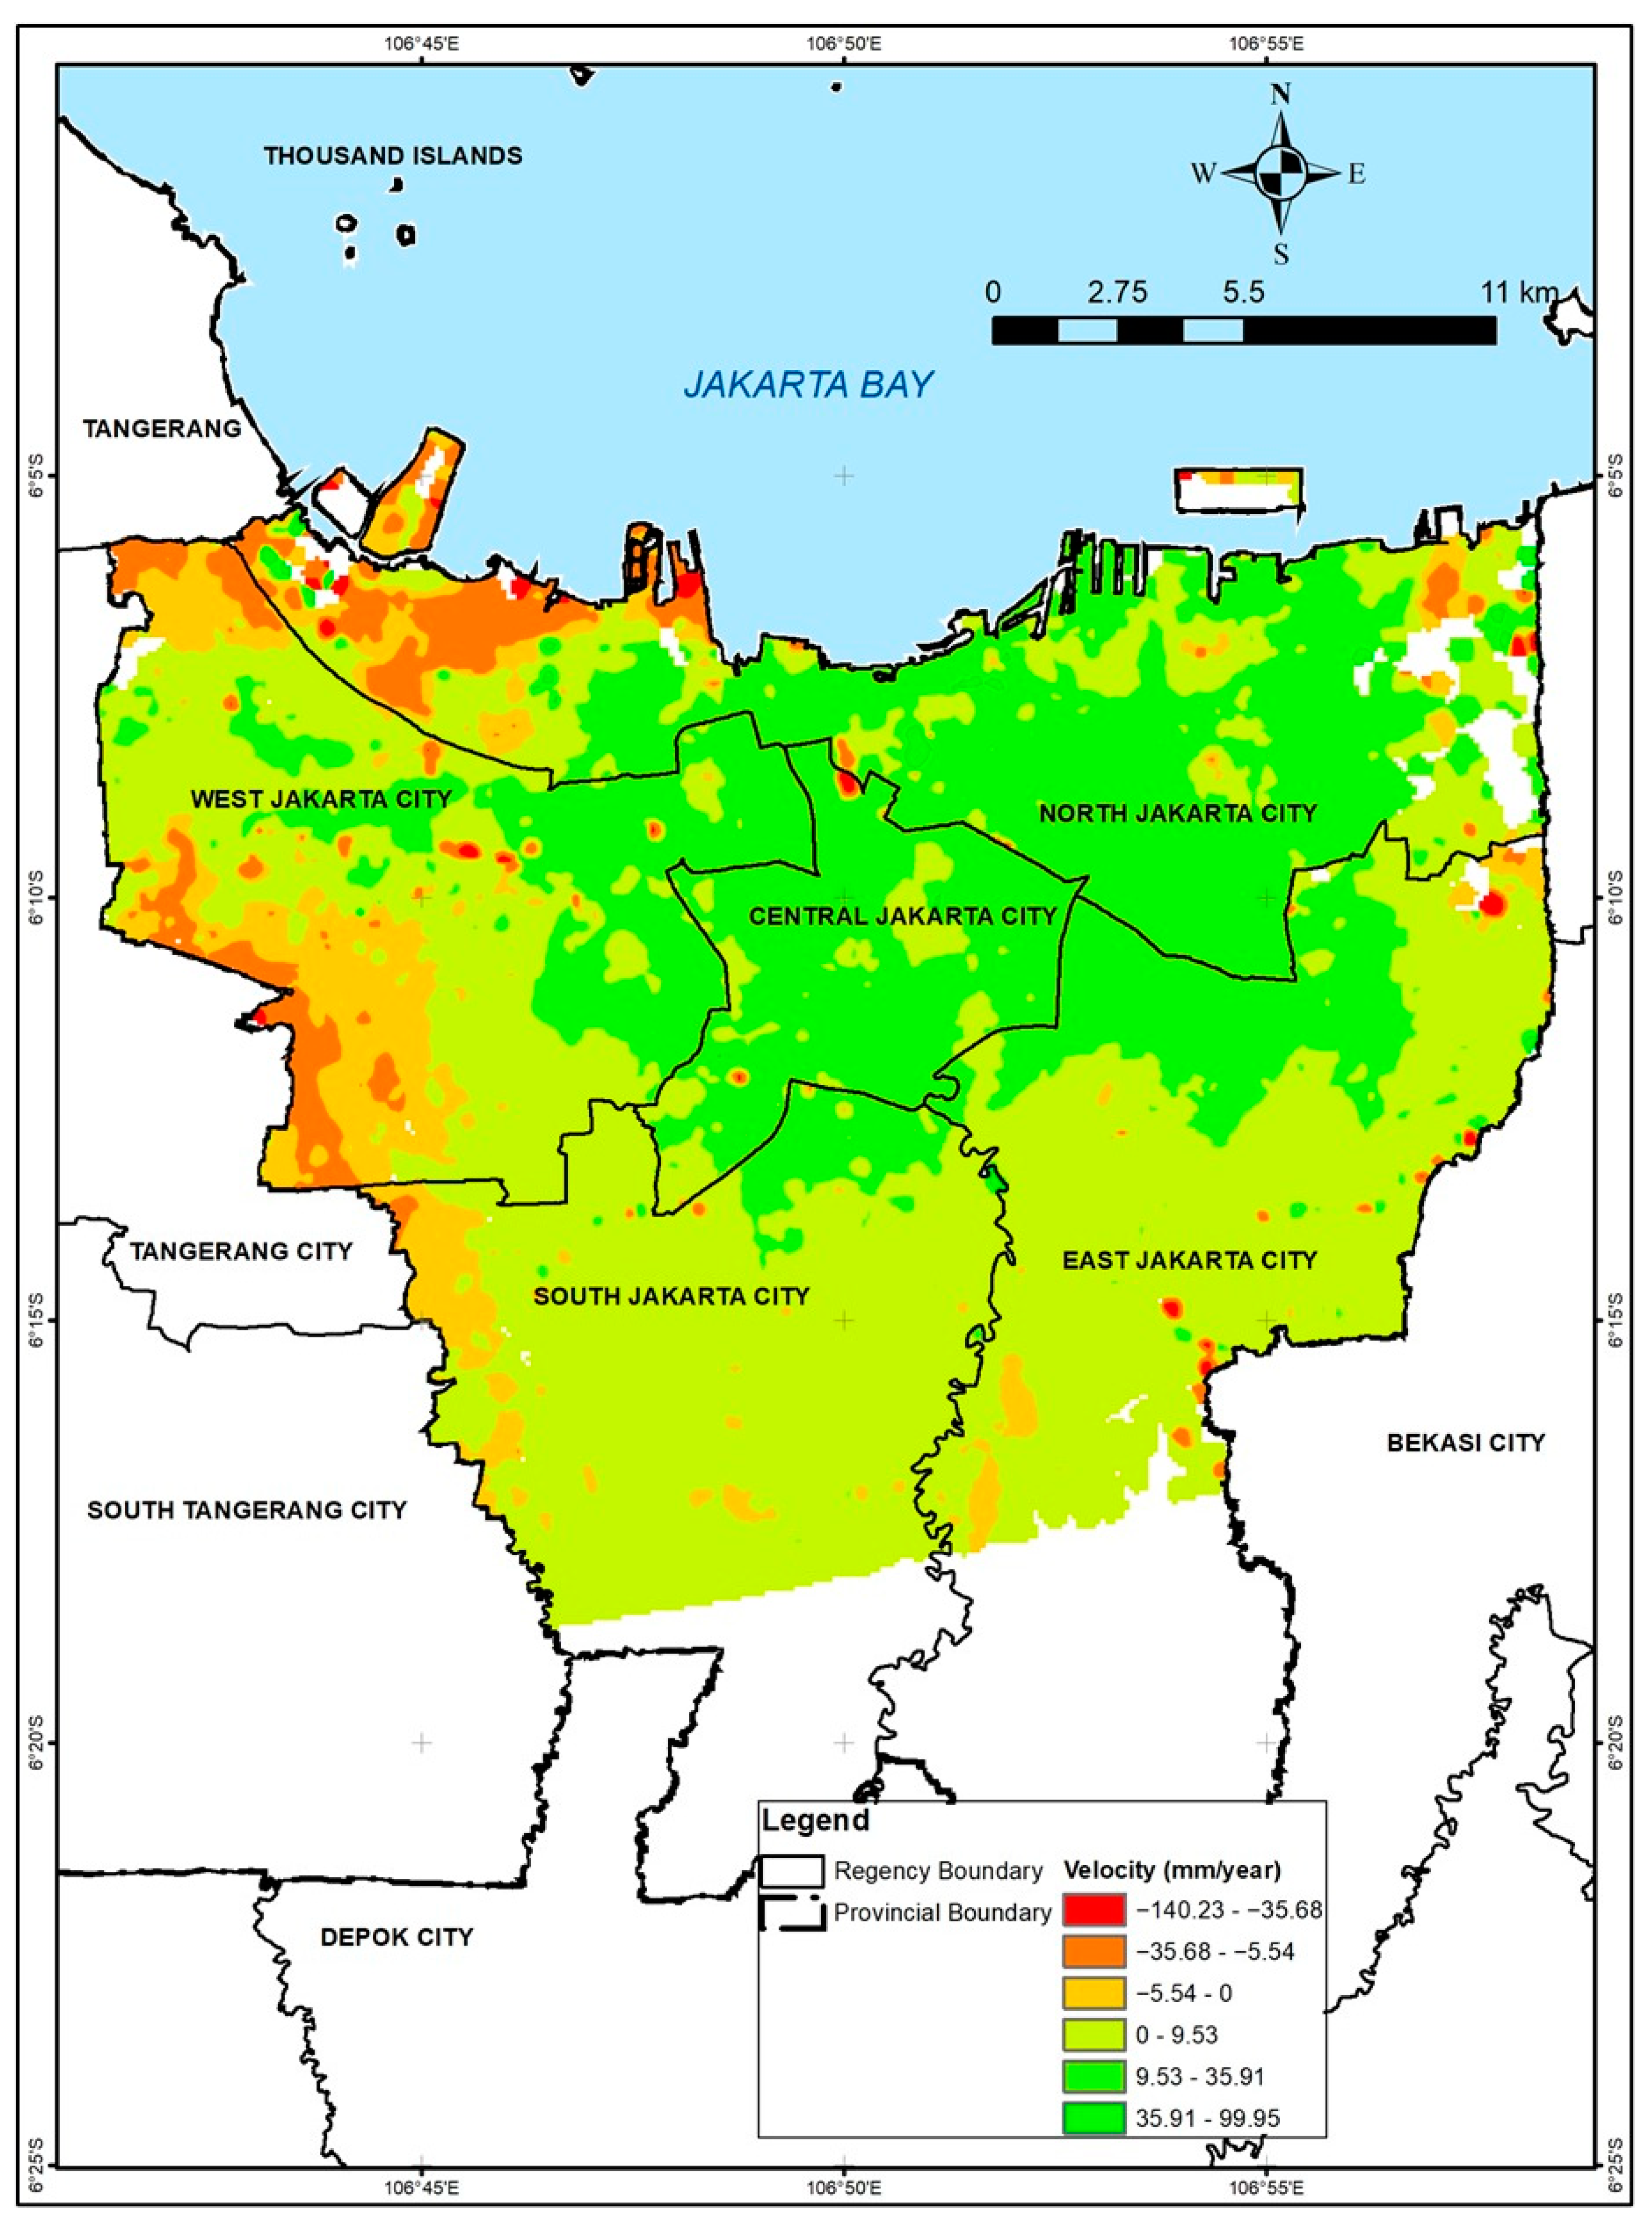
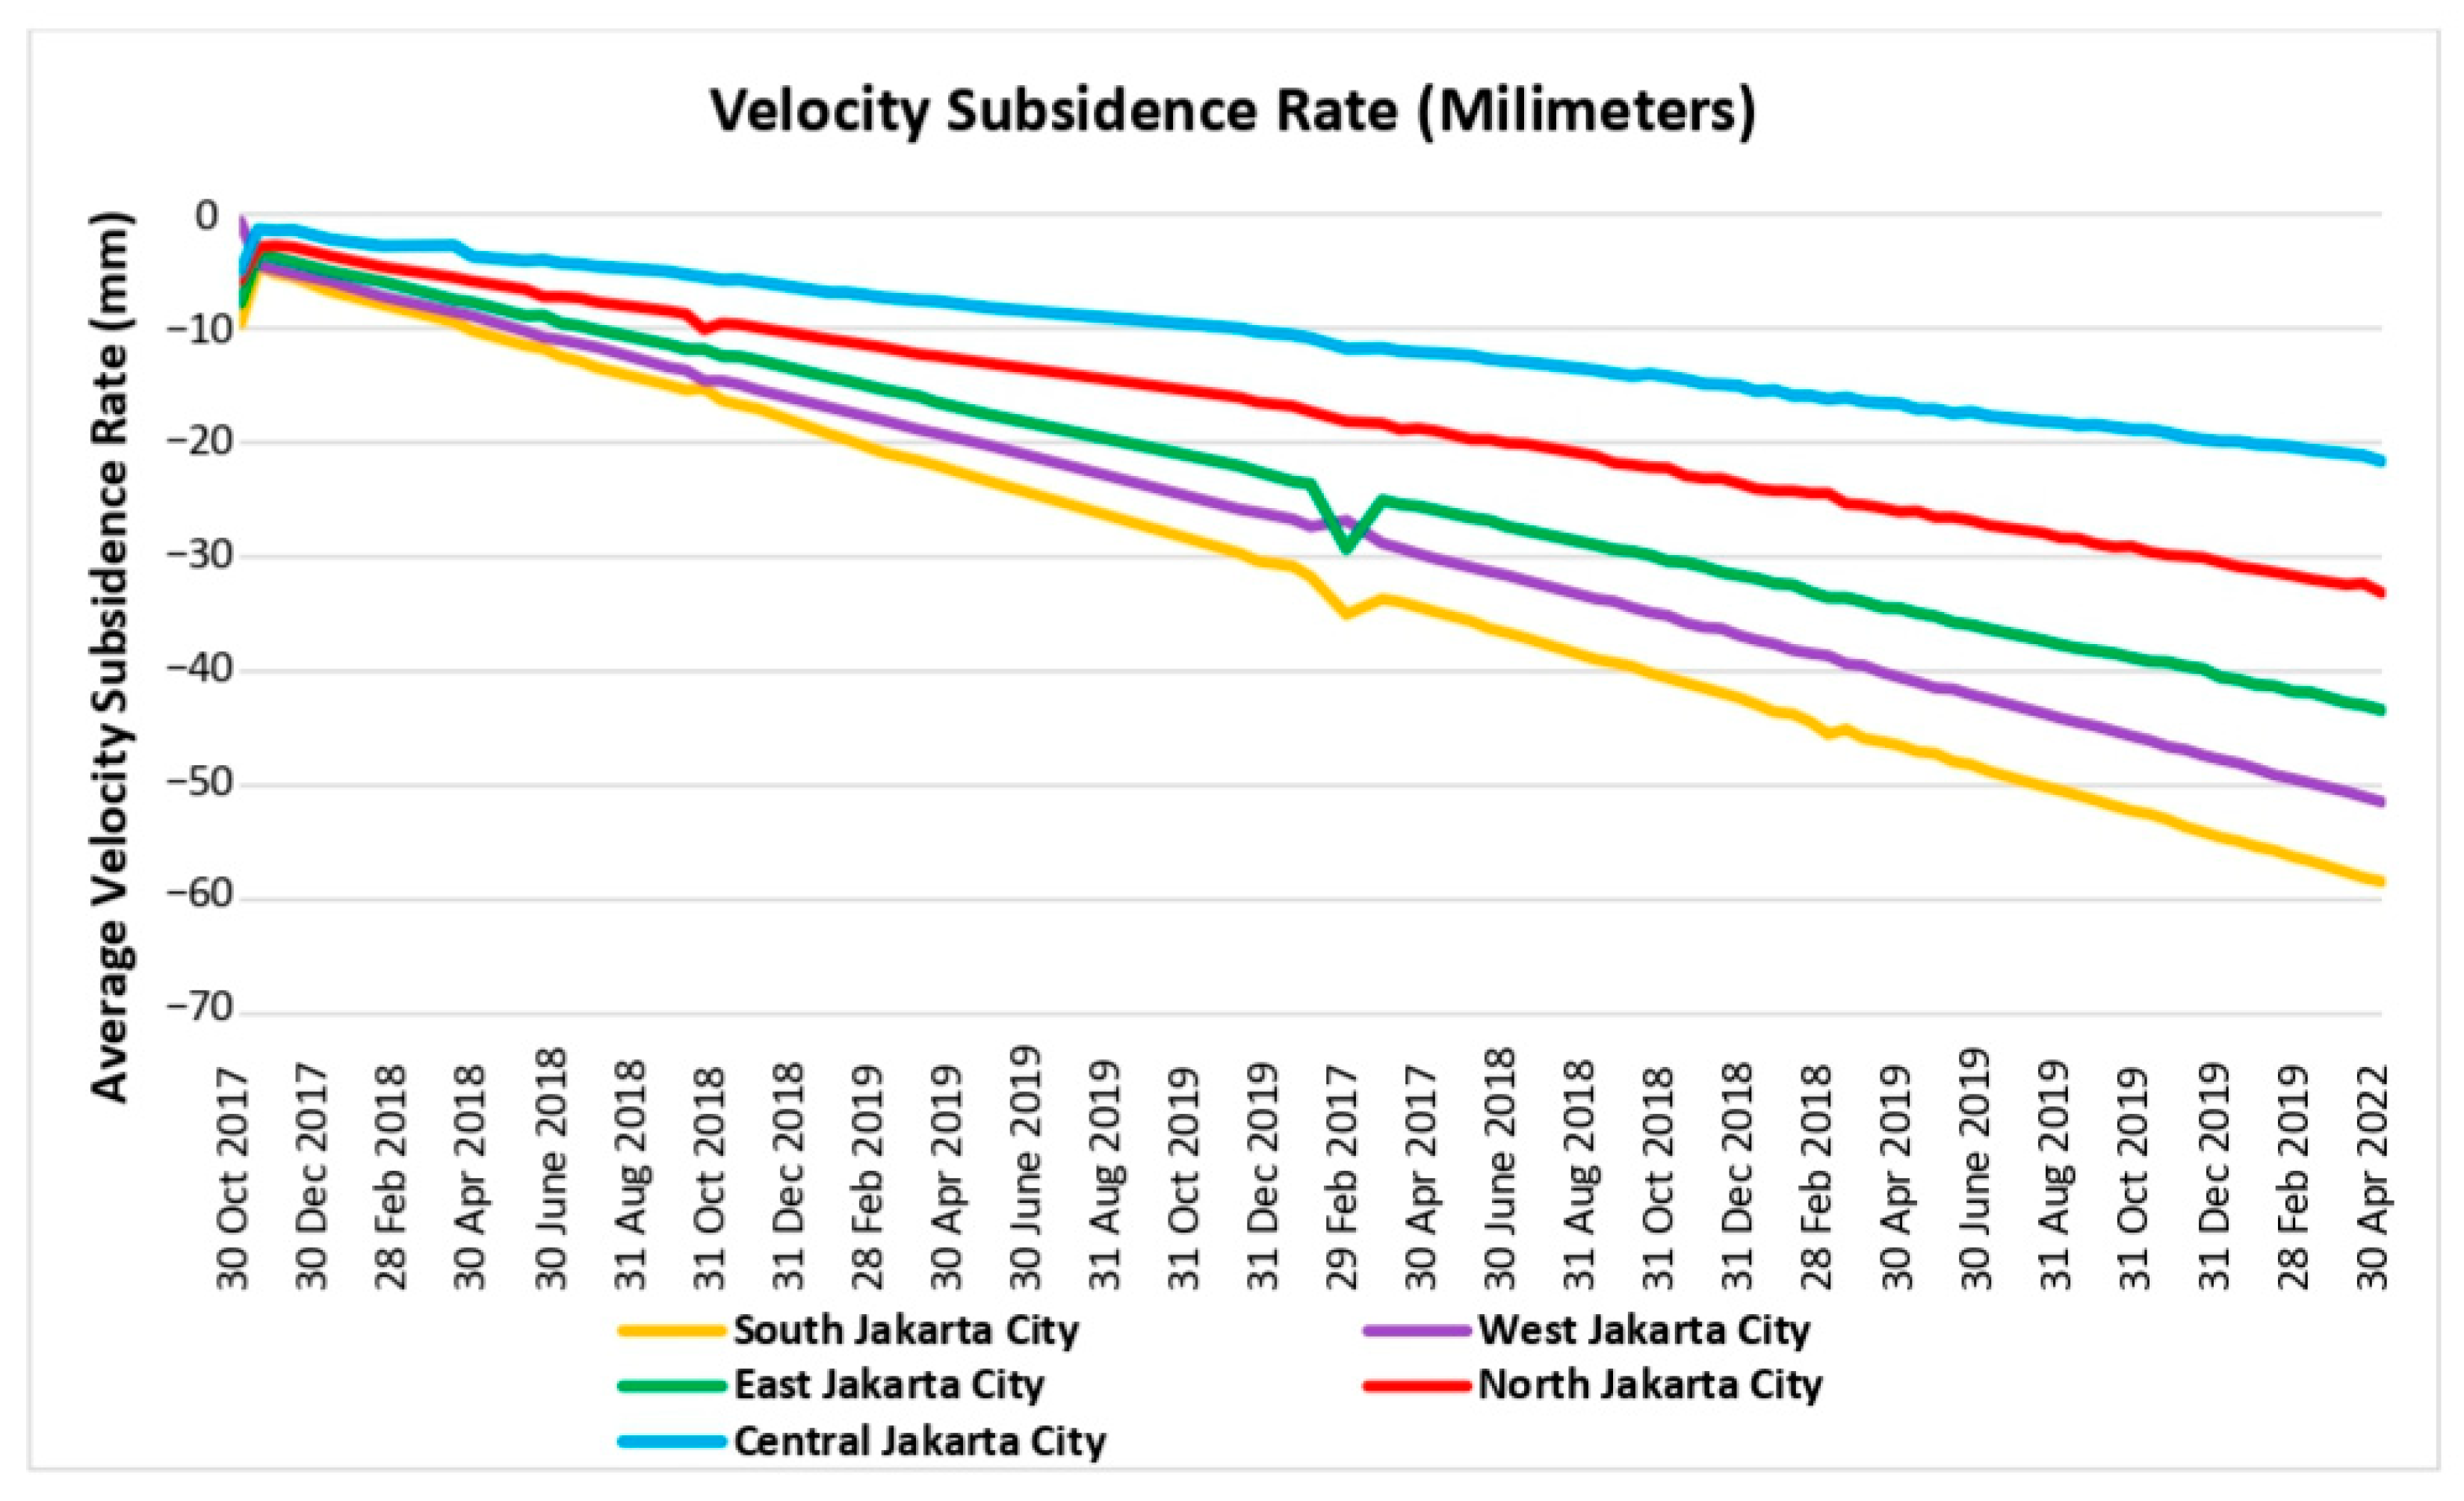
3.1.4. Land Subsidence Mapping

We generated a land subsidence map of Jakarta, illustrated in Figure 7, by importing 14,800 PS points into GIS software. This map, covering the period from 2017 to 2022, highlights the areas in Jakarta that have experienced significant subsidence, expressed as subsidence velocity (mm/year) indicated by a red to green color gradation. Red to orange represents land subsidence between −140.23 and 0 mm/year, while yellow to green indicates a land increase between 0 and 99.95 mm/year. The spatial distribution of land subsidence occurs mainly in the administrative areas of West Jakarta and North Jakarta.
The average of subsidence rates varies across the city, with some areas experiencing more severe impacts than others (Figure 8). South Jakarta Administration City has the highest average of subsidence during the observed period, with a maximum of −60 mm. Figure 8 also shows a continuously increasing subsidence velocity from year to year (2017–2022) across each city in Jakarta.

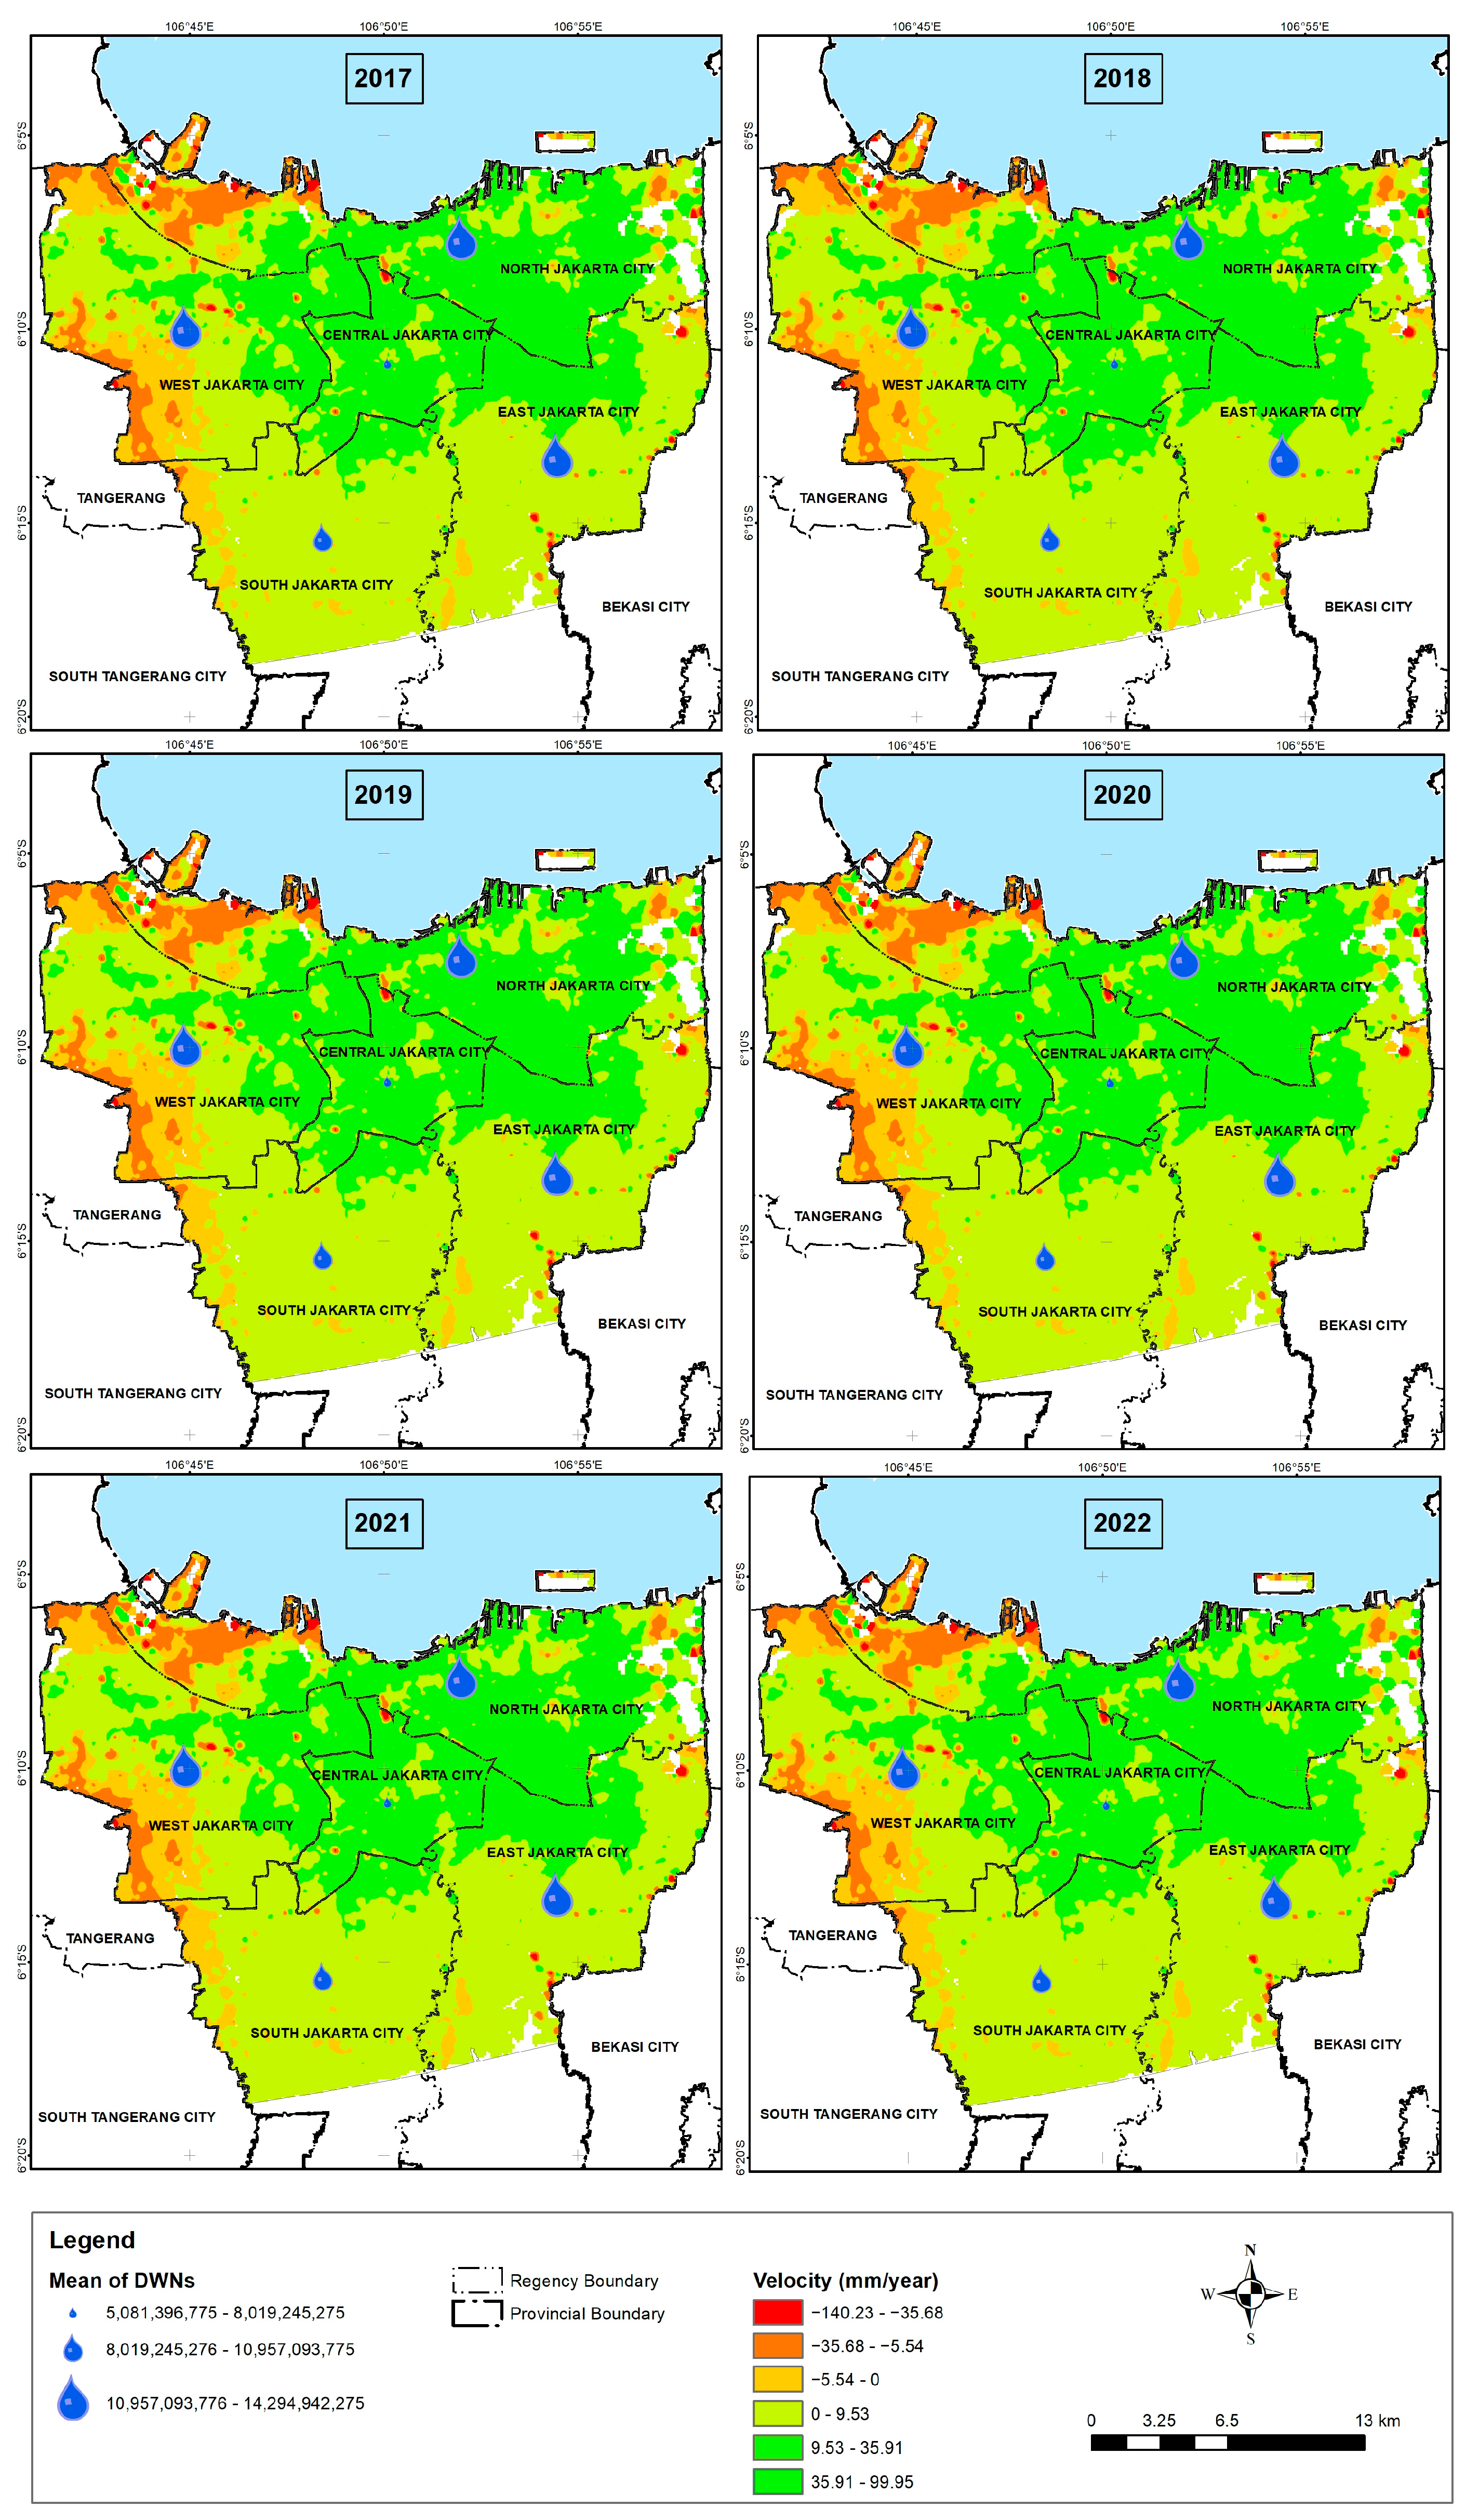
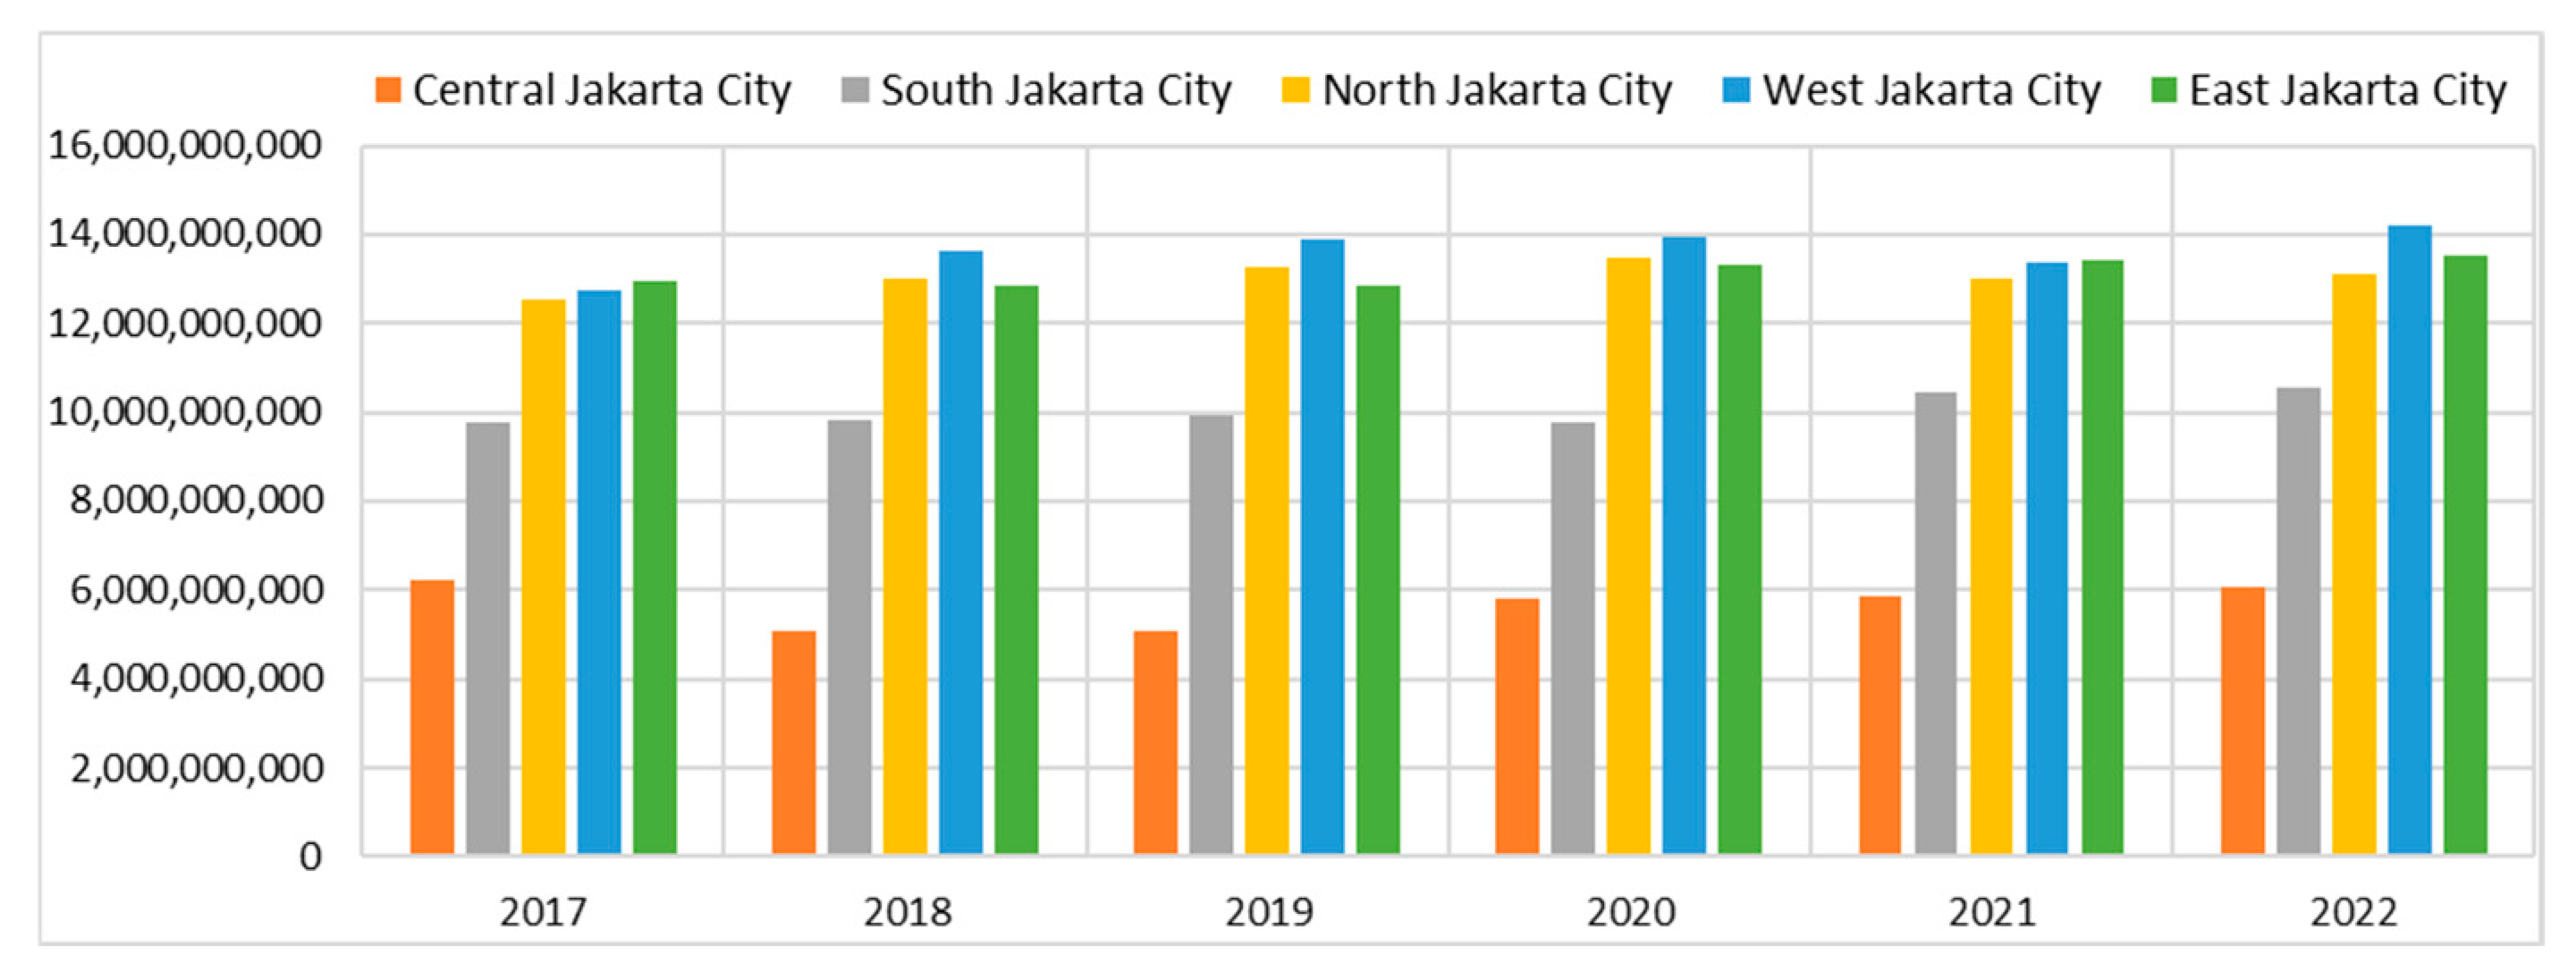
3.2. Domestic Water Needs

The analysis of domestic water needs in the research area, utilizing data from the Statistics Agency of Indonesia over a period of 6 years from 2017 to 2022, revealed a significant trend (Figure 9). Regions with lower domestic water needs are concentrated in the central area, marked by a vibrant business hub characterized by high-rise buildings and a relatively sparse distribution of residential housing. This reduced concentration of domestic water needs in the central business area indicates a distinctive dynamic where commercial and industrial activities take precedence over residential demands. However, it is concerning that domestic water needs are highest in the areas experiencing the most severe land subsidence, specifically in North and West Jakarta (Figure 9 and Figure 10). The analysis reveals a notable pattern of ground-level sinking, primarily in regions heavily urbanized and subjected to extensive groundwater extraction. The high demand for domestic water creates a significant incentive for groundwater extraction, recognized as a major contributor to land subsidence [17]. This situation could exacerbate the subsidence problem further.

3.3. Analysis of the Groundwater-Free Zone Regulation

This study aims to evaluate the effectiveness and impact of the governor of Jakarta’s regulation on establishing groundwater-free zones (GFZs) to address the complex issue of land subsidence. For this objective, we employed GIS analysis. Upon overlaying the GFZ with the land subsidence map, the GIS analysis reveals that the GFZ is not situated in a region experiencing significant land subsidence (Figure 11). Instead, the GFZ is located in an area undergoing land uplift (Central, South, and East Jakarta). The governor’s regulation is unclear and prompts questions about why the GFZ has been established in an area experiencing land uplift. Regardless, a pressing need remains to address severe land subsidence in other parts of Jakarta. Since the regulation was enacted, there has been no effort to extend the GFZ to these more affected areas. Additionally, when overlaid with the DWNs, the GFZ is mainly found to be situated in an area with low DWN levels (Central and South Jakarta, as shown in Figure 11).
The GIS analysis at this stage revealed two key findings. First, the GFZ is not situated within the identified subsidence zone. Second, the GFZ is centered around business activities with low DWNs, overlooking the fact that the highest DWN is located in areas of severe subsidence (Figure 9). These findings suggest that the occurrence of land subsidence appears to deviate from the regulations established in Governor Regulation Number 93 of 2021 on groundwater-free zones. Regulatory measures to address land subsidence have not yet been clearly defined.

3.4. Recommendation for New Groundwater-Free Zones in Jakarta

Considering our technical analysis, which found that GFZs are not located in severe subsidence areas and are not in regions with high DWNs, we created recommendations for some areas in Jakarta to be considered as designated GFZs in the governor’s regulation (Figure 12). We successfully compiled recommendations for areas to be used as GFZs in Jakarta, ranging from low to high recommendations, as shown in Figure 12. North Jakarta and West Jakarta are the two areas with the highest numbers of high- and medium-recommendation areas compared to other areas. We anticipated these results because our time series land subsidence analysis in Jakarta (see the section Land Subsidence Mapping) reveals that North and West Jakarta are the two areas experiencing the most severe land subsidence (Figure 7). The total area with GFZ recommendations per city can be seen in Figure 13.

4. Discussion

Based on historical evidence, the land subsidence leading to the submergence of certain areas in Jakarta appears to be a natural phenomenon, particularly since these submerged regions were formerly associated with bodies of water [90,91,92]. In Indonesia, the names of geographical locations often reflect their physical characteristics. Thus, it can be inferred that these areas were previously marshlands prone to frequent flooding. Satellite data analysis, such as PS-InSAR in this study, confirms ongoing land subsidence in these regions (see Figure 7 and Figure 9).
According to the principle of geomorphology, which suggests that past processes shape current landforms, it is reasonable to anticipate that the areas designated “crocodile swamp,” “duck swamp,” and “bokor swamp” will likely experience further inundation due to continued land subsidence and rising sea levels. Studies conducted from 1982 to 2010 show that land subsidence in Jakarta has spatial and temporal variations. There is a strong indication that land subsidence is caused by the excessive withdrawal of groundwater from the middle and lower aquifers, building/construction loads, and natural consolidation of sediment layers [64].
In conjunction with establishing a groundwater-free zone, as depicted in Figure 8 and Figure 10, significant reliance on Governor Regulation Number 93 of 2021 in groundwater-free zones by substituting groundwater usage with a non-groundwater supply is suggested. Notably, Central Jakarta, the economic center of the capital city, has already been equipped with comprehensive facilities for non-groundwater supply. This condition is the rationale behind designating the groundwater-free zone in this area, as mentioned in the introduction of the governor regulation. Non-groundwater supply facilities are needed in the identified subsidence area to implement the GFZ, as our technical analysis has shown that the current GFZ is not situated in a significant subsidence zone.
However, it is crucial to critically examine the designation of GFZs in the regulation because it may inadvertently accentuate ecological or environmental marginalization. Ecological or environmental marginalization refers to the unequal distribution of environmental resources, risks, and benefits, leading to the exclusion or disadvantage of particular communities or ecosystems. This phenomenon often results from socioeconomic factors, policy decisions, and historical patterns that disproportionately affect specific groups or regions [24,93,94]. While the emphasis on non-groundwater supply facilities is understandable from an economic standpoint, it raises concerns about the equitable distribution of environmental benefits and burdens. Placing the groundwater-free zone predominantly in the financial center may inadvertently neglect other regions or communities more vulnerable to the adverse impacts of land subsidence and groundwater depletion. Therefore, it becomes imperative to assess the broader environmental justice implications of such zoning decisions and explore avenues for a more inclusive and equitable distribution of the associated ecological measures.
The disadvantage of ecological or environmental marginalization is also indicated by the results of the time series analysis of land subsidence and domestic water needs (DWNs); a reevaluation of the groundwater-free zone is imperative due to the increased concentration of DWNs extending beyond the central area. The data derived from the Statistics Agency of Indonesia demonstrate a consistent upward trend in DWNs, highlighting the necessity of safeguarding the region against excessive pumping activities. Preserving the area from overexploitation is crucial for mitigating the adverse impacts of land subsidence, thereby emphasizing the importance of revisiting and potentially adjusting current policies about groundwater usage in the specified zone.
According to the time series PS-InSAR results from ALOS-2 PALSAR-2, Governor Regulation Number 93 of 2021 on groundwater-free zones, considering Regional Regulation Number 10 of 1998 addressing the Implementation and Taxation of Groundwater Utilization, currently lacks specific technical restrictions concerning groundwater usage. The delineations are currently limited to spatial demarcations for groundwater-free zones and do not seem to account for areas with land subsidence intensity or the distribution of groundwater lenses in Jakarta. Considering that land subsidence is explicitly mentioned in the introductory section of the gubernatorial regulation as a primary rationale, it is crucial to establish location limits tied to subsidence intensity. Moreover, it is imperative to consider the technical constraints associated with groundwater lenses, particularly given that Article 7 introduces a water balance information system requiring the quantifiable input and output of groundwater [95,96], including subsurface flow and groundwater flow, which are primary components of the groundwater supply that the governor regulation does not mention. Despite this, the gubernatorial regulation falls short in including specifics about groundwater lenses, even though such details are mentioned in the overarching regulation, specifically Government Regulation Number 43 of 2008 on Groundwater Article 8, concerning the criteria of the groundwater lens.
Furthermore, considerations about groundwater input and output underscore the importance of referencing the United States Geological Survey Circular 1186 regulation [97], which reveals that groundwater usage in the United States accounts for 8% of the nation’s groundwater system, equivalent to 77 billion gallons per day out of 1 trillion gallons per day. The regulation asserts that the current percentage is within a safe range. If Article 7 is deemed crucial, it implies a need to revisit the clauses outlined in Article 5 regarding the Groundwater Extraction Report. This article specifies information such as the volume of groundwater extraction, the volume of clean water taken through pipelines, the volume of wastewater discharge, and the volume of recycled and/or reused water. However, it fails to include details about groundwater volume within Jakarta’s groundwater lenses. This omission raises concerns, as the effective implementation of the water balance information system, as mentioned in Article 7, necessitates comprehensive reporting that encompasses all relevant aspects of water usage, including groundwater within the Jakarta groundwater lenses. Therefore, a thorough review and potential amendment of the clauses in Article 5 are warranted to ensure a comprehensive and accurate portrayal of water usage within the specified regulatory framework.
The analysis shows that Jakarta’s domestic water needs (DWNs) have increased annually, mirroring the rising trend of land subsidence. Notably, areas experiencing severe subsidence also exhibit high DWNs, indicating a positive correlation between groundwater extraction and land subsidence. This relationship highlights the significant influence of socioeconomic factors, such as population growth, on groundwater reliance and its impact on land stability. Our findings strongly justify policy adjustments, particularly in reinforcing groundwater management strategies. Establishing groundwater-free zones in severely affected areas is crucial to mitigating further subsidence and ensuring Jakarta’s long-term sustainability as a resilient urban center.
The findings of this study reveal that the designation of a groundwater-free zone did not align with the severe subsidence areas in West and North Jakarta. Therefore, urban planning in Jakarta must be developed to mitigate land subsidence in those areas. As groundwater extraction and building loads have been identified as the leading causes of subsidence [22,23,25], planning should establish groundwater conservation zones and enforce strict regulations for new constructions. Limitations on groundwater extraction should be applied in conservation zones, and restrictions on high-rise buildings, which are commonly used for commercial and industrial purposes, should be implemented. Moreover, determining building height based on soil characteristics and the subsidence rate of a particular area can yield beneficial impacts in addressing subsidence.
For cases that cannot be mitigated, due to either social difficulties (for instance, an agreement between policymakers and developers could not be reached) or financial reasons (e.g., mitigation costs are too high), an adaptation strategy should be considered. These strategies include reducing the vulnerability of certain assets to the negative impacts of subsidence by permitting new constructions in areas with supportive soils that have high resistance to building loads.
Combating land subsidence means that residents cannot heavily rely on groundwater resources for their water needs. Thus, the city should be equipped with non-groundwater supply facilities. For instance, the construction of dams in several river basins for water resource development and distributing the water through pipelines to built-up areas should be prioritized. To ensure the sustainability of dams, public authorities need to maintain them so they remain functional for an extended period. Furthermore, concerning subsidence, the distribution pipelines should be installed far from subsidence-prone areas. In addition, as subsidence zones experience a high level of land deformation, flexible pipes should be utilized so they can deform along with collapsing soil. As a result, the pipeline structures will be less susceptible to damage.
Mitigating land subsidence is not an insurmountable challenge, as successful examples do exist. In Tokyo, groundwater levels began to rise after groundwater use restrictions were imposed in the early 1960s. Consequently, subsidence completely stopped 10 years after groundwater recovery began [29]. In response to groundwater restrictions, dams were built to provide an alternative water supply. Shanghai is another example of a city that has successful groundwater management and utilizes active recharge techniques [98]. These techniques helped prevent further declines in groundwater levels and limited subsidence. Although they did not completely eliminate the effects of subsidence on buildings and infrastructure, the objective of reducing subsidence was successfully achieved. In Bangkok, the areas most affected by subsidence were designated as critical zones under the Groundwater Act. Charges for groundwater usage were implemented in these zones. As a result, the rate of subsidence significantly declined to 1 cm yr−1 in urban areas [29]. These cases demonstrate that with well-implemented policies, strict groundwater regulations, and sustainable water management strategies, cities can effectively mitigate land subsidence and reduce its long-term impacts.
The governor’s regulation also fell short in adjusting the location of the groundwater-free zone, which is situated in an area unaffected by land subsidence. While the intention, as mentioned in the introduction, is to follow non-groundwater supply facilities, this approach seems to prioritize environmental impact less than it should. Due to this issue, ecological marginalization is more pronounced in this regulation, and this would lead to the worst effects for the province itself [24,93,94]. Returning to Constitutional Court Regulation Number 2 in 2021 on the Procedural Steps Involved in Cases of Judicial Review, we found that the coastal environment and communities affected by land subsidence are not prioritized. We propose a judicial review be undertaken very soon, utilizing our recommended innovation for the groundwater-free zone.
This evaluation is a sustainability initiative for safeguarding Jakarta’s environment against land subsidence. Numerous studies have revealed a strong correlation between land subsidence and the excessive extraction of groundwater [17,63,64,99,100]. In Jakarta, groundwater extraction is widely believed to be the primary cause of land subsidence [63,64]. Following this, a 75% reduction in groundwater extraction can help rehabilitate the aquifer and significantly decrease subsidence rates [63,99]. Moreover, reducing city subsidence by managing groundwater withdrawal is feasible, as demonstrated in the Netherlands, Tokyo, Osaka, and Shanghai [14]. Based on this evidence, revising regulations to establish groundwater-free zones in subsiding areas of Jakarta could offer a promising solution for reducing subsidence within the city. Ultimately, this initiative could ensure the sustainability of Jakarta for future generations.

5. Conclusions

This study comprehensively evaluates Jakarta’s groundwater-free zone (GFZ) regulation, integrating technical and policy analyses using PS-InSAR data from 2017 to 2022. The results reveal a significant misalignment between designated GFZs and areas experiencing severe land subsidence. While North and West Jakarta experience subsidence rates of 5–6 cm per year, most GFZs are concentrated in Central and South Jakarta, where subsidence is minimal. Additionally, overlaying subsidence data with domestic water needs (DWNs) indicates that the highest groundwater consumption occurs in the most severely affected areas—a key factor overlooked by the existing regulation.
These findings warrant a judicial review of Governor Regulation Number 93 of 2021. The regulation does not account for the spatial distribution of land subsidence intensity and lacks explicit technical criteria for groundwater usage limitations. Moreover, Articles 5, 7, and 8, which address groundwater extraction reporting, water balance, and groundwater lenses, are insufficiently explained and lack a solid technical foundation. The absence of supporting studies for formulating gubernatorial regulations further weakens its effectiveness. Additionally, the regulation fails to integrate Government Regulation Number 43 of 2008, which outlines more comprehensive groundwater conservation measures.
We propose redefining groundwater-free zones based on empirical subsidence data and water consumption patterns to enhance land subsidence mitigation. West Jakarta, North Jakarta, and South Jakarta should be prioritized for GFZ expansion, while East Jakarta and Central Jakarta should be lower-priority areas. Furthermore, improving water supply infrastructure is essential to reducing reliance on groundwater.
Overall, this study underscores the necessity of a data-driven approach to policymaking in Jakarta’s land subsidence mitigation efforts. Future policy revisions should incorporate technical studies on groundwater extraction and its direct impact on land subsidence, ensuring that GFZs are strategically placed. Based on the combined impact of land subsidence and domestic water demand, we propose a remapping of Jakarta’s GFZs in the following priority order:
  • West Jakarta;
  • North Jakarta;
  • South Jakarta;
  • East Jakarta;
  • Central Jakarta.
Additionally, future studies and regulatory revisions should place greater emphasis on water resource availability and demand. Revised regulations should also encourage stakeholders to develop adequate water supply infrastructure, as ensuring reliable water services requires careful planning and long-term investment.

Supplementary Materials

The following supporting information can be downloaded at: https://www.mdpi.com/article/10.3390/urbansci9030067/s1. Supplementary information includes: 1. Table S1. Specification of ALOS-2 PALSAR-2 Data used in this research; 2. Table S2. List of ALOS-2 data; 3. Figure S1 Temporal coherence Graph of PS-InSAR points after atmospheric phase correction.

Author Contributions

Conceptualization, J.W. and E.T.; methodology, J.W., R.H., and M.A.; software, J.W., E.T., and R.H.; validation, M.A. and R.H.; formal analysis, J.W., N.S., N.N., J.R.W., E.T., and Y.I.; investigation, M.R.K., J.W., and J.R.W.; resources, S.S., P.A.P., Y.I.; data curation, N.S., M.A., and J.R.W.; writing—original draft preparation, J.W., E.T., and R.A.; writing—review and editing, R.A., E.T., N.S., and J.R.W.; visualization, N.S. and E.T.; supervision, M.R.K., S.S., P.A.P., and Y.I.; project administration, N.S. and N.N.; Funding Acquisition, Y.I. All authors have read and agreed to the published version of the manuscript.

Funding

This research received no external funding.

Data Availability Statement

The datasets generated during the current study are available from the corresponding author upon reasonable request.

Acknowledgments

The authors thank the reviewers for their valuable comments and suggestions. In addition, we extend our thanks to Gatot Adiatma, S.H., M.Kn., and the Research Center for Geoinformatics, National Research, and Innovation Agency of Indonesia, for their support of this research.

Conflicts of Interest

The authors declare no conflicts of interest.

References

  1. Barragán, J.M.; Andrés, M. Analysis and trends of the world’s coastal cities and agglomerations. Ocean Coast. Manag. 2015, 114, 11–20. [Google Scholar] [CrossRef]
  2. Komar, P.D.; McDougal, W.G. Coastal Erosion and Engineering Structures: The Oregon Experience. J. Coast. Res. 1988, 81, 77–92. [Google Scholar]
  3. Maiti, S.K.; Ahirwal, J. Ecological Restoration of Coal Mine Degraded Lands: Topsoil Management, Pedogenesis, Carbon Sequestration, and Mine Pit Limnology. In Phytomanagement of Polluted Sites: Market Opportunities in Sustainable Phytoremediation; Elsevier: Amsterdam, The Netherlands, 2019; pp. 83–111. [Google Scholar]
  4. Reimann, L.; Vafeidis, A.T.; Honsel, L.E. Population development as a driver of coastal risk: Current trends and future pathways. Cambridge Prism. Coast. Futur. 2023, 1, 14. [Google Scholar] [CrossRef]
  5. Surjan, A.; Parvin, G.A.; Atta-ur-Rahman; Shaw, R. Expanding Coastal Cities: An Increasing Risk. In Urban Disasters and Resilience in Asia; Elsevier: Amsterdam, The Netherlands, 2016; pp. 79–90. [Google Scholar]
  6. Fletcher, R.; Scrimgeour,, R.; Friedrich,, L.; Fletcher,, S.; Griffin, H. The Contributions of Marine and Coastal Area-Based Management Approaches to Sustainable Development Goals and Targets; UN Environment: Nairobi, Kenya, 2018; pp. 20–22. [Google Scholar]
  7. Sterzel, T.; Lüdeke, M.K.B.; Walther, C.; Kok, M.T.; Sietz, D.; Lucas, L. Typology of coastal urban vulnerability under rapid urbanization. PLoS ONE 2020, 15, e0220936. [Google Scholar] [CrossRef] [PubMed]
  8. Mentaschi, L.; Vousdoukas, M.I.; Pekel, J.; Voukouvalas, E.; Feyen, L. Global long-term observations of coastal erosion and accretion. Sci. Rep. 2018, 8, 12876. [Google Scholar] [CrossRef] [PubMed]
  9. Panthi, J.; Pradhanang, S.M.; Nolte, A.; Boving, T.B. Science of the Total Environment Saltwater intrusion into coastal aquifers in the contiguous United States—A systematic review of investigation approaches and monitoring networks. Sci. Total Environ. 2022, 836, 155641. [Google Scholar] [CrossRef] [PubMed]
  10. Hamlington, B.D.; Bellas-Manley, A.; Willis, J.K.; Fournier, S.; Vinogradova, N.; Nerem, R.S.; Piecuch, C.G.; Thompson, P.R.; Kopp, R. The rate of global sea level rise doubled during the past three decades. Commun. Earth Environ. 2024, 5, 601. [Google Scholar] [CrossRef]
  11. Trihatmoko, E. Dinamika Wilayah Kepesisiran Jawa Tengah Bagian Utara Dengan Pendekatan Geomorfologi. Ph.D. Thesis, Universitas Gadjah Mada, Yogyakarta, Indonesia, 2020. [Google Scholar]
  12. Trihatmoko, E.; Nurlinda, N.; Darussalam, A.; Purwitaningsih, S.; Sartohadi, J.; Banowati, E.; Naibaho, B.B.; Husna, V.N.; Juhadi, J.; Aji, A. Preserving coastal ecosystem through micro-zonation analysis of Karimunjawa, Indonesia. Env. Monit Assess 2023, 196, 88. [Google Scholar] [CrossRef] [PubMed]
  13. Wongsokarto, M.; Trihatmoko, E.; Nurlinda; Widodo, J.; Sanjoto, T.B.; Marfai, A.M.; Aji, A.; Annaufal, M.H.; Yulianasari, D.; Syarifatunnada, H. Sequencing seabed morphology through bathymetric profiling on Brebes coastal area. IOP Conf. Ser. Earth Environ. Sci. 2024, 1357, 012014. [Google Scholar] [CrossRef]
  14. Nicholls, R.J.; Lincke, D.; Hinkel, J.; Brown, S.; Vafeidis, A.T.; Meyssignac, B.; Hanson, S.E.; Merkens, J.-L.; Fang, J. A global analysis of subsidence, relative sea-level change and coastal flood exposure. Nat. Clim. Change 2021, 11, 338–342. [Google Scholar] [CrossRef]
  15. Abidin, H.Z.; Andreas, H.; Gumilar, I.; Wibowo, I.R.R. On correlation between urban development, land subsidence and flooding phenomena in Jakarta. IAHS-AISH Proc. Rep. 2015, 370, 15–20. [Google Scholar] [CrossRef]
  16. Aljammaz, A.; Sultan, M.; Izadi, M.; Abotalib, A.Z.; Elhebiry, M.S.; Emil, M.K.; Abdelmohsen, K.; Saleh, M.; Becker, R. Land Subsidence Induced by Rapid Urbanization in Arid Environments: A Remote Sensing-Based Investigation. Remote Sens. 2021, 13, 1109. [Google Scholar] [CrossRef]
  17. Awasthi, S.; Jain, K.; Bhattacharjee, S.; Gupta, V.; Varade, D.; Singh, H.; Narayan, A.B.; Budillon, A. Analyzing urbanization induced groundwater stress and land deformation using time-series Sentinel-1 datasets applying PSInSAR approach. Sci. Total. Environ. 2022, 844, 157103. [Google Scholar] [CrossRef] [PubMed]
  18. Dang, V.K.; Doubre, C.; Weber, C.; Gourmelen, N.; Masson, F. Recent land subsidence caused by the rapid urban development in the Hanoi region (Vietnam) using ALOS InSAR data. Nat. Hazards Earth Syst. Sci. 2014, 14, 657–674. [Google Scholar] [CrossRef]
  19. Ren, G.; Whittaker, B.; Reddish, D. Mining subsidence and displacement prediction using influence function methods for steep seams. Min. Sci. Technol. 1989, 8, 235–251. [Google Scholar] [CrossRef]
  20. Santi; Bachrun, R.; Ornam, K. Typology of Slum Management in Coastal Settlement as a Reference of Neighborhood Planning in Konawe. J. Phys. Conf. Ser. 2017, 846, 012018. [Google Scholar] [CrossRef]
  21. Wang, Z.; Liu, Y.; Zhang, Y.; Liu, Y.; Wang, B.; Zhang, G. Spatially Varying Relationships between Land Subsidence and Urbanization: A Case Study in Wuhan, China. Remote Sens. 2022, 14, 291. [Google Scholar] [CrossRef]
  22. Chaussard, E.; Amelung, F.; Abidin, H.; Hong, S.-H. Sinking cities in Indonesia: ALOS PALSAR detects rapid subsidence due to groundwater and gas extraction. Remote Sens. Environ. 2013, 128, 150–161. [Google Scholar] [CrossRef]
  23. Chen, M.; Tomás, R.; Li, Z.; Motagh, M.; Li, T.; Hu, L.; Gong, H.; Li, X.; Yu, J.; Gong, X. Imaging Land Subsidence Induced by Groundwater Extraction in Beijing (China) Using Satellite Radar Interferometry. Remote Sens. 2016, 8, 468. [Google Scholar] [CrossRef]
  24. Levers, C.; Romero-Muñoz, A.; Baumann, M.; De Marzo, T.; Fernández, P.D.; Gasparri, N.I.; Gavier-Pizarro, G.I.; Waroux, Y.l.P.d.; Piquer-Rodríguez, M.; Semper-Pascual, A.; et al. Agricultural expansion and the ecological marginalization of forest-dependent people. Proc. Natl. Acad. Sci. USA 2021, 118, e2100436118. [Google Scholar] [CrossRef] [PubMed]
  25. Zhou, Y.; Zhang, H.; Zhao, Z. Application of InSAR technology in monitoring land subsidence in the North China Plain. Environ. Earth Sci. 2018, 77, 786. [Google Scholar]
  26. Chaussard, E.; Bürgmann, R.; Shirzaei, M.; Fielding, E.J.; Baker, B. Predictability of hydraulic head changes and characterization of aquifer-system and fault properties from InSAR-derived ground deformation. J. Geophys. Res. Solid Earth 2014, 119, 6572–6590. [Google Scholar] [CrossRef]
  27. Galloway, D.L.; Hudnut, K.W.; Ingebritsen, S.E.; Phillips, S.P.; Peltzer, G.; Rogez, F.; Rosen, P.A. Detection of aquifer system compaction and land subsidence using interferometric synthetic aperture radar, Antelope Valley, Mojave Desert, California. Water Resour. Res. 1998, 34, 2573–2585. [Google Scholar] [CrossRef]
  28. Ouyang, L.; Zhao, Z.; Zhou, D.; Cao, J.; Qin, J.; Cao, Y.; He, Y. Study on the Relationship between Groundwater and Land Subsidence in Bangladesh Combining GRACE and InSAR. Remote Sens. 2024, 16, 3715. [Google Scholar] [CrossRef]
  29. Erkens, G.; Bucx, T.; Dam, R.; de Lange, G.; Lambert, J. Sinking coastal cities. Proc. Int. Assoc. Hydrol. Sci. 2015, 372, 189–198. [Google Scholar] [CrossRef]
  30. Minderhoud, P.; Coumou, L.; Erban, L.; Middelkoop, H.; Stouthamer, E.; Addink, E. The relation between land use and subsidence in the Vietnamese Mekong delta. Sci. Total. Environ. 2018, 634, 715–726. [Google Scholar] [CrossRef]
  31. Santangelo, N.; Borrelli, M.; Rossi, M.; Crescenzo, G. Historical and recent subsidence processes in the Piana del Sele coastal plain, southern Italy: Insights from D-InSAR data and field observations. Remote Sens. 2012, 13, 3409. [Google Scholar]
  32. Tao, J.; Wang, R.; Feng, L. Levelling data analysis for land subsidence monitoring in Shanghai, China. Measurement 2019, 140, 342–352. [Google Scholar]
  33. Li, Z.; Yao, L.; Chen, Y. An integrated GNSS-InSAR method for large-scale surface deformation monitoring: A case study in the North China Plain. Remote Sens. 2022, 14, 379. [Google Scholar]
  34. Qiu, Q.; Zhang, Z.; Xu, W. A hybrid GNSS and InSAR time series analysis method for monitoring land subsidence. Remote Sens. 2014, 12, 3543. [Google Scholar]
  35. Xie, L.; Li, X.; Hu, J. Monitoring land subsidence with InSAR and its application in urban areas: A review. Remote Sens. 2020, 12, 2649. [Google Scholar]
  36. Hu, H.; Liu, Y.; Liu, L.; Gong, H. SBAS-InSAR monitoring of land subsidence in vegetated areas: A case study in the Beijing Plain, China. Int. J. Remote Sens. 2020, 41, 5174–5194. [Google Scholar]
  37. Xu, W.; Gong, H.; Li, Y.; Wang, R. InSAR monitoring of land subsidence and its driving factors in the central Yangtze River Basin. J. Hydrol. 2020, 590, 125546. [Google Scholar]
  38. Xu, Y.; Ding, X.; Wu, Q. D-InSAR monitoring of land subsidence in Shanghai: A case study from 2016 to 2020. Remote Sens. 2021, 13, 3912. [Google Scholar]
  39. Jiang, H.; Lin, H.; Zhang, Y.; Xu, H. The application of D-InSAR technology in land subsidence monitoring. Geod. Geodyn. 2017, 8, 121–127. [Google Scholar]
  40. Zhao, Y.; Liu, G.; Gong, H. Multi-temporal InSAR analysis for monitoring land subsidence in Beijing-Tianjin-Hebei region, China. Remote Sens. 2019, 11, 845. [Google Scholar]
  41. Zhou, Z.; Zhang, G.; Liu, X. Multi-temporal InSAR analysis of land subsidence in Wuhan, China. Remote Sens. 2020, 12, 253. [Google Scholar]
  42. Parizzi, A.; Brcic, R.; De Zan, F. InSAR Performance for Large-Scale Deformation Measurement. IEEE Trans. Geosci. Remote Sens. 2021, 59, 8510–8520. [Google Scholar] [CrossRef]
  43. Chang, L.; Hu, J.; Ding, X. PS-InSAR based subsidence monitoring and influencing factors analysis in coastal areas: A case study in Shenzhen, China. Remote Sens. 2019, 11, 1583. [Google Scholar]
  44. Gabriel, A.K.; Goldstein, R.M.; Zebker, H.A. Mapping small elevation changes over large areas: Differential radar interferometry. J. Geophys. Res. Solid Earth 1989, 94, 9183–9191. [Google Scholar] [CrossRef]
  45. Castellazzi, P.; Arroyo-Domínguez, N.; Martel, R.; Calderhead, A.I.; Normand, J.C.L.; Gárfias, J.; Rivera, A. Land subsidence in major cities of Central Mexico: Interpreting InSAR-derived land subsidence mapping with hydrogeological data. Int. J. Appl. Earth Obs. Geoinf. 2016, 47, 102–111. [Google Scholar] [CrossRef]
  46. Fielding, E.J.; Blom, R.G.; Goldstein, R.M. Rapid subsidence over oil fields measured by SAR interferometry. Geo-physical Res. Lett. 1998, 25, 3215–3218. [Google Scholar] [CrossRef]
  47. Galloway, D.L.; Hoffmann, J. The application of satellite differential SAR interferometry-derived ground displace-ments in hydrogeology. Hydrogeol. J. 2007, 15, 133–154. [Google Scholar] [CrossRef]
  48. Liu, Y.; Hu, H.; Zhang, X. InSAR-based monitoring of urban subsidence in the Beijing-Tianjin-Hebei region, China. Sensors. 2021, 21, 3726. [Google Scholar]
  49. Othman, A.; Sultan, M.; Becker, R.; Alsefry, S.; Alharbi, T.; Gebremichael, E.; Alharbi, H.; Abdelmohsen, K. Use of Geophysical and Remote Sensing Data for Assessment of Aquifer Depletion and Related Land Deformation. Surv. Geophys. 2018, 39, 543–566. [Google Scholar] [CrossRef]
  50. Zhang, Y.; Li, W.; Sun, Z. PS-InSAR monitoring of land subsidence in the Pearl River Delta, China. Remote Sens. 2020, 12, 1809. [Google Scholar]
  51. Zuo, J.; Gong, H.; Chen, B.; Liu, K.; Zhou, C.; Ke, Y. Time-series evolution patterns of land subsidence in the eastern Beijing Plain, China. Remote Sens. 2019, 11, 539. [Google Scholar] [CrossRef]
  52. Lu, Z.; Dzurisin, D.; Wicks, C.; Diefenbach, A. Radar interferometry for monitoring volcanoes. Science 2018, 362, 1340–1344. [Google Scholar]
  53. Bagnardi, M.; Amelung, F. Multi-temporal InSAR processing for volcano deformation monitoring. Remote Sens. Environ. 2020, 248, 111962. [Google Scholar]
  54. Su, Y.; Zhu, W.; Zhang, Y. Monitoring peatland subsidence and water table variations using InSAR: A case study in the western Jilin Province, China. Remote Sens. 2022, 14, 1376. [Google Scholar]
  55. Jiang, J.; Liu, B.; Ding, X. Monitoring peatland subsidence in the Sanjiang Plain, China using multi-temporal InSAR data. Remote Sens. Environ. 2019, 227, 220–231. [Google Scholar]
  56. Widodo, J.; Sulaiman, A.; Awaluddin, A.; Riyadi, A.; Nasucha, M.; Perissin, D.; Sumantyo, J.T.S. Application of SAR Interferometry Using ALOS-2 PALSAR-2 Data as Precise Method to Identify Degraded Peatland Areas Related to Forest Fire. Geosciences 2019, 9, 484. [Google Scholar] [CrossRef]
  57. Widodo, J.; Izumi, Y.; Takahashi, A.; Kausarian, H.; Perissin, D.; Sumantyo, J.T.S. Detection of peat fire risk area based on impedance model and DInSAR approaches using ALOS-2 PALSAR-2 data. IEEE Access 2019, 7, 22395–22407. [Google Scholar] [CrossRef]
  58. Heleno, S.I.N.; Oliveira, L.G.S.; Henriques, M.J.; Falcão, A.P.; Lima, J.N.P.; Cooksley, G.; Ferretti, A.; Fonseca, A.M.; Lobo-Ferreira, J.P.; Fonseca, J.F.B.D. Persistent Scatterers Interferometry detects and measures ground subsidence in Lisbon. Remote Sens. Environ. 2011, 115, 2152–2167. [Google Scholar] [CrossRef]
  59. Widodo, J.; Trihatmoko, E.; Khomarudin, M.R.; Ardha, M.; Nugroho, U.C.; Setyaningrum, N. Dynamic Geo-Visualization of Urban Land Subsidence and Land Cover Data Using PS-InSAR and Google Earth Engine (GEE) for Spatial Planning Assessment. Urban Sci. 2024, 8, 234. [Google Scholar] [CrossRef]
  60. Cigna, F.; Ramirez, R.E.; Tapete, D. Accuracy of Sentinel-1 PSI and SBAS InSAR Displacement Velocities against GNSS and Geodetic Leveling Monitoring Data. Remote Sens. 2021, 13, 4800. [Google Scholar] [CrossRef]
  61. Chen, Y.; Dong, X.; Qi, Y.; Huang, P.; Sun, W.; Xu, W.; Tan, W.; Li, X.; Liu, X. Integration of DInSAR-PS-Stacking and SBAS-PS-InSAR Methods to Monitor Mining-Related Surface Subsidence. Remote Sens. 2023, 15, 2691. [Google Scholar] [CrossRef]
  62. Bagheri-Gavkosh, M.; Hosseini, S.M.; Ataie-Ashtiani, B.; Sohani, Y.; Ebrahimian, H.; Morovat, F.; Ashrafi, S. Land subsidence: A global challenge. Sci. Total Environ. 2021, 778, 146193. [Google Scholar] [CrossRef]
  63. Tzampoglou, P.; Ilia, I.; Karalis, K.; Tsangaratos, P.; Zhao, X.; Chen, W. Selected Worldwide Cases of Land Subsidence Due to Groundwater Withdrawal. Water 2023, 15, 1094. [Google Scholar] [CrossRef]
  64. Abidin, H.Z.; Andreas, H.; Gumilar, I.; Fukuda, Y.; Pohan, Y.E.; Deguchi, T. Land subsidence of Jakarta (Indonesia) and its relation with urban development. Nat. Hazards 2011, 59, 1753–1771. [Google Scholar] [CrossRef]
  65. Batubara, B.; Kooy, M.; Zwarteveen, M. Politicising land subsidence in Jakarta: How land subsidence is the outcome of uneven sociospatial and socionatural processes of capitalist urbanization. Geoforum 2023, 139, 103689. [Google Scholar] [CrossRef]
  66. Murdohardono, D.; Sudarsono, B. Land subsidence monitoring system in Jakarta, Indonesia. In Proceedings of the Symposium on Japan-Indonesia IDNDR Project: Volcanology, Tectonics, Flood and Sediment Hazards, Jakarta, Indonesia, 21–23 September 1998; pp. 53–63. [Google Scholar]
  67. Ardha, M.; Suhadha, A.G.; Julzarika, A.; Yulianto, F.; Yudhatama, D.; Darwista, R.Z. Utilization of Sentinel-1 satellite imagery data to support land subsidence analysis in DKI Jakarta, Indonesia. J. Degrad. Min. Lands Manag. 2021, 8, 2587–2593. [Google Scholar] [CrossRef]
  68. Benattou, M.M.; Balz, T.; Liao, M. Measuring surface subsidence in Wuhan, China with Sentinel-1 data using PSInSAR. Int. Arch. Photogramm. Remote Sens. Spat. Inf. Sci. 2018, 42, 73–77. [Google Scholar] [CrossRef]
  69. Rafiei, F.; Gharechelou, S.; Golian, S.; Johnson, B.A. Aquifer and land subsidence interaction assessment using Sen-tinel-1 data and DInSAR technique. ISPRS Int. J. Geo-Inf. 2022, 11, 495. [Google Scholar] [CrossRef]
  70. Suhadha, A.G.; Prayoga, O.; Harintaka, H. Precise coseismic displacement related to the 2022 Pasaman earthquake using multi-geometry of Sentinel-1 InSAR. AIP Conf. Proc. 2023, 2941, 030008. [Google Scholar]
  71. Widodo, J.; Herlambang, A.; Sulaiman, A.; Razi, P.; Perissin, D.; Kuze, H.; Sumantyo, J.T. Land sub-sidence rate analysis of Jakarta Metropolitan Region based on D-InSAR processing of Sentinel data C-Band frequency. J. Phys. Conf. Ser. 2019, 1185, 12004. [Google Scholar] [CrossRef]
  72. Yi, Z.; Liu, M.; Liu, X.; Wang, Y.; Wu, L.; Wang, Z.; Zhu, L. Long-term Landsat monitoring of mining subsidence based on spatiotemporal variations in soil moisture: A case study of Shanxi Province, China. Int. J. Appl. Earth Obs. Geoinf. 2021, 102, 102447. [Google Scholar] [CrossRef]
  73. Ng, A.H.M.; Ge, L.; Zhang, K.; Li, X. Estimating horizontal and vertical movements due to underground mining using ALOS PALSAR. Eng. Geol. 2012, 143–144, 18–27. [Google Scholar] [CrossRef]
  74. Ng, A.H.M.; Ge, L.; Li, X. Assessments of land subsidence in the Gippsland Basin of Australia using ALOS PALSAR data. Remote Sens. Environ. 2014, 159, 86–101. [Google Scholar] [CrossRef]
  75. Bayuaji, L.; Sumantyo, J.T.S.; Kuze, H. ALOS PALSAR D-InSAR for land subsidence mapping in Jakarta, Indonesia. Can. J. Remote Sens. 2010, 36, 1–8. [Google Scholar] [CrossRef]
  76. Minh, D.H.T.; Trung, L.; Toan, T.L. Mapping ground subsidence phenomena in Ho Chi Minh City through the radar interferometry technique using ALOS PALSAR data. Remote Sens. 2015, 7, 8543–8562. [Google Scholar] [CrossRef]
  77. Darwish, N.; Kaiser, M.; Koch, M.; Gaber, A. Assessing the accuracy of ALOS/PALSAR-2 and Sentinel-1 radar images in estimating the land subsidence of coastal areas: A case study in Alexandria City. Egypt. Remote Sens. 2021, 13, 1838. [Google Scholar] [CrossRef]
  78. Ge, L.; Ng, A.H.M.; Li, X.; Abidin, H.Z. Land subsidence characteristics of Bandung Basin as revealed by ENVISAT ASAR and ALOS PALSAR interferometry. Remote Sens. Environ. 2014, 154, 46–60. [Google Scholar] [CrossRef]
  79. Lubis, A.M.; Sato, T.; Tomiyama, N.; Isezaki, N.; Yamanokuchi, T. Ground subsidence in Semarang-Indonesia in-vestigated by ALOS–PALSAR satellite SAR interferometry. J. Asian Earth Sci. 2010, 40, 1079–1088. [Google Scholar] [CrossRef]
  80. Li, M.; Zhang, L.; Liao, M.; Shi, X. Detection of coal-mining-induced subsidence and mapping of the resulting de-formation using time series of ALOS-PALSAR data. Remote Sens. Lett. 2016, 7, 855–864. [Google Scholar] [CrossRef]
  81. Putri, R.F.; Rostika, M.D.; Abadi, A.W.; Rakhmatika, M. A Review Disaster Mitigation of Jakarta Land Subsidence Areas. E3S Web Conf. 2021, 325, 01002. [Google Scholar] [CrossRef]
  82. Hasibuan, H.S.; Tambunan, R.P.; Rukmana, D.; Permana, C.T.; Elizandri, B.N.; Putra, G.A.Y.; Wahidah, A.N.; Ristya, Y. Policymaking and the spatial characteristics of land subsidence in North Jakarta. City Environ. Interact. 2023, 18, 100103. [Google Scholar] [CrossRef]
  83. Abidin, H.Z.; Djaja, R.; Darmawan, D.; Hadi, S.; Akbar, A.; Rajiyowiryono, H.; Sudibyo, Y.; Meilano, I.; Kasuma, M.A.; Kahar, J.; et al. Land subsidence of Jakarta (Indonesia) and its geodetic monitoring system. Nat. Hazards 2001, 23, 365–387. [Google Scholar] [CrossRef]
  84. Abidin, H.Z.; Andreas, H.; Djaja, R.D.; Gamal, M. Land subsidence characteristics of Jakarta between 1997 and 2005, as estimated using GPS surveys. GPS Solut. 2007, 12, 23–32. [Google Scholar] [CrossRef]
  85. Badan Pusat Statistik. Jumlah Penduduk Menurut Kabupaten/Kota di Provinsi DKI Jakarta (Jiwa) 2013–2023). 2024. Available online: https://jakarta.bps.go.id/id/statistics-table/2/MTI3MCMy/jumlah-penduduk-menurut-kabupaten-kota-di-provinsi-dki-jakarta-html (accessed on 14 February 2025).
  86. Perissin, D.; Wang, Z.; Wang, T. The SARPROZ InSAR tool for urban subsidence/manmade structure stability monitoring in China. In Proceedings of the ISRSE, Sidney, Australia, 10–15 April 2011. [Google Scholar]
  87. Nash, J.E.; Sutcliffe, J.V. River flow forecasting through conceptual models part I—A discussion of principles. J. Hydrol. 1970, 10, 282–290. [Google Scholar] [CrossRef]
  88. Aye, P.P.; Koontanakulvong, S.; Tran, L.T. Estimation of Groundwater Flow Budget in the Upper Central Plain, Thailand from Regional Groundwater Model. Internet J. Soc. Soc. Manag. Syst. 2017, 11, 90–100. [Google Scholar]
  89. Badan Standardisasi Nasional (BSN). Penyusunan Neraca Sumber Daya–Bagian 1: Sumber Daya Air Spasial; BSN: Jakarta, Indonesia, 2002; pp. 10–11. [Google Scholar]
  90. Dimyati, M.; Trihatmoko, E.; Marfai, M.A. 10 years erosion-sedimentation monitoring: System based automatic interpretation in coastal area of brebes regency, central Java province, Indonesia. Geogr. Tech. 2021, 16, 25–38. [Google Scholar] [CrossRef]
  91. Guimbatan-Fadgyas, R. Indigenous Toponyms in Landslide Hazard Mapping for Land Use and Infrastructure Planning. Master’s Thesis, University of Twente, Enschede, The Netherlands, 2021. [Google Scholar]
  92. Hisyam, F.; Sabila, W.I. Kajian Toponimi Kampung di Sepanjang Sungai Brantas, Kota Malang. J. Dialog Penanggulangan Bencana 2020, 11, 155–166. [Google Scholar]
  93. Afroosheh, F.; Riyazinejad, M.; Shahrashoub, M.; Toosi, G.; Saffari, M. A Field Study of The Environmental Effects of Marginalization in the 19th District of Tehran Using Rapid Impact Assessment Matrix (RIAM). Environ. Energy Econ. Res. 2018, 2, 123–135. [Google Scholar] [CrossRef]
  94. Kousis, M. Ecological Marginalization in Rural Areas: Actors, Impacts, Responses. Sociol. Ruralis 1998, 38, 86–108. [Google Scholar] [CrossRef]
  95. Farias, F.; Teixeira, A.; Sousa, I.; Leivas, J.; Takemura, C.; Garçon, E. Large-scale water balance modeling using remote sensing and weather data: Application in an agricultural growing region of the coastal northeast Brazil. Remote Sens. Appl. Soc. Environ. 2023, 32, 101072. [Google Scholar] [CrossRef]
  96. Prasad, Y.S.; Rao, B.V. Groundwater depletion and groundwater balance studies of Kandivalasa River Sub Basin, Vizianagaram District, Andhra Pradesh, India. Groundw. Sustain. Dev. 2017, 6, 71–78. [Google Scholar] [CrossRef]
  97. Alley, W.M.; Reilly, T.E.; Franke, O.L. Sustainability of Ground-Water Resources, U.S. Geological Survey Circular 1186. U.S. Geol. Surv. Circ. 1999, 1186, 79. [Google Scholar]
  98. Shi, X.; Wu, J.; Ye, S.; Zhang, Y.; Xue, Y.; Wei, Z.; Li, Q.; Yu, J. Regional land subsidence simulation in Su-Xi-Chang area and Shanghai City, China. Eng. Geol. 2008, 100, 27–42. [Google Scholar] [CrossRef]
  99. Khajehali, M.; Safavi, H.R.; Pour, S.I. Evaluation of management scenarios for land subsidence reduction and groundwater rehabilitation in Damane-Daran plain, Iran. Groundw. Sustain. Dev. 2023, 23, 100995. [Google Scholar] [CrossRef]
  100. Wilson, A.M.; Gorelick, S. The effects of pulsed pumping on land subsidence in the Santa Clara Valley, California. J. Hydrol. 1996, 174, 375–396. [Google Scholar] [CrossRef]
Figure 1. The study area of the research.
Urbansci 09 00067 g001
Figure 2. Data statistics and normal baselines of ALOS-2 PALSAR-2 data used in this research (81 images).
Urbansci 09 00067 g002aUrbansci 09 00067 g002b
Figure 3. Research flow.
Urbansci 09 00067 g003
Figure 4. Interferogram of 81 ALOS 2 images and PS-InSAR result for Jakarta and surrounding area.
Urbansci 09 00067 g004
Figure 5. Nash–Sutcliffe efficiency model results with a 0.8 (outstanding) value between PS-InSAR as a model and GNSS data as an observation (Obs).
Urbansci 09 00067 g005
Figure 6. GNSS in conjunction with PS-InSAR data within a 100 m buffer.
Urbansci 09 00067 g006
Figure 7. Jakarta land subsidence, 2017–2022.
Urbansci 09 00067 g007
Figure 8. The average of the velocity subsidence rate (mm) in each city of Jakarta from 2017 to 2022. Interferogram of 81 ALOS 2 images.
Urbansci 09 00067 g008
Figure 9. Time series land subsidence and DWNs (in liters) at the research location.
Urbansci 09 00067 g009
Figure 10. Comparison of annual domestic water needs (DWNs) in the five administrative cities of Jakarta.
Urbansci 09 00067 g010
Figure 11. Groundwater-free zone based on Governor Regulation Number 93 of 2021 with land subsidence rate/year (mm) in Jakarta with 81 scene baselines of ALOS PALSAR data and DWNs (in liters) during the acquisition period from 12 June 2017–06 June 2020.
Urbansci 09 00067 g011
Figure 12. Zoning recommendation map for groundwater-free zones considering land subsidence and domestic water needs in Jakarta.
Urbansci 09 00067 g012
Figure 13. The extent of recommended groundwater-free areas in Jakarta (Ha) based on land subsidence analysis and city-level water demand.
Urbansci 09 00067 g013
Table 1. NSE properties and values [88].
PropertiesValue
Very good0.75 < NSE < 1.00
Good0.65 < NSE < 0.75
Satisfactory0.50 < NSE < 0.65
UnsatisfactoryNSE < 0.50
Disclaimer/Publisher’s Note: The statements, opinions and data contained in all publications are solely those of the individual author(s) and contributor(s) and not of MDPI and/or the editor(s). MDPI and/or the editor(s) disclaim responsibility for any injury to people or property resulting from any ideas, methods, instructions or products referred to in the content.

