Article

Energy Consumption in Mexican Homes: Using a Reference Building as a Launchpad for Achieving Nearly Zero Energy

by
Carlos A. Espino-Reyes
1,*,
Naghelli Ortega-Avila
2,
Jorge Lucero-Álvarez
3 and
Norma A. Rodríguez-Muñoz
2,*
1
Departamento de Ingeniería Sustentable, Centro de Investigación en Materiales Avanzados, Calle CIMAV 110, Durango 34147, Mexico
2
SECIHTI, Centro de Investigación en Materiales Avanzados, Calle CIMAV 110, Durango 34147, Mexico
3
Facultad de Zootecnia y Ecología, Universidad Autónoma de Chihuahua, Periférico Francisco R. Almada, Km 1, Chihuahua 31453, Mexico
*
Authors to whom correspondence should be addressed.
Urban Sci. 2025, 9(4), 113; https://doi.org/10.3390/urbansci9040113
Submission received: 17 February 2025 / Revised: 24 March 2025 / Accepted: 1 April 2025 / Published: 4 April 2025

Abstract

:
The residential sector accounts for over a third of the world’s energy use. Even though this ratio is lower in Mexico, there is a pressing housing deficit, especially regarding low-cost homes. This research aimed to create a reference building (RB) to understand the current energy consumption of multi-family buildings across different climatic zones. The aim was to assess their energy performance and promote reduced energy requirements as a guideline for designing and constructing affordable, low-energy, or zero-energy buildings. The present work conducts a diagnosis of the current energy consumption of multi-family buildings in eight cities in Mexico. First, a reference building was developed to represent typical Mexican building geometry and construction practices, and then the building’s fixed and variable energy requirements were simulated. Finally, a comparison was made between the energy requirement and the data reported by the national energy survey. Therefore, it was possible to generate a reference building from national data sources complying with national regulations, where materials, occupant behavior, and equipment were chosen to help represent the building’s thermal behavior. Domestic water heating was identified as a driver of variable energy requirements in all cities. In contrast, the simulated heating and cooling requirements were directly linked to the city’s climate. Electricity bills tended to mostly correspond with the results that excluded the use of heating systems. Lastly, while comparing LPG (Liquified Petroleum Gas) consumption was challenging due to the unavailability of national data, LPG requirements were closely estimated for temperate cities. The definition of a reference building is an important step towards developing nZEB in Mexico, as these buildings are valuable tools that can contribute to the energy evaluation of specific types of buildings. This characteristic makes them convenient for revising a building code or setting new national energy policy goals.

1. Introduction

The effects of climate change are more evident than ever, and people worldwide are experiencing their consequences. Countries have signed agreements focusing on limiting global warming, such as the Paris Agreement, whose main objective is to prevent the earth’s temperature from increasing by over 2 °C [1]. Due to the relationship between energy use and the emission of greenhouse gases (GHG), energy efficiency projects and policies are very important in order to achieve these goals, especially in the sectors with the highest consumption. One of the critical sectors in which energy efficiency strategies can be applied is the building sector, which represents 34% of energy demand and 37% of CO2 emissions [2]. Achieving substantial and sustained GHG reductions can limit climate change, even though some effects may take decades to stabilize [1].
According to estimates produced by the International Agency for Energy [3], to achieve the goal of zero carbon emissions by the year 2050, direct CO2 emissions from buildings must be reduced by half by 2030. Even though, more than ever before, buildings worldwide are built following energy efficiency codes, it is necessary to strengthen and expand actions to achieve decarbonization goals. Another important commitment is the 17 Sustainable Development Goals (SDGs) within the 2030 Agenda of the United Nations (UN). Some of these objectives are related to energy use in buildings due to their high percentage of global energy consumption. Goal 7 (Affordable and Clean Energy), in its Target 7.3, establishes the need to double the global energy efficiency improvement rate. Goal 11 (Sustainable Cities and Communities) emphasizes reducing the environmental impact of cities and improving the use of natural resources [4]. Also, Target 11.3 of Goal 11 (Sustainable cities and Communities) highlights the importance of developing sustainable infrastructure [5]. Within SDG 11, there is an indicator in which the ratio of used land to population growth must be taken into account, indicating benefits in the development of compact urbanizations.
According to the 2020 National Housing Survey [6], 21.1% of Mexican households reported that some inhabitants needed to rent, buy, or build homes. This document indicates that around 8.2 million homes are required in the country to cover this need. In contrast, the Housing Registry (RUV) platform reports that only 3,009,435 homes were built and registered between 2013 and 2024 [7], classifying homes into eight categories (Economy, Popular128, Popular158, Popular200, Traditional, Medium, Residential, and Residential-Plus). In the report, it is observed that the three most built homes are the Traditional (29.66%), Popular200 (23.86%), and the Popular158 (19.60%), while the most common constructed area size is between 45–60 m2 (44.91%), >80 m2 (20.66%), and 60–80 m2 (19.84%). On the other hand, horizontal housing represents 72.21%, while the vertical housing accounts for 27.79%.
Nationwide, programs and policies have been put into practice to develop the country’s energy efficiency targets. The document “Perspective of energy efficiency programs and policies in residential buildings in Mexico” [8] groups sixteen representative policies according to the policy categories proposed by Tori et al. [9]. The analysis found that in Mexico, there are three regulatory-type policies: five economic policies, three related to building performance, three regarding information and motivation, and one policy in the categories of market transformation and target-group specific approaches. Other policies have also been implemented in Mexico, such as the sustainability policy within the National Housing Program 2019–2024, which aimed to ensure the right to adequate and affordable housing. The first target of the program sought to provide financial, technical, and social solutions to families; another target addressed the importance of promoting the use of energy-saving technologies [10]. Similarly, the Science Secretary SECIHTI (former Science Council CONAHCYT) includes actions on housing among its National Strategic Programs (PRONACES) due to its interest in promoting the development of sustainable housing [11].
In addition to national policies, urban planning plays a critical role in energy efficiency. Unplanned city expansion leads to increased energy consumption, GHG emissions, climate change, and environmental degradation. Because of this, and in line with SDG 11, the UN Urban Agenda favors compact, high-density, and well-planned urban development. Such developments can generate positive environmental impacts by relying less on motorized transport, reducing the urban footprint’s expansion rate, making better use of terrestrial ecosystems, and providing more efficient services [12,13].
Nevertheless, most vertical housing in Mexico has been allocated to the residential and higher-income segments. Most of the population requires low-cost housing, and it is observed that there is a limited supply of this type of construction [14]. This also represents a barrier to the attainment of affordable housing objectives. Although vertical housing currently represents a smaller percentage of housing in Mexico, it is essential to explore the benefits of vertical housing in the development of cities. The importance of the compact development of cities has been recognized in SDG 11. Among the national goals referring to Objective 11 of the SDGs, it has been proposed that by the year 2030, at least 66% of new homes built in the country’s cities follow vertical development criteria [15].
However, in Mexico, few documents focus on energy efficiency in apartments or multi-family buildings. For instance, Córdova and Alpuche Cruz [16] conducted a study in Hermosillo, Sonora, which evaluated how urban densification affects energy consumption in homes in a hot-dry climate. Through simulations with EnergyPlus and measurements with a thermal imaging camera, it was observed that vertical densification from four levels onwards significantly reduces (up to 57%) energy use intensity. Indicators such as the land use coefficient and the volume-to-land ratio showed a strong correlation (R2 = 0.71) with the energy use intensity, highlighting their relevance for designing more sustainable cities. In another study in Hermosillo by Lopez-Ordoñez et al. [17], they analyzed how vertical densification reduces residential cooling demand. The authors carried out energy simulations of eight case studies of single and multi-family houses, supported by a comparison against historical electricity bills. The results showed that multi-family buildings consume up to 72% less energy for cooling than single-family houses due to a lower surface-to-volume ratio and a consequent decrease in heat exchange through the building envelope. These results highlight the potential of vertical housing to save energy and reduce energy poverty in cities with extreme climates.
Multiple studies were found for other parts of the world. For example, Sarkar and Jana [18] carried out an analysis in India to determine differences between marginalized horizontal dwellings and vertical retrofitted buildings. The authors determined that the change to vertical dwellings can have a positive effect on the satisfaction of the occupants. Greater thermal comfort was achieved, in addition to modifying their behavior, in the preference for indoor activities, the selection of the type of appliances and their time of use, among others. Also, Del Hierro López et al. [19] carried out a study on the potential application of self-sufficient photovoltaic systems in Madrid, Spain. To do so, the authors classified the buildings by construction year and by number of floors. They found that single-family buildings can be self-sufficient in producing more than 70% of the electricity they consume. In comparison, this percentage decreases by up to 10% in multi-family buildings with an increasing number of floors.
Similarly, Li et al. [20] analyzed data on energy consumption for heating and cooling of 36 multi-family buildings with up to 34 floors located in cold areas of China, with minimum and maximum temperatures of up to −17 °C and 37 °C, respectively. The findings showed that the annual heating consumption in Beijing is 45 to 80 kWh/m2, while in Qinhaungdao, this consumption rises to 80 to 95 kWh/m2. As for the cooling consumption during the summer, the requirement is between 2 and 28 kWh/m2. On the other hand, Alonso et al. [21] analyzed the energy performance of two five-story multi-family buildings in Madrid, Spain, as part of a methodological proposal for the characterization and improvement of social buildings. They determined the gas consumption required to heat domestic water and radiators for air heating (21.22 kWh/m2 and 29.98 kWh/m2, respectively). The electrical consumption for lighting and household appliances was 31.34 kWh/m2 and 44 kWh/m2, whereas the total consumption was lower than the reference values stipulated in the legislation. Such a finding was associated with the unmet minimum levels of comfort and air quality.
Vallati et al. [22] simulated different energy consumption scenarios for heating and water heating in a three-story residential building in Rome, Italy. The study intended to improve energy efficiency by using various heat generation systems as substitutes for a natural gas boiler. The authors determined that reducing the primary energy demand by up to 28% is possible by using a hybrid system without modifying the building envelope. Subsequently, Vallati et al. [23] analyzed the same building to determine the potential for using heat pumps and thermal–photovoltaic hybrid collectors. Finally, Hernandez-Cruz et al. [24] measured the energy consumption of centralized systems for heating and domestic hot water systems in six buildings in the Basque Country. The authors determined that the average annual consumption for heating was 15.9 kWh/m2 and 14.5 kWh/m2 for water heating. Through the investigation, they could relate each home’s consumption to factors such as the home orientation, number of inhabitants, and their behavior.
In Mexico, there is a clear interest in improving the efficiency of buildings and developing sustainable housing. This is demonstrated by the implementation of national policies such as energy efficiency standards and similar programs implemented over the last decades. Nevertheless, although the general policies already exist, it was found that few studies explore the current state of energy usage on vertical residential buildings in Mexico. The current low availability of such studies represents a technical barrier that limits the development of the sector and delays the sustainable transition. The main objective of this research was to create a reference building to diagnose the current energy consumption of a multi-family building in eight cities in Mexico located in five different Köppen–Geiger climate zones. The analysis is presented as a first step in understanding their energy performance and influencing the reduction in energy consumption to promote the design and construction of affordable low- or zero-energy-use buildings. The addressed research questions include the following: (1) What is the magnitude of the current energy requirement of a proposed Mexican multi-family residential building? (2) What are the energy consumption differences between cities with different climates? (3) Which energy service drives the energy requirements of multi-family buildings in Mexico?

2. Methods

The methodology of this work consists of three main sections. The first focuses on selecting the study cities and their climatological parameters. Subsequently, the considerations taken for establishing a reference building, which is the basis for this study, are detailed. The Energy Performance of Buildings Directive (EPBD) (EU/2010/31 [25]), which established the criteria for developing nearly zero energy buildings (nZEB) in the European Union, was used as a basis for this work. Considering the directive’s requirements, statistical information from existing governmental sources [6,26,27,28,29] was collected to create a reference building representative of a multi-family vertical dwelling in Mexico. Later, the thermal and energy performance of the building was evaluated in seven Mexican cities.
Lastly, the parameters considered for the calculation of the building’s energy requirement are presented. The requirements are divided into two types: (1) fixed energy consumption (lighting, appliances, cooking) and (2) variable energy consumption (DHW (Domestic hot water), heating and cooling).

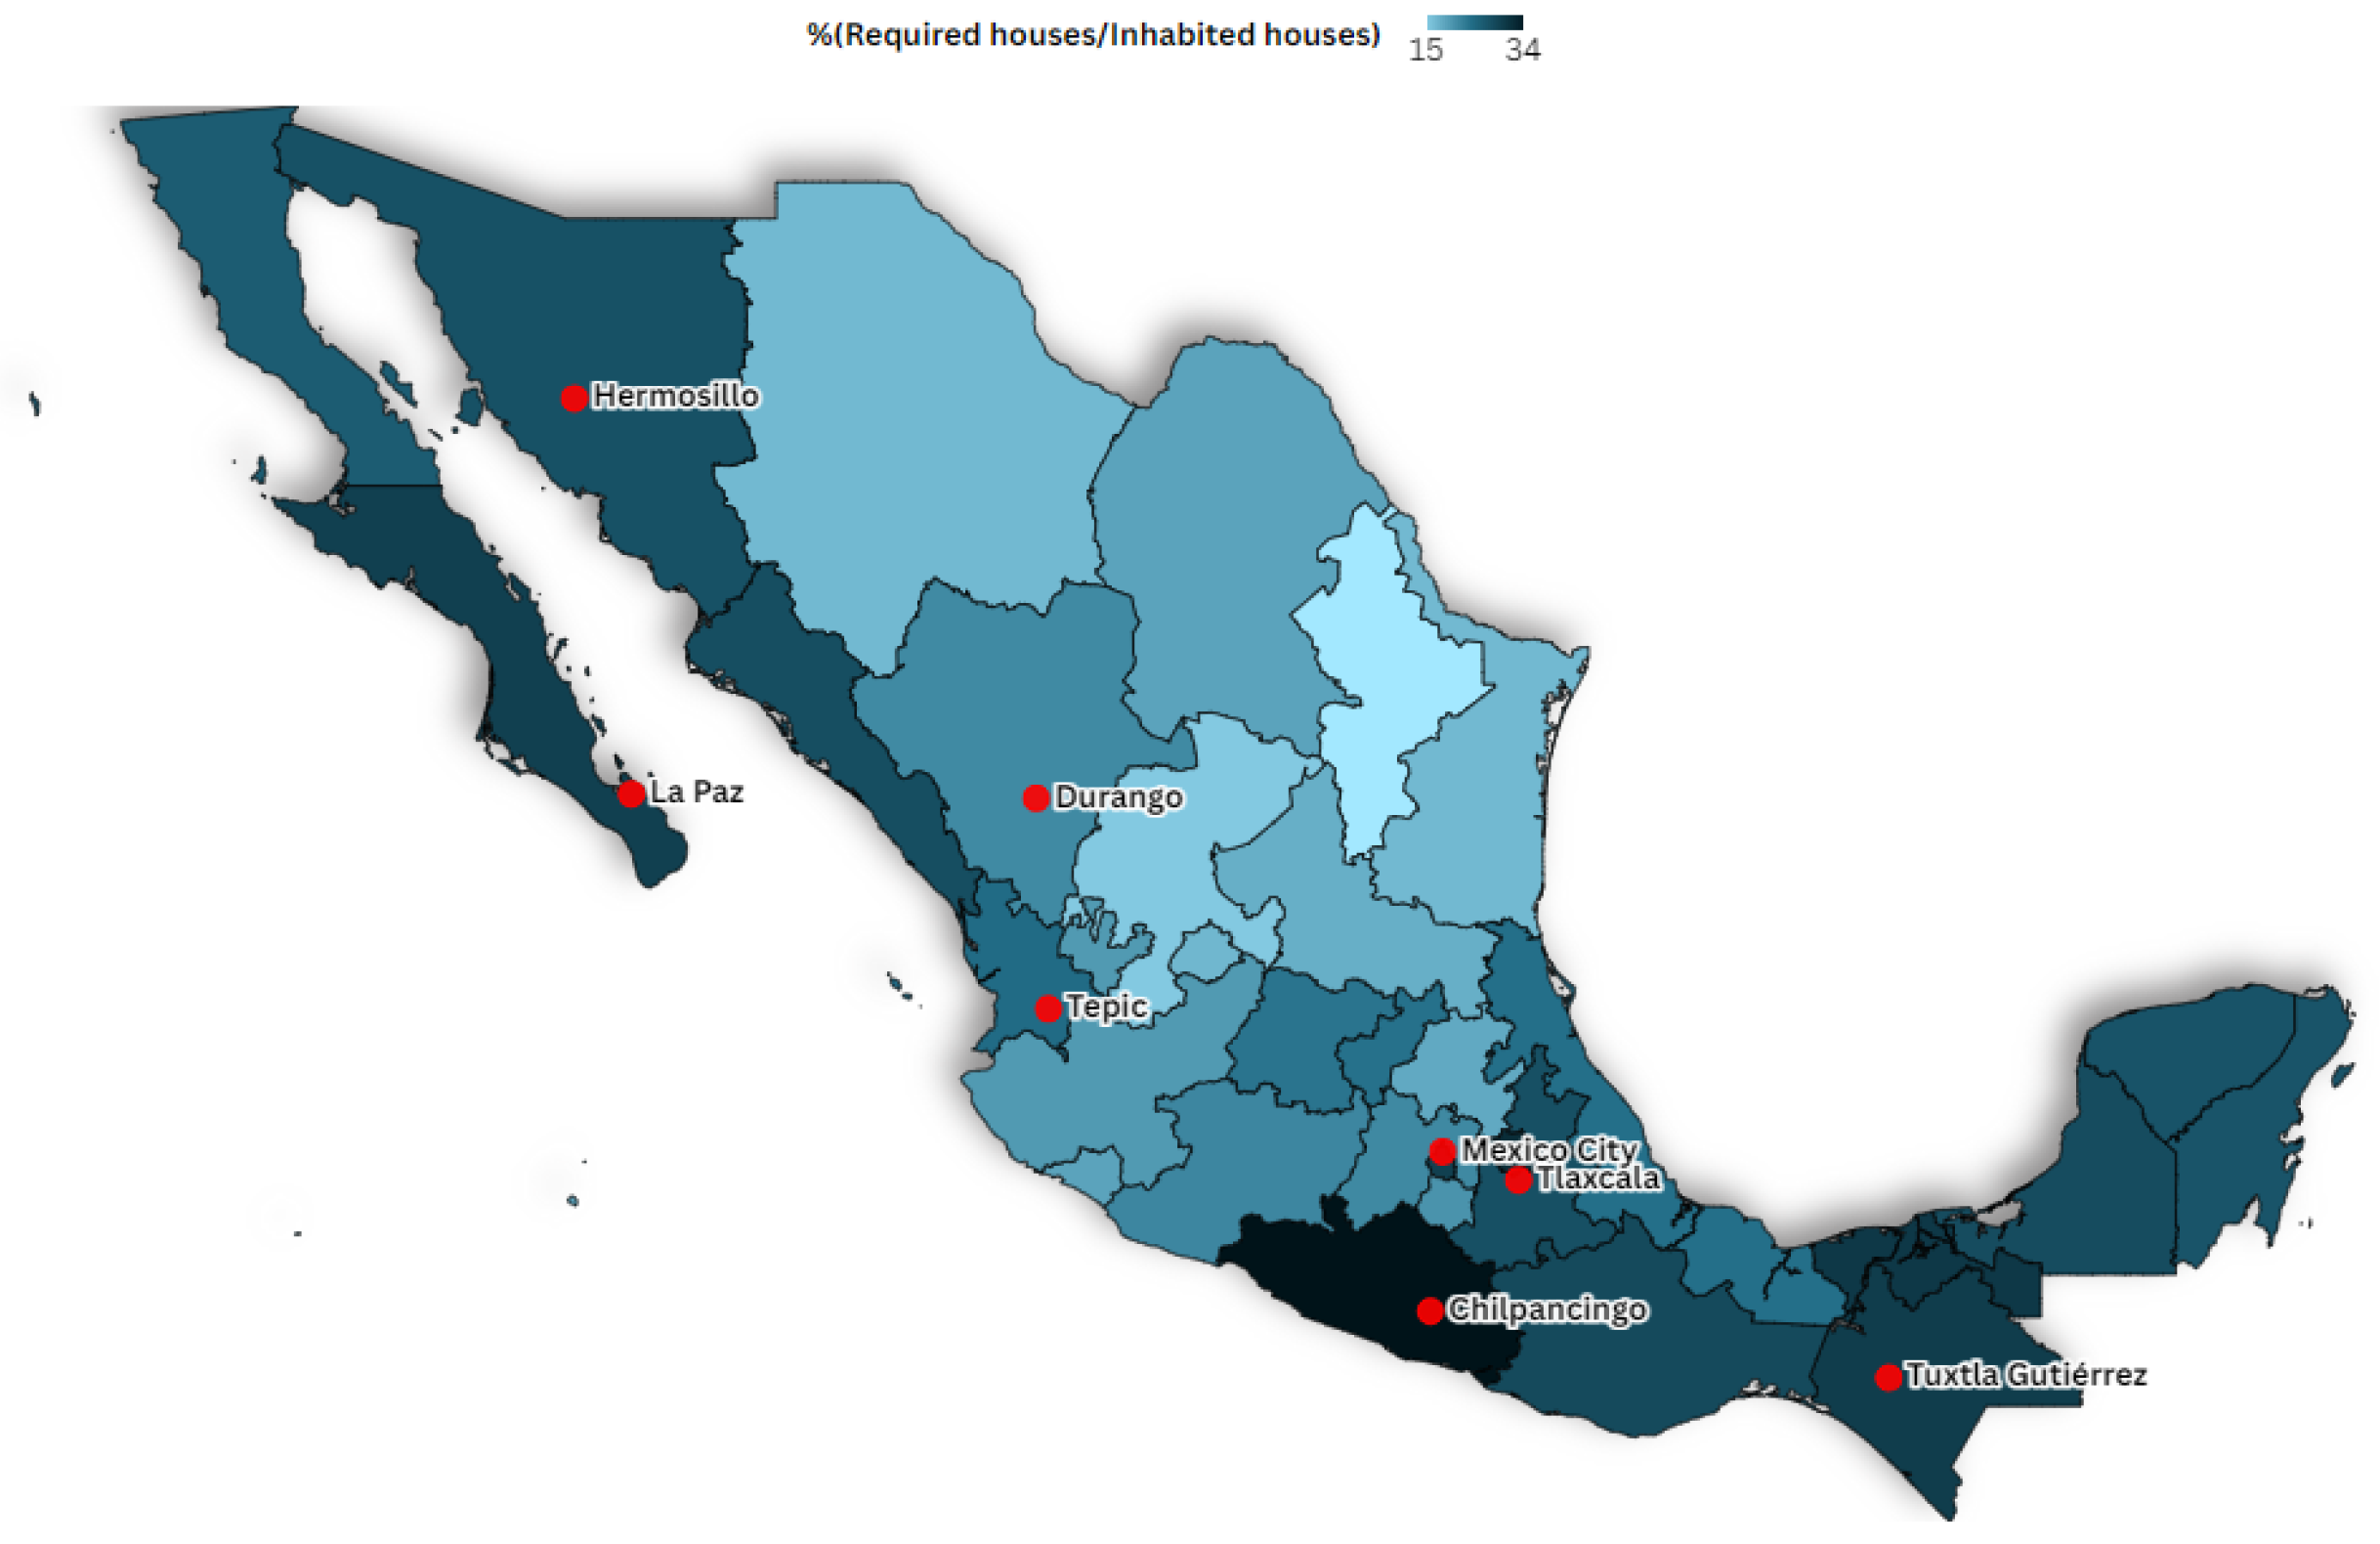
2.1. Studied Cities and Climate

The ratio of required to inhabited housing was used as the main criterion to select the cities for this study [6]. This value was used as it is foreseen that the states with the greatest need for housing will shortly have to build more housing. Consequently, they will also need to develop sustainable buildings. Secondary criteria included geographical and climatic type representation.
The selected cities can be observed in Figure 1. In this investigation, eight cities were chosen for this study. We used their characteristic climatic conditions in the energy building simulation to understand how the building performs under these conditions. The selected cities were chosen considering two factors: (a) The ratio of required to inhabited housing, as cities in states with a higher value were preferred. It is foreseen that the greatest need for housing will shortly increase the demand for housing construction, consequently increasing the need to develop sustainable buildings. (b) The geographic and climatic distribution, distribution of cities in the territory was privileged. Although this was not a restrictive parameter, diverse climatic representation was favored.
The climate data of the selected cities were obtained from the Meteonorm v8 program. The Meteonorm v8 program was used to obtain a Typical Meteorological Year (TMY2) for each selected city. These files were later incorporated into the TRNSYS 18 software through Type-15, one of the elements that allows the user to manage weather variables in TRNSYS. TMY is a data file with the local climate of the Typical Meteorological Year. These data consider a representative year that summarizes the climatic information characterizing the place from data measured over a long period, ideally the lifetime of the subject of interest, in this case, a building.
Table 1 shows the annual averaged ambient temperatures, relative humidity, global horizontal radiation, precipitation, and minimum and maximum ambient temperatures. The annual average ambient temperature in the selected cities ranges from 16.8 °C (Tlaxcala) to 25.7 °C (La Paz). The city with the highest ambient temperature is Hermosillo (39.7 °C), while the one with the lowest is Durango (3.6 °C).

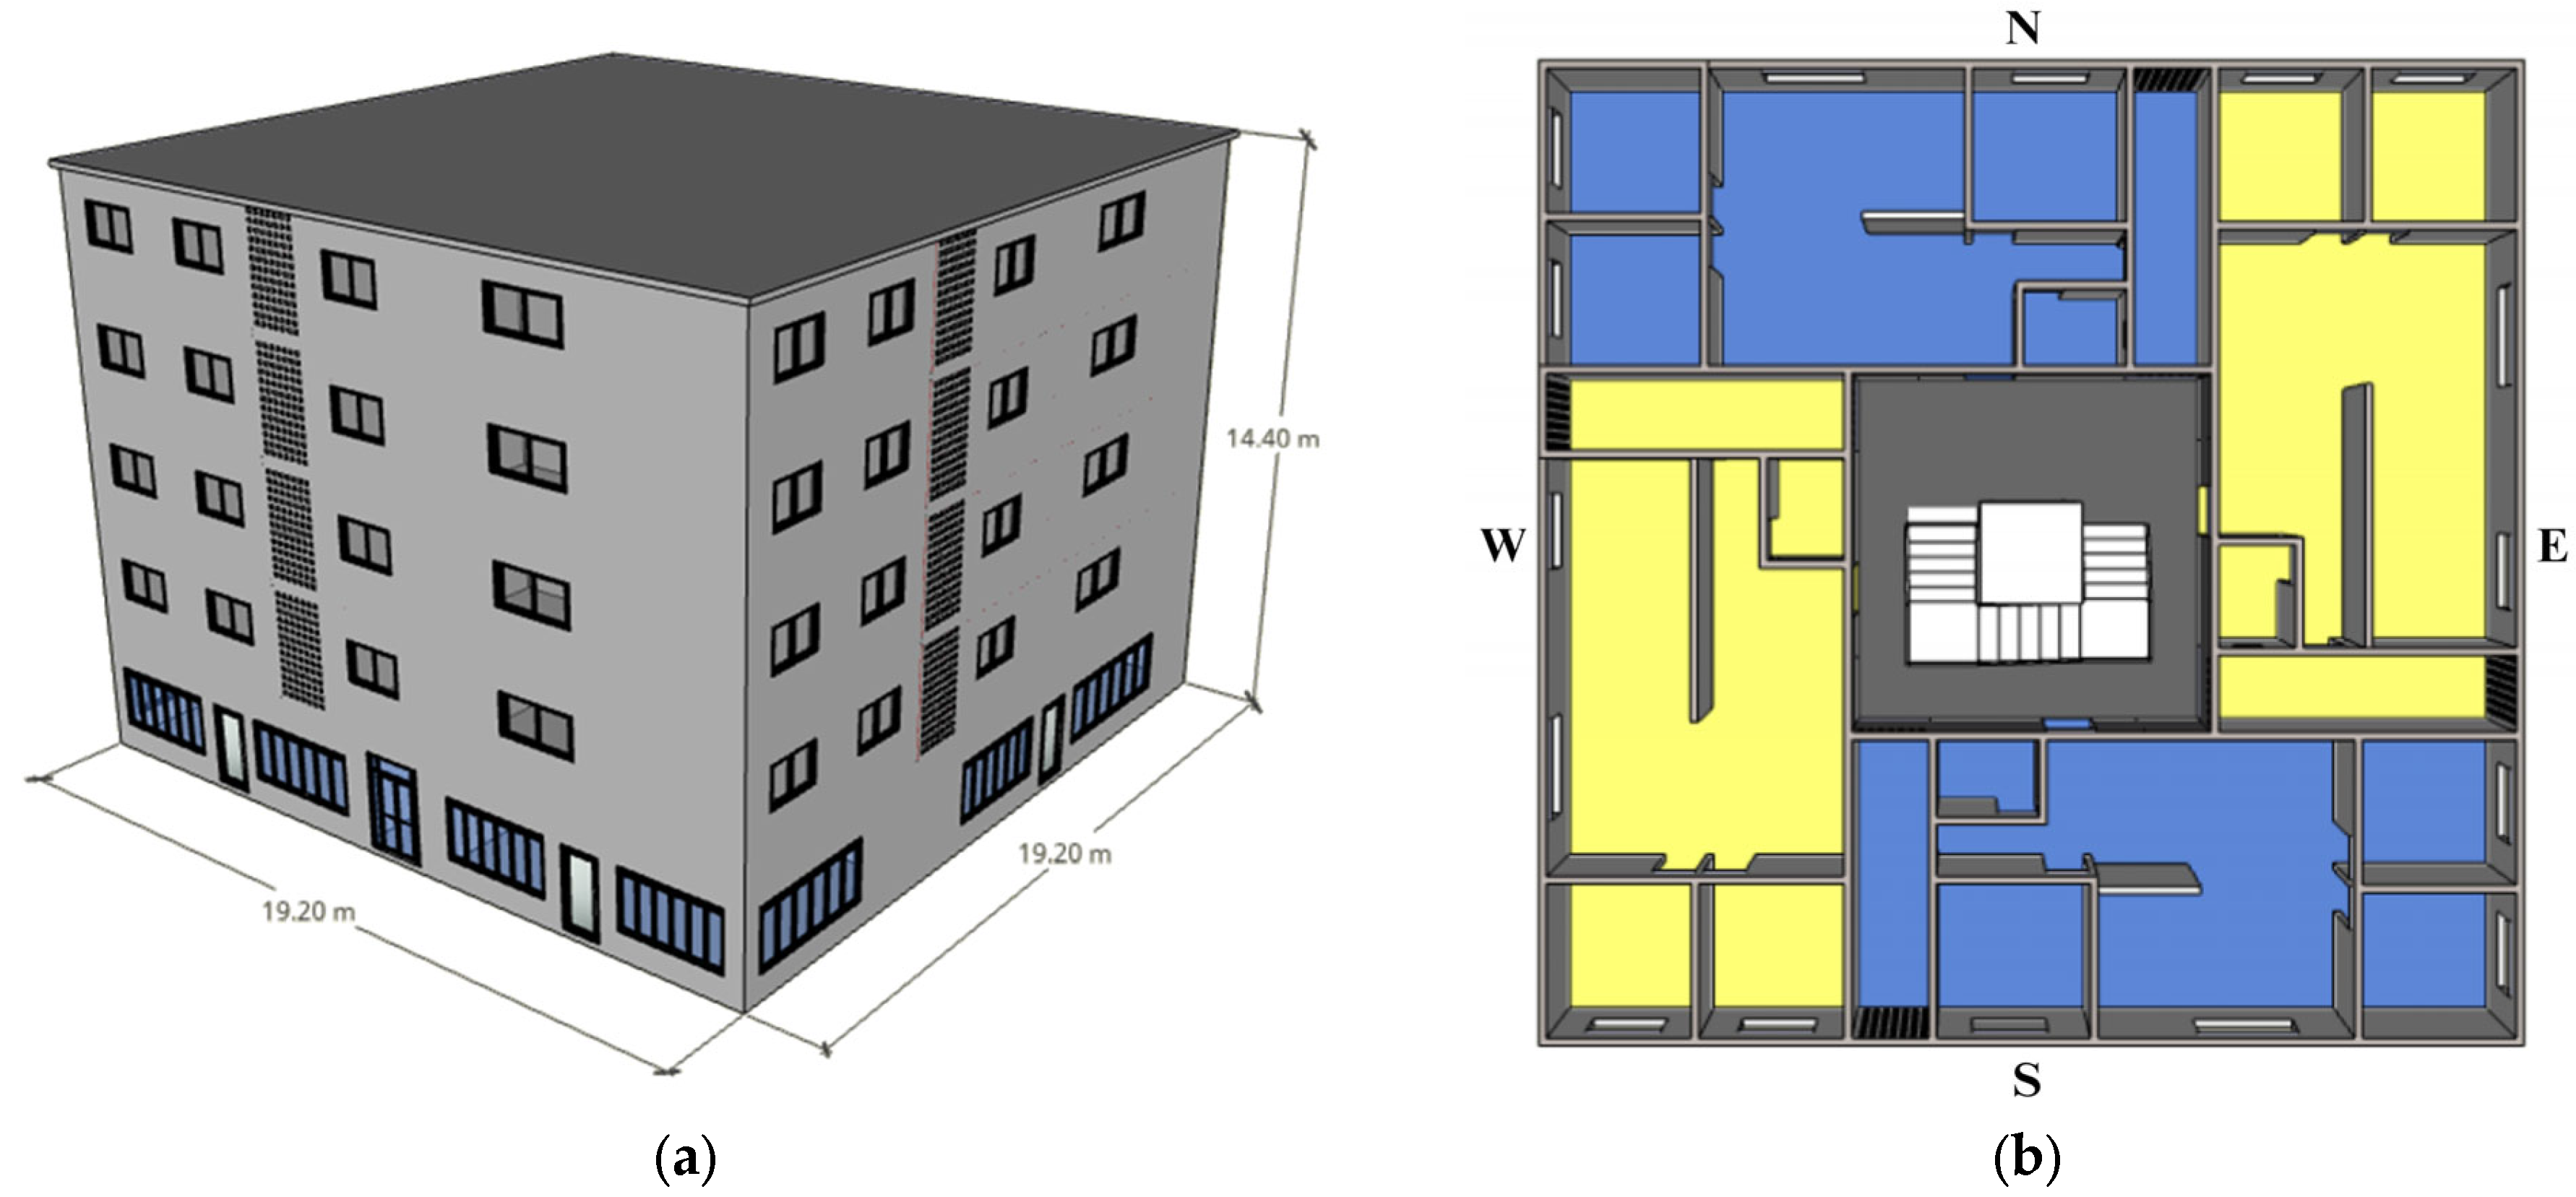
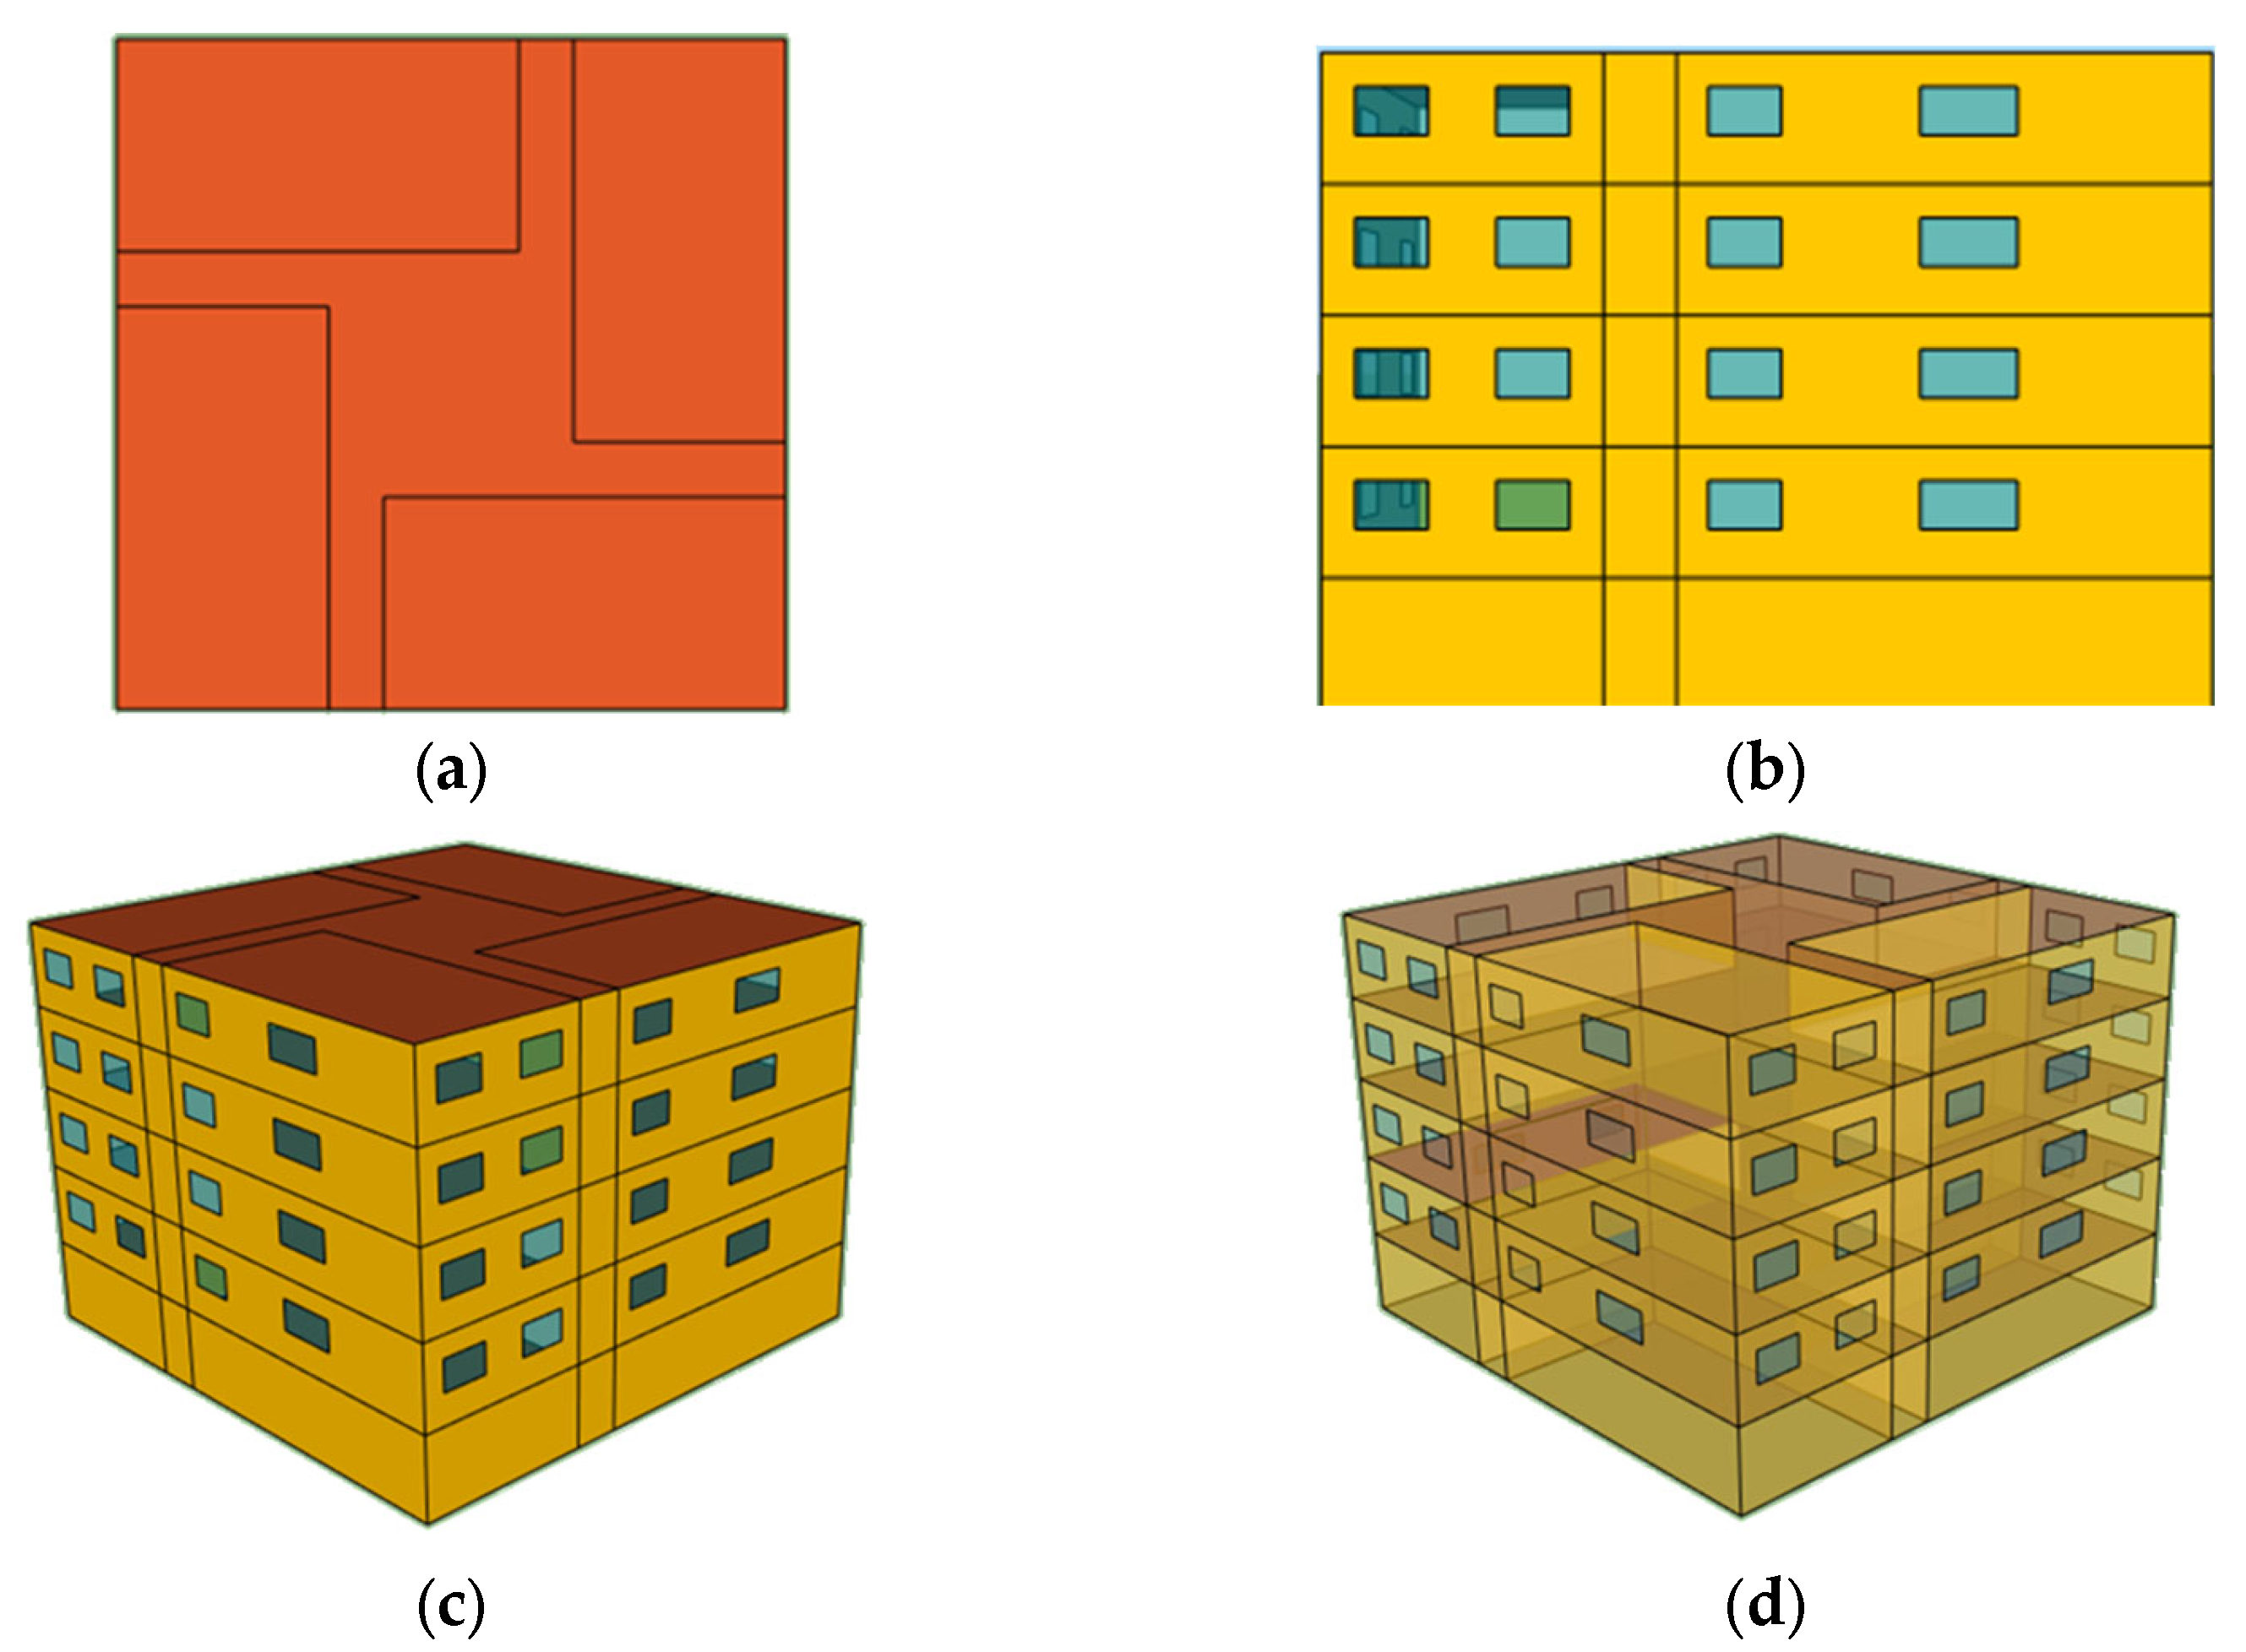
2.2. Reference Building (RB)

Using reference buildings as a baseline has proven useful when assessing buildings from a national policy perspective. The concept is also used in the EU/2010/31 Directive, where it is established that the reference building has characteristics (e.g., construction, functional, geometric, geographic) that make it representative of the national stock of its building type (residential, non-residential, among others). One of the methods described in the literature as helpful in creating a reference building is the Synthetical Average Building. Such a method uses the statistical information available of certain buildings to generate a reference building [30]. Therefore, in this investigation, a reference building was designed to represent the geometry and construction practices used in the country. This aims to serve as a starting point for understanding the energy requirements of a multi-family building built in different cities in Mexico.
According to the Housing Building Code [28], single-family homes and homes grouped in horizontal buildings must have a maximum of 3 levels. In contrast, multi-family homes grouped in vertical buildings must have a maximum of 5 levels, with or without an elevator. For the reference building, it was decided to outline a building with a large surface area to promote the greatest possible coverage by renewable energy systems and favor the compact urban development recommended for sustainable cities [12,13,31]. Different examples of multi-family housing were analyzed for the distribution of interior spaces. A configuration resulting in a symmetrical building was chosen to limit the effect of the building orientation on the energy simulations. The distribution of the rooms in the homes, their dimensions, and their height (2.7 m) were selected considering the criteria defined in the Housing Building Code [28].
The building was modeled in TRNSYS 18, where five thermal zones were defined for each floor in the building model. Table 2 shows the comfort temperatures, which were calculated by evaluating typical climatic conditions during winter and summer in each of the seven cities. With these characteristics, the ASHRAE-55 standard was used to calculate the thermal comfort range for each city [32]. Here, thermal comfort can be defined as a state of mind in which a person feels satisfied with their thermal environment and does not feel cold or hot. A clothing level (clo) of 0.5 was used, and an indoor wind speed of 0.2 m/s was implemented for the summer. In contrast, a clo of 1.0 and an indoor wind speed of 0.05 m/s were considered for winter.
The thermal comfort range and the home’s occupancy profile determine when the air conditioning systems are active. Table 2 lists each city’s temperatures used to activate the air conditioning systems. The heating system activates at the minimum temperature, while the cooling system turns on at the maximum. Heating systems are devices that use energy to produce heat to maintain the air temperature at a desired level. The gap between these two temperatures has an average value of 6.67 °C among the eight cities.

2.3. Energy

Electricity and gas consumption of homes were calculated for each studied city. Fixed energy consumption was calculated based on lighting, appliances, and cooking. In contrast, variable energy consumption includes heating, cooling, and water heating. Lastly, it is essential to highlight that in estimating electrical energy consumption, the energy consumption by the air conditioning system was calculated through TRNSYS simulations. Likewise, the gas required for water heating was calculated for each city’s climatological conditions.

2.3.1. Fixed Energy Consumption

Lighting

According to the results from the National Survey on Energy Consumption in Homes (ENCEVI) [26], fluorescent lamps are the most common type, as 72% of respondents said they use them in their homes. Consequently, fluorescent lamps were used to quantify the lighting energy consumption.
A study was carried out with the DIALux® evo 11 software to quantify the natural lighting and the power needed for the lighting systems within the proposed building geometry. This free-use program simulates the lighting conditions of buildings using photometric files of real luminaires [33]. For the calculation, a work area was established in each space at a height of 0.8 m from the ground. Luminaires that used a compact fluorescent type lamp and whose application was residential type were selected from the LUMsearch® library. The lighting system was designed to meet recommendations for power density and illuminance levels, since no official regulations exist nationwide for residential buildings [34,35]. Lastly, each home’s annual energy requirement for lighting was obtained using the software LENICALC V3 from the Italian National Agency for New Technologies, Energy, and Sustainable Economic Development (ENEA) [36].

Appliances

Data on appliance usage in Mexican homes and their standard energy efficiency ratings were gathered. Such information was collected mainly from the ENCEVI Survey [26] and the NOM-ENER standards [37,38] (Table 3). Table 3 lists appliances commonly found in a typical Mexican home. Also, the average number of days they are used per month and for how much time (in minutes per day) were added, according to ENCEVI data.
In addition, information from the quality reports of the Federal Consumer Protection Bureau (PROFECO), which analyzes products in the Mexican market, was used to select a typical power for each device when possible [29,39,40], as shown in Table 3. For most appliances, consumption was calculated by multiplying its electrical power and average use time. The two exceptions were the refrigerator and the washing machine, for which energy consumption was reported as an annual average value and as an average per wash cycle, respectively. The frequency of use varies significantly among appliances; however, even a device with a high frequency will have low consumption if the electrical power is small.

Cooking

According to information from ENCEVI, most Mexican homes have a gas stove for cooking. Likewise, it is reported that most people use two burners simultaneously for an average of 1 h and 54 min. Also, the quality study data from PROFECO was used to select a commonly bought stove [41].

2.3.2. Variable Energy Consumption

Domestic Hot Water (DHW)

In Mexico, 43.5% of homes have equipment intended for water heating, with 14.3 million units in use [26]. Gas is the most used fuel in these units, with 11.2 million gas water heaters; in contrast, there are only 1.9 million solar heaters. Additional data show that the most common water heater technologies are gas heaters with storage tanks (47%), instantaneous gas heaters (17%), and solar heaters (12%).
The methodology described by García-Valladares and Ituna-Yudonago was adapted to determine the amount of gas used in the building to heat water [42] by not considering solar contribution. In this methodology, the amount of heat necessary to raise the water temperature from the network to a desired temperature is quantified. Subsequently, the amount of gas required is calculated using such heat requirement. To obtain the temperature of the water in the network in different cities, it was decided to consider that the water in the building is stored in an underground space before being distributed to the homes. Therefore, it is estimated that the temperature of the water in the network is similar to the ground temperature. Each person is assumed to require 40 L of hot water per day at 40 °C. Thus, the daily hot water demand is calculated by multiplying the number of inhabitants by the per capita water requirement. The calculation of the energy necessary to heat the water was carried out with Equation (1):
Q r e q = m w a t e r C p w a t e r T w a t e r , u s e r T w a t e r , n e t w o r k ,
where Q r e q is the energy required daily for water heating in the house, in MJ; m w a t e r is the mass of water used daily, in kg; C p w a t e r is the specific heat of the water at constant pressure, in MJ/(kg °C); T w a t e r , u s e r is the user’s required hot water temperature, in °C; and T w a t e r , n e t w o r k is the temperature of the water from the house network, in °C. The calculation considered monthly temperature averages in the six cities of interest. Subsequently, the amount of gas needed ( m g a s ) was obtained applying Equation (2):
m g a s = Q r e q η h e a t e r C V g a s ,
using a heating efficiency ( η h e a t e r ) of 0.76 obtained from a system in the market that complies with the minimum efficiency allowed [43], and the calorific value ( C V g a s ) of liquefied petroleum gas (LP gas or LPG) (48.36 MJ/kg).

Heating and Cooling

For this study, mini-split equipment was selected to maintain a comfortable temperature indoors. According to the ENCEVI survey [26], the most commonly used cooling system in Mexico is the on–off mini-split (40%). On the other hand, ENCEVI shows that only 6.3% of homes in the country have a heating system. As a consequence, an electric heating system was implemented to estimate the heating requirements of the buildings, as it has an estimated usage of 48.3% of the total. The device selected has a SEER of 11.5 W/W for cooling and a COP of 3 W/W for heating, meeting the standard for this type of air conditioning system [44].
The energy needed for maintaining the air temperature within the comfort ranges was calculated through dynamic simulation using the TRNSYS 18 software. During the simulation, the air conditioning system activates when the air room temperature of each house is out of the comfort range and when the occupancy profile indicates that there are people inside the home.
A significant difference between the calculated data and the survey results is the number of homes that use air conditioning. ENCEVI groups the states in the northern, center, and southern regions. For further reference, Supplementary File S1 shows this information and lists the percentages of use of cooling and heating systems stock by state. Appendix A summarizes the characteristics and parameters considered for the reference building.

2.4. Comparison with Available Data

The estimated electricity consumption was compared with data from the ENCEVI survey [26]. Although the survey does not directly measure household electricity use, it provides self-reported electricity bills from respondents. Consequently, the average bimonthly payment was calculated by considering the applicable electricity tariff for each studied city. Then, the bill payment was computed considering the applicable rate, and finally, a comparison was carried out.
A similar comparison was made regarding gas consumption to assess the calculation made with the RB’s assumptions. It is essential to mention that the most common gas purchase in Mexico is made in the form of gas tanks delivered to homes. ENCEVI states that the most frequent gas purchases are for 30 kg (large) and 20 kg tanks (small). Large tanks are the most bought form in La Paz, Durango, Hermosillo, Tepic, and Tuxtla. Meanwhile, small tanks are most widely sold in Mexico City, Chilpancingo, and Tlaxcala. Later, an estimation of the duration of the most common recharge (either small or large tank) in each average home was made. Next, such estimated duration was compared to the ENCEVI answers. As a result of being limited to this range and its percentage distribution, the comparison consists of finding the number of cities which estimated gas duration falls into the most common duration for each city.

3. Results

This section presents the results in three parts: (1) parameters and characteristics of the reference building, (2) energy use analysis concerning its fixed, variable, and total energy, and (3) a comparison of calculated energy use with the ENCEVI survey.

3.1. Configuration of the Reference Building

The RB was designed to reflect typical Mexican construction practices and building geometry, aiming to provide an understanding of the energy requirements of a multi-family building. Below, all the characteristics of the reference building are described, which were based on statistical information of buildings constructed in the country and the energy use in an average home.

3.1.1. Building

The RB floor is built on a 368.64 m2 surface; the total built area is 1843.20 m2, whereas the habitable area is 1293.12 m2. Figure 2 shows the building design and the residential floor’s configuration. The building has five floors; the ground floor is occupied by commercial space, and the four subsequent floors correspond to residential use. The residential floors have the same configuration: four homes were placed on each floor; two are two-bedroom homes, and the other two are three-bedroom homes.
The distribution of the two housing configurations is shown in Figure 3. Here, it is shown that both houses have external dimensions of 13.25 m wide by 6.10 m long, with a total surface area of 80.82 m2. According to the Housing Building Code, it is placed in the Traditional housing category (average constructed area of more than 70 m2). Also, the building has five thermal zones on each floor, which results in 25 thermal zones for the entire model (Figure 4).

3.1.2. Materials

According to the 2020 National Housing Survey [6], 92.4% of the country’s homes have walls consisting of materials such as bricks and concrete blocks [45,46]. When considering the development of multi-family housing, walls built of concrete blocks facilitate their reinforcement with steel [47]. Concerning the roofs, the National Housing Survey (ENVI) indicates that 78.4% of homes have a concrete slab roof or a joist system with a vault. Of the 28,953 homes interviewed in the Energy Consumption Survey (ENCEVI), 4.7% stated that they had ceiling insulation, 1.0% indicated that they had some insulation in the walls, and only 0.54% had specialized windows [26].
Therefore, for this study, the external walls of the building were considered to be uninsulated concrete blocks with exterior mortar coating and interior plaster. Interior walls were made of concrete blocks with plaster on both sides, and the roof was a reinforced concrete slab with a joist and vault system. Table 4 shows the elements of the building configuration and its properties.

3.1.3. Occupancy

With data from 2018, the National Housing Commission (CONAVI) indicates that most homes are inhabited by three and five people [52]. Similarly, in 2020, the average number of occupants per home was 3.6 [53]. For this study, it has been decided to consider an average occupancy of 3.5, with 14 persons per floor, totaling 56 persons in the building. The family configuration is 2: two adults, 3: two adults, one minor, 4: two adults, two minors, 5: two adults, two minors, and a 65+ adult. The distribution of inhabitants on each floor is described in Table 5.
Statistical information from the 2019 National Time Use Survey (ENUT) [27] on how Mexicans use their time was used to create an occupancy profile for all home inhabitants. From this survey, the average time that Mexicans spend in outdoor activities (cultural and sports events, sports and exercise, and shopping) was calculated. It was found that, on average, each spends 11 h of non-domestic activities per week and sleeps an average of 7.57 h daily. Considering this, an overall occupancy profile was defined where each occupant carries out 59 h of domestic activities and sleeps 53 h per week. In total, each house has 112 weekly hours where a person is inside the home and needs potential air conditioning to achieve a comfortable environment. The simulation considered different occupations from Monday to Friday and weekends, but no other seasonal variations like holidays or similar. It is worth mentioning that the house with five inhabitants has a particular characteristic, as the 65+ family members stay at home 24 h. Figure 5 shows the occupation profile, where the hours that the person spends at home and uses air conditioning are marked with an “x”.

3.2. Energy Use

3.2.1. Fixed Energy Consumption

Fixed energy consumption includes lighting, appliances, and cooking. The energy consumption of lighting and appliances was added to estimate the fixed energy consumption, as shown in Table 6. For the two-bedroom house, the estimated annual energy consumption for lighting was 363.3 kWh/year (30.27 kWh/month), and for the three-bedroom home, it was 388.5 kWh/year (32.37 kWh/month).
Furthermore, as described in the Appliances Section, each appliance’s consumption was calculated by multiplying its average electrical power and average use time (Table 3). The refrigerator was an exception, for which its annual energy consumption is reported in its technical data due to the intermittent behavior of its components. Therefore, the fixed electricity consumption is 76.52 kWh/month for the two-bedroom home and 82.95 kWh/month for the three-bedroom home. Lastly, a stove whose standard burners have a measured thermal capacity of 5126 kJ/h and an efficiency of 59% was chosen. Considering that LPG has a calorific value of 48.36 MJ/kg [54] and a density of 0.54 kg/L [55], the calculated daily consumption of gas for cooking food was 0.40 kg (11.12 kg per month).

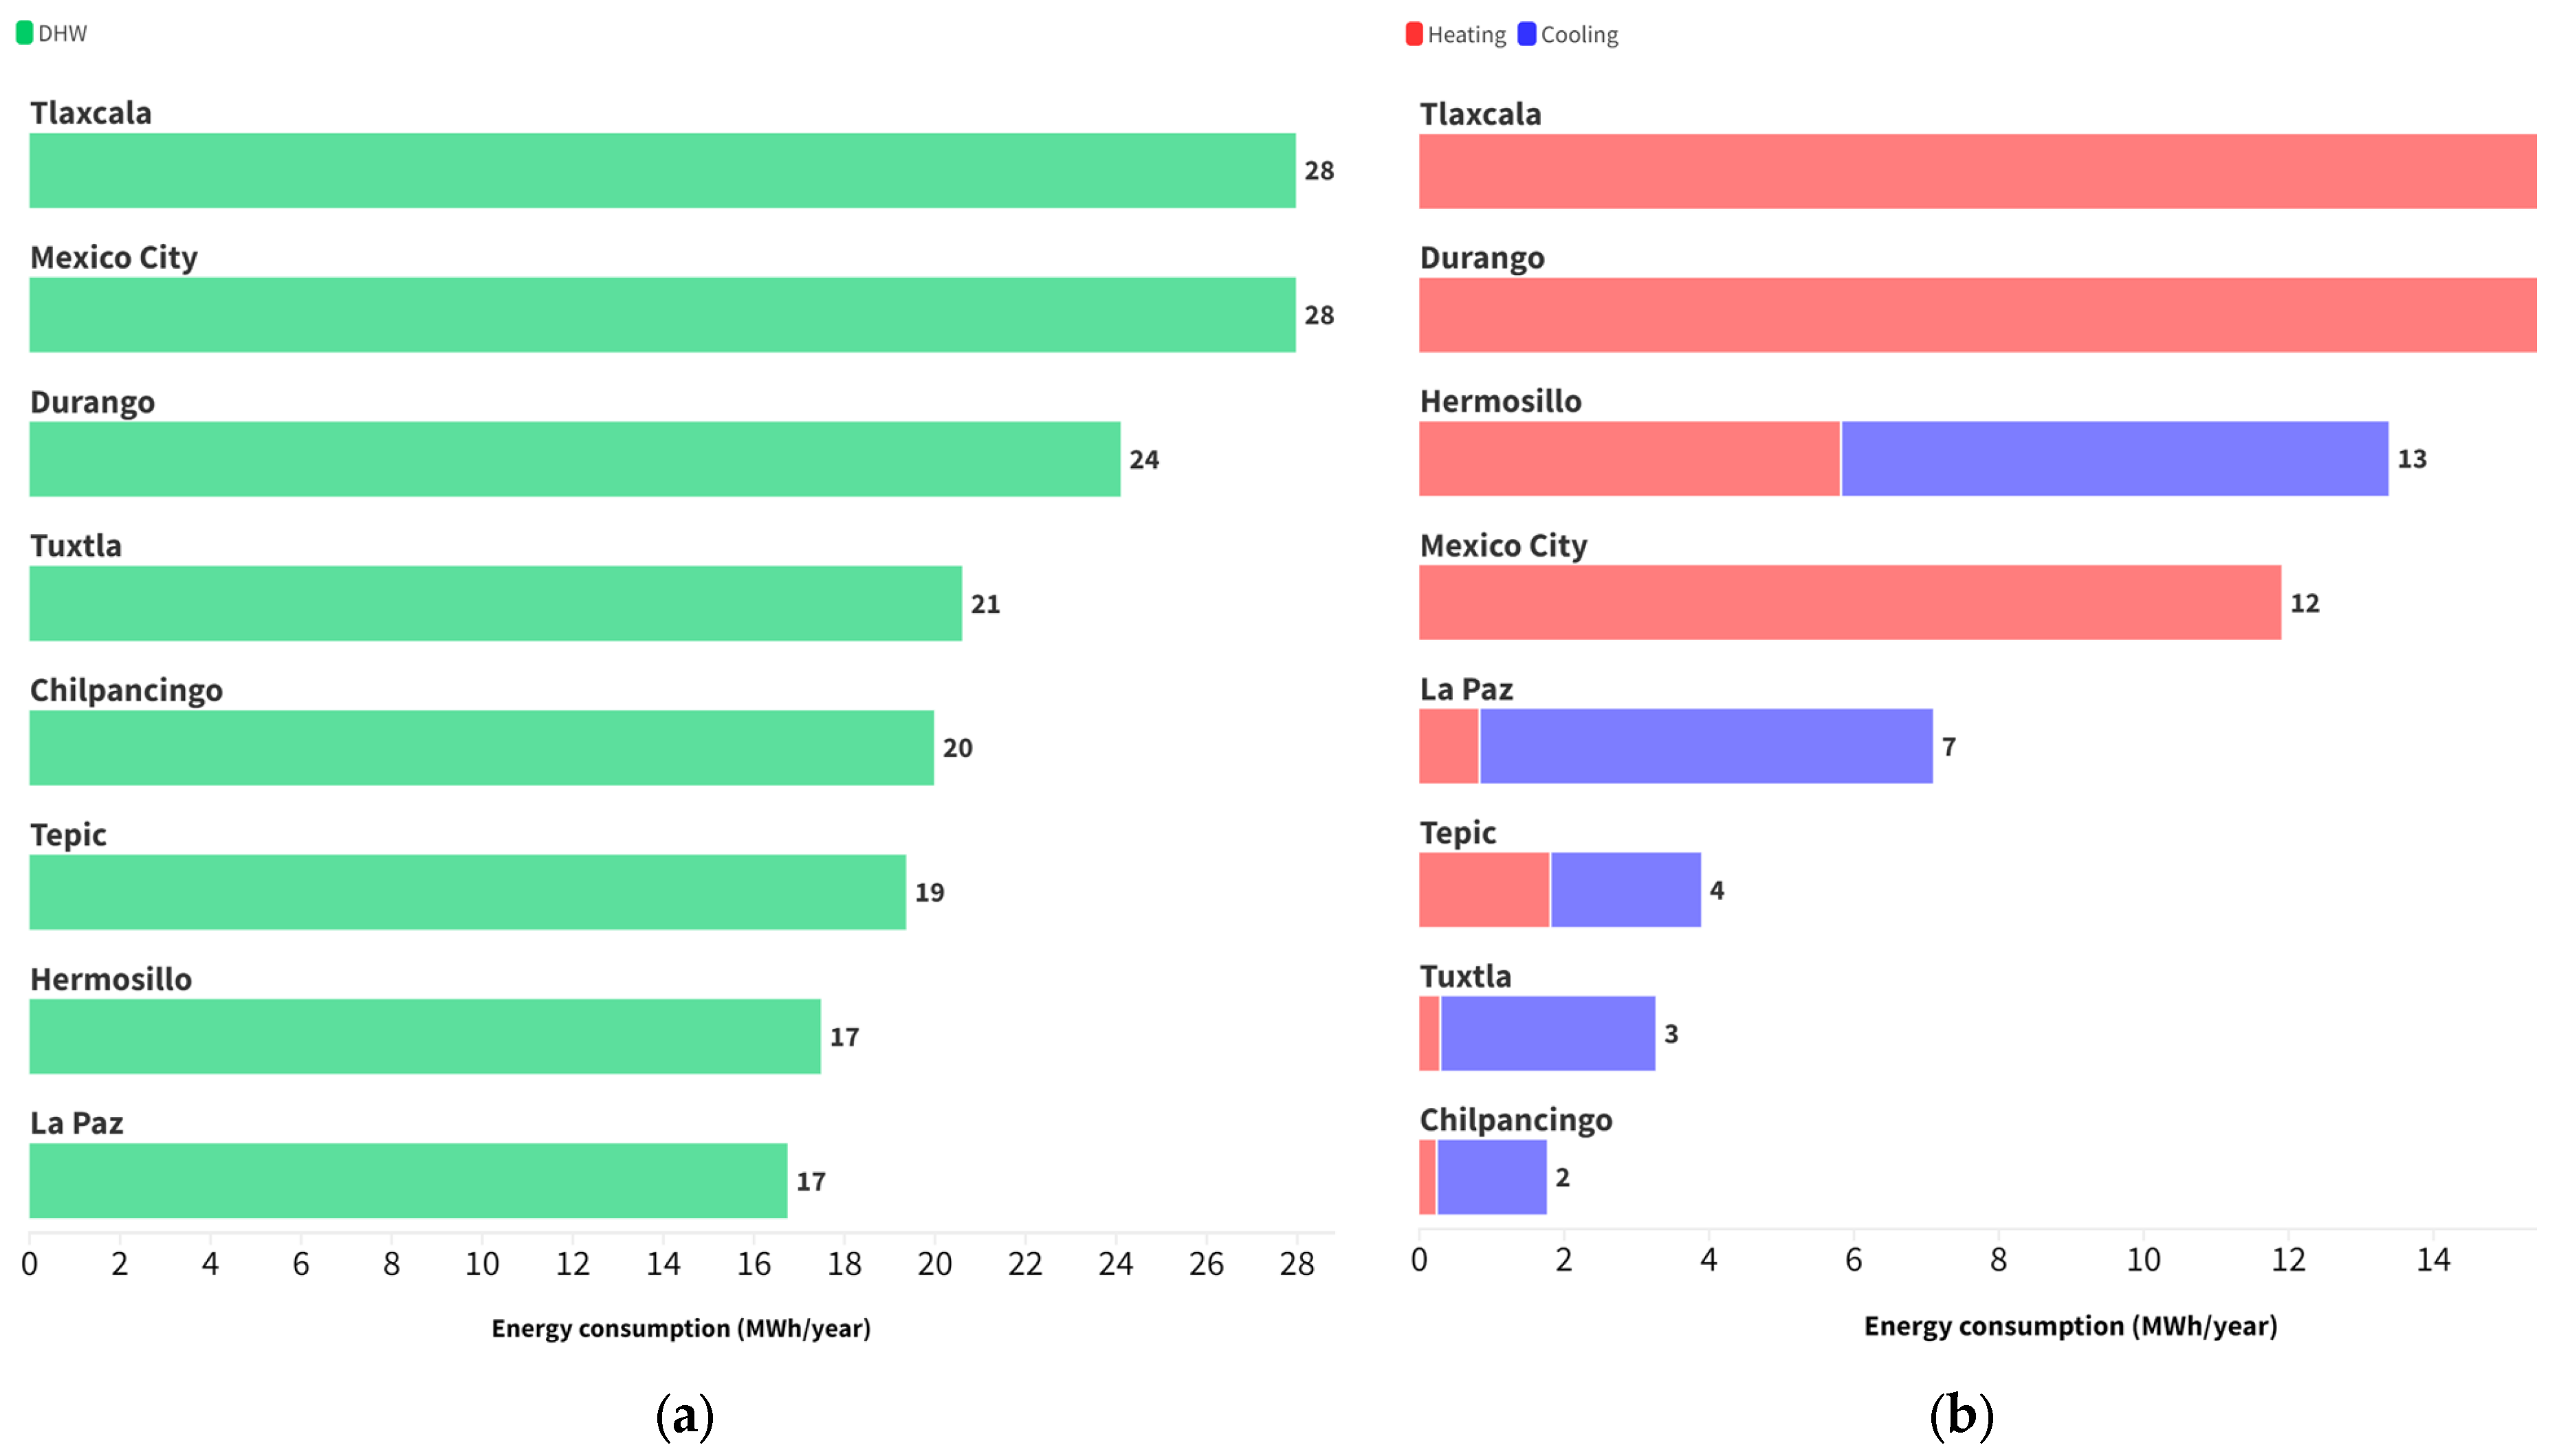
3.2.2. Variable Energy Consumption

The variable energy requirement, which corresponds to DHW and the use of heating and cooling systems, is shown in Figure 6a and Figure 6b, respectively. Regarding DHW (Figure 6a), it was expected that cities with temperate climates had high energy requirements for this energy service. Tlaxcala and Mexico City need up to 32.8% more energy than the city that requires the least (La Paz). In contrast, Figure 6b shows the cities in descending order regarding energy requirements to condition the spaces. Tlaxcala, Durango, and Hermosillo are the cities that need the most energy. Tlaxcala, Durango, and Mexico City would have a dominant energy requirement for heating, while Hermosillo, La Paz, Tuxtla, and Chilpancingo have dominant cooling requirements.

DHW

It was found that domestic hot water (DHW) is a driver of the variable energy requirement for all cities. For the calculation, it is assumed that each person requires 40 L of water per day (at 40 °C); therefore, 2240 L per day needs to be heated for the building. Table 7 shows the heating energy requirements and the quantity of LPG in kilograms for the building in each city. The buildings in cities requiring the most energy would need 2083 kg of LPG annually (Tlaxcala and Mexico City). In contrast, La Paz and Hermosillo need 1246 kg and 1302 kg, respectively.

Heating

The cities in Figure 7 and Figure 8 (heating and cooling energy requirement) are arranged in descending order concerning energy requirements. In addition, the dwellings can be identified by their floor number (1, 2, 3, 4) and their orientation (N, S, W, E), i.e., 3W refers to the third-floor dwelling facing west.
Figure 7 shows that the reference buildings in Durango and Tlaxcala have the highest heating requirements. Tuxtla and Chilpancingo have a negligible heating requirement. In La Paz, it is considered low; this could result in the families opting not to install a heating system. The top-floor dwellings require more heating energy than those on lower floors. Indicating that in vertical housing, middle dwellings benefit from losing less heat through the roof compared to upper dwellings. Considering the above and keeping in mind balancing the energy consumption of the building, it may be advisable to add thermal insulation to the roof of the upper dwellings. But it is not advisable to add it to the mezzanine floors of the building.
The dwelling that consumes the least amount of heating is the 2S (with only four occupants), which is to be expected due to the more significant amount of solar radiation received during the year. Likewise, the dwellings facing west (except those on the 4th floor), together with those facing south (except those with five occupants), are those that consume the least amount of heating.

Cooling

Regarding cooling energy (Figure 8), Tlaxcala and Mexico City did not show cooling energy requirements for this purpose. Hermosillo and La Paz have substantial cooling needs; this is natural due to their warm climate. The home that requires the most energy for cooling is 4N in all cases, while the one that requires the least energy is 2S. On the other hand, when looking at the national average per floor, it can be noted that the first floor requires more cooling than the following floors. The dwellings that consume the least energy for cooling are 2E and 4E.

3.2.3. Total Energy Use

Table 8 summarizes the building’s annual fixed and variable energy requirements. The reference building in Tlaxcala has the highest energy requirement (95,426 kWh/year). In contrast, the reference building with the lowest requirement is in Chilpancingo (71,741 kWh/year); this represents a difference of almost 25% between the cities with the highest and lowest consumption. Also, it is observed that the elevated energy requirement in Tlaxcala is mainly driven by water heating systems and the need for space heating.
The reference building has an annual fixed energy requirement of 49,992 kWh, of which 6014 kWh is for lighting, 15,309 kWh is for the operation of household appliances, and 28,669 kWh is for cooking; such requirements are the same for all the cities. On the other hand, the variable energy requirements of the reference building, which are different for each city, show that the building in Tlaxcala (45,434 kWh/year) would require more variable energy; contrastingly, Chilpancingo requires the least (21,749 kWh/year).
It is worthwhile to point out that DHW energy requirements are substantial for all cities. DHW accounts for 57% to 92% of variable energy requirements and 22% to 31% of total building energy requirements. Mexico City and Tlaxcala have the highest DHW energy requirements, and La Paz has the lowest. There is a 40% difference between La Paz and the cities with the highest energy requirements.
On the other hand, when analyzing heating requirements between cities, the reference buildings that require the least energy are those in Chilpancingo (241 kWh/year), Tuxtla (287 kWh/year), and La Paz (835 kWh/year). The buildings that need the most energy are those in temperate climates, such as Tlaxcala (17,460 kWh/year) and Durango (17,072 kWh/year). It is observed that there are two cities in which the building would not need cooling systems: Tlaxcala and Mexico City. On the contrary, cities such as Hermosillo and La Paz would need up to 7559 kWh/year and 6256 kWh/year, respectively.
Also, when examining energy consumption concerning fuel (electricity or LPG), it is observed that the buildings that would need more electricity are Tlaxcala and Durango, which have temperate climates. The cities that follow such high electricity consumption are Hermosillo and Mexico City. On the other hand, the buildings that would use more LPG are those in Mexico City and Tlaxcala, remembering that these cities also have the highest requirement for DHW fueled by gas.

3.3. Comparison

3.3.1. Electricity

Table 9 shows a comparison of the average electricity bill reported by the participants of the ENCEVI survey, sorted by state and for houses of similar size to the one in this study, against the simulated results from the homes in the reference building. Three different sets of results are presented to explore variations in household energy use: (a) fixed energy (only lighting and appliances), (b) fixed energy plus cooling and heating usage, and (c) fixed energy and cooling.
First, Table 9 presents the comparison against a home that consumes electricity only for basic needs (lighting and appliances) and does not use heating and cooling equipment. It is observed that such a bill is the same for all cities; this is because, within all electricity tariffs, the winter billing in the first 75 kWh (150 kWh bimonthly billing), known as the basic range, is the same for all the country. The energy billing differentiation starts from the intermediate range onwards, but such a range is not achieved for the analyzed homes. In this comparison, the differences between the energy bills in the cities range from 8% to 39%.
Table 9 also shows that when the cost of electricity bills accounts for the use of both cooling and heating systems, many differences occur in cities with temperate climates (Durango, 185%; Mexico City, 88%; Tlaxcala, 247%). This phenomenon seems consistent with the information reported in ENCEVI regarding the low rate of heating used in homes (≅20%). Thus, an estimation was made considering electricity bills excluding heating, where the differences are lower, ranging from 6% to 28%. The city with the greatest difference is Chilpancingo (28%), while a minor difference occurred in Tuxtla Gutiérrez (6%). Supplementary File S2 shows a detailed comparison between the billing of all dwellings and ENCEVI.
Although the simulation of the homes guarantees perfect thermal comfort, in practice, not all homes have the resources to acquire the equipment or the disposition to condition the indoor air whenever required. For example, according to ENCEVI data, the northern states use air conditioning systems in the highest percentage. However, even in these states, only 48% of homes have a cooling system, while only 20% use some system to heat the indoor air (see more details in Supplementary File S1).

3.3.2. Gas

The estimated gas consumption for the average home was calculated and presented in Table 10. After making this comparison, an agreement was found between the survey data and the simulation results from Chilpancingo, Durango, Mexico City, and Tlaxcala. In Chilpancingo and Durango, the survey reports that most homes have a one to two-month duration of their LPG tanks, while this investigation results estimated a 1.1 and 1.5 month recharge duration, respectively. Similarly, this work reports a duration of 0.9 months in Mexico City and Tlaxcala, matching the survey reports. In contrast, the gas tank duration was underestimated for the rest of the cities, meaning that the gas tank would last for less time than in reality. For example, in Hermosillo, the ENCEVI discloses that homes have a gas duration of two to four months (32%), and in this calculation, it was less than two months (1.7). However, it is observed that the second most common tank duration in this city (30%) was between one and two months, so this work’s estimated value is not as far from what was reported.
On the contrary, if we look at the results of cities with less extreme climates—more homogeneous temperatures throughout the year (i.e., Tepic)—where the most frequent tank duration is between two and four months (43%). The second most frequent duration is four to six (24%), and the third frequency is one to two months (18%), which matches this work’s estimate.

4. Discussion

This study develops a reference building (RB) and an energy assessment of its operation in eight Mexican cities as an initial step toward nZEB implementation in Mexico. The RB was created using statistical data available from the national residential stock.
The proposed RB requires land of less than 370 m2 and has a living area of 1293 m2, distributed in four dwellings of 80.82 m2 per floor. According to the Housing Building Code, this dwelling size classifies it as “traditional” [28]. The building consists of concrete block walls, the roof has a lightweight concrete slab, and the glazing comprises single-glazed windows with aluminum frames.
The energy requirements of the RB were calculated using simulations in TRNSYS, differentiating between fixed energy (appliances, lighting, and cooking) and variable energy (DHW, heating, and cooling). The energy requirements were calculated for the entire building, but the information was also disaggregated by dwelling, floor, and orientation. Similarly, the energy consumption was classified according to the energy source used: electricity or LPG.
Monthly fixed energy requirements ascend to 107 kWh and 115 kWh of electricity in the two-bedroom and three-bedroom houses, respectively, and 11.12 kg of LPG. Such requirements range on average from 53% (in Tlaxcala) to 70% (in Chilpancingo) of the total energy requirement of the house.
On the other hand, the need to heat sanitary water (DHW) is a key driver of the variable energy requirements in all cities. This is particularly true in the cities of Tlaxcala and Mexico City, which do not have a particularly warm climate. This contrasts Hermosillo and La Paz, which are cities with a predominance of hot weather throughout the year.
Tlaxcala and Durango, which have temperate climates, have the highest electricity consumption for RB, mainly used to operate heating systems, representing more than 97% of the electricity associated with the thermal comfort of the occupants. In contrast, the cities that require the least energy are Chilpancingo, Tuxtla Gutierrez, and Tepic, and they have a dominant requirement for cooling.
Dwellings on the upper floor require more heating energy. This results in advantages for the dwellings on the other floors, as they benefit from losing less heat through the roof. Similarly, homes facing south—except for the homes with five persons and homes facing west—except those on the top floor, consume the least heating energy. This is because homes with five occupants (1S, 2N, 3S, and 4N) have higher heating and cooling consumption; such a phenomenon occurs since these homes have 24 h usage of heating and cooling systems. This consideration was made assuming that one of the family members remains home all day; however, this scenario also represents homes with poor energy habits regarding using these systems.
Comparisons with ENCEVI data show that the reference building model allows consumption to be calculated within the range of values that occur in practice within the Mexican housing sector. The electricity comparison is a good match, especially considering that most Mexican households do not own heating systems or prefer not to use them, probably due to economic and cultural practices.
When analyzing electricity bills that include fixed energy, heating, and cooling, significant discrepancies were found between ENCEVI survey data and simulation results. In contrast, when the use of heating systems was excluded, the differences were reduced to an average of 15% (ranging from 6% to 28% in the cities studied). Regarding gas use, the results indicated that the implemented methodology estimates gas consumption more closely in cities with temperate climates but may underestimate consumption in other climates.
Therefore, the gas comparison was more challenging due to ENCEVI survey data format limitations. Such data shows that RB tends to adequately reproduce gas consumption in temperate climates but overestimates it in hot climates. Nevertheless, identifying the actual overestimation with the available data format was found to be unfeasible.
In this investigation, the characteristics of the building were chosen based on the available statistical data. These decisions aim to represent the average conditions of the dwellers. However, in practice, several cultural customs or habits that are not considered in this study due to their complexity and variability are known factors that influence energy consumption in buildings. These actions may include construction decisions, regional holidays, individual energy habits, families suffering from energy poverty, or personal preferences. For example, some families prefer a distinct water temperature for showering, and others do not own heating or cooling systems.
Also, it is crucial to consider that it is complicated to reproduce the conditions and customs of each home. Lastly, it is vital to remark that it would be desirable to have access to more quality and recent data sources to evaluate this investigation’s findings properly.

5. Conclusions

Although a reference building is designed to represent a specific building type, it cannot fully replicate the diversity of the national building stock. Nevertheless, RBs can be considered a valuable tool for evaluating energy performance studies, particularly those carried out during the development of national policies, where it is important to have a baseline from a wide group of buildings of the same kind. In Mexico, there are still not enough tools and databases focused specifically on multi-family buildings, despite the need to densify some regions of the country.
It is considered that through the development of this study, a positive impact can be attained for different actors. Mainly due to the importance of the building sector and the role that housing plays in people’s daily lives. Considering the above, the development of energy-efficient housing can help reduce energy poverty in homes. In addition to the economic aspects, the development of low or zero-energy housing can favor people’s health. Likewise, homes designed to maintain a comfortable temperature range contribute to reducing the effects of fluctuating temperatures inside homes. Lastly, developing energy-efficient housing can help reduce air pollution levels through the diminished use of electricity and LPG, reducing cardiorespiratory diseases derived from air pollution.
Vertical and multi-family buildings are a key option for developing sustainable housing. This study lays groundwork for the transition towards nearly zero-energy buildings (nZEB) in Mexico by providing an initial energy model of a typical multi-family building. However, this transition faces challenges nationwide, which still need to be addressed, alongside technical aspects in future studies. For example, only a few studies address the actual energy use in vertical buildings, limiting the availability of primary data for designing effective strategies and policies for the transition to nZEB. It is also necessary to take into consideration economic and financing constraints. The need to build low-cost housing to meet current demand may compete with the initial investment in nZEB technologies if there are no appropriate financing mechanisms. Finally, due to electric tariffs being subsidized for residential users in Mexico, particularly in warm climates, nZEB may be perceived as less favorable from the end user perspective.
When designing and implementing nZEB buildings, specific implications must be considered, especially in regions where these concepts have not yet been incorporated into current regulations. For instance, nZEBs are designed to minimize energy consumption through various techniques that can significantly reduce dependence on fossil energy sources. Also, many nZEBs generate energy from renewable sources, contributing to sustainability and reducing carbon emissions. However, some places have not fully developed the infrastructure for integrating renewable energy or affordable, efficient technologies. The nZEBs help mitigate climate change by reducing greenhouse gas emissions associated with buildings, among the largest energy consumers globally.
The following policy recommendations and building code revisions can be considered to facilitate the transition to nearly zero-energy buildings (nZEB):
  • Update building codes by incorporating energy efficiency requirements and minimums on renewable energy use into national building codes, such as establishing limits on primary energy consumption and promoting using materials that enhance thermal performance.
  • Develop professional training programs for architects, engineers, and builders in techniques and technologies. Create skills certification systems to ensure compliance with standards.
  • Launch educational campaigns to inform the public about the benefits of better-performing buildings in terms of energy efficiency, economic savings, and environmental impact.
  • Conscious implementation of subsidies or low-interest financing for projects that adopt nZEB standards, motivating developers and owners to invest in sustainable technologies.
  • Intensify actions to promote research and development by funding research projects that seek innovations in design, materials, and technologies for nZEB buildings adapted to local cultural and climatic conditions.
On the other hand, in Mexico and other countries, nZEB standards are nonexistent, inadequate, or ongoing. When generated, they must be tailored to specific climatic, economic, and social conditions, including developing regulatory frameworks promoting implementation. The lack of clear and consistent regulations and the absence of incentives can hinder the implementation of effective policies. The construction and energy industries tend to be cautious, which creates resistance to adopting new practices and technologies. In addition, financial and technological challenges exist, as implementing nZEBs can be initially costly due to adopting business-as-usual practices and incorporating new technologies. However, energy savings and environmental benefits are known to offset the costs in the long run.

Supplementary Materials

The following supporting information can be downloaded at: https://www.mdpi.com/article/10.3390/urbansci9040113/s1, Supplementary File S1 and Supplementary File S2.

Author Contributions

Conceptualization, C.A.E.-R. and N.A.R.-M.; formal analysis, C.A.E.-R., N.O.-A. and J.L.-Á.; investigation, C.A.E.-R. and N.A.R.-M.; methodology, C.A.E.-R.; project administration, N.A.R.-M.; software, C.A.E.-R.; validation, N.O.-A. and J.L.-Á.; visualization, C.A.E.-R.; writing—original draft, C.A.E.-R.; writing—review and editing, N.O.-A., J.L.-Á. and N.A.R.-M. All authors have read and agreed to the published version of the manuscript.

Funding

This research received no external funding.

Data Availability Statement

Data were derived from public national sources and are referenced in this article. The original contributions presented in this study are included in the article and Supplementary Files S1 and S2. Further inquiries can be directed at the corresponding authors.

Acknowledgments

The authors want to express gratitude to Ismael Hernández-Landeros for the IT technical support and the CIMAV-Durango Simulation Laboratory. Espino-Reyes thanks the Secretaría de Ciencia, Humanidades, Tecnología e Innovación (SECIHTI) for awarding the PhD grant number 814218.

Conflicts of Interest

The authors declare no conflicts of interest.

Abbreviations

The following abbreviations are used in this manuscript:
CONAVINational Housing Commission
DHWDomestic hot water
ENCEVINational Survey on Energy Consumption in Homes
ENEAItalian National Agency for New Technologies, Energy, and Sustainable Economic Development
ENUTNational Time Use Survey
ENVINational Housing Survey
EPBDEnergy Performance of Buildings Directive
GHGGreenhouse gases
HVACHeating, ventilation, and air conditioning
IEAInternational Agency for Energy
LPGLP gas
nZEBnearly zero energy buildings
PROFECOFederal Consumer Protection Bureau
PRONACENational Strategic Program
RBReference building
RUVHousing Registry
SDGSustainable Development Goals
SECIHTIScience Secretary
UNUnited Nations

Appendix A

Table A1. Summary of reference building characteristics and parameters.
CharacteristicsDescription, ValueReference
Building -
TypeResidential mixed building-
SizeConstruction area: 19.2 m × 19.2 m, height: 14 m-
Number of floors5 floors (1 commercial use, 4 residential)-
Envelope surface areaTotal: 1843.2 m2, walls and roof: 1474.5 m2-
Volume5308.41 m3-
Surface-area-to-volume ratioTotal: 0.35, walls and roof: 0.27-
Infiltration rate1.5 air changes per hour (ach)[56]
Dwellings
Envelope surface areaTotal: 1624.3 m2, walls and roof: 1255.7 m2-
Volume4257.8 m3-
Surface-area-to-volume ratioTotal: 0.38, walls and roof: 0.29-
Window-to-wall ratio11.72%-
Mean occupancy3.5[52,53]
Internal gains
OccupancyDomestic activities: 75 W per inhabitant
(convective: 31.5 W, radiative: 43.5 W)
Resting: 70 W per inhabitant
(convective: 28 W, radiative: 42 W)
[57]
AppliancesConvective: 3.4 W/m2, radiative: 2.2 W/m2[57]
LightingConvective: 3.4 W/m2, radiative: 5.4 W/m2[58]
Energy Systems
CoolingMinisplit ON/OFF, SEER = 11.5[44]
HeatingMinisplit ON/OFF, COP = 3[44]
Water heaterStorage 38 L, n = 0.76[43]
LightingCompact fluorescent lamp[26]
Stove (burner)thermal capacity = 5126 kJ/h, n = 0.76[59]
Mechanical ventilationWithout mechanical ventilation-

References

  1. Intergovernmental Panel on Climate Change. Intergovernmental Panel on Climate Change; IPCC Press Release: Geneva, Switzerland, 2021. [Google Scholar]
  2. United Nations Environment Programme. Global Alliance for Buildings and Construction 2023. In Global Status Report for Buildings and Construction; United Nations Environment Programme: Nairobi, Kenya, 2024. [Google Scholar] [CrossRef]
  3. United Nations Environment Programme. Global Alliance for Buildings and Construction 2020. In Global Status Report for Buildings and Construction: Towards a Zero-Emissions, Efficient and Resilient Buildings and Construction Sector; United Nations Environment Programme: Nairobi, Kenya, 2020. [Google Scholar]
  4. Comisión Económica para América Latina y el Caribe. La Agenda 2030 y Los Objetivos de Desarrollo Sostenible: Una Oportunidad Para América Latina y El Caribe; Comisión Económica para América Latina y el Caribe: Santiago, Chile, 2018. [Google Scholar]
  5. United Nations Department of Economic and Social. Affairs Sustainable Development 11 Make Cities and Human Settlements Inclusive, Safe, Resilient and Sustainable. Available online: https://sdgs.un.org/goals/goal11#targets_and_indicators (accessed on 28 January 2025).
  6. INEGI; INFONAVIT; SHF. Encuesta Nacional de Vivienda (ENVI), 2020. 2021. Available online: https://www.inegi.org.mx/programas/envi/2020/ (accessed on 1 April 2025).
  7. Registro Único de Vivienda Información Estratégica/Cifras Básicas RUV. Available online: http://portal.ruv.org.mx/index.php/cifras-basicas-ruv/ (accessed on 15 January 2025).
  8. Espino-Reyes, C.A.; Rodríguez-Muñoz, N.A. Perspectiva de Programas y Políticas de Eficiencia Energética En Los Edificios Residenciales En México. In Proceedings of the XLVI Semana Nacional de Energía Solar, Hermosillo, Mexico, 3–7 October 2022. [Google Scholar]
  9. Tori, F.; Bustamante, W.; Vera, S. Analysis of Net Zero Energy Buildings Public Policies at the Residential Building Sector: A Comparison between Chile and Selected Countries. Energy Policy 2022, 161, 112707. [Google Scholar] [CrossRef]
  10. Secretaría de Desarrollo Agrario Territorial y Urbano. Programa Nacional de Vivienda 2019–2024; Sociedad Hipotecaria Federal: Anzures, Miguel Hidalgo, 2019. [Google Scholar]
  11. Science Council SECIHTI. Programas Nacionales Estratégicos PRONACES: Vivienda. Available online: https://secihti.mx/pronaces/pronaces-vivienda/ (accessed on 28 January 2025).
  12. United Nations Human Settlements Programme (UN-Habitat). World Cities Report 2020 the Value of Sustainable Urbanization; United Nations Human Settlements Programme (UN-HABITAT)-Headquarters: New York, NY, USA, 2020. [Google Scholar]
  13. ONU-Habitat; INFONAVIT. Vivienda y ODS En México. 2018. Available online: https://onu-habitat.org/index.php/la-vivienda-en-el-centro-de-los-ods-en-mexico (accessed on 1 April 2025).
  14. 4S Real State Foresight Gran Reporte de Verticalización 2024. 2024. Available online: https://publicacionesonuhabitat.org/onuhabitatmexico/VIVIENDA_Y_ODS.pdf (accessed on 1 February 2025).
  15. Laboratorio Nacional de Políticas Públicas; Citibanamex; Centro de Investigación y Docencia Económicas; Centro Mario Molina. Instituto Mexicano para la Competitividad Índice de Ciudades Sostenibles-Resultados. Available online: https://ics.lnpp.mx/#resultados (accessed on 23 January 2023).
  16. Córdova, F.; Alpuche, M. Relación Entre La Intensidad de Uso de Energía y La Morfología Urbana Densificación Como Estrategia de Mitigación Del Cambio Climático. Vivienda Comunidades Sustentables 2022, 12, 27–54. [Google Scholar] [CrossRef]
  17. Lopez-Ordoñez, C.; Garcia-Nevado, E.; Crespo-Cabillo, I.; Roset Calzada, J.; Coch, H. Reducing Residential Cooling Demand in a Sprawling Desert City through Vertical Urban Densification. J. Build. Eng. 2024, 95, 110089. [Google Scholar] [CrossRef]
  18. Sarkar, A.; Jana, A. Interpreting the Energy Choices and Environmental Satisfaction Determinants in Low-Income Housing Typologies: Cases from Slums and Slum Rehabilitation Housing of Mumbai, India. Cities 2023, 143, 104576. [Google Scholar] [CrossRef]
  19. Del Hierro López, I.; Polo, J.; Martín Chivelet, N.; Olivieri, F.; Caamaño-Martín, E.; Olivieri, L. Photovoltaic Self-Sufficiency Potential at a District Scale in Madrid. A Scalable Methodology. Energy Build. 2024, 323, 114764. [Google Scholar] [CrossRef]
  20. Li, W.; Zhou, Z.; Han, Y. An Actual-Performance-Oriented Study on the Relationship between Environmental Efficiency and Passive Design Factors for Multi-Family Dwellings in Cold Areas. Energy Build. 2023, 285, 112825. [Google Scholar] [CrossRef]
  21. Alonso, C.; Oteiza, I.; Martín-Consuegra, F.; Frutos, B. Methodological Proposal for Monitoring Energy Refurbishment. Indoor Environmental Quality in Two Case Studies of Social Housing in Madrid, Spain. Energy Build. 2017, 155, 492–502. [Google Scholar] [CrossRef]
  22. Vallati, A.V.; Fiorini, C.; Grignaffini, S.; Ocłoń, P.; Di Matteo, M.; Kobylarczyk, J. Energy Retrofit Optimization for Social Building in Temperate Climate Zone. Energy Build. 2023, 282, 112771. [Google Scholar] [CrossRef]
  23. Vallati, A.; Di Matteo, M.; Sundararajan, M.; Muzi, F.; Fiorini, C.V. Development and Optimization of an Energy Saving Strategy for Social Housing Applications by Water Source-Heat Pump Integrating Photovoltaic-Thermal Panels. Energy 2024, 301, 131531. [Google Scholar] [CrossRef]
  24. Hernandez-Cruz, P.; Giraldo-Soto, C.; Escudero-Revilla, C.; Hidalgo-Betanzos, J.M.; Flores-Abascal, I. Energy Efficiency and Energy Performance Gap in Centralized Social Housing Buildings of the Basque Country. Energy Build. 2023, 298, 113534. [Google Scholar] [CrossRef]
  25. European Environmental Agency. European Union Directive 2010/31/EU of the European Parliament and of the Council of 19 May 2010 on the Energy Performance of Buildings (Recast); European Environmental Agency: Copenhagen, Denmark, 2010. [Google Scholar]
  26. INEGI; CONUEE; SENER. Encuesta Nacional Sobre Consumo de Energéticos En Viviendas Particulares (ENCEVI) 2018. 2018. Available online: https://www.inegi.org.mx/programas/encevi/2018/ (accessed on 1 February 2025).
  27. INEGI; INMUJERES. Encuesta Nacional Sobre El Uso Del Tiempo (ENUT). 2019. Available online: https://www.inegi.org.mx/programas/enut/2019/ (accessed on 1 February 2025).
  28. SEDATU; CONAVI. Código de Edificación de Vivienda, 3rd ed.; International Finance Corporation: Washington, DC, USA, 2017; Available online: https://www.gob.mx/cms/uploads/attachment/file/383811/C_digo_de_Eficaci_n_Vivienda_2017__SEDATU.pdf (accessed on 1 February 2025).
  29. Procuraduría Federal del Consumidor. Estudios de Calidad. Available online: https://www.gob.mx/profeco/es/articulos/estudio-de-calidad (accessed on 29 January 2025).
  30. Ahern, C. Introducing the Default Effect: Reducing the Gap between Theoretical Prediction and Actual Energy Consumed by Dwellings through Characterising Data More Representative of National Dwellings Stocks; Technological University Dublin: Dublin, Ireland, 2019. [Google Scholar]
  31. Zhang, X.; Wang, A.; Tian, Z.; Li, Y.; Zhu, S.; Shi, X.; Jin, X.; Zhou, X.; Wei, S. Methodology for Developing Economically Efficient Strategies for Net Zero Energy Buildings: A Case Study of a Prototype Building in the Yangtze River Delta, China. J. Clean. Prod. 2021, 320, 128849. [Google Scholar] [CrossRef]
  32. ANSI/ASHRAE 55-2023; Thermal Environmental Conditions for Human Occupancy. American National Standards Institute–ANSI: New York, NY, USA, 2023.
  33. DIAL. GmbH About DIALux. Available online: https://www.dialux.com/en-GB/about-dial (accessed on 28 January 2025).
  34. Calidad y Sustentabilidad en la Edificación, A.C. Código de Conservación de Energía Para Las Edificaciones de México (IECC-MÉXICO); Reaktion Books: London, UK, 2016; Volume 1, ISBN 978-1-60983-662-7. [Google Scholar]
  35. DiLaura, D.L.; Houser, K.W.; Mistrick, R.G.; Steffy, G.R. The Lighting Handbook: Reference and Application, 10th ed.; Illuminating Engineering Society: New York, NY, USA, 2011; ISBN 9780879952419. [Google Scholar]
  36. PELL ENEA LENICALC. Available online: https://www.pell.enea.it/pell_building (accessed on 28 January 2025).
  37. Secretaría de Energía. Norma Oficial Mexicana NOM-005-ENER-2016 Eficiencia Energética de Lavadoras de Ropa Electrodomésticas. Límites, Métodos de Prueba y Etiquetado; Diario Oficial de la Federación DOF: Ciudad de México, México, 2016.
  38. Secretaría de Energía. Norma Oficial Mexicana NOM-015-ENER-2018 Eficiencia Energética de Refrigeradores y Congeladores Electrodomésticos. Límites, Métodos de Prueba y Etiquetado; Diario Oficial de la Federación DOF: Ciudad de México, México, 2018.
  39. Desroches, L.-B.; Fuchs, H.; Greenblatt, J.B.; Pratt, S.; Willem, H.; Claybaugh, E.; Beraki, B.; Nagaraju, M.; Price, S.K.; Young, S.J. Computer Usage and National Energy Consumption: Results from a Field-Metering Study. 2015. Available online: https://escholarship.org/uc/item/5k12d7q0#main (accessed on 1 February 2025).
  40. Horowitz, N.; Hardy, G.; Swofford, J.; Walters, P.; Driscoll, D.; Dayem, K.; Small Network Equipment Energy in U.S. Homes Less Energy to Connect Electronic Devices. 2013. Available online: https://www.nrdc.org/sites/default/files/residential-network-IP.pdf (accessed on 1 February 2025).
  41. PROFECO. Revista del Consumidor; Procuraduría Federal del Consumidor: Ciudad de México, México, 2011. [Google Scholar]
  42. García-Valladares, O.; Ituna-Yudonago, J.F. Energy, Economic and Emissions Avoided Contribution of Domestic Solar Water Heating Systems for Mexico, Costa Rica and the Democratic Republic of the Congo. Sustain. Energy Technol. Assess. 2020, 39, 100721. [Google Scholar] [CrossRef]
  43. Secretaría de Energía. Norma Oficial Mexicana NOM-003-ENER-2011 Eficiencia Térmica de Calentadores de Agua Para Uso Doméstico Comercial. Límites, Métodos de Prueba y Etiquetado; Diario Oficial de la Federación DOF: Ciudad de México, México, 2021.
  44. Secretaría de Energía. Norma Oficial Mexicana NOM-023-ENER-2018 Eficiencia Energética En Acondicionadores de Aire Tipo Dividido, Descarga Libre y Sin Conductos de Aire. Límites, Métodos de Prueba y Etiquetado; Diario Oficial de la Federación DOF: Ciudad de México, México, 2018.
  45. Argüello Méndez, T.; Argüelles León, B.; Badillo González, M. Características Físicas de La Vivienda Popular En La Periferia Urbana de Tuxtla Gutiérrez; Chiapas, México. Quehacer Científico Chiapas 2012, 4, 4–13. [Google Scholar]
  46. Piña Hernández, E.H. Prototipo de Vivienda Vertical Social Sustentable, Enfoque En Resistencia al Cambio Climático. Revista. INVI 2018, 33, 213–237. [Google Scholar] [CrossRef]
  47. Díaz, B.; Rodríguez, S. Características de La Vivienda de Interés Básica, Social y Económica Urbana En Puebla-México. e-Gnosis 2005, 3. Available online: https://www.redalyc.org/pdf/730/73000313.pdf (accessed on 1 April 2025).
  48. Rodriguez-Muñoz, N.A. Evaluation of the Thermal Performance of Construction Systems to Reduce the Energy Consumption in Buildings: A Case Study in a Cold Semi-Arid Climate. Acta. Univ. Multidiscip. Sci. J. 2020, 30, 1–18. [Google Scholar] [CrossRef]
  49. Pérez, J.B.; Cabanillas, R.E.; Hinojosa, J.F.; Borbón, A.C. Estudio Numérico de La Resistencia Térmica En Muros de Bloques de Concreto Hueco Con Aislamiento Térmico. Inf. Tecnol. 2011, 22, 27–38. [Google Scholar] [CrossRef]
  50. Integrated Environmental Solutions Limited. Apache-Tables: User Guide; Integrated Environmental Solutions Limited: Glasgow, UK, 2014. [Google Scholar]
  51. FANOSA; ALENER. Soluciones Que Cumplen Con La NOM-020-ENER-2011; Comisión Nacional para el Uso Eficiente de la Energía: Ciudad de México, México, 2015; Available online: https://www.gob.mx/cms/uploads/attachment/file/84531/2_FANOSA.pdf (accessed on 1 February 2025).
  52. Oropeza-Perez, I.; Petzold-Rodriguez, A.H. Analysis of the Energy Use in the Mexican Residential Sector by Using Two Approaches Regarding the Behavior of the Occupants. Appl. Sci. 2018, 8, 2136. [Google Scholar] [CrossRef]
  53. INEGI. Sistemas de Consulta-Banco de Indicadores. 2020. Available online: https://www.inegi.org.mx/app/indicadores/?ind=1003000015&vind=metadato#D1003000015#D1003000019#D1003000011#D6200108938#D1003000015#D1003000015_56#D1003000015_56 (accessed on 29 January 2025).
  54. SENER; CONUEE. Lista de Combustibles y Sus Poderes Caloríficos 2021 Que Se Considerarán Para Identificar a Los Usuarios Con Un Patrón de Alto Consumo, Así Como Los Factores Para Determinar Las Equivalencias En Términos de Barriles Equivalentes de Petróleo; SENER: Ciudad de México, México, 2021. [Google Scholar]
  55. CRE. Micrositio de Gas LP. Available online: https://www.cre.gob.mx/glp/informesTrimestrales.html#:~:text=La%20densidad%20promedio%20del%20Gas,de%200.54%20kilogramo%20por%20litro (accessed on 31 May 2023).
  56. Younes, C.; Shdid, C.A.; Bitsuamlak, G. Air Infiltration through Building Envelopes: A Review. J. Build. Phys. 2012, 35, 267–302. [Google Scholar] [CrossRef]
  57. American Society of Heating. Refrigerating and Air-Conditioning Engineers 2021 ASHRAE Handbook—Fundamentals; American Society of Heating, Refrigerating and Air-Conditioning Engineers, Inc. (ASHRAE): Atlanta, Goergia, 2021; ISBN 9781947192898. [Google Scholar]
  58. Yunus, A.; Cengel, A.J.G. Heat and Mass Transfer Fundamentals & Applications, 5th ed; McGraw-Hill: New York, NY, USA, 2015; ISBN 9780073398181. [Google Scholar]
  59. Secretaría de Energía. Norma Oficial Mexicana NOM-025-ENER-2013 Eficiencia Térmica de Aparatos Domésticos Para Cocción de alimentos Que Usan Gas, L.P. o Gas Natural. Límites, Métodos de Prueba y Etiquetad; Diario Oficial de la Federación DOF: Ciudad de México, México, 2013.
Figure 1. Housing requirements in the studied cities (required houses/inhabited houses) (Figure made in flourish: “https://flourish.studio/ (accessed on 10 February 2025)”).
Urbansci 09 00113 g001
Figure 2. Reference building: (a) residential building; (b) floor configuration.
Urbansci 09 00113 g002
Figure 3. House configuration: (a) three-bedroom house; (b) two-bedroom house.
Urbansci 09 00113 g003
Figure 4. Building in TRNSYS3D: (a) building’s top view; (b) side view; (c) solid isometric view; (d) see-through isometric view.
Urbansci 09 00113 g004
Figure 5. Occupancy profile per inhabitant.
Urbansci 09 00113 g005
Figure 6. Building’s annual variable energy requirements: (a) DHW; (b) heating and cooling. (Figure made in flourish: “https://flourish.studio/ (accessed on 10 February 2025)”).
Urbansci 09 00113 g006
Figure 7. Heating energy requirement. (Figure made in flourish: “https://flourish.studio/ (accessed on 10 February 2025)”).
Urbansci 09 00113 g007
Figure 8. Cooling energy requirement. (Figure made in flourish: “https://flourish.studio/ (accessed on 10 February 2025)”).
Urbansci 09 00113 g008
Table 1. Climate parameters of the studied cities.
CityKöppen
Climate
Classification
Ambient Temperature (°C)Relative Humidity 1 (%)Global
Horizontal
Irradiation 1 (kWh/m2)
Precipitation 1
(mm)
Annual
Average
MinimumMaximum
ChilpancingoAw23.614.034.148.42244991
DurangoBSk18.63.632.740.82051651
HermosilloBWh25.69.139.737.32036661
La PazBWh25.713.537.252.82153210
Mexico CityCwb18.08.426.246.71826887
TepicCsa22.69.932.865.820382277
TlaxcalaCwb16.86.127.252.420331061
TuxtlaAw24.315.433.366.419632281
1 Annual average.
Table 2. Thermal comfort temperatures [32].
CiudadMinimum Temperature (°C)Maximum Temperature (°C)
Chilpancingo21.428.2
Durango21.728.3
Hermosillo21.728.4
La Paz21.328.1
Mexico City21.528.1
Tepic21.227.5
Tlaxcala21.328.0
Tuxtla20.927.8
Table 3. Appliance usage [26,29,37,38,39,40].
ApplianceFrequency of Use (Days/Month)Average Daily Use
(min)
Electrical Power
(W)
Blender1810550
Coffee maker1929900
Hairdryer13171875
Iron4651302
Laptop/PC1615332
Microwave16151570
Mixer316200
Modem3013845
Refrigerator301440401 *
Television2822450
Toaster912800
Washing machine4127203 **
* Annual average energy consumption (kWh), ** average energy consumption per wash cycle (kWh).
Table 4. Constructive systems configuration and properties [48,49,50,51].
Building ComponentExterior WallsInterior WallsRoofWindows
MaterialsMortar, concrete block, gypsum plasterGypsum plaster, concrete block, gypsum plasterCast concrete, lightened slab, stuccoSingle-glazed, aluminum frame
Thickness (m)0.2000.1900.1700.003
U-value (W/m2·K)2.3122.2790.5300.855 *
* SHGC: Solar heat gain coefficient.
Table 5. Floor occupancy.
W (2 Bedroom)N (3 Bedroom)E (2 Bedroom)S (3 Bedroom)
P1 (first floor)2435
P2 (second floor)3524
P3 (third floor)2435
P4 (fourth floor)3524
Table 6. Summary of monthly fixed energy consumption.
HomeAppliances
(kWh/Month)
Lighting
(kWh/Month)
Fixed Electricity
(kWh/Month)
Cooking
(kg/Month)
Fixed LPG
(kg/Month)
Two-bedroom76.5230.27106.7911.1211.12
Three-bedroom82.9532.37115.3211.1211.12
Table 7. Building’s annual DHW requirement.
CityCalorific Energy (MJ/Year)LPG (kg/Year)
Chilpancingo54,6811488
Durango65,9591795
Hermosillo47,8461302
La Paz45,7951246
Mexico City76,5542083
Tepic52,9721441
Tlaxcala76,5542083
Tuxtla56,3901534
Table 8. Summary of energy requirements of the building (kWh/year).
ChilpancingoDurangoHermosilloLa PazMexico CityTepicTlaxcalaTuxtla
Lighting 16014
Appliances 115,309
Cooking 228,669
Water heating 219,98124,10217,48316,74327,97319,35627,97320,605
Heating 124117,072582483511,901181217,460287
Cooling 11527343755962565208412968
Fixed energy49,992
Variable energy21,74941,51730,86623,83439,87923,25245,43423,860
Total71,74191,50980,85873,82689,87173,24495,42673,852
Electricity23,09138,73834,70628,41433,22925,21938,78424,578
LPG48,65052,77146,15245,41256,64248,02556,64249,274
1 Electricity, 2 LPG.
Table 9. Comparison of average electricity billing against ENCEVI ($) [26].
CityAverage Bill
According to ENCEVI
Estimated Energy Bill for the Average Simulated House
Fixed EnergyFixed Energy and Cooling and HeatingFixed Energy and
Cooling
($MXN)Average
($MXN)
Differences
(%)
Average
($MXN)
Differences
(%)
Average
($MXN)
Differences
(%)
Chilpancingo344230332512724828
Durango25397211852348
Hermosillo39241392032118
La Paz375393151630519
Mexico277175228822917
Tepic28921277425412
Tlaxcala2081072124722910
Tuxtla249826982656
Average298224347226115
Table 10. Comparison of average gas consumption against ENCEVI [26].
CityReference BuildingGas Duration (Months) in Local Surveyed Homes; Percentage Distribution According to ENCEVIAccordance Between RB and the Most Frequent
Answer in ENCEVI
Average
Home Gas
Consumption
Most
Common Gas
Recharge
Estimated
Recharge
Duration
(kg/Month)(Months)<11–22–44–6>6
Chilpancingo18.9Small1.121%37%32%8%2%
Durango20.5Large1.518%33%32%13%4%
Hermosillo17.9Large1.79%30%32%19%9%
La Paz17.6Large1.75%20%37%21%16%
Mexico City22.0Small0.941%38%13%6%1%
Tepic18.6Large1.62%18%43%24%13%
Tlaxcala22.0Small0.946%36%16%2%0%
Tuxtla19.1Large1.66%20%43%16%14%
Disclaimer/Publisher’s Note: The statements, opinions and data contained in all publications are solely those of the individual author(s) and contributor(s) and not of MDPI and/or the editor(s). MDPI and/or the editor(s) disclaim responsibility for any injury to people or property resulting from any ideas, methods, instructions or products referred to in the content.

