Article

Green Infrastructure for Climate Change Mitigation: Assessment of Carbon Sequestration and Storage in the Urban Forests of Budapest, Hungary

Forest Research Institute, University of Sopron, Várkerület 30/A, H-9600 Sárvár, Hungary
*
Author to whom correspondence should be addressed.
Urban Sci. 2025, 9(5), 137; https://doi.org/10.3390/urbansci9050137
Submission received: 23 March 2025 / Revised: 15 April 2025 / Accepted: 21 April 2025 / Published: 23 April 2025

Abstract

:
The effects of climate change are particularly pronounced in cities, where urban green infrastructure—such as trees, parks, and green spaces—plays a vital role in both climate adaptation and mitigation. This study assesses the carbon sequestration potential of urban forests in Budapest, the capital city of Hungary, which lies at the intersection of the Great Hungarian Plain and the Buda Hills, and is traversed by the Danube River. The city is characterized by a temperate climate with hot summers and cold winters, and a diverse range of soil types, including shallow Leptosols and Cambisols in the limestone and dolomite hills of Buda, well-developed Luvisols and Regosols in the valleys, Fluvisols and Arenosols in the flood-affected areas of Pest, and Technosols found on both sides of the city. The assessment utilizes data from the National Forestry Database and the Copernicus Land Monitoring Service High Resolution Layer Tree Cover Density. The results show that Budapest’s urban forests and trees contribute an estimated annual carbon offset of −41,338 tCO2, approximately 1% of the city’s total emissions. The urban forests on the Buda and Pest sides of the city exhibit notable differences in carbon sequestration and storage, age class structure, tree species composition, and naturalness. On the Buda side, older semi-natural forests dominated by native species primarily act as in situ carbon reservoirs, with limited additional sequestration capacity due to their older age, slower growth, and longer rotation periods. In contrast, the Pest-side forests, which are primarily extensively managed introduced forests and tree plantations, contain a higher proportion of non-native species such as black locust (Robinia pseudoacacia) and hybrid poplars (Populus × euramericana). Despite harsher climatic conditions, Pest-side forests perform better in carbon sink capacity compared to those on the Buda side, as they are younger, with lower carbon stocks but higher sequestration rates. Our findings provide valuable insights for the development of climate-resilient urban forestry and planning strategies, emphasizing the importance of enhancing the long-term carbon sequestration potential of urban forests.

Graphical Abstract

1. Introduction

According to the Sixth Assessment Report of the IPCC [1], the detrimental effects of climate change have been particularly severe in urban areas. Climate change has adversely affected human health, livelihood security, and essential urban infrastructure components [1]. Cities have experienced more frequent extreme heat events, while severe weather conditions have increasingly damaged urban infrastructure, disrupting transportation, water supply, sanitation, and energy systems. These disruptions have resulted in economic losses, service interruptions, and negative consequences for overall well-being [1]. The observed adverse impacts have been most pronounced among economically and socially marginalized urban populations [1].
The rapid pace of global urbanization has led to more than half of the world’s population residing in urban areas [2]. The combined pressures of urbanization and global warming have significantly strained ecosystems, contributing to issues such as urban heat islands, air pollution, and water contamination, all of which pose substantial threats to public health [3,4,5]. Urban areas, characterized by high population densities and intense human activity, also generate substantial CO2 emissions from fossil fuel combustion, making urbanization a key driver of global warming [6,7].
In response, urban green infrastructure, including forests and greenery, has gained prominence as an essential strategy for both climate change adaptation and mitigation [8]. Urban forests are recognized as a nature-based solution [9,10,11] and have garnered considerable attention in climate change adaptation strategies due to their multiple ecosystem functions, such as climate regulation, air purification, and carbon sequestration [12,13]. Many city governments have introduced policies encouraging tree planting, the preservation of urban green spaces, and the incorporation of green architecture, including green roofs and facades [8].
Previous research has primarily concentrated on carbon storage within urban vegetation, whereas less attention has been directed toward its carbon sequestration potential [8,14,15,16]. Carbon storage provides a static representation of carbon levels at specific points in time, while carbon sequestration describes the dynamic process and capacity of vegetation to capture carbon from the atmosphere [17].
Estimating carbon sequestration in urban vegetation has mainly relied on model simulations, carbon flux analysis, and sample site surveys [18]. However, plot surveys for carbon sequestration are both costly and labor-intensive, often failing to provide comprehensive coverage of urban forests across large spatial scales and extended time periods. Several studies have employed the i-Tree and InVEST models to simulate carbon sequestration in urban vegetation [19,20].
In recent years, the extensive use of remote sensing technology and geographic information systems has enabled the integration of remote sensing data with process modeling (e.g., the boreal ecosystem productivity simulator BEPS model, CASA model, BIOME-BGC model, and Ecosystem Demography model ED v3.0) for large-scale estimation of carbon stock and sequestration across diverse ecosystems, such as forests, grasslands, and croplands [21,22,23].
Additionally, the flux tower eddy covariance technique is commonly used to assess carbon sequestration in ecosystems, but it requires sophisticated instrumentation. Previous studies have utilized flux towers to compare carbon exchange between urban and rural forest systems and the atmosphere [24]. While flux towers provide relatively precise insights into carbon uptake by urban vegetation, their spatial coverage remains limited [25].
Budapest is the capital and the largest city of Hungary, with a population of approximately 1.8 million [26]. It ranks as the eleventh-largest city in the European Union by population within city limits and is the second-largest city along the Danube River [27,28]. The city covers an area of about 525 square kilometers [29]. Kovács et al. [30] estimated the ecological footprint and biocapacity changes in the Budapest Metropolitan Region, using a hybrid method that combined an input–output model and household consumption data. Their findings revealed a significant ecological overshoot in Budapest and its agglomeration, driven by population growth and rising per capita ecological footprint values, which were not balanced by biocapacity. Göndöcs et al. [31] modeled surface urban heat island intensities for Budapest using the Weather Research and Forecasting (WRF) model. Chen et al. [28] studied the photosynthetic activity and fine particulate matter (PM) capture potential of three commonly planted trees (Acer platanoides, Fraxinus excelsior, and Tilia tomentosa) in Budapest, revealing that Tilia tomentosa exhibited better photosynthesis and adaptation to urban conditions. Their findings highlighted the significant role of urban greenery in capturing fine PM, with an estimated 38.17 tons of fine PM retained in Budapest’s urban greenery. Szabó et al. [32] investigated dust deposition on urban tree leaves in Budapest using a washing method, examining four species (Acer platanoides, Fraxinus excelsior, Tilia tomentosa, and Prunus cerasifera ‘Woodii’) and confirming that leaf surface structure influenced dust accumulation.
Despite extensive studies on urban sustainability and the contribution of vegetation to pollution control in Budapest, the carbon sequestration potential of the city’s urban forests and greenery has not yet been quantified. The aim of this study is to evaluate the carbon sequestration and storage capacity of urban forests in Budapest. The research objectives are: (1) to assess the carbon sequestration potential of urban forests in Budapest using data from the National Forestry Database and the Copernicus Land Monitoring Service’s High Resolution Layer Tree Cover Density [33,34]; and (2) to estimate the contribution of urban forests to overall carbon emission reduction strategies in the city.
The study hypotheses are as follows: (1) urban forests in Budapest contribute significantly to carbon sequestration and storage; (2) the carbon sequestration potential of urban forests varies based on tree species, tree cover density, and climatic conditions; and (3) there are substantial differences in carbon sequestration and storage between the Buda and Pest sides of the city due to variations in land use, vegetation, and environmental factors.

2. Materials and Methods
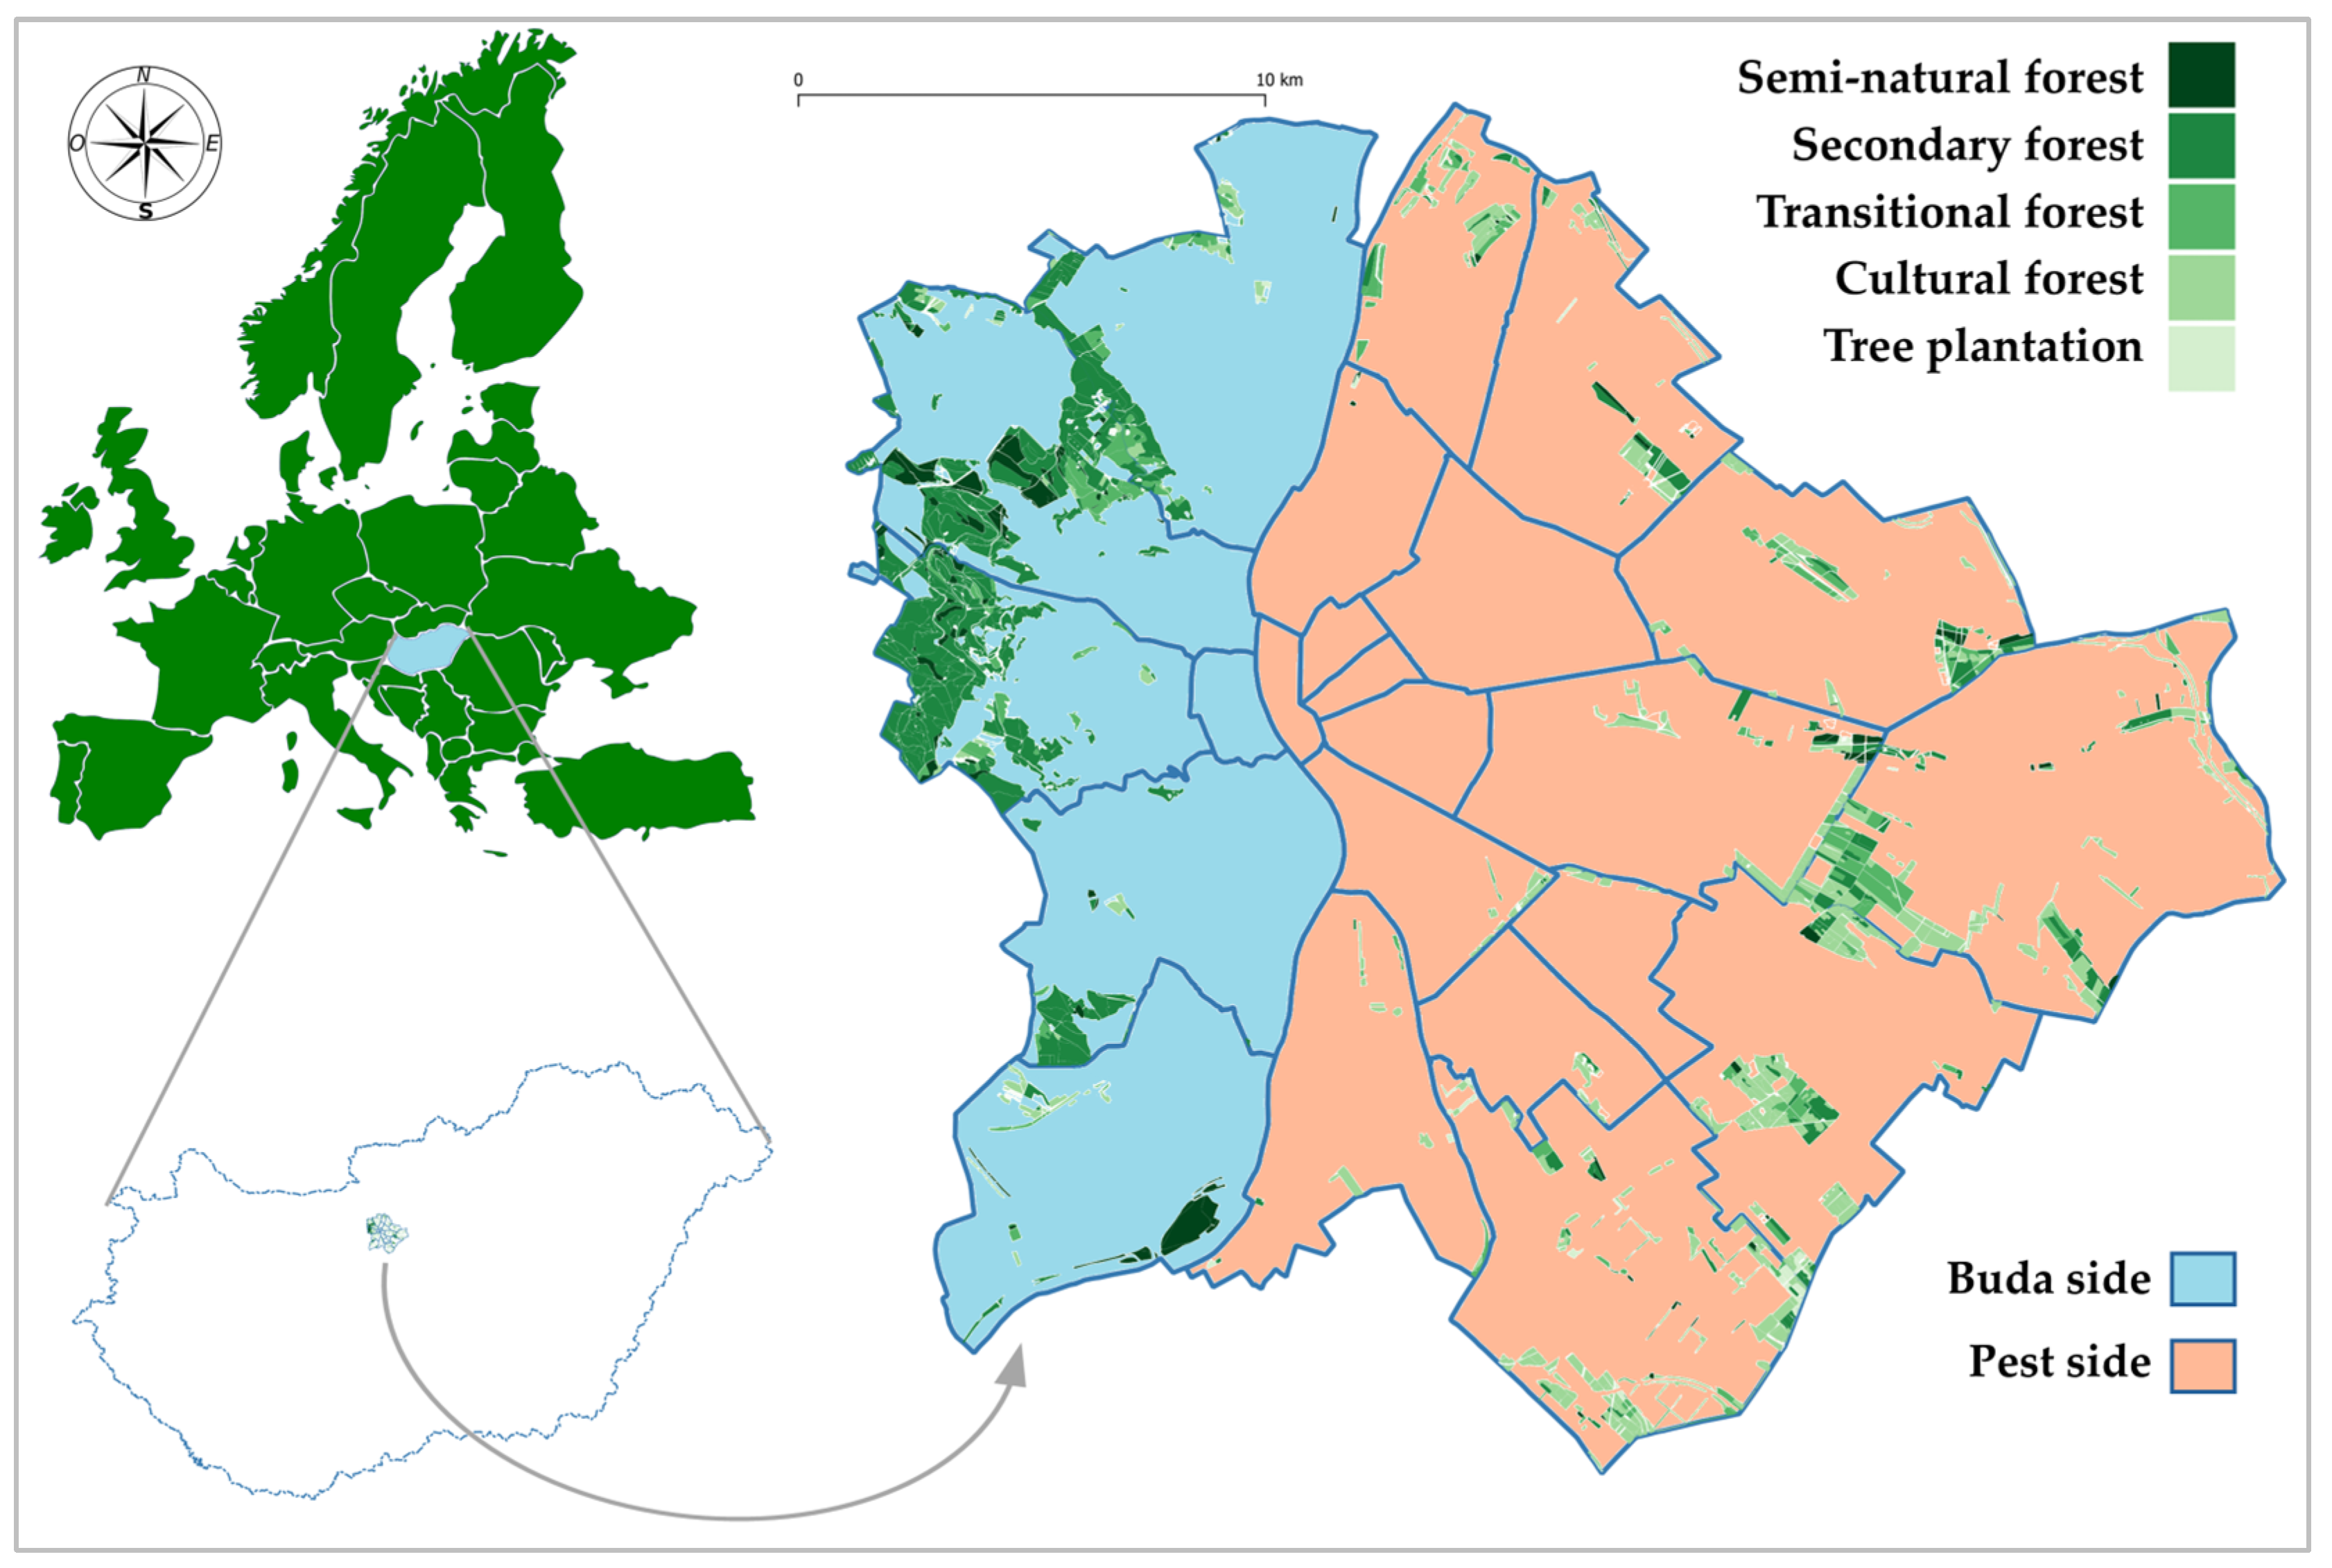
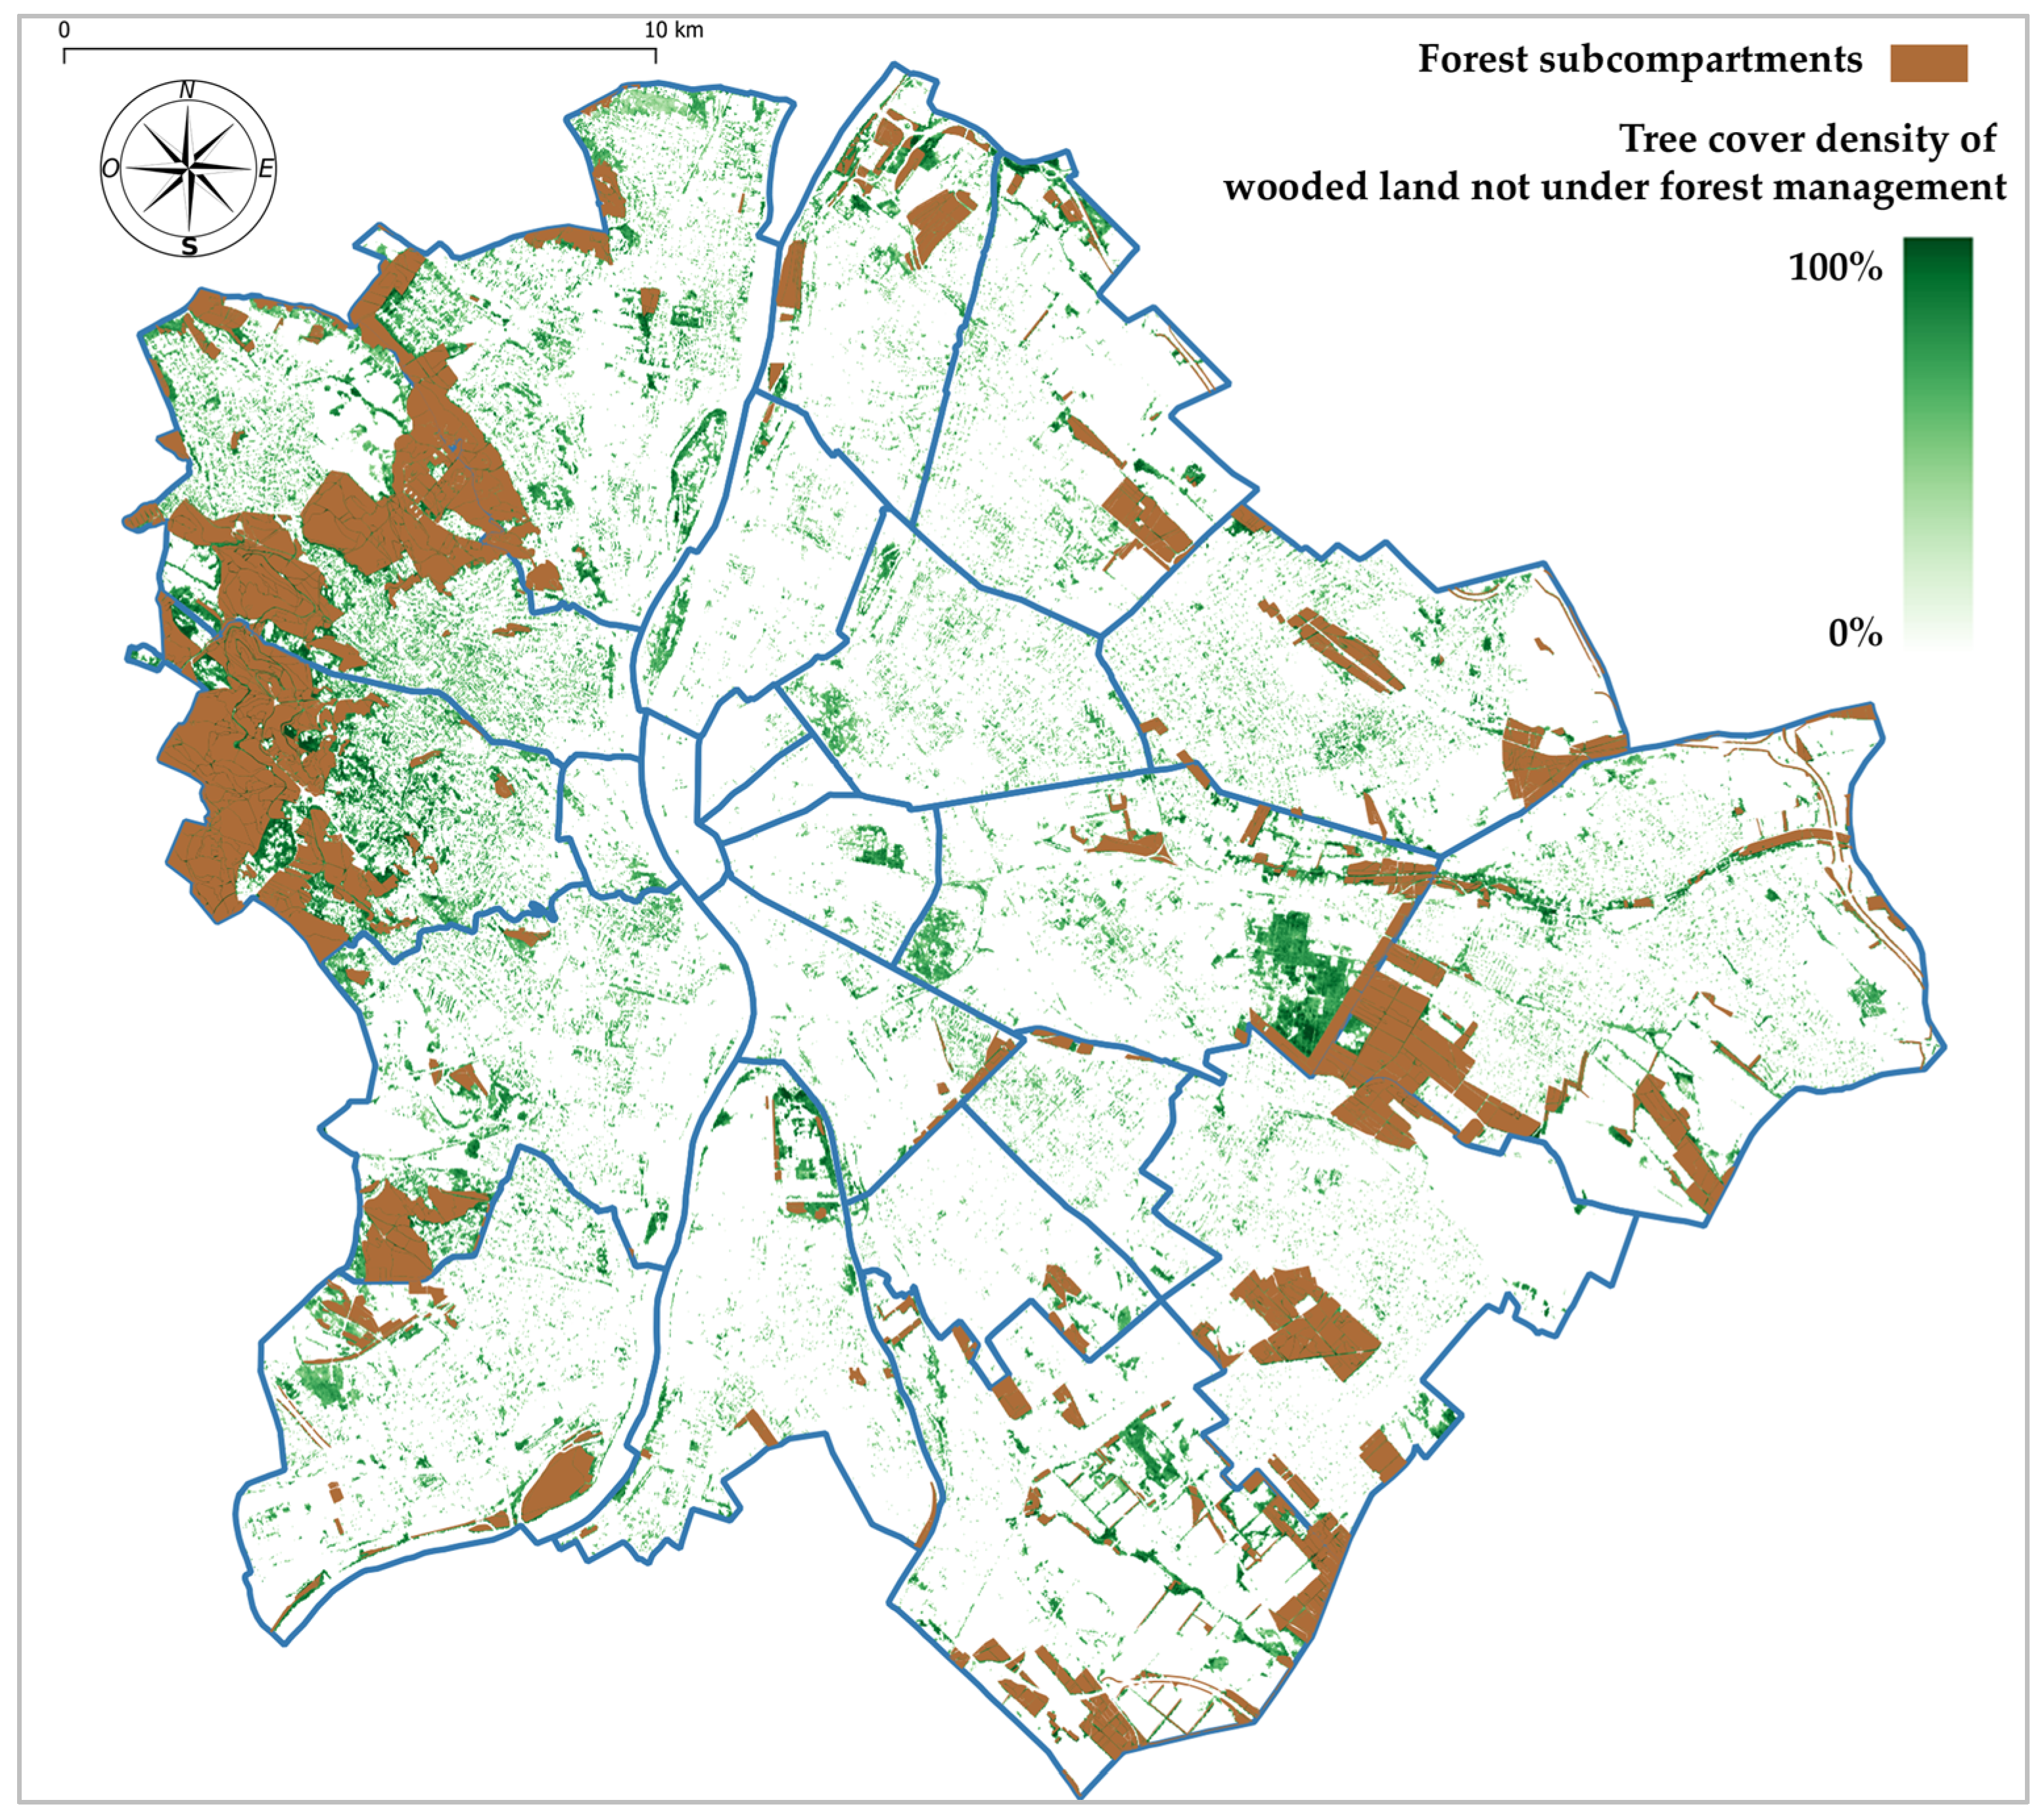
2.1. Study Area

Budapest (Figure 1), the capital of Hungary, is located on both sides of the Danube River. It covers an area of 525 square kilometers. The city experiences a temperate climate with influences from oceanic and Mediterranean climates, leading to significant variability [35]. The average annual temperature is 11.5 °C, with approximately 2010 h of sunshine per year and an annual rainfall of about 586 mm, mostly concentrated in May, June, and the autumn, though it varies significantly from year to year [28].
Pest and Buda, the two sides of Budapest separated by the Danube River, differ significantly in both geography and climate (Figure 2). Buda, on the western side, is characterized by its hilly terrain, including the Buda Hills, which rise to 500–527 m, and are partly covered with semi-natural forests and nature conservation areas. In contrast, Pest, on the eastern side, is mostly flat, forming part of the Great Hungarian Plain. These geographical differences also influence the climatic conditions. Buda tends to be cooler due to its higher elevation, forest cover, and natural ventilation, while Pest, being lower and more built-up, experiences the urban heat island effect, making it significantly warmer, particularly in summer. Buda also receives slightly more rainfall due to orographic effects, meanwhile, Pest is drier and more exposed to winds from the Great Hungarian Plain, making it less humid but more prone to summer heat waves [36].
The hills on the Buda side of the city are mostly composed of limestone and dolomite, where shallow Leptosols and Cambisols have developed at higher elevations, complemented by well-developed Luvisols and deluvial Regosols towards the valleys. The soils of the Pest side consist mainly of Fluvisols developed from flood deposits and shallow Arenosols found in sandy areas. This general pattern is interspersed with Gleysols of meadows formed on clayey sediments of the plains, as well as younger Chernozem soils, some of which exhibit meadow or alluvial characteristics. However, the natural soil cover in most parts of the area is under strong human influence. Landscaping and construction activities driven by changes in settlement patterns and water management have also left their mark on the soils. In many places, we encounter piled-up or buried soil layers or soils saturated with debris. These Technosols can be found throughout the city.
As Hungary’s most populous city and economic center, Budapest is heavily impacted by human activities [28]. Tatai et al. [29] note that since 1992, the green space intensity of Budapest has increased by 1%, primarily due to the spontaneous shrub growth and afforestation of abandoned, unused areas, as well as the strengthening of existing vegetation. However, this increase masks land-use changes that have led to a decline in green spaces. It can be observed, however, that Budapest’s green space intensity has fluctuated around 50% over the past 30 years, influenced not only by the increase or decrease in vegetation cover but also by its qualitative improvement or deterioration [29]. A particularly significant factor in these changes is the fluctuation in the vitality of non-irrigated grasslands, as well as the methods and timing of their management.
Tatai et al. [29] state that in Budapest, each resident has access to an average of 33 m2 of forested land, including 25 m2 designated as recreational park forest, along with 6 m2 of public parks and gardens. Compared to international benchmarks, the city falls short in green space provision. However, housing estate green areas help mitigate this deficit, offering 2 m2 per resident in such developments. These spaces play a key role in serving the approximately 29% of Budapest’s population who live in housing estates. Beyond the limited availability of public parks and gardens, their distribution is also uneven. In some central districts, the per capita public park space is less than 1 m2. Currently, Budapest’s green space system does not fully meet its recreational and environmental conditioning functions due to a lack of sufficient green areas, as well as the poor condition of some existing ones [29].
Budapest’s forest coverage is around 11%, aligning with the average levels observed in European cities [29]. The distribution of green spaces varies across different urban planning zones. In the inner city and along the Danube, green areas appear in an island-like pattern. At the boundary between the inner and suburban zones, they follow a strip–ring structure influenced by the presence of large urban parks. The hilly zone is characterized by the continuous forests of the Buda Hills and the green spaces of suburban neighborhoods. Additionally, green corridors consisting of agricultural and forested land extend into the suburban zone, linking the metropolitan region’s green areas with those of the capital [29]. Forest management in Budapest emphasizes ecological sustainability, striving to balance conservation, recreation, and climate adaptation. Management practices primarily follow non-clearcutting systems to maintain continuous forest cover, recreational functions, and ecological stability.

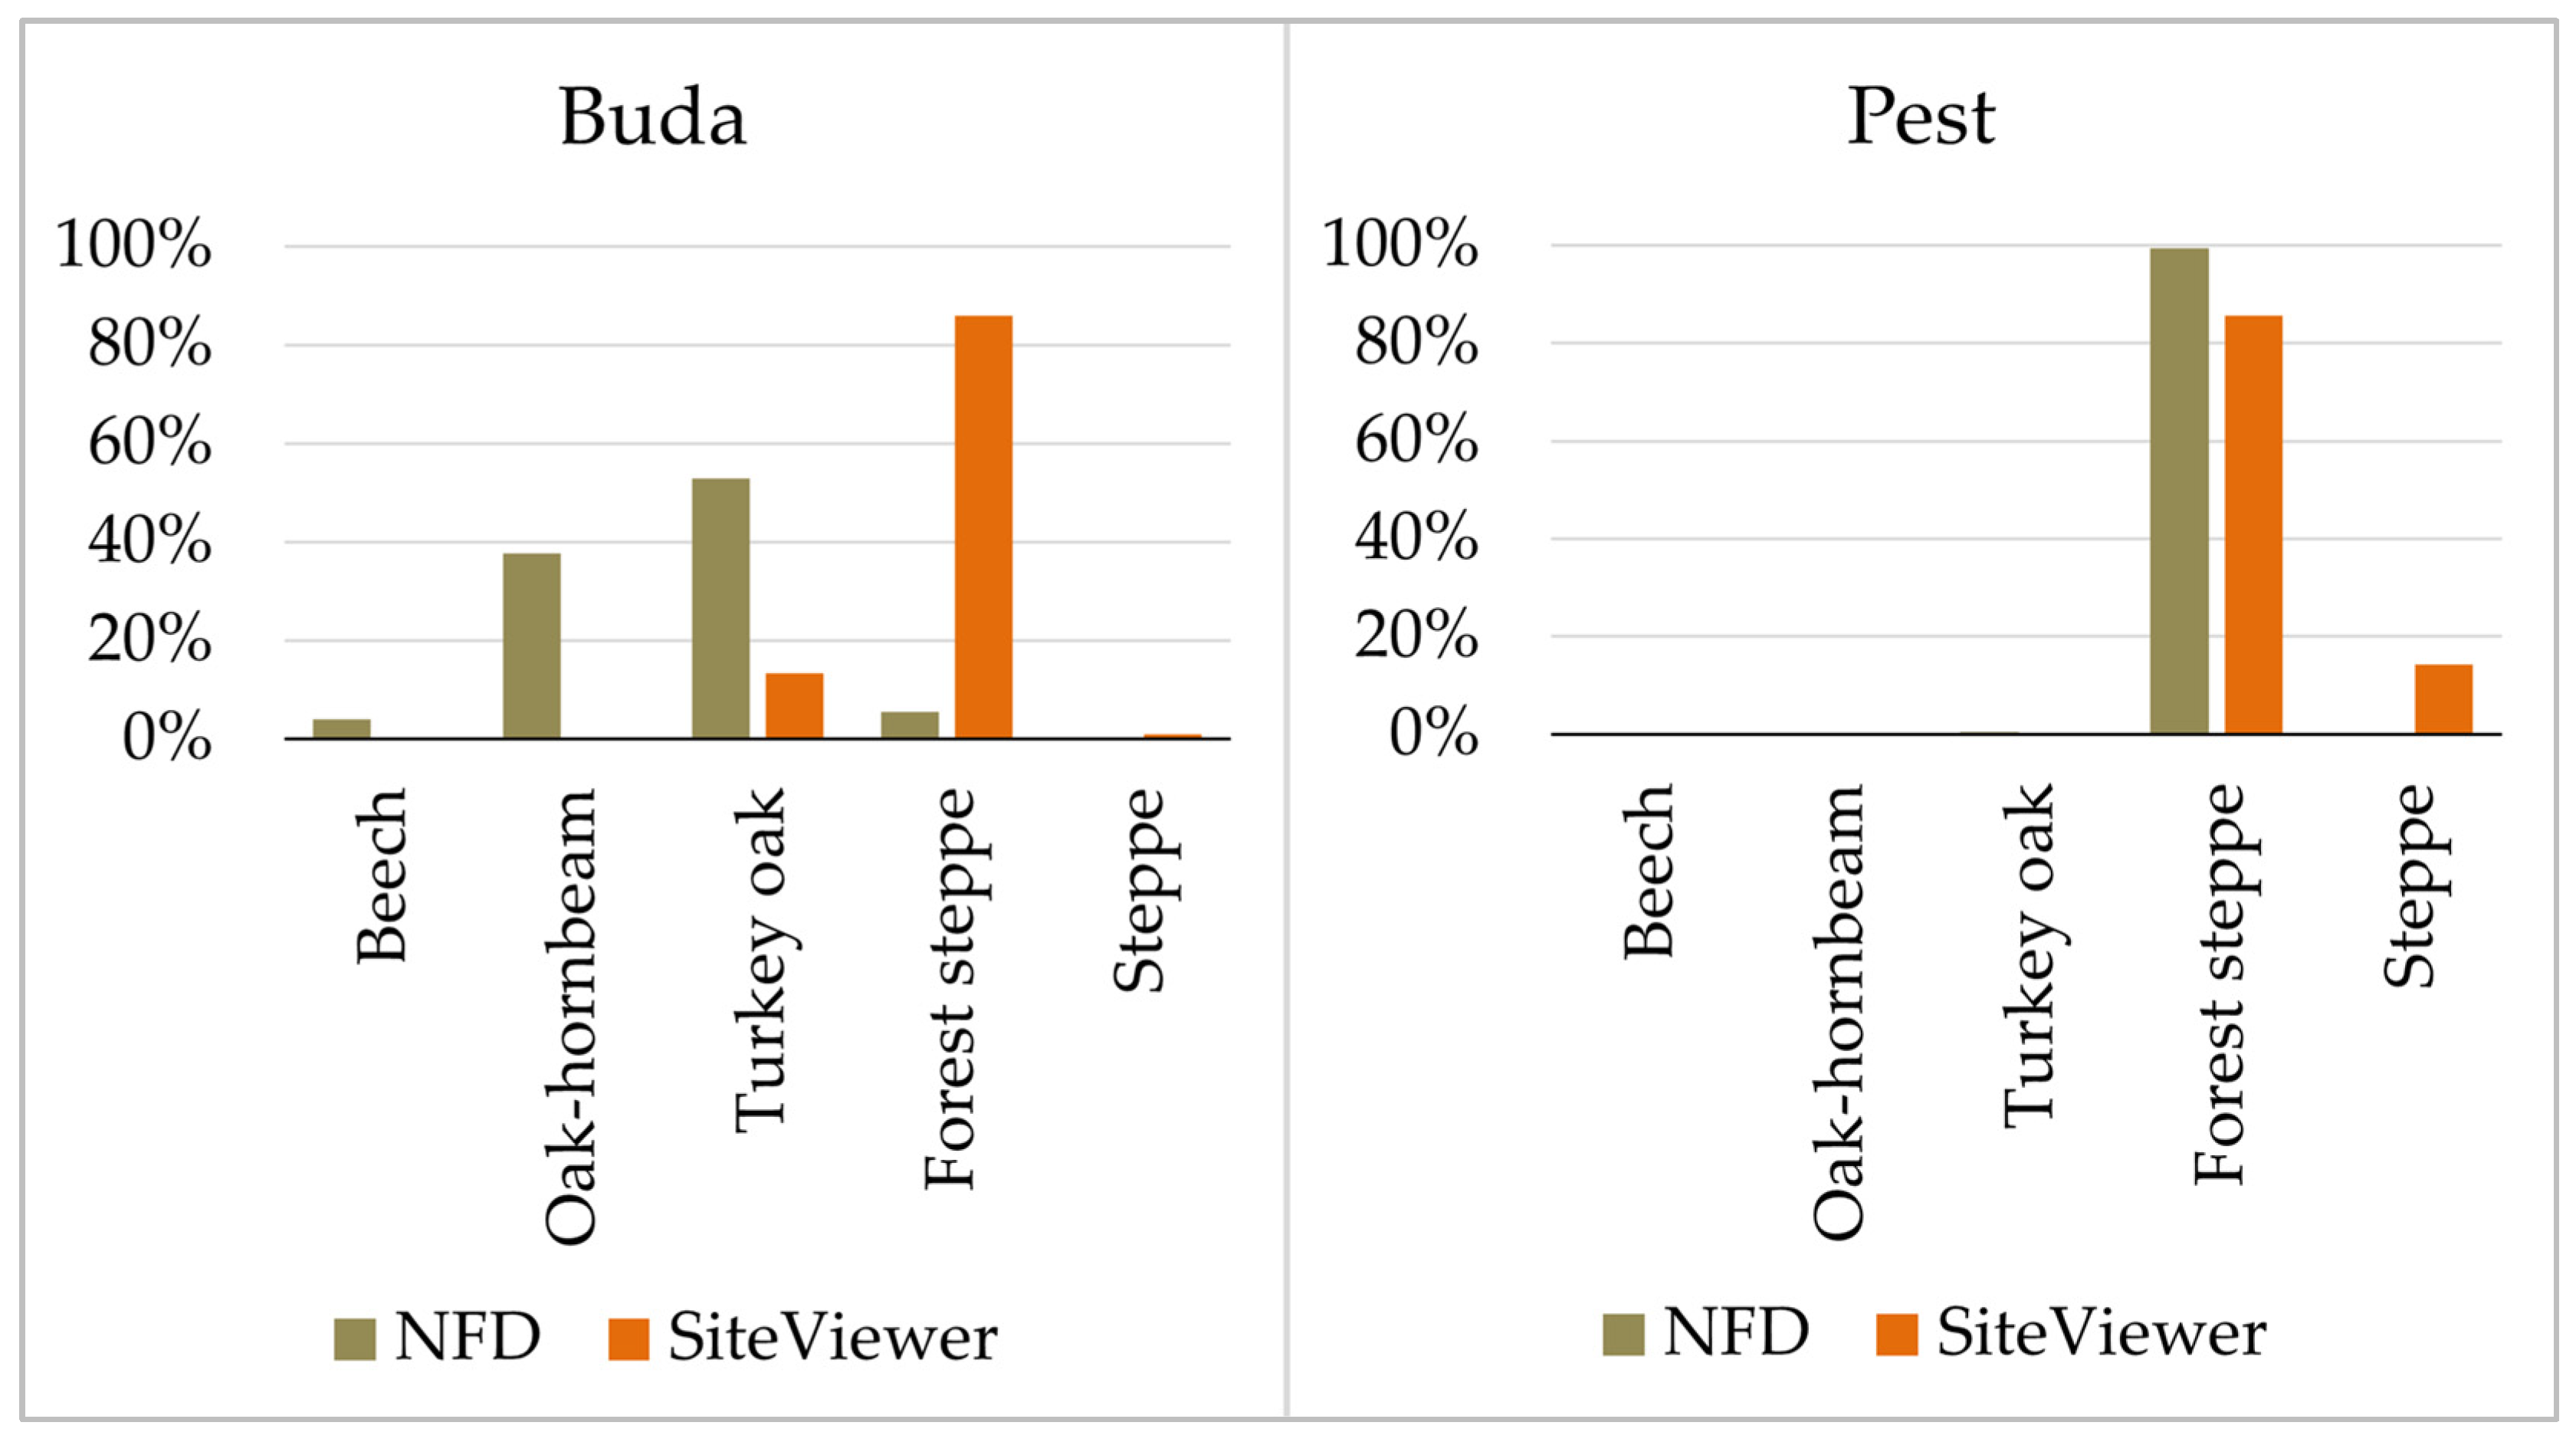
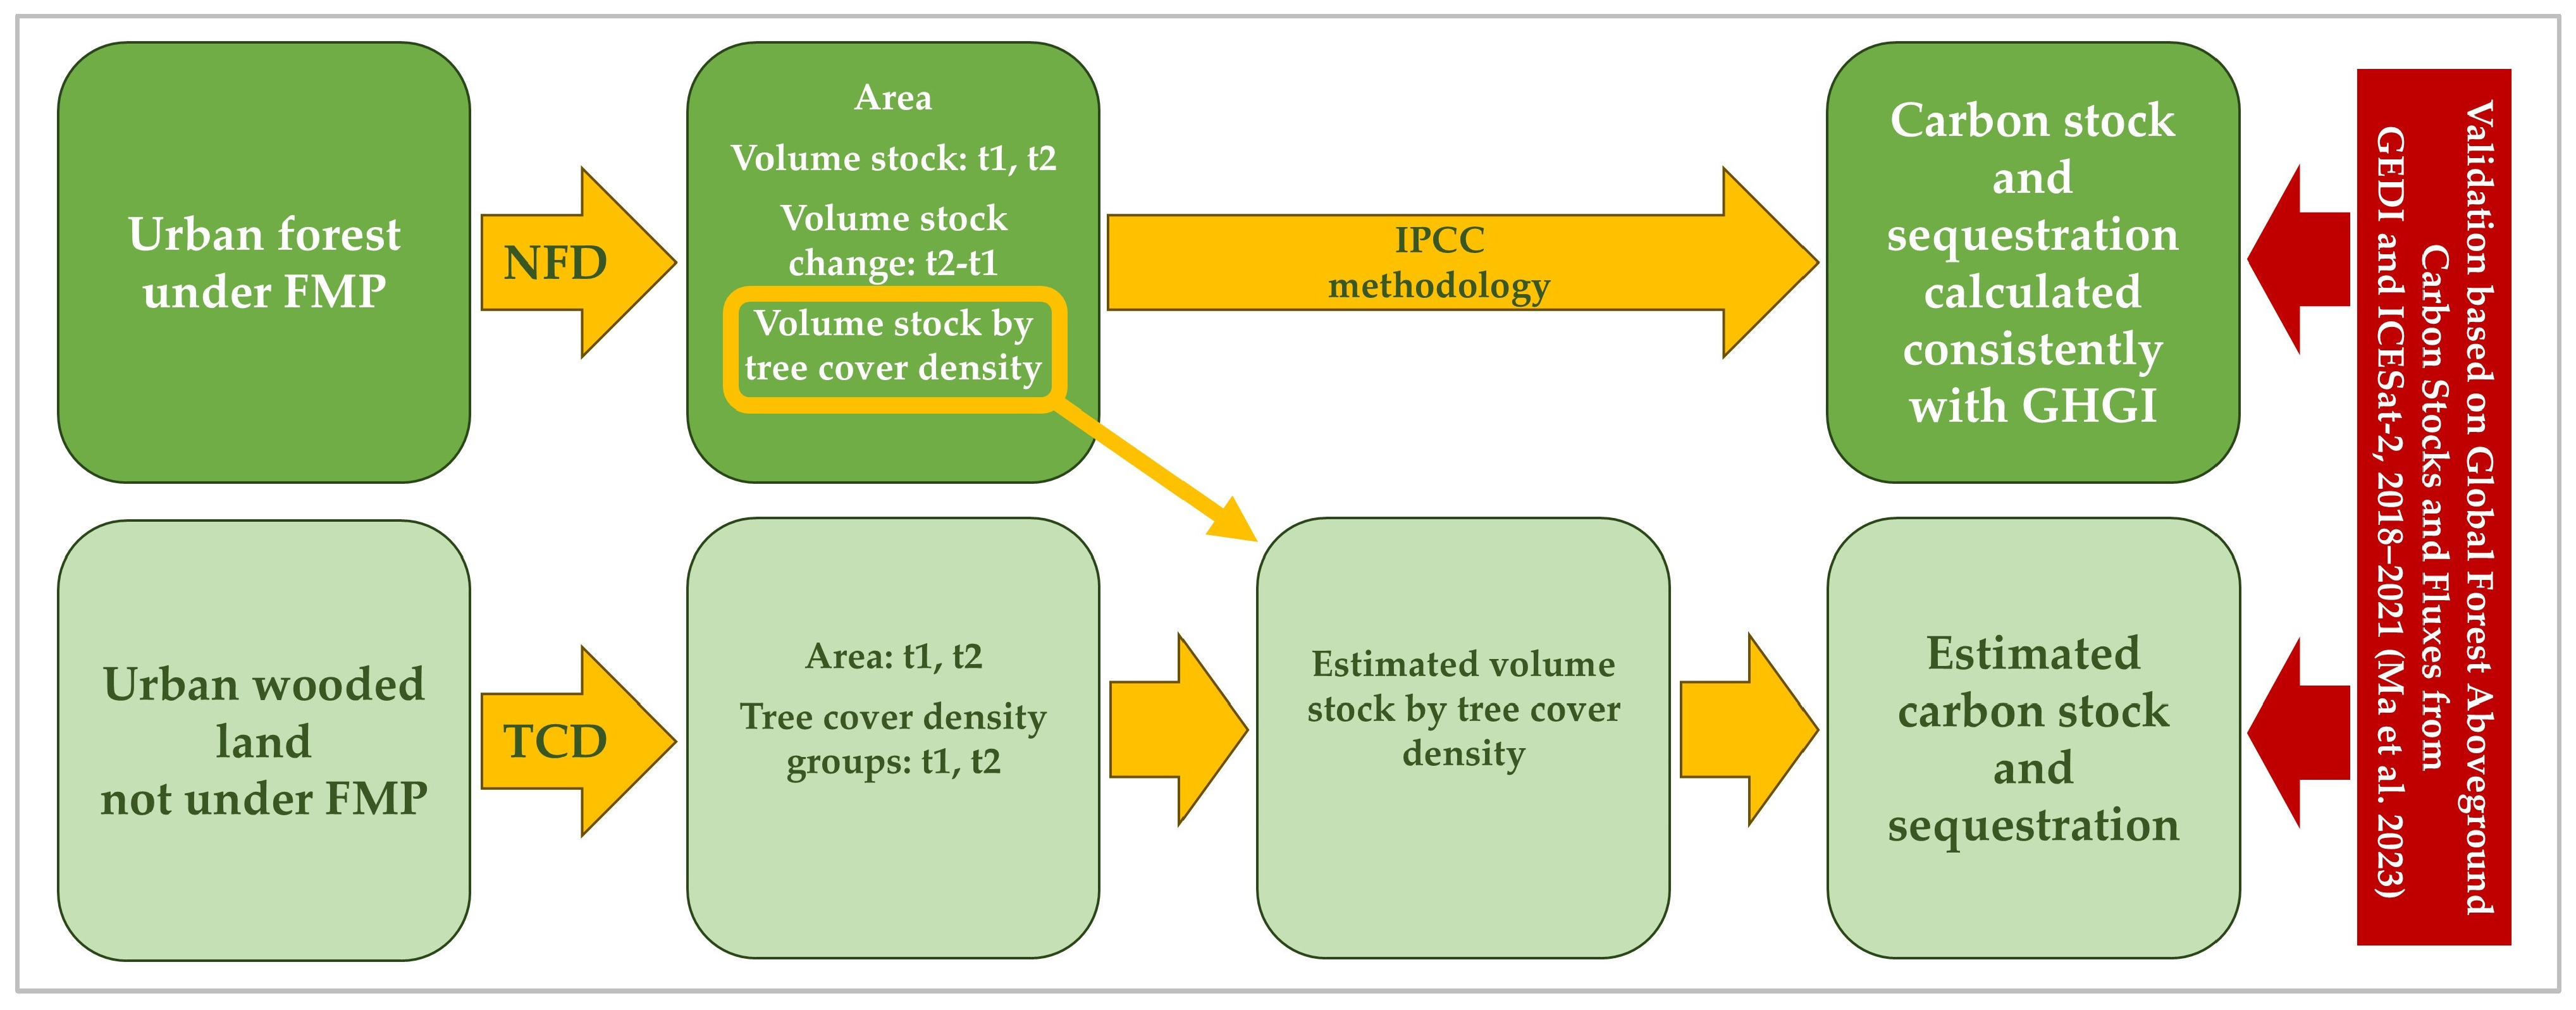
2.2. Methods of the Analysis

2.2.1. Urban Forests Under Forest Management Planning

To estimate the carbon storage and sequestration of forested areas within Budapest that are officially administered as forests, data from the National Forestry Database (NFD) were utilized. The NFD serves as the official database of the Hungarian Forest Authority, supporting forest management planning, which encompasses the entire forested area of Hungary. Approximately 10% of the country’s forest land undergoes forest management planning (FMP) each year [37,38]. Conducted by the Forest Authority, this planning is based on field surveys that assess key stand attributes such as tree height, diameter, basal area, age, and canopy closure. Using these sampled data, the NFD models the annual increment between two consecutive surveys based on yield tables, while harvested volumes are officially recorded for each forest stand annually. The standing volume for each year is calculated by adding the modeled annual increment and subtracting recorded harvested volumes from the growing stock of each stand. In Hungary, forest stands—also referred to as forest subcompartments—are units of relatively homogeneous tree cover. The NFD provides digital maps and over 300 raw and derived datasets for each subcompartment, including information on area, protection status, management systems, site characteristics, soil sampling details, dendrometric parameters, tree species composition, planned and completed harvests, regeneration activities, and afforestation prescriptions [37]. Additionally, the database records the total gross above-ground biomass volume, including non-merchantable components, for each tree species row (subunit of the forest subcompartment).
For this study, digital maps from the NFD were analyzed for two statistical states, in 2010 and 2020. These years were selected due to the availability of data and to cover the longest possible period. Sampling was conducted using a regular 100 × 100-m grid, resulting in 5624 sample points representing the entire forest area of Budapest. This sampling grid facilitated tracking changes in forest stands, particularly in cases where subcompartments were divided, merged, or underwent unidentifiable geometric modifications between the two time points, preventing direct matching of subcompartments.
Using data from the NFD and the methodology outlined by the IPCC [39,40], we quantified changes in carbon stock within living tree biomass for each sampling point between 2010 and 2020. We employed a ten-year period and its average stock change values to minimize interannual fluctuations and achieve a more stable estimate. Net carbon stock change was calculated separately for each tree species row and defined as the gross carbon sink minus harvest and mortality, referred to as the net sink. In the NFD, annual harvest and mortality are subtracted from gross annual increment, ensuring consistency with this definition. The net sink was derived following the approaches described by IPCC [39,40], and also consistently with the Hungarian Greenhouse Gas Inventory (GHGI) [41]. Calculations were performed as follows.
Δ C t s r = C 2020 C 2010
C t n = i = 1 9 S V t n × C F × D × 1.25 × 44 12
where:
ΔCtsr: net sink (i.e., net carbon stock change) of a given tree species row (t CO2);
C2020: carbon stock of the tree species row in year 2020 (t CO2);
C2010: carbon stock of the tree species row in year 2010 (t CO2);
Ctn: carbon stock of all tree species rows per sampling point in year tn (t CO2);
SVtn: gross above-ground standing volume (including non-merchantable above-ground components) of the tree species row in year tn (m3);
CF: tree species-specific carbon fraction value (tC/t dm);
D: tree species-specific density value (t dm/m3 standing volume);
1.25: above-ground plus below-ground biomass multiplier, based on the root-to-shoot ratio of 0.25 (IPCC 2006);
44/12: the ratio of the molar mass of carbon dioxide to carbon.
After calculating the net sink for each tree species row, values were aggregated to determine the total carbon stock change at each sampling point. Sampling points were then categorized based on tree species, age class, and location (Pest or Buda), with carbon stock changes summed for each group. The mean carbon stock change per hectare and the cumulative carbon stock change were computed accordingly. Additionally, logging intensity was analyzed based on the 2010–2020 period datasets from the NFD.
To compare carbon storage and net sink across different groups, a one-way ANOVA was conducted using Statistica software (Version 14.0.1.25, Tulsa, OK, USA). Post hoc tests (Fisher LSD, Bonferroni, Scheffé, Tukey HSD, Unequal N HSD, Newman–Keuls, and Duncan’s test) were performed to assess significant differences in group means at a 95% confidence level.
Substitution effects associated with harvested timber were estimated following the methodology presented in the European Forest Institute report [42]. It was assumed that all harvested wood was used as firewood. Due to the lack of country-specific substitution factors for Hungary, an energy substitution factor of 0.67 kg C/kg C was applied, based on values reported by Myllyviita et al. [43], Knauf et al. [44,45], Härtl et al. [46], and Schweinle et al. [47].

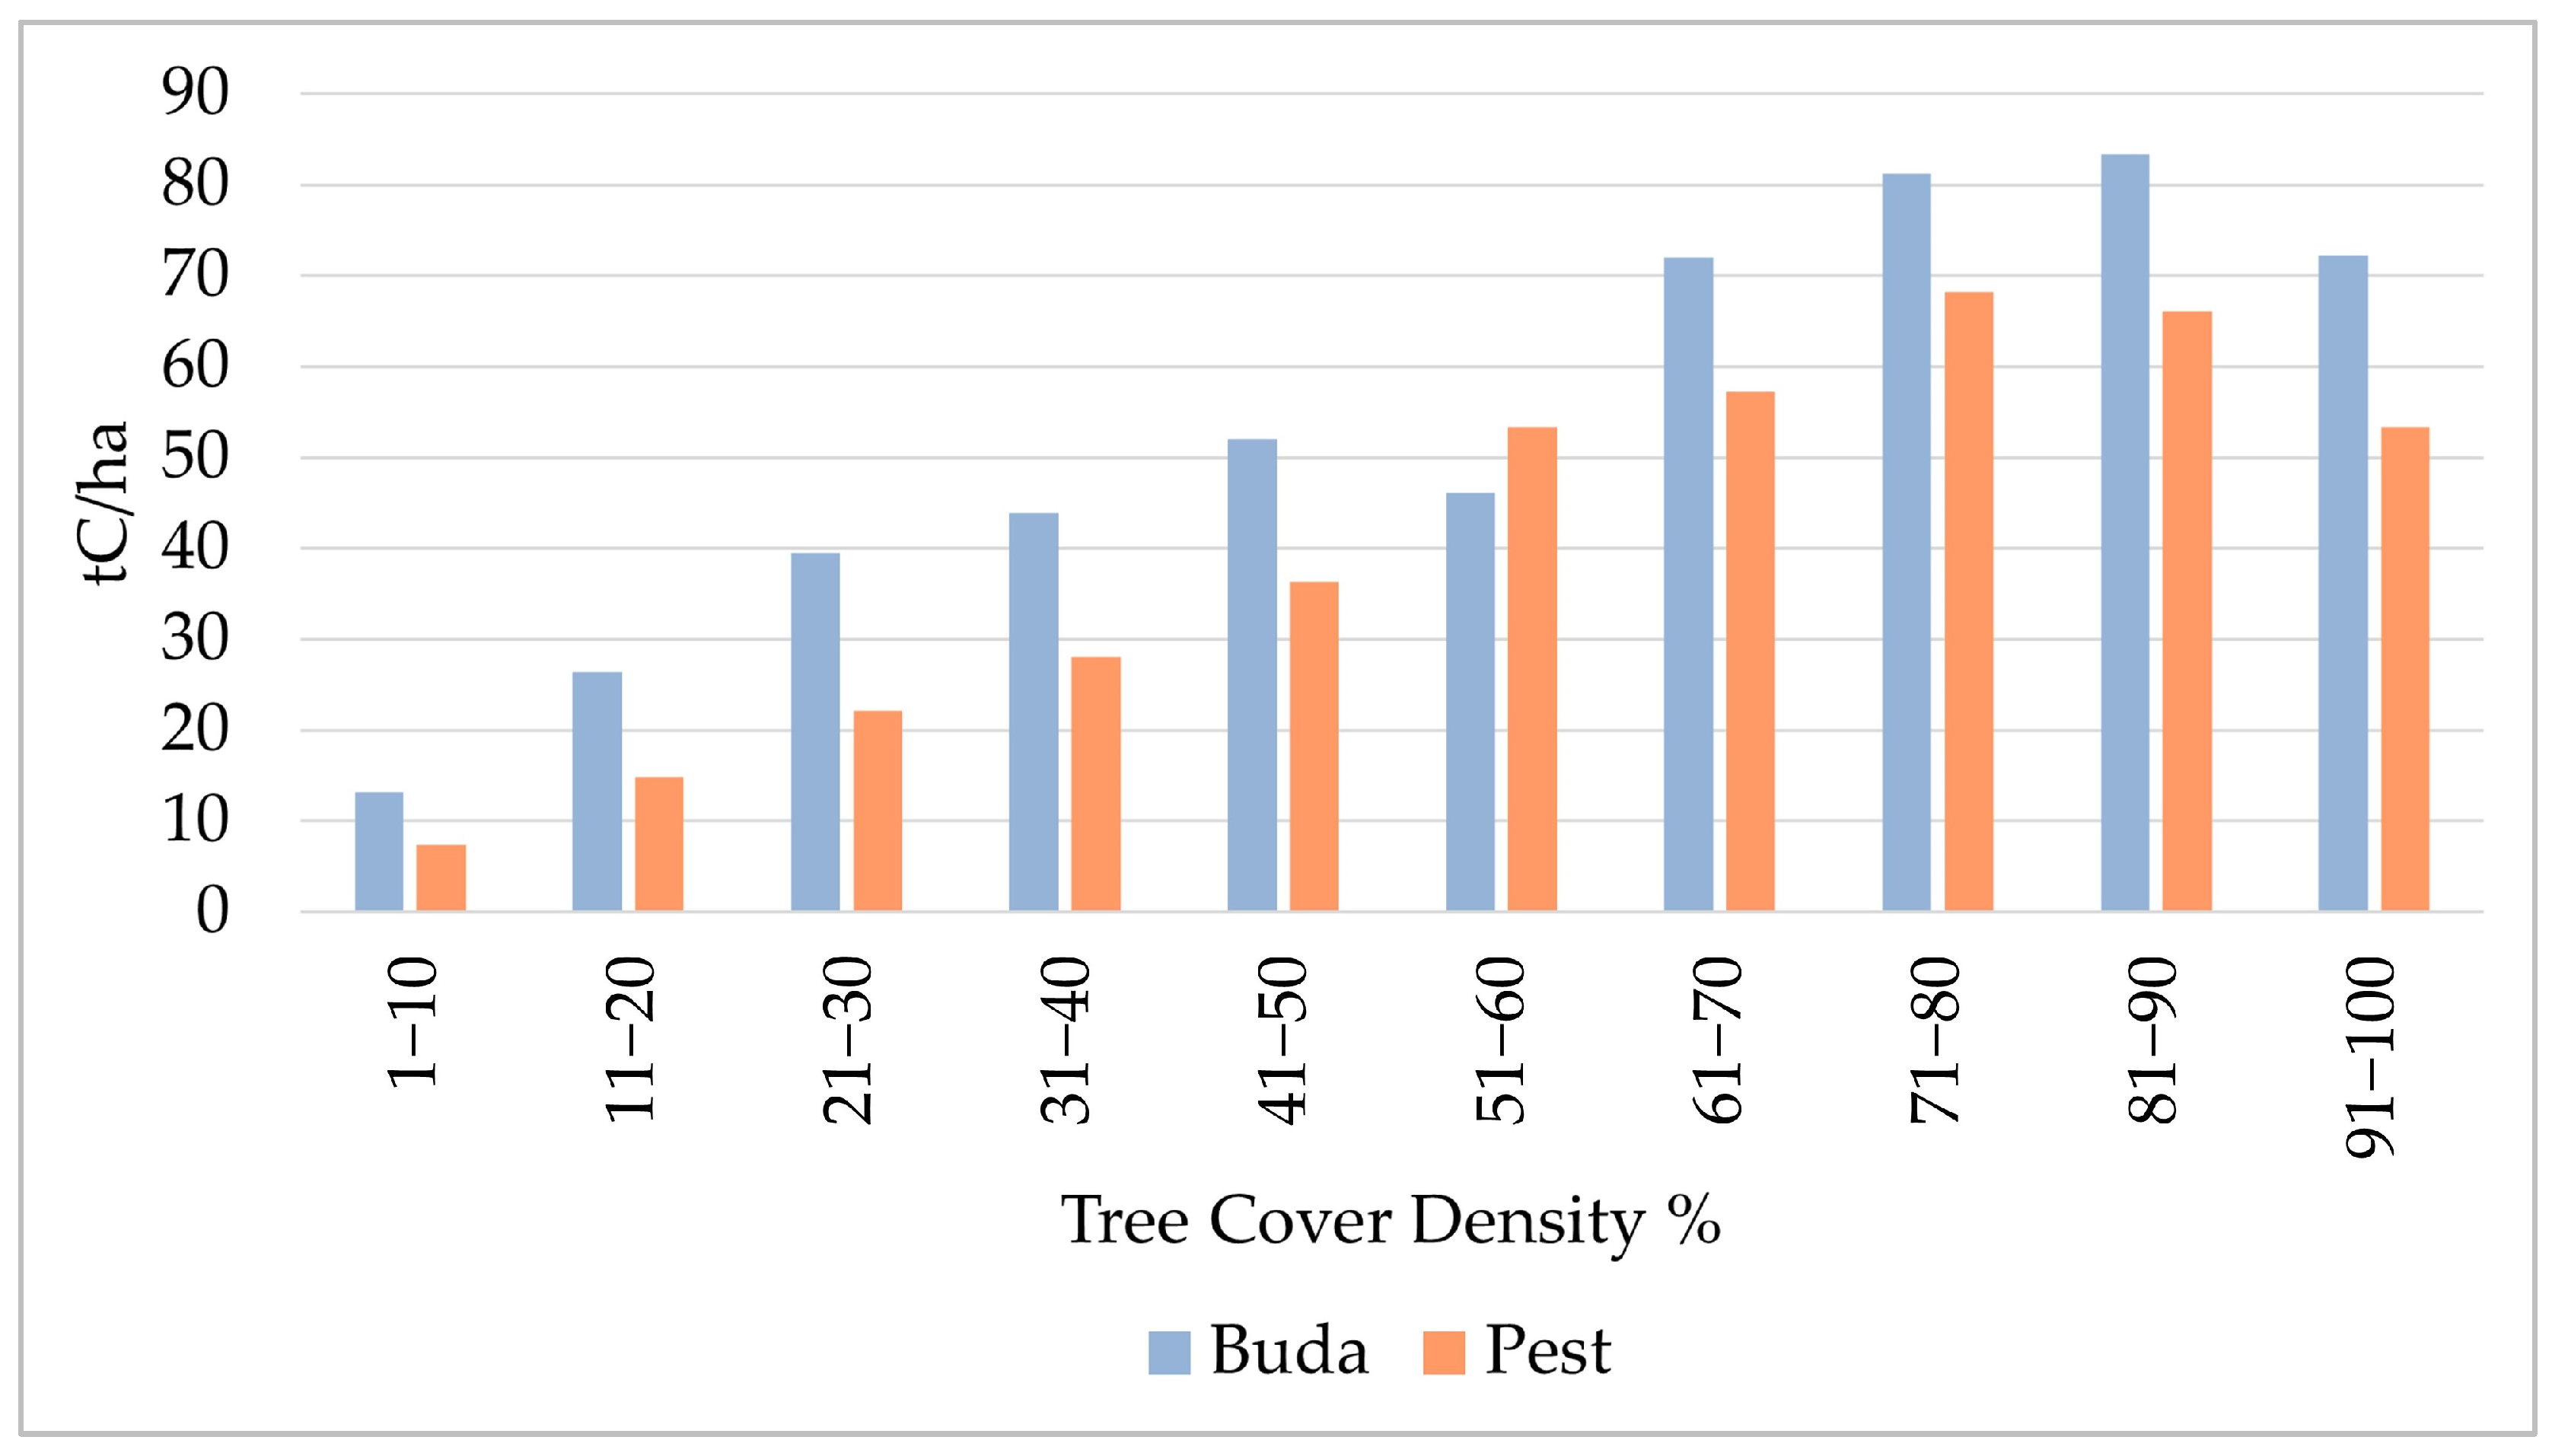
2.2.2. Urban Trees Outside Forest Management Planning

To estimate the carbon sequestration and storage of all other trees within Budapest that are not subject to forest management planning (FMP), data from the Copernicus Land Monitoring Service’s High Resolution Layer Tree Cover Density [33,34] (hereinafter referred to as TCD2012 and TCD2018) was utilized.
First, we evaluated how areas under FMP were represented in TCD2012 and TCD2018. We identified areas with forest cover in both years according to the NFD and verified whether TCD2012 and TCD2018 also indicated tree cover in these locations. Since TCD2012 only detected tree cover in 88.5% of the stocked forest areas, we applied a correction factor of 1.13 to adjust the tree-covered area data from TCD2012. In all subsequent steps, we used this corrected dataset.
To obtain carbon stock data by tree cover density classes, we used data from forest subcompartments within Budapest, grouped in 10% tree cover density increments. Carbon stock was calculated separately for the Buda and Pest sides for each density class. Thereafter, we identified all tree-covered areas outside FMP in TCD2012 and TCD2018 for both Buda and Pest separately. These areas were then summed by tree cover density class, and carbon stock was calculated for each class, for Buda and Pest separately, as follows.
Δ C T C D _ c l a s s = C T C D _ c l a s s _ 2018 C T C D _ c l a s s _ 2012 6
C t = i = 1 10 A T C D _ c l a s s _ t × C T C D _ c l a s s
C T C D _ c l a s s _ t = A T C D _ c l a s s _ t × C T C D _ c l a s s
where:
ΔCTCD_class: net annual sink (i.e., net annual carbon stock change) of a given tree cover density class between years 2012-2018 (t CO2);
CTCD_class_2018: carbon stock of a tree cover density class in year 2018 (tC);
CTCD_class_2012: carbon stock of a tree cover density class in year 2012 (tC);
Ct: carbon stock of all trees not under FMP in year t (ie., 2012 or 2018) for all tree cover density classes (1 to 10) (tC);
ATCD_class_t: area of a tree cover density class in year t (ha);
CTCD_class_t: carbon stock of a tree cover density class in year t (tC/ha).

2.2.3. Validation of the Results
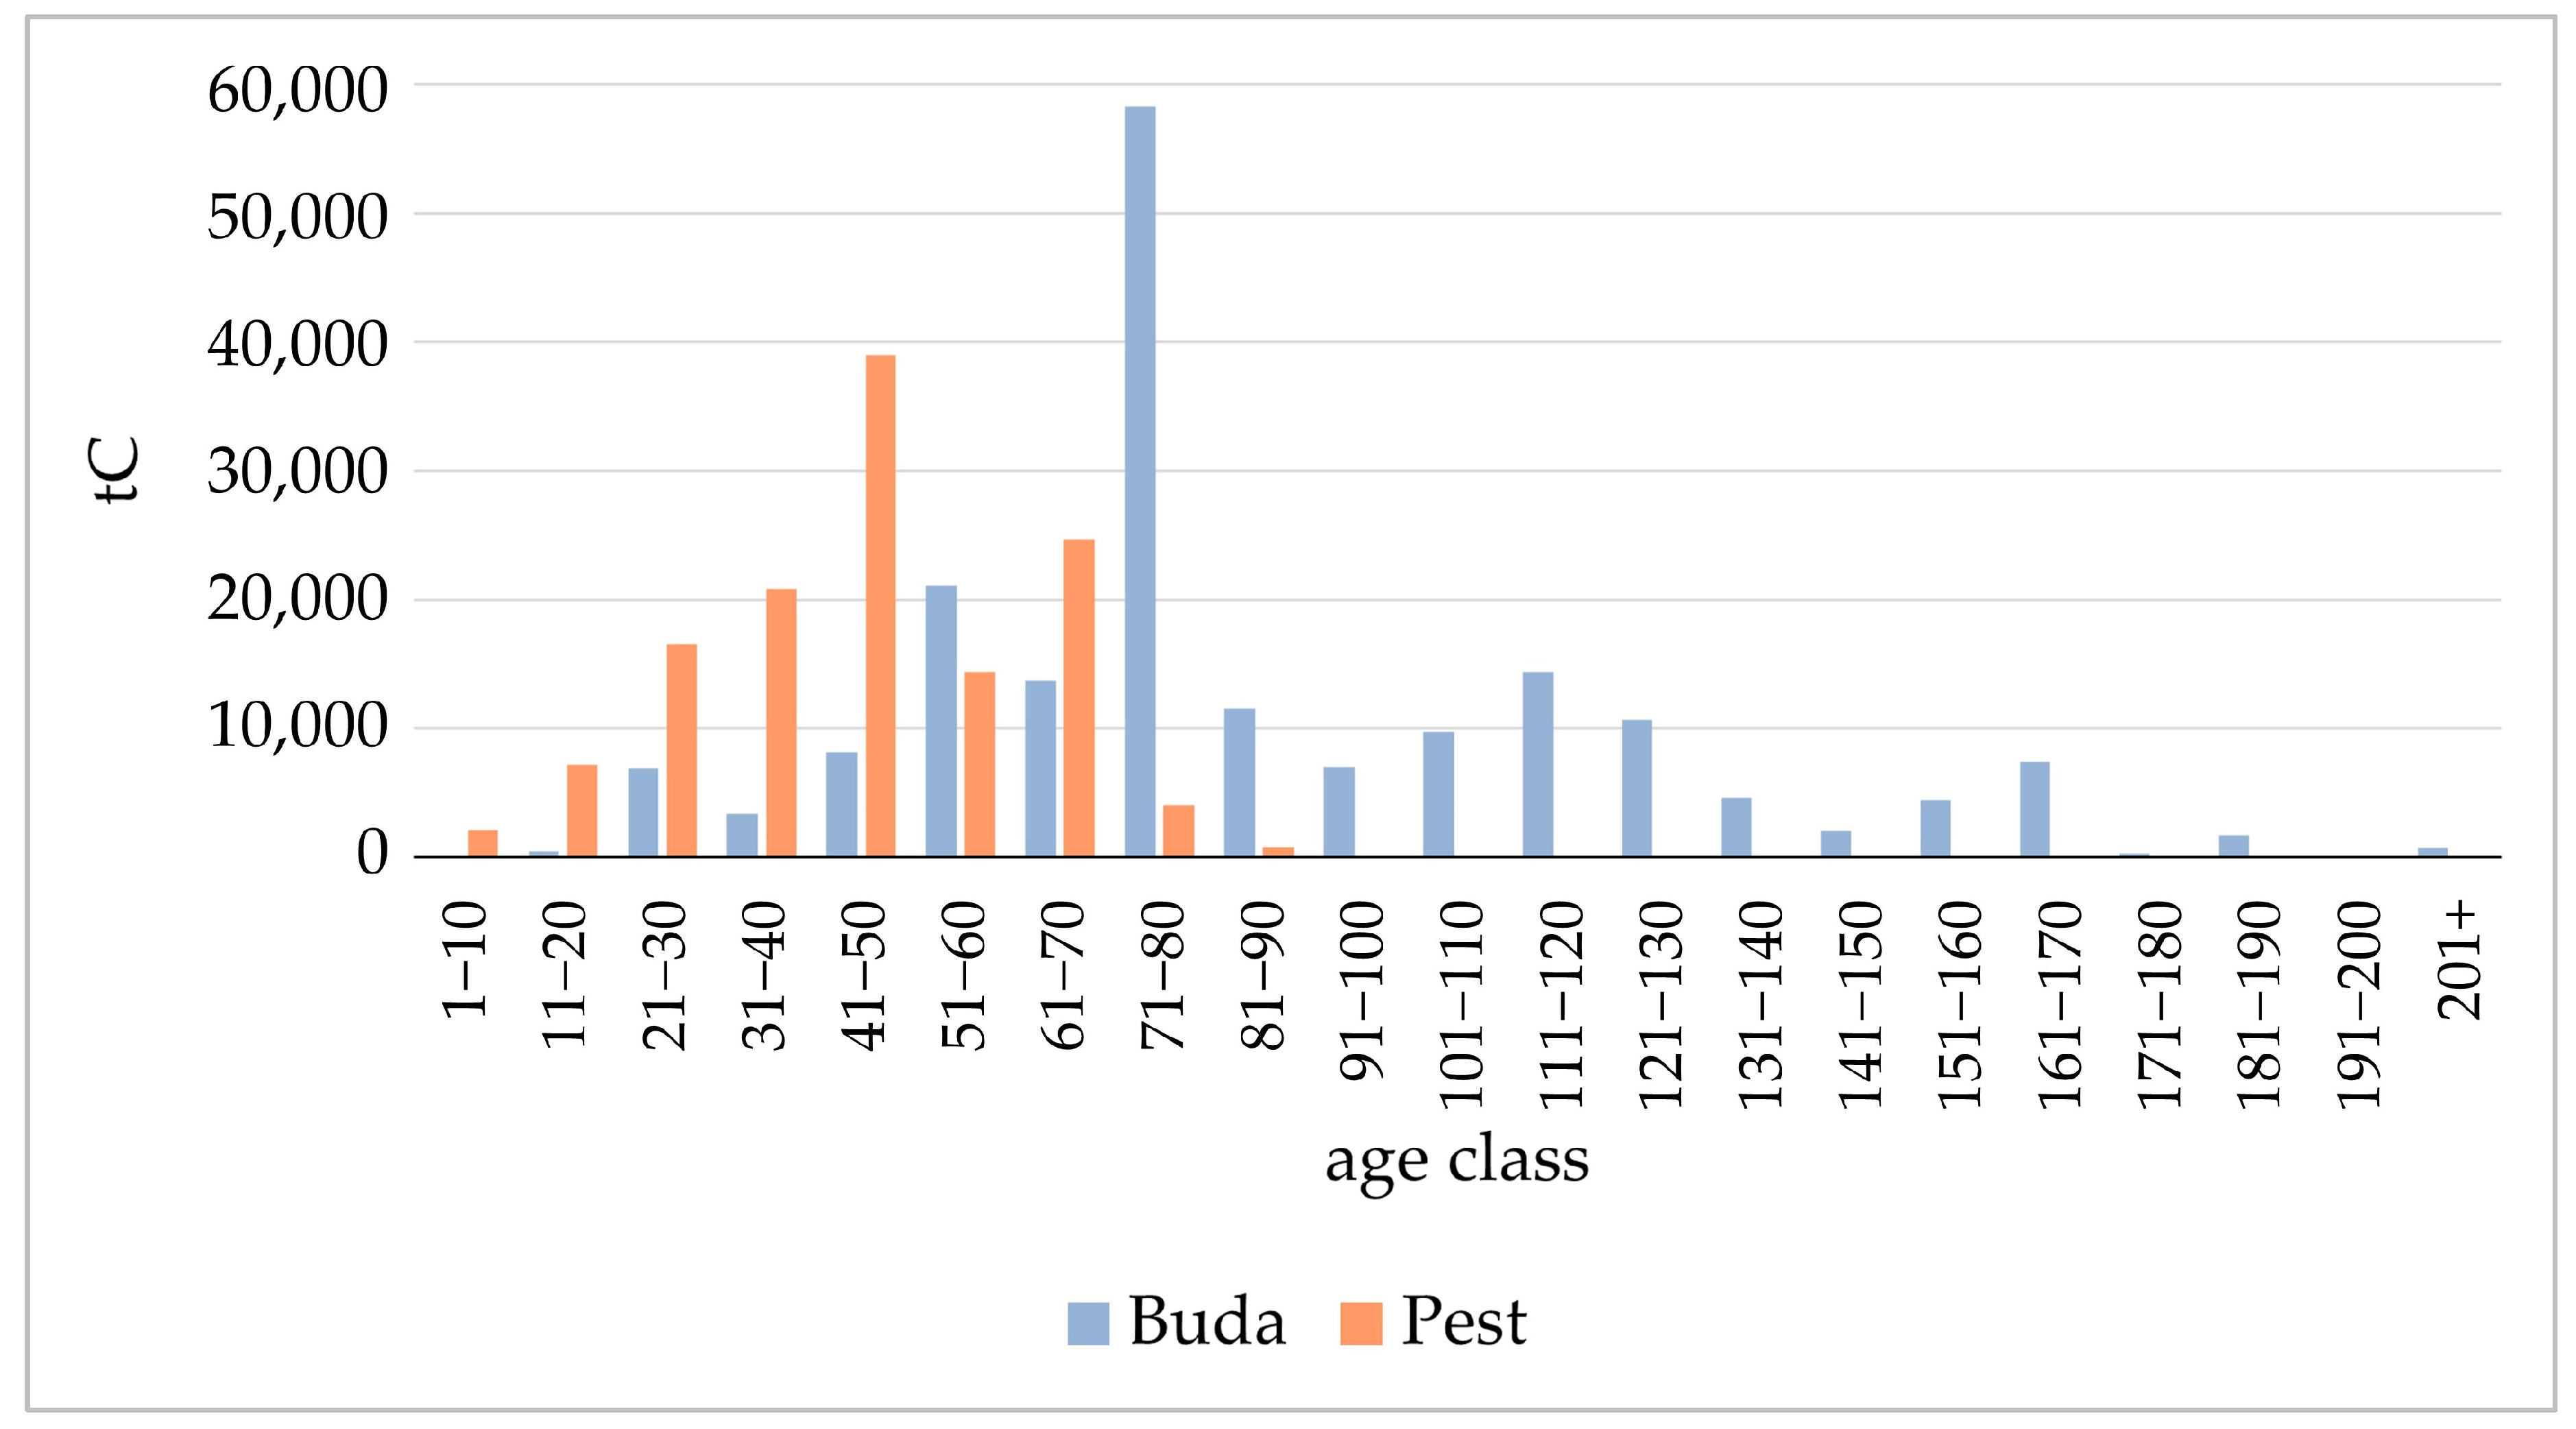
To validate our results, we used the global forest above-ground carbon stocks and fluxes dataset from GEDI and ICESat-2 by Ma et al. [23]. This dataset provides global gridded estimates of forest above-ground carbon stocks and potential fluxes at a 0.01-degree resolution. It was generated by initializing the global Ecosystem Demography model (ED v3.0) with remote sensing observations of tree canopy height collected by GEDI and ICESat-2, two NASA spaceborne lidar missions. Lidar samples were used to create gridded canopy height histograms, which were then linked to Ecosystem Demography model simulations of canopy height and carbon dynamics during ecosystem succession. This process helped constrain the representation of contemporary forest conditions and their associated carbon stocks and fluxes. The model inputs included meteorological data, carbon dioxide levels, and soil properties. The dataset is available in cloud-optimized GeoTIFF format and provides information on forest above-ground carbon stock and annual flux for the reference period 2018–2021. To validate our calculations, we summed the stock and flux data for the Budapest area and compared them with our results.
The methodological steps followed in this study are presented in Figure 3.

3. Results

Our findings show that 5336 hectares of urban forests were under FMP in 2020 in Budapest. Figure 4 illustrates the distribution of carbon stock across different age classes, which varies significantly between the Buda and Pest sides of the city. In Buda, the 71–80-year age class has an exceptionally high carbon stock due to a skewed age class structure and the large forested area in this category. Older age classes (60–200+ years) are overrepresented in Buda. In contrast, in Pest, the oldest forests fall within the 81–90-year age class, while the highest carbon stock is observed in the 41–50-year age class.
Figure 5 illustrates the net carbon sequestration of urban forests under FMP, categorized by tree species groups. On the Buda side, sessile oak (Quercus petraea) and Turkey oak (Quercus cerris) exhibit the highest net carbon uptake, while pedunculate oak (Quercus robur), linden (Tilia spp.), and black pine (Pinus nigra) act as net carbon sources during the examined period. On the Pest side, pedunculate oak represents the highest carbon sink, with Turkey oak, willows (Salix spp.), and black locust (Robinia pseudoacacia) also contributing to carbon sequestration. In contrast, Scots pine (Pinus sylvestris) acts as a source of emissions in the 2010–2020 period.
Figure 6 presents the 2020 carbon stock of urban forests under FMP, categorized by tree species groups. On the Buda side, sessile oak, Turkey oak, and ash (Fraxinus spp.) forests exhibit the highest carbon stock and cover the largest area. In contrast, on the Pest side, black locust and pedunculate oak forests have the highest carbon stock.
Figure 7 and Figure 8 display map outputs from the analysis, illustrating carbon balance and carbon stock based on the applied 100 × 100 m sampling grid. The maps clearly show that densely stocked areas with high carbon stocks are predominantly located on the Buda side, particularly in the Buda Hills region (Figure 8).
Figure 9 illustrates urban forest areas under FMP (brown) and other urban tree cover based on TCD2018 (green). In 2018, the total area of urban tree cover outside FMP was 6932 hectares. Figure 10 presents carbon stock values by tree cover density classes, derived from areas under FMP within Budapest. These values were then used to estimate the carbon stock of areas with tree cover not under FMP.
Figure 11 presents the estimated carbon stocks by tree cover density groups for Buda and Pest separately, while Figure 12 illustrates the estimated annual changes in carbon stocks by tree cover density groups. In Pest, the analysis indicates a net carbon sink, whereas in Buda, trees outside FMP are estimated to have been a source of emissions during the 2012–2018 period.
Our estimate suggests that the total net carbon sequestration and avoided emissions from urban forests and trees in Budapest amounted to −41,338 tCO2 annually during the examined period. According to our estimate, the net carbon sink and avoided emissions through energy substitution are higher on the Pest side, driven by a higher in situ carbon sink in urban forests, greater harvested timber carbon content, and consequently higher estimated energy substitution effects (Figure 13, Table 1). On the Buda side, carbon sinks are moderate, with trees not under the FMP acting as a source of emissions. In contrast, carbon stocks are significantly higher on the Buda side, reaching 132 tC/ha, while the Pest-side mean stock is estimated at 104.9 tC/ha (Figure 13, Table 1). The ANOVA analysis revealed that the location of urban forests (Buda vs. Pest) had a significant effect on carbon sink and stock. Post hoc tests indicated that the mean values for Buda and Pest were significantly different at a 95% confidence level.
We validated our estimates using the global forest above-ground carbon stocks and fluxes dataset from GEDI and ICESat-2, as reported by Ma et al. [23]. For above-ground carbon fluxes, our estimates are 114% of those reported by Ma et al. [23]. In contrast, our above-ground carbon stock estimates are lower, at only 65% of the estimates from Ma et al. [23]. However, in both cases, the order of magnitude remains consistent (Figure 14).

4. Discussion

Urban forests are often referred to as the “lungs of cities”, highlighting the importance of their carbon sequestration and air purification capacities [16]. However, studies conducted in mid-latitude cities commonly indicate that the net carbon uptake by urban greenery is relatively small compared to anthropogenic emissions [48,49,50]. Crawford and Christen [50] conducted a comprehensive spatial analysis using a high-resolution land cover database and empirical models and found that vegetation and soil offset only 1.7% of the total CO2 flux in a residential neighborhood of Vancouver, Canada. Similarly, Velasco et al. [8] reported that the biogenic contribution to total CO2 flux was only −1.4% in Mexico City and 4.4% in Singapore. More recently, Guo et al. [16] found that the urban forest in the main city of Changchun offset approximately 2.11% of carbon emissions in 2000, decreasing to 0.88% by 2019. Our findings align with these results, as we estimate that urban forests and trees in Budapest offset a total of −41,338 tCO2 annually through net carbon sequestration and avoided emissions via substitution effects. This accounts for approximately 1% of Budapest’s total emissions, which amounted to 6,109,183 tCO2 in 2015 as reported by Tatai et al. [51]. While the contribution of urban forests to total citywide carbon sequestration is relatively small, consistent with findings from other cities, their role in climate mitigation and adaptation remains significant and should not be undervalued. Enhancing this capacity through informed species selection and adaptive management can improve resilience in the face of increasing climatic stress.
Our results are also consistent with the Hungarian GHGI [42], which reports an average annual carbon sink of −2.1 tCO2/ha for forest land remaining forest land across Hungary. According to our findings, the average in situ carbon sink of Budapest’s urban forests under FMP is −1.8 tCO2/ha/year, while Pest-side forests achieve a sink of −2.2 tCO2/ha/year, which is very close to the national average. The validation results indicate that while our above-ground carbon flux estimates are higher—amounting to 114% of those reported by Ma et al. [23]—our above-ground carbon stock estimates are lower, representing only 65% of their values. Despite these differences, both estimates remain within the same order of magnitude, suggesting that the overall trends are consistent with those reported by Ma et al. [23] (Figure 14). The observed discrepancies in carbon flux and stock estimates between our study and Ma et al. [23] may arise from several methodological differences. Ma et al. [23] relied on remote sensing data from the GEDI and ICESat-2 missions, using lidar-based observations of canopy height in combination with ecosystem modeling to estimate carbon stocks and fluxes. Although this approach provides high-resolution, globally consistent data, it lacks country-specific calibration. In contrast, our estimates are based on ground measurements and country-specific yield tables tailored to Hungarian forest conditions, potentially offering more accurate results. Furthermore, Ma et al. [23] incorporated complex model simulations that account for meteorological variability, atmospheric CO2 concentrations, and soil properties, which may contribute to their higher carbon stock values. Differences in the treatment of forest dynamics—such as natural disturbances, mortality rates, and succession—could also explain the divergence in results. Nevertheless, the general agreement in the order of magnitude across studies reinforces the robustness of both approaches and highlights their complementary value in understanding the carbon dynamics of Budapest’s urban forests.
The urban forests on the Buda and Pest sides exhibit significant differences in age class structure, tree species composition, and naturalness. On the Buda side, older semi-natural forests dominated by native species prevail. These forests primarily function as in situ carbon reservoirs, and their additional carbon sequestration capacity is limited due to their older age, slower growth of trees, and longer rotation periods. Additionally, the high carbon stock associated with ash trees poses a considerable risk of carbon emissions due to the potential impacts of ash dieback [52].
In contrast, the forests on the Pest side are predominantly cultural forests (i.e., extensively managed introduced forests) and tree plantations, with a lower degree of naturalness. Non-native species, such as black locust and hybrid poplars (Populus × euramericana), are overrepresented. These forests are younger, resulting in lower carbon stocks but higher in situ carbon sequestration rates, while also being subject to more intensive logging. Pest-side forests exhibit a higher carbon sink performance despite the considerably harsher climatic conditions compared to Buda, as on the Pest side, only forest–steppe and steppe climate zones are present (Figure 2). The climate classification of the National Forestry Database (NFD) differs somewhat from the categories indicated by the SiteViewer 3.0 [53] decision support tool under the RCP4.5 scenario for the 2011–2040 reference period. This discrepancy arises because microclimatic conditions in the Buda Hills may, in some cases, be more favorable than what is suggested by mesoclimatic models. Conversely, the NFD climate categories may sometimes reflect past conditions without fully accounting for the rapid progression of climate change, which significantly impacts many forest species in Hungary due to the proximity of the xeric limit. SiteViewer is a key tool for climate-smart forestry in Hungary, supporting the adaptation of management strategies to both present and future climatic conditions. To maximize the mitigation and adaptation potential of forests, it is essential to integrate data on suitable species recommended by this decision support application into management decisions while also considering subcompartment-level site conditions and microclimatic observations gathered in the field.
Urban tree cover is declining in many cities worldwide [54], with climate change recognized as one of the most significant threats in the medium- and long-term [55,56]. Rising temperatures can substantially reduce photosynthetic rates and increase tree mortality, leading to lower carbon sequestration and greater carbon losses [57]. Lloyd et al. [58] assess the risks climate change poses to urban tree carbon storage due to increased heat and drought. Analyzing tree inventory data from 22 European cities, they estimate species-specific thermal and hydraulic safety gaps and margins for 2050 and 2070. Their findings highlight the proportion of existing urban forest carbon stocks at risk from thermal and drought stress, identifying regions and cities where urban tree stocks are particularly vulnerable. Cities in southern and central Europe—including Budapest, Bologna, Bordeaux, Cáceres, Geneva, Girona, Madrid, Turin, Vienna, and Zagreb—are projected to face significant threats, with at least 75% of the carbon stored in trees at risk by 2070. The authors stress the importance of adapting urban planting strategies to include more resilient species and developing mitigation plans to alleviate heat and water stress on trees.
Given these challenges, actively managing urban forests in Budapest is crucial for both climate mitigation and adaptation, ensuring their future carbon sink capacity and resilience. If climatically suitable species are not currently available, assisted migration of species better adapted to future conditions may be necessary [59]. Since market availability significantly influences the selection of tree species by stakeholders, it is essential to ensure that climate-resilient species are accessible for planting [60]. However, assisted migration must be carefully managed to prevent the spread of invasive pests and diseases, such as the oak processionary moth [58].
The limitation of our study is the lack of data on soil carbon stock and balance for urban forest areas in Budapest. Soil carbon plays a crucial role in the overall carbon dynamics of urban forests, influencing both carbon sequestration potential and long-term carbon storage [61]. Without this information, our assessment provides only a partial view of the total carbon balance in urban green spaces. Future research should address this gap to develop a more comprehensive understanding of urban forest carbon dynamics and support more effective climate adaptation and mitigation strategies.

5. Conclusions

This study assessed the carbon sequestration and storage potential of Budapest’s urban forests using data from the National Forestry Database and the Copernicus Land Monitoring Service High Resolution Layer Tree Cover Density [33,34]. The results highlight the significant role of Budapest’s urban forests and trees in carbon sequestration and storage, with an estimated annual offset of −41,338 tCO2, representing roughly 1% of the city’s total emissions.
These findings highlight the need for targeted management strategies to maximize the carbon sink capacity of urban forests while accounting for the marked differences between the Buda and Pest sides in terms of tree species composition, forest age class structure, and climatic conditions. In view of the escalating challenges posed by climate change, it is essential to integrate climate-smart forestry approaches into urban forest management. This includes the selection of resilient, drought-tolerant native species such as Hungarian oak (Quercus frainetto), Turkey oak (Quercus cerris), downy oak (Quercus pubescens), Italian oak (Quercus virgiliana), small-leaved lime (Tilia cordata), silver lime (Tilia tomentosa), whitebeam (Sorbus aria), manna ash (Fraxinus ornus), and common pear (Pyrus communis). These species not only tolerate harsher conditions but also possess strong carbon sequestration potential. To increase urban tree cover, targeted afforestation and greening initiatives are recommended, particularly in areas of Pest where forest cover is sparse and fragmentation is high. Priority should be given to peri-urban zones, former industrial sites, and underutilized public lands.
Tools like the SiteViewer 3.0 decision support system should be used to guide species selection and management decisions based on current and projected climatic conditions. Active and adaptive management will be critical to ensure that urban forests in Budapest continue to serve as effective carbon sinks while supporting biodiversity and providing essential ecosystem services in a changing climate.

Author Contributions

Conceptualization, É.K. and A.B.; methodology, É.K.; validation, A.B. and G.I.; formal analysis, É.K.; writing—original draft preparation, É.K. and G.I.; writing—review and editing, A.B.; visualization, É.K.; supervision, A.B.; project administration, A.B.; funding acquisition, A.B. All authors have read and agreed to the published version of the manuscript.

Funding

Project no. EGF/234/2024 has been implemented with the support provided by the Hungarian Ministry of Energy from the “Energy and Climate Policy Modernization System” budgetary allocation, financed by the Hungarian Ministry of Agriculture under the professional framework of the “Forest Restoration, Forests in Climate Change” funding scheme.

Data Availability Statement

The raw data supporting the conclusions of this article will be made available by the authors on request.

Acknowledgments

This publication has been prepared using the European Union’s Copernicus Land Monitoring Service information; https://doi.org/10.2909/486f77da-d605-423e-93a9-680760ab6791, https://doi.org/10.2909/91687ef2-f907-4f84-81f7-c9c81980c306.

Conflicts of Interest

The authors declare no conflicts of interest.

Abbreviations

The following abbreviations are used in this manuscript:
CCarbon
CO2Carbon dioxide
FMPForest Management Planning
GHGIGreenhouse Gas Inventory
NFDNational Forestry Database of Hungary
PMParticulate Matter
TCD2012Copernicus Land Monitoring Service High Resolution Layer Tree Cover Density 2012
TCD2018Copernicus Land Monitoring Service High Resolution Layer Tree Cover Density 2018

References

  1. Calvin, K.; Dasgupta, D.; Krinner, G.; Mukherji, A.; Thorne, P.W.; Trisos, C.; Romero, J.; Aldunce, P.; Barrett, K.; Blanco, G.; et al. IPCC, 2023: Climate Change 2023: Synthesis Report. Contribution of Working Groups I, II and III to the Sixth Assessment Report of the Intergovernmental Panel on Climate Change; Core Writing Team, Lee, H., Romero, J., Eds.; IPCC: Geneva, Switzerland, 2023. [Google Scholar]
  2. United Nations Department of Economic and Social Affairs. World Population Prospects 2019. 2019. Available online: https://www.un.org/development/desa/pd/news/world-population-prospects-2019-0 (accessed on 10 March 2025).
  3. Choi, C.; Berry, P.; Smith, A. The Climate Benefits, Co-Benefits, and Trade-Offs of Green Infrastructure: A Systematic Literature Review. J. Environ. Manag. 2021, 291, 112583. [Google Scholar] [CrossRef] [PubMed]
  4. Strassburg, B.B.N.; Iribarrem, A.; Beyer, H.L.; Cordeiro, C.L.; Crouzeilles, R.; Jakovac, C.C.; Braga Junqueira, A.; Lacerda, E.; Latawiec, A.E.; Balmford, A.; et al. Global Priority Areas for Ecosystem Restoration. Nature 2020, 586, 724–729. [Google Scholar] [CrossRef] [PubMed]
  5. Feng, R.; Liu, S.; Wang, F.; Wang, K.; Gao, P.; Xu, L. Quantifying the Environmental Synergistic Effect of Cooling-Air Purification-Carbon Sequestration from Urban Forest in China. J. Clean. Prod. 2024, 448, 141514. [Google Scholar] [CrossRef]
  6. Dhakal, S. GHG Emissions from Urbanization and Opportunities for Urban Carbon Mitigation. Curr. Opin. Environ. Sustain. 2010, 2, 277–283. [Google Scholar] [CrossRef]
  7. Hong, W.; Ren, Z.; Guo, Y.; Wang, C.; Cao, F.; Zhang, P.; Hong, S.; Ma, Z. Spatiotemporal Changes in Urban Forest Carbon Sequestration Capacity and Its Potential Drivers in an Urban Agglomeration: Implications for Urban CO2 Emission Mitigation under China’s Rapid Urbanization. Ecol. Indic. 2024, 159, 111601. [Google Scholar] [CrossRef]
  8. Velasco, E.; Roth, M.; Norford, L.; Molina, L.T. Does Urban Vegetation Enhance Carbon Sequestration? Landsc. Urban. Plan. 2016, 148, 99–107. [Google Scholar] [CrossRef]
  9. Steenberg, J.W.N.; Duinker, P.N.; Nitoslawski, S.A. Ecosystem-Based Management Revisited: Updating the Concepts for Urban Forests. Landsc. Urban. Plan. 2019, 186, 24–35. [Google Scholar] [CrossRef]
  10. Goodwin, S.; Olazabal, M.; Castro, A.J.; Pascual, U. Global Mapping of Urban Nature-Based Solutions for Climate Change Adaptation. Nat. Sustain. 2023, 6, 458–469. [Google Scholar] [CrossRef]
  11. Ren, Z.; Zheng, H.; He, X.; Zhang, D.; Shen, G.; Zhai, C. Changes in Spatio-Temporal Patterns of Urban Forest and Its above-Ground Carbon Storage: Implication for Urban CO2 Emissions Mitigation under China’s Rapid Urban Expansion and Greening. Environ. Int. 2019, 129, 438–450. [Google Scholar] [CrossRef]
  12. Feng, R.; Wang, F.; Liu, S.; Qi, W.; Zhao, Y.; Wang, Y. How Urban Ecological Land Affects Resident Heat Exposure: Evidence from the Mega-Urban Agglomeration in China. Landsc. Urban. Plan. 2023, 231, 104643. [Google Scholar] [CrossRef]
  13. Fu, B.; Liu, Y.; Meadows, M.E. Ecological Restoration for Sustainable Development in China. Natl. Sci. Rev. 2023, 10, nwad033. [Google Scholar] [CrossRef] [PubMed]
  14. Sun, Y.; Xie, S.; Zhao, S. Valuing Urban Green Spaces in Mitigating Climate Change: A City-wide Estimate of Aboveground Carbon Stored in Urban Green Spaces of China’s Capital. Glob. Chang. Biol. 2019, 25, 1717–1732. [Google Scholar] [CrossRef]
  15. Zhuang, Q.; Shao, Z.; Li, D.; Huang, X.; Li, Y.; Altan, O.; Wu, S. Impact of Global Urban Expansion on the Terrestrial Vegetation Carbon Sequestration Capacity. Sci. Total Environ. 2023, 879, 163074. [Google Scholar] [CrossRef] [PubMed]
  16. Guo, Y.; Ren, Z.; Wang, C.; Zhang, P.; Ma, Z.; Hong, S.; Hong, W.; He, X. Spatiotemporal Patterns of Urban Forest Carbon Sequestration Capacity: Implications for Urban CO2 Emission Mitigation during China’s Rapid Urbanization. Sci. Total Environ. 2024, 912, 168781. [Google Scholar] [CrossRef] [PubMed]
  17. Le Noë, J.; Matej, S.; Magerl, A.; Bhan, M.; Erb, K.; Gingrich, S. Modeling and Empirical Validation of Long-term Carbon Sequestration in Forests (France, 1850–2015). Glob. Chang. Biol. 2020, 26, 2421–2434. [Google Scholar] [CrossRef]
  18. Zhu, L.; Song, R.; Sun, S.; Li, Y.; Hu, K. Land Use/Land Cover Change and Its Impact on Ecosystem Carbon Storage in Coastal Areas of China from 1980 to 2050. Ecol. Indic. 2022, 142, 109178. [Google Scholar] [CrossRef]
  19. Babbar, D.; Areendran, G.; Sahana, M.; Sarma, K.; Raj, K.; Sivadas, A. Assessment and Prediction of Carbon Sequestration Using Markov Chain and InVEST Model in Sariska Tiger Reserve, India. J. Clean. Prod. 2021, 278, 123333. [Google Scholar] [CrossRef]
  20. Raum, S.; Hand, K.L.; Hall, C.; Edwards, D.M.; O’Brien, L.; Doick, K.J. Achieving Impact from Ecosystem Assessment and Valuation of Urban Greenspace: The Case of i-Tree Eco in Great Britain. Landsc. Urban. Plan. 2019, 190, 103590. [Google Scholar] [CrossRef]
  21. Yuan, Q.; Wu, S.; Zhao, D.; Dai, E.; Chen, L.; Zhang, L. Modeling Net Primary Productivity of the Terrestrial Ecosystem in China from 1961 to 2005. J. Geogr. Sci. 2014, 24, 3–17. [Google Scholar] [CrossRef]
  22. Mao, D.; Luo, L.; Wang, Z.; Zhang, C.; Ren, C. Variations in Net Primary Productivity and Its Relationships with Warming Climate in the Permafrost Zone of the Tibetan Plateau. J. Geogr. Sci. 2015, 25, 967–977. [Google Scholar] [CrossRef]
  23. Ma, L.; Hurtt, G.C.; Tang, H.; Lamb, R.; Lister, A.J.; Chini, L.P.; Dubayah, R.O.; Armston, J.; Campbell, E.; Duncanson, L.; et al. Global Forest Aboveground Carbon Stocks and Fluxes from GEDI and ICESat-2, 2018–2021; ORNL DAAC: Oak Ridge, TN, USA, 2023. [Google Scholar]
  24. Zhuang, Q.; Shao, Z.; Gong, J.; Li, D.; Huang, X.; Zhang, Y.; Xu, X.; Dang, C.; Chen, J.; Altan, O.; et al. Modeling Carbon Storage in Urban Vegetation: Progress, Challenges, and Opportunities. Int. J. Appl. Earth Obs. Geoinf. 2022, 114, 103058. [Google Scholar] [CrossRef]
  25. Matthews, B.; Schume, H. Tall Tower Eddy Covariance Measurements of CO2 Fluxes in Vienna, Austria. Atmos. Environ. 2022, 274, 118941. [Google Scholar] [CrossRef]
  26. World Population Review. Available online: https://worldpopulationreview.com/cities/hungary/budapest (accessed on 9 April 2025).
  27. Carvalho, M.L.; van der Meer, J.; van den Berg, L. Cities as Engines of Sustainable Competitiveness: European Urban Policy in Practice, 978th-1st-4724th-2704th–5th ed.; Ashgate Publishing: Farnham, UK, 2014. [Google Scholar]
  28. Chen, H.; Kardos, L.; Chen, H.; Szabó, V. Investigating Physiological Responses and Fine Particulate Matter Retention of Urban Trees in Budapest. City Environ. Interact. 2024, 24, 100182. [Google Scholar] [CrossRef]
  29. Tatai, Z.; Zétényi, D.; Niedetzky, A.; Bódi-Nagy, A.; Balogh, Á.; Orosz, I.; Szabó, K.; Becsák, P.; Varga, G. Budapest Környezeti Állapotértékelése 2023; Budapest Főváros Városépítési Tervező Kft.: Budapest, Hungary, 2023. [Google Scholar]
  30. Kovács, Z.; Farkas, J.Z.; Szigeti, C.; Harangozó, G. Assessing the Sustainability of Urbanization at the Sub-National Level: The Ecological Footprint and Biocapacity Accounts of the Budapest Metropolitan Region, Hungary. Sustain. Cities Soc. 2022, 84, 104022. [Google Scholar] [CrossRef]
  31. Göndöcs, J.; Breuer, H.; Pongrácz, R.; Bartholy, J. Urban Heat Island Mesoscale Modelling Study for the Budapest Agglomeration Area Using the WRF Model. Urban. Clim. 2017, 21, 66–86. [Google Scholar] [CrossRef]
  32. Szabó, V.; Chen, H.; Hrotkó, K.; Kohut, I. Investigation of Dust Deposition in Vegetation Period as an Ecological Service on Urban Trees in Budapest—A Case Study. Pollutants 2023, 3, 507–520. [Google Scholar] [CrossRef]
  33. TCD High-Resolution Layer Tree Cover Density (2012). 2012. Available online: https://sdi.eea.europa.eu/catalogue/copernicus/api/records/91687ef2-f907-4f84-81f7-c9c81980c306?language=all (accessed on 10 March 2025). [CrossRef]
  34. TCD High-Resolution Layer Tree Cover Density (2018). 2018. Available online: https://sdi.eea.europa.eu/catalogue/copernicus/api/records/486f77da-d605-423e-93a9-680760ab6791?language=all (accessed on 10 March 2025). [CrossRef]
  35. Tóth-Ronkay, M.; Bajor, Z.; Bárány, A.; Földvári, G.; Görföl, T.; Halpern, B.; Leél-Össy, S.; Mészáros, R.; Péntek, A.L.; Tóth, B.; et al. Budapest. In Vertebrates and Invertebrates of European Cities: Selected Non-Avian Fauna; Springer: New York, NY, USA, 2015; pp. 27–73. [Google Scholar]
  36. Probáld, F. The Urban Climate of Budapest: Past, Present and Future. Hung. Geogr. Bull. 2014, 63, 69–79. [Google Scholar] [CrossRef]
  37. Tobisch, T.; Kottek, P. Forestry-Related Databases of the Hungarian Forestry Directorate, Version 1.1; National Food Chain Safety Office, Forestry Directorate: Budapest, Hungary, 2013. [Google Scholar]
  38. Kottek, P.; Király, É.; Mertl, T.; Borovics, A. Trends of Forest Harvesting Ages by Ownership and Function and the Effects of the Recent Changes of the Forest Law in Hungary. Forests 2023, 14, 679. [Google Scholar] [CrossRef]
  39. IPCC. Refinement to the 2006 IPCC Guidelines for National Greenhouse Gas Inventories; Calvo Buendia, E., Tanabe, K., Kranjc, A., Baasansuren, J., Fukuda, M., Ngarize, S., Osako, A., Pyrozhenko, Y., Shermanau, P., Federici, S., Eds.; IPCC: Geneva, Switzerland, 2019. [Google Scholar]
  40. IPCC. IPCC Guidelines for National Greenhouse Gas Inventories, Prepared by the National Greenhouse Gas Inventories; Eggleston, H.S., Buendia, L., Miwa, K., Ngara, T., Tanabe, K., Eds.; IPCC: Geneva, Switzerland, 2006. [Google Scholar]
  41. Somogyi, Z.; Tobisch, T.; Kiraly, E. National Inventory Report For 1985–2021. Hungary. Chapter: Land-Use, Land-Use Change and Forestry; Hungarian Meteorological Service: Budapest, Hungary, 2023. [Google Scholar]
  42. Leskinen, P.; Cardellini, G.; González-García, S.; Hurmekoski, E.; Sathre, R.; Seppälä, J.; Smyth, C.; Stern, T.; Verkerk, P.J. Substitution effects of wood-based products in climate change mitigation. In Science to Policy 7; European Forest Institute: Joensuu, Finland, 2018; p. 28. [Google Scholar]
  43. Myllyviita, T.; Soimakallio, S.; Judl, J.; Seppälä, J. Wood Substitution Potential in Greenhouse Gas Emission Reduction–Review on Current State and Application of Displacement Factors. For. Ecosyst. 2021, 8, 42. [Google Scholar] [CrossRef]
  44. Knauf, M.; Joosten, R.; Frühwald, A. Assessing Fossil Fuel Substitution through Wood Use Based on Long-Term Simulations. Carbon. Manag. 2016, 7, 67–77. [Google Scholar] [CrossRef]
  45. Knauf, M.; Köhl, M.; Mues, V.; Olschofsky, K.; Frühwald, A. Modeling the CO2-Effects of Forest Management and Wood Usage on a Regional Basis. Carbon. Balance Manag. 2015, 10, 13. [Google Scholar] [CrossRef] [PubMed]
  46. Härtl, F.H.; Höllerl, S.; Knoke, T. A New Way of Carbon Accounting Emphasises the Crucial Role of Sustainable Timber Use for Successful Carbon Mitigation Strategies. Mitig. Adapt. Strateg. Glob. Change 2017, 22, 1163–1192. [Google Scholar] [CrossRef]
  47. Schweinle, J.; Köthke, M.; Englert, H.; Dieter, M. Simulation of Forest-based Carbon Balances for Germany: A Contribution to the‘Carbon Debt’ Debate. WIREs Energy Environ. 2018, 7. [Google Scholar] [CrossRef]
  48. Nemitz, E.; Hargreaves, K.J.; McDonald, A.G.; Dorsey, J.R.; Fowler, D. Micrometeorological Measurements of the Urban Heat Budget and CO2 Emissions on a City Scale. Environ. Sci. Technol. 2002, 36, 3139–3146. [Google Scholar] [CrossRef]
  49. Soegaard, H.; Møller-Jensen, L. Towards a Spatial CO2 Budget of a Metropolitan Region Based on Textural Image Classification and Flux Measurements. Remote Sens. Environ. 2003, 87, 283–294. [Google Scholar] [CrossRef]
  50. Crawford, B.; Christen, A. Spatial Source Attribution of Measured Urban Eddy Covariance CO2 Fluxes. Theor. Appl. Climatol. 2015, 119, 733–755. [Google Scholar] [CrossRef]
  51. Tatai, Z.; Bódi-Nagy, A.; Orosz, I.; Becsák, P.; Pető, Z.; Szabó, K. Sustainable Energy and Climate Action Plan of Budapest 2030; Budapest Főváros Városépítési Tervező Kft.: Budapest, Hungary, 2021. [Google Scholar]
  52. Mckinney, L.V.; Nielsen, L.R.; Hansen, J.K.; Kjaer, E.D. Presence of Natural Genetic Resistance in Fraxinus Excelsior (Oleraceae) to Chalara Fraxinea (Ascomycota): An Emerging Infectious Disease. Heredity 2011, 106, 788–797. [Google Scholar] [CrossRef]
  53. SiteViewer 3.0. 2025. Available online: http://www.ertigis.hu/siteviewer.htm (accessed on 10 March 2025).
  54. Nowak, D.J.; Greenfield, E.J. The Increase of Impervious Cover and Decrease of Tree Cover within Urban Areas Globally (2012–2017). Urban. For. Urban. Green. 2020, 49, 126638. [Google Scholar] [CrossRef]
  55. Emilsson, T.; Ode Sang, Å. Impacts of Climate Change on Urban Areas and Nature-Based Solutions for Adaptation; Springer: Cham, Switzerland, 2017; pp. 15–27. [Google Scholar] [CrossRef]
  56. Ossola, A.; Lin, B.B. Making Nature-Based Solutions Climate-Ready for the 50 °C World. Environ. Sci. Policy 2021, 123, 151–159. [Google Scholar] [CrossRef]
  57. Ordóñez Barona, C. Adopting Public Values and Climate Change Adaptation Strategies in Urban Forest Management: A Review and Analysis of the Relevant Literature. J. Environ. Manag. 2015, 164, 215–221. [Google Scholar] [CrossRef]
  58. Lloyd, G.; Ossola, A.; Burley, H.; Evans, K. Climate Change Threatens Carbon Storage in Europe’s Urban Trees. Urban. For. Urban. Green. 2024, 101, 128532. [Google Scholar] [CrossRef]
  59. Fontaine, L.C.; Larson, B.M.H. The Right Tree at the Right Place? Exploring Urban Foresters’ Perceptions of Assisted Migration. Urban. For. Urban. Green. 2016, 18, 221–227. [Google Scholar] [CrossRef]
  60. Conway, T.M.; Vander Vecht, J. Growing a Diverse Urban Forest: Species Selection Decisions by Practitioners Planting and Supplying Trees. Landsc. Urban. Plan. 2015, 138, 1–10. [Google Scholar] [CrossRef]
  61. Pouyat, R.; Russell-Anelli, J.; Yesilonis, I.D.; Groffman, P.M. Soil Carbon in Urban Forest Ecosystems. In The Potential of U.S. Forest Soils to Sequester Carbon and Mitigate the Greenhouse Effect; CRC Press: Boca Raton, FL, USA, 2002; p. 16. ISBN 9780429137020. [Google Scholar]
Figure 1. Study area, with the Buda side represented in blue and the Pest side in orange. (Cultural forests meaning extensively managed introduced forests).
Urbansci 09 00137 g001
Figure 2. Climatic conditions of the Buda and Pest sides of Budapest, based on the National Forestry Database (NFD) climate classification and climate classifications from the SiteViewer 3.0 (2025) decision support tool, under the RCP4.5 scenario for the 2011–2040 reference period. Climate categories are defined by indicator tree species.
Urbansci 09 00137 g002
Figure 3. Methodological flowchart of the study.
Urbansci 09 00137 g003
Figure 4. Carbon stock distribution of forests under FMP across different age classes in the Buda and Pest sides of Budapest. (Carbon stock values are expressed in tons of carbon, tC).
Urbansci 09 00137 g004
Figure 5. Carbon sinks (negative values) and emissions (positive values) of urban forests under FMP in Budapest, categorized by tree species groups and presented separately for the Buda and Pest sides.
Urbansci 09 00137 g005
Figure 6. Carbon stock of urban forests under FMP in Budapest in 2020, categorized by tree species groups and presented separately for the Buda and Pest sides.
Urbansci 09 00137 g006
Figure 7. Average annual carbon stock change of above- and below-ground biomass at the sampling points of the 100 × 100-m grid. Positive values indicate net carbon emissions, while negative values represent carbon sequestration.
Urbansci 09 00137 g007
Figure 8. Carbon stock of above- and below-ground biomass at the 100 × 100 m sampling grid points for the year 2020.
Urbansci 09 00137 g008
Figure 9. Urban forests under forest management planning (FMP), represented in brown based on NFD data, and other urban areas with tree cover, shaded in various green colors to indicate tree cover density, based on TCD2018.
Urbansci 09 00137 g009
Figure 10. Carbon stock values by tree cover density classes, calculated based on NFD data for areas under FMP within Budapest, separately for Buda and Pest.
Urbansci 09 00137 g010
Figure 11. Estimated carbon stocks of urban trees not under FMP, categorized by tree cover density groups, separately for Buda and Pest in the 2018 reference year.
Urbansci 09 00137 g011
Figure 12. Estimated annual changes in carbon stock of urban trees not under FMP by tree cover density groups, separately for Buda and Pest.
Urbansci 09 00137 g012
Figure 13. Overview of carbon dynamics and stock in urban forests across Budapest. Left: Average annual carbon sink, harvested timber (HWP) carbon stock, and substitution effects for Buda, Pest, and the entire Budapest area. Right: In situ carbon stock of urban forests and trees in Buda, Pest, and the entire Budapest area.
Urbansci 09 00137 g013
Figure 14. Validation results based on the global forest above-ground carbon stocks and fluxes dataset from GEDI and ICESat-2, as reported by Ma et al. [23]. Above-ground carbon fluxes (left) and stocks (right) for the Budapest area are presented, comparing findings from this study and Ma et al. [23].
Urbansci 09 00137 g014
Table 1. In situ carbon sink and stock data, along with annual carbon sequestration values, energy substitution effects, and carbon content of harvested timber.
BudaPestBudapest
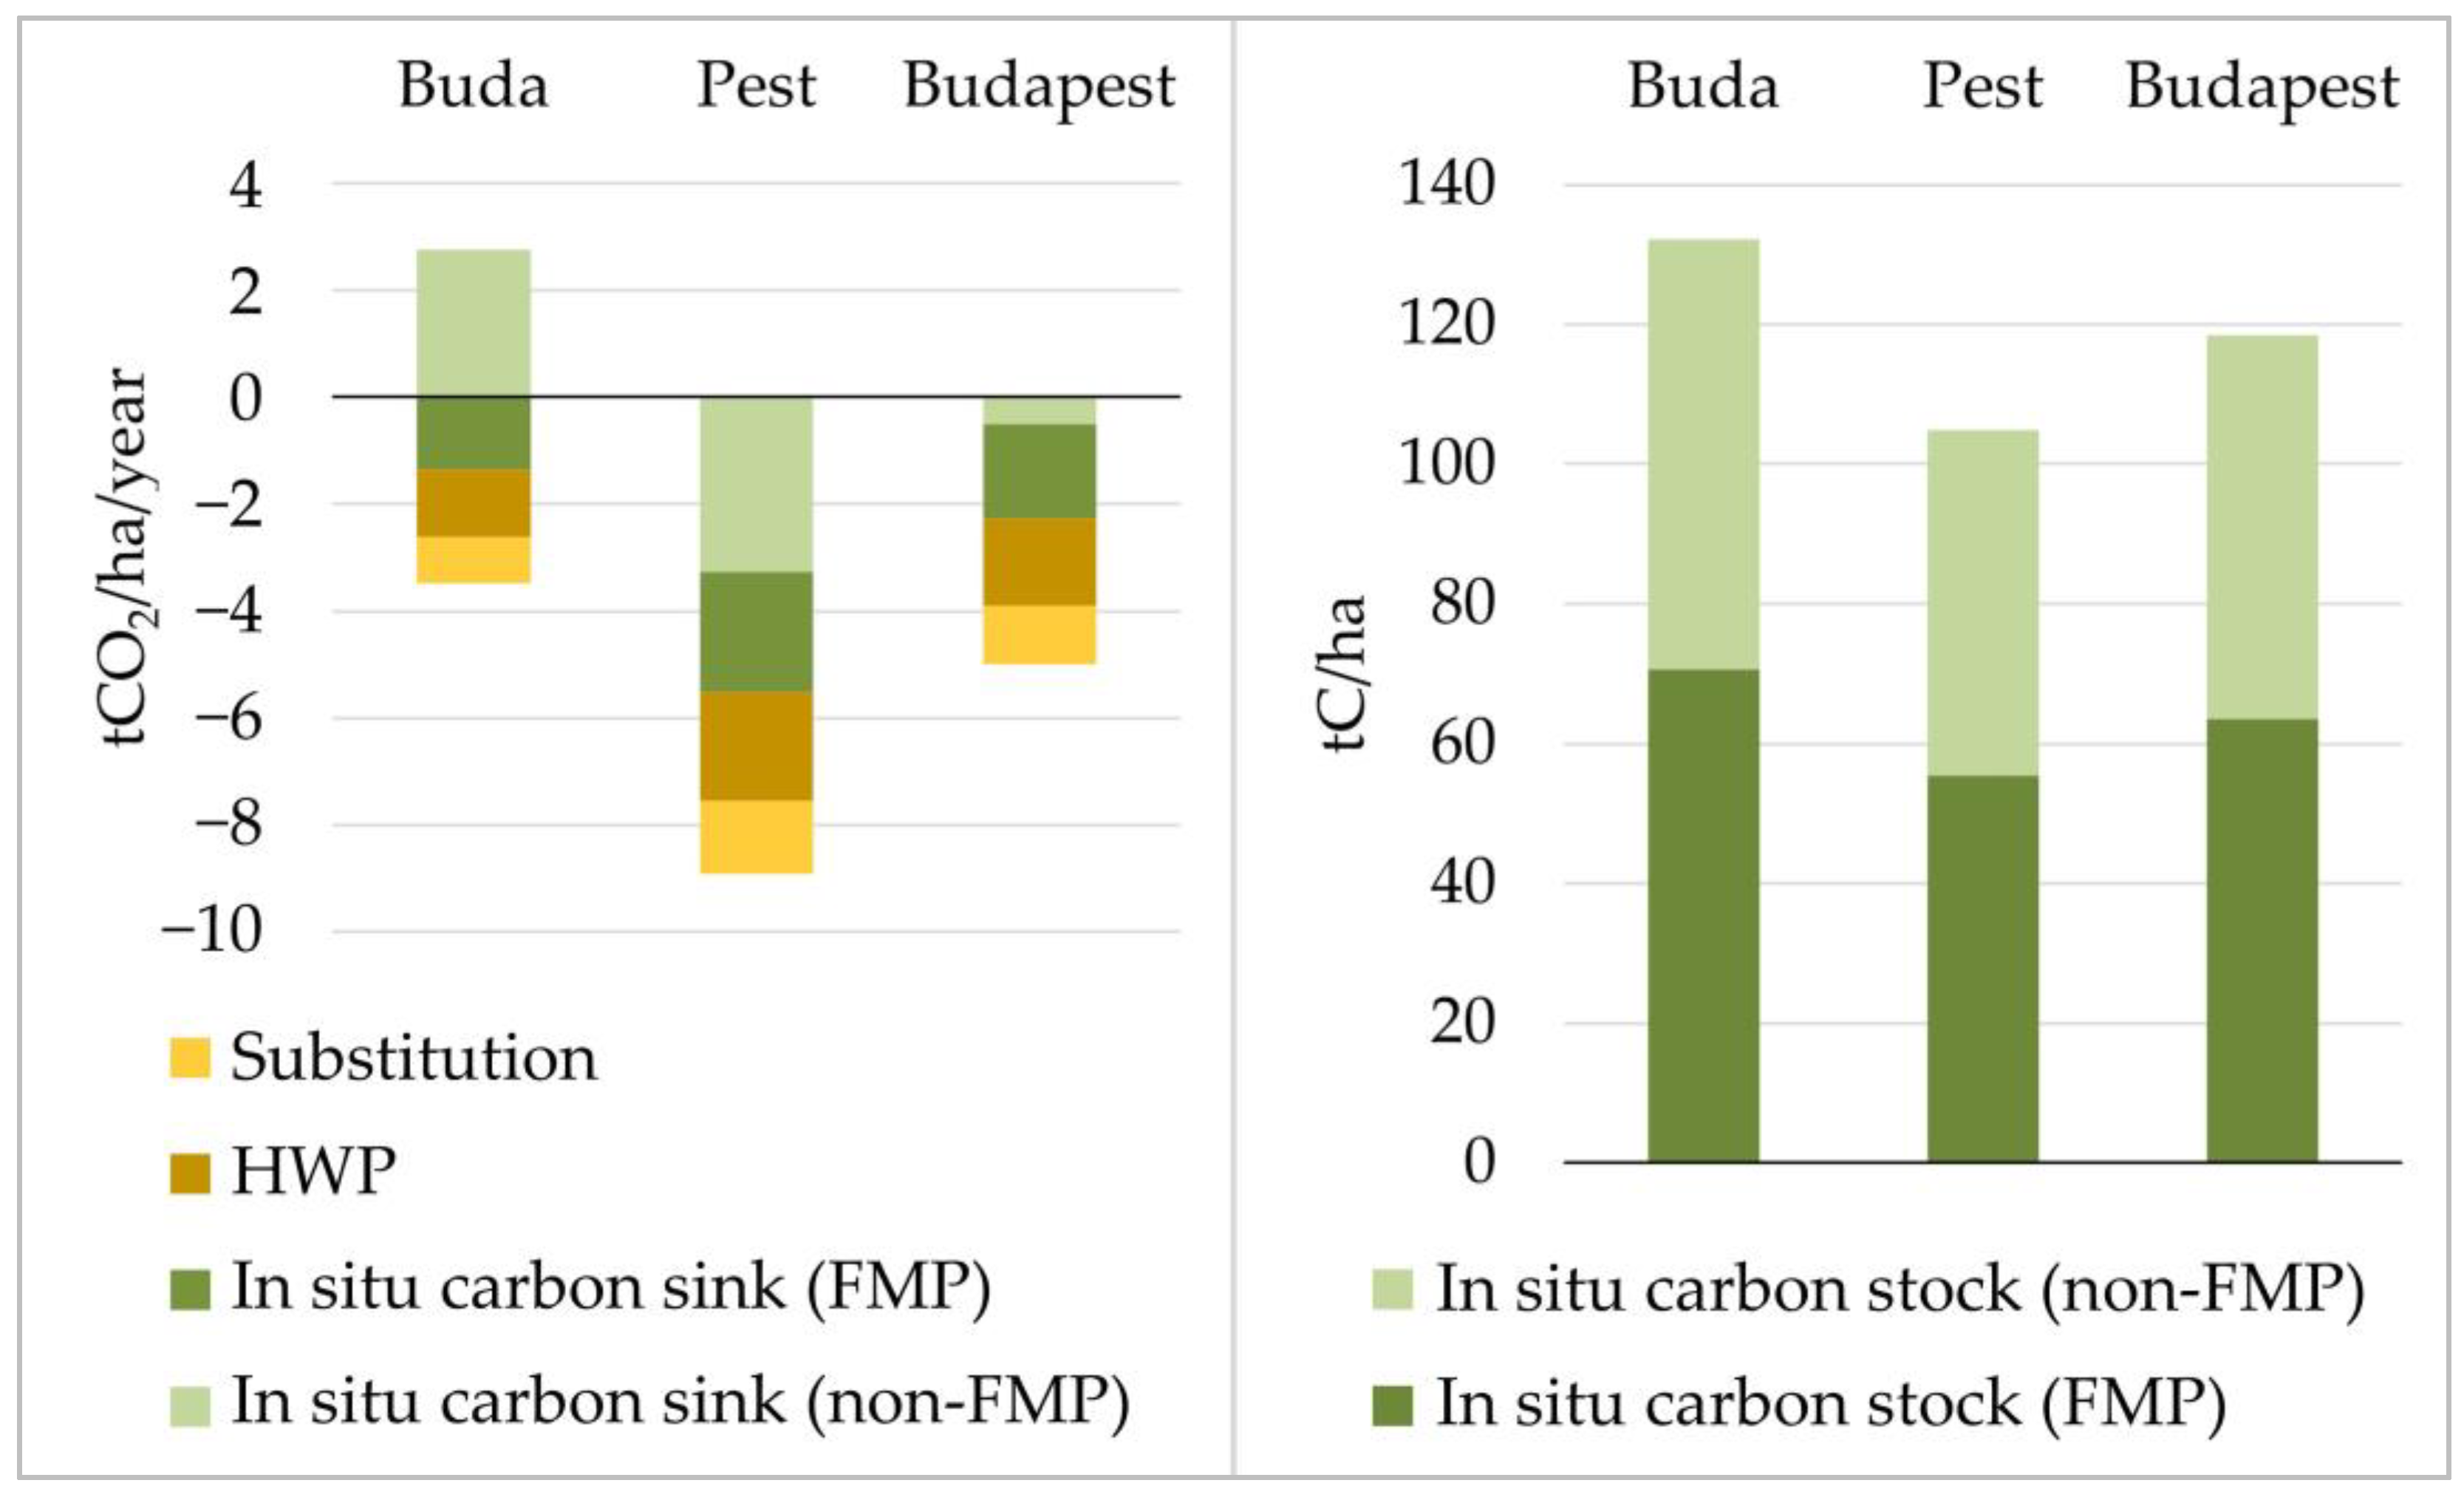
In situ carbon sink of urban trees not under FMP (tCO2/ha/year)2.8−3.3−0.5
In situ carbon sink of urban forests under FMP (tCO2/ha/year)−1.3−2.2−1.8
Average carbon stock of harvested timber (tCO2/ha/year)−1.3−2.0−1.6
Average energy substitution effect (tCO2/ha/year)−0.9−1.4−1.1
In situ carbon stock of urban trees not under FMP (tC/ha)61.649.455.0
In situ carbon stock of urban forests under FMP (tC/ha)70.655.463.5
Disclaimer/Publisher’s Note: The statements, opinions and data contained in all publications are solely those of the individual author(s) and contributor(s) and not of MDPI and/or the editor(s). MDPI and/or the editor(s) disclaim responsibility for any injury to people or property resulting from any ideas, methods, instructions or products referred to in the content.

