Article

Multimodal Approach of Improving Spatial Abilities

1
Institute of Mathematics and Computer Science, Eszterházy Károly Catholic University, Eszterházy sqr. 1, 3300 Eger, Hungary
2
Faculty of Informatics, University of Debrecen, Kassai 26, 4028 Debrecen, Hungary
*
Author to whom correspondence should be addressed.
These authors contributed equally to this work.
Multimodal Technol. Interact. 2024, 8(11), 99; https://doi.org/10.3390/mti8110099
Submission received: 30 September 2024 / Revised: 21 October 2024 / Accepted: 30 October 2024 / Published: 7 November 2024
(This article belongs to the Special Issue Multimodal Interaction in Education)

Abstract

:
Spatial abilities, which are sources of our capacity to understand visual and spatial relations among objects, as well as the abilities to generate, retain, retrieve, and transform well-structured visual information are important in several scientific fields and workplaces. Various tests have already been prepared to measure these abilities, including the Mental Cutting Test, which is considered the golden standard of measurement. However, much less attention is paid to how to prepare students for this test, as well as how to develop these skills most effectively. The purpose of this research is to study the multimodal approach of improving these skills and its effectiveness, i.e., the mixed use of 2D tools similar to the paper-based test, and 3D tools, including augmented reality and web-based interfaces in training students for those kinds of tasks. We want to demonstrate and prove with tests that multimodal modes of training can significantly affect the effectiveness of developing these skills. Moreover, through appropriately combining these methods, they can reinforce each other to form a multimodal approach, which is the most effective way for developing spatial skills and improving students’ performance related to the Mental Cutting Test.

Graphical Abstract

1. Introduction

Spatial abilities and spatial intelligence are essential in many areas of life. The benefits of spatial skills have been well evidenced in a wide variety of science, technology, engineering, and mathematics fields, even if the correlation is of a varying level [1,2]. However, in addition to science and STEM subjects, spatial abilities can also fundamentally influence our everyday life. For example, underdeveloped spatial competencies, involving the manipulation and storage of visuospatial information, may negatively affect our capacity to drive safely [3]. Even in medical treatments and studies, well-developed spatial skills play a significant role, for example, in terms of understanding of a medical case at the anatomical level [4]. Spatial abilities are usually considered as a collection of various specific skills for spatial perception, spatial visualization and orientation, mental folding, mental cutting and mental rotation (see, e.g., [5,6,7,8,9]). The development of these skills is a challenging task overall, which may require various tools in different pedagogical situations. As observed by mathematical factor analysis, the dominant factor of spatial ability tests is spatial visualization [10]. As noted in [11], the name of this factor adequately describes that people literally “visualize” to solve items on these tasks and tests, that is, they construct mental images of the objects shown in them. Various classical tests have become standard tools for measuring this skill over several decades. An example is the Mental Rotation Test [12], where a possible rotation of a spatial shape must be recognized and selected. Another test, which is of central importance from the point of view of the present research, is the Mental Cutting Test, where the planar section of a 3D shape must be recognized and selected from the possible answers (see Figure 1).
The development and measurement of spatial abilities are also essential aspects of many university study programs and courses. While our primary goal is to develop and improve spatial skills, we must of course also consider the need of students to pass these specific tests. To do this, we need to examine (and this question is also the focus of this article) the methods by which we can most effectively improve these skills and prepare students for these exam tests. In this research, we developed a learning environment where, on the one hand, a very large number of automatically generated tasks help the development of these skills and the preparation for the test. On the other hand, these tasks can be approached using various visualization methods. Our research question was how this learning environment can be used most effectively for the development of spatial competences, i.e., what combination of technological and methodological tools results in a greater development of these skills. We will argue that the most effective way to do this is through a multimodal technology approach, i.e., a combination of a traditional 2D visualization method, analogous to the paper-based test tasks; interactive computer-based visualization, where students are able to rotate the 3D body on the screen; and augmented reality-based methods, where students can virtually walk around a shape. Our core hypothesis is that the test group using multimodal devices will show a significantly greater improvement in the development of spatial competences than the groups that were trained and tested either only with 2D devices or only with 3D devices. The effectiveness of the multimodal approach is approved within the framework of a testing and practice program, the outcome of which is analyzed statistically in this article. The structure of the paper is as follows. In Section 2, we discuss the Mental Cutting Test and the recently developed supporting tools, including our automatic task generator. In Section 3, the multimodal approach and its educational aspects are presented. Our methodology is described in detail in Section 4. The results, including the statistical analysis of the tests performed, are discussed in Section 5. Finally, the conclusion and the discussion of future research challenges close this paper in Section 6.

2. Assessing Spatial Skills: The Mental Cutting Test

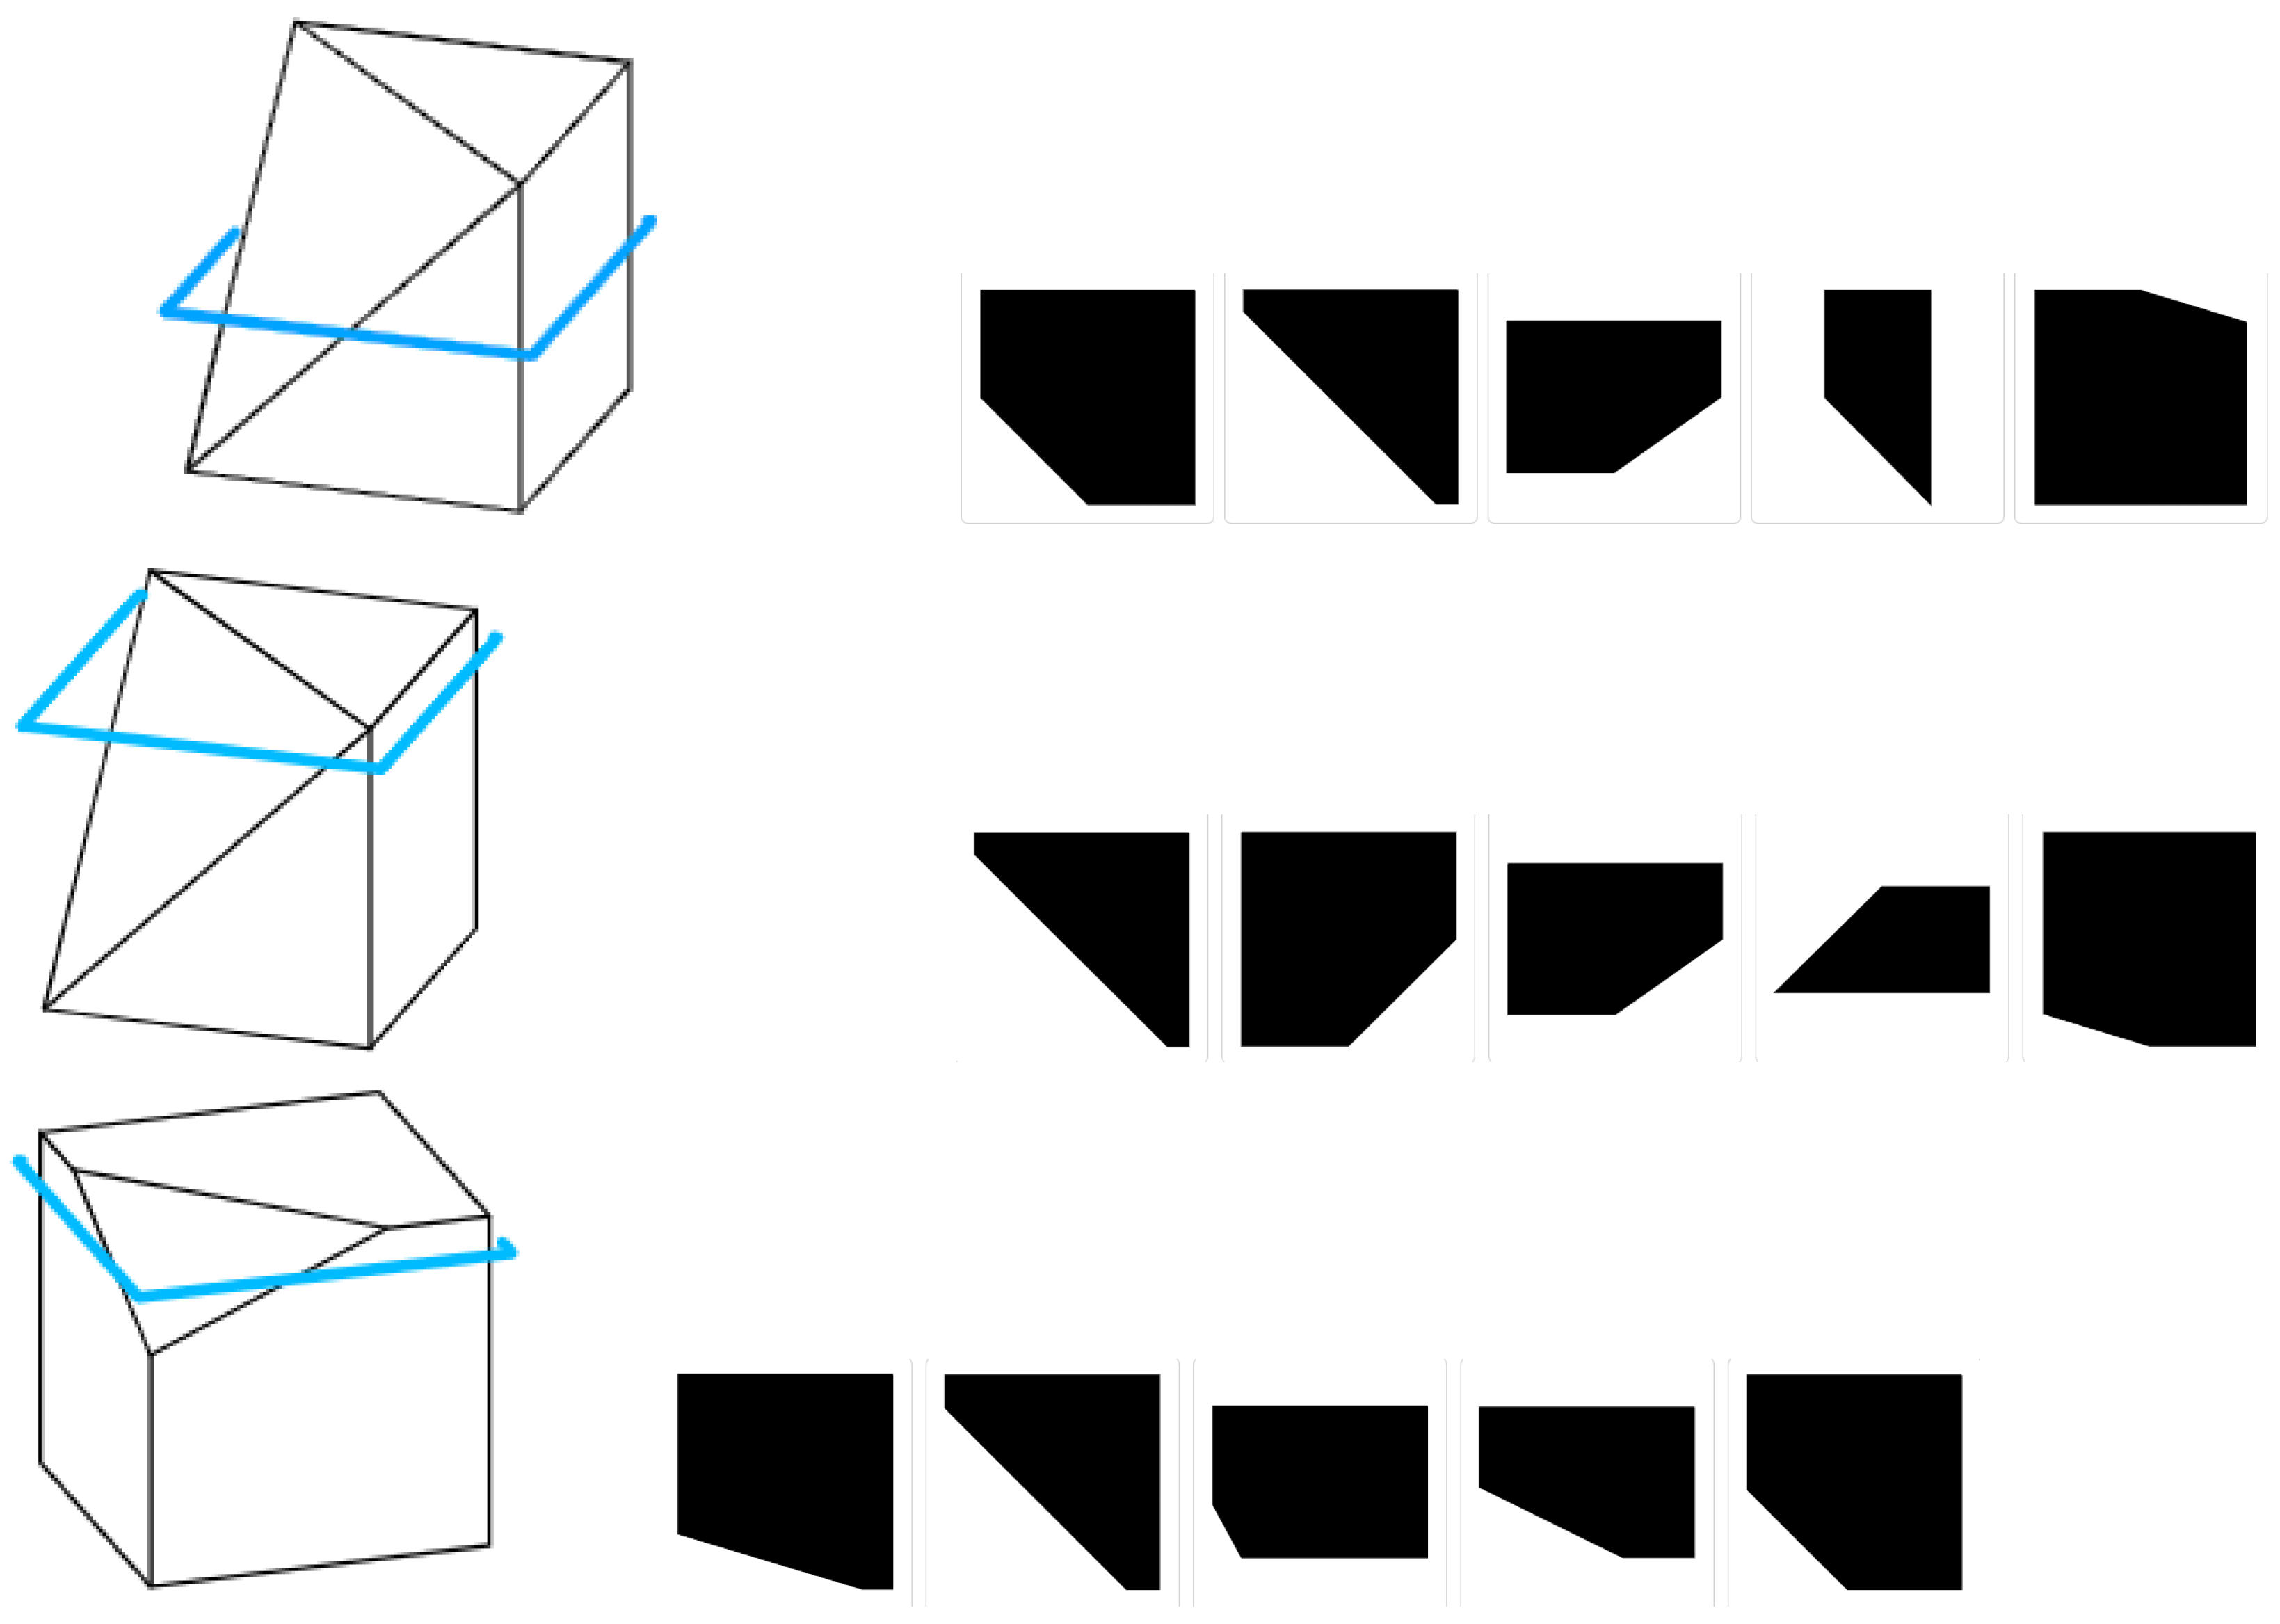
There are various standard tests that can be used to measure spatial abilities. Different tests measure different aspects and factors of spatial intelligence (for a detailed discussion, see [13,14]). The two classical tests are the Mental Rotation Test (MRT) [12] and Mental Cutting Test (MCT) [15], but there are also other tests, such as the Urban Layout Test (ULT), Indoor Perspective Test (IPT) and Packing Tests (see [13]). Various combinations of these tests are also present. Among these tests, the Mental Cutting Test is one of the most frequently applied standard tests for various tech universities, and it is also used as an exam test. In the tasks of this test, an axonometric 2D image of a spatial model, usually a truncated cube, and the position of an intersecting plane are presented. Students must select the correct planar section of the model from five potential answers as planar figures (see Figure 1 and Figure 2).
Several papers studied the outcome of these tests in various contexts (see, e.g., [16,17] and references therein). Previous results revealed strong individual differences [18] as well as gender differences in MCT and other spatial ability test outcomes [13,19,20,21]. It is also interesting to observe which of the four possible wrong answers the person giving the wrong answer has chosen. These answers are not “equally incorrect”; some differ from the correct answer only in the small proportions of their sides or angles (compare, for example, the correct answer 1 and the wrong answer 2 in the upper row of Figure 2), while others are morphologically or even topologically different (see answer 4 in the same row), which is obviously a worse, “even more incorrect” answer. Typical mistakes have been studied, e.g., in [22].

3. Media and Technology Support of Training and Testing: The Multimodal Approach

For several decades, classic technological tools and support were used for the above-mentioned tests and their preparation. Paper-based, 2D tasks were applied, which were sometimes assisted by human-built, real 3D models. However, our experience has shown that traditional, paper-based tools have limited potential to improve these skills, partly because the number of available tasks is limited. As recently reported, one of the most significant barriers is the lack of access to tasks; researchers revealed substantial difficulty in gaining access to existing paper-based tests and tasks [23]. State-of-the-art technology, including virtual and augmented reality tools, can evidently improve this situation, although this is not necessarily effective for every test. In the case of some tests, the opportunity to walk around provided by virtual reality makes the test practically meaningless. An example of this is the Indoor Perspective Test. With the introduction of these new technologies, people may move too far from the classical tests that measure spatial abilities in the traditional way, which can cause problems in the test phase, such as the university entrance exam. In fact, one of the crucial goals is to enable students to prepare effectively for these tests. To overcome these issues, our research group created an automatic MCT task generation algorithm and Mental Cutting Test Task Generator and Repository [24]. This task generation algorithm uses the same bodies as the original test, but by changing several of their parameters (e.g., the degree of the notch) and by changing the position of the cutting plane, it can generate practically thousands of various MCT tasks (see Figure 2). These tasks are multiplied by keeping the only correct answer as it is, but altering and randomizing the potential wrong answers for the same body and cutting plane, for example, by using affine transformations, rotations, etc. Moreover, this task generator is connected to a user interface intended for practice, called ViSkillz, where the users can test their knowledge on these tasks [25]. The interface can display the body itself in an axonometric 2D view (as it appears in the original test), a rotatable 3D view, and, through an application, also in augmented reality mode. The positive effect of this framework can further be reinforced by gamification [26], although this aspect is not studied and applied in the current research. The multimodal approach to education is an emerging field, and in recent years, it has received an extreme emphasis on the development of skills where traditional tools prove to be insufficient (see, e.g., [27,28]). Multimodal education includes teaching methods that engage multiple sensory systems simultaneously, typically applying multiple modes or methodologies to teach a concept or to develop a skill, including various visual modes and techniques. As we have mentioned above, for many decades, spatial skills have been developed and measured in an unimodal manner through planar drawings and paper-based tests, perhaps occasionally including real spatial models (made of paper, wood, or metal). The crucial challenge of multimodal spatial skill development is how we can transform the new technology into the development process of spatial abilities. The primary goal is to map the optimal and effective combination of paper-based methods, web-based tools, and VR- and AR-based techniques to create a truly multimodal approach to skill development and measurement. The various ways of using virtual and augmented reality tools are prominent aspects of this multimodal approach. However, as noted by [28], “despite VR’s growing accessibility, its integration into educational settings remains in the preliminary stages, particularly in higher education, where traditional methods still dominate”. Virtual and augmented reality proved to be an effective support of educational tasks in various fields of mathematics, from functions to 3D transformations [29,30,31,32,33,34]. It has also been involved in developing spatial abilities; for a thorough review, see [35]. As noted, while VR and AR tools can increase student interest and enhance self-learning, the lack of AR-related teaching material can hinder this process. Moreover, Virtual Reality requires a special set of tools, which is also relatively expensive. Moreover, previous studies referred to VR-induced health symptoms and effects, involving nausea, dizziness, disorientation, postural instability, and fatigue [36]. Therefore, we did not use this option in our study. Our opinion is that the exclusive use of AR/VR tools can also yield a biased view of these tasks and skills. Studying the methodological use of augmented reality and virtual reality, we are often faced with the fact that researchers frequently use these tools exclusively, which ultimately leads to the same unimodal approach as when we only provided 2D paper-based tests and tasks to students [37,38,39]. Moreover, it is observed that during the exclusive use of extended reality tools in the education process, certain cognitive overload was suggested to arise, and finally, in some cases, the mental effort was lower for students studying with augmented reality compared to students learning with traditional paper-based and multimedia material [38]. Therefore, the main focus of our research was the development of a genuinely multimodal practicing framework, including 2D (similar to paper-based), interactive 3D (allowing rotation of the object), and augmented reality tools (see Figure 3), that can significantly improve the test results of measuring spatial skills.

4. Methodology

Between February 2023 and September 2024, we conducted a large-scale study and survey at the IT faculties of the University of Debrecen and Eszterházy Károly Catholic University. A total of 557 first- and second-year students (319 Computer Science, 129 Computer Science Engineering, and 109 Business Informatics students) submitted valid answers to the tests. The test population was divided into three large groups, and the performance of all three groups was evaluated in two separate tests (denoted by Test 1 and Test 2 in the analysis). The first of the three groups (control group) received the tasks in a traditional way, similar to the classic paper-based test, with 2D visualization (3rd option in Figure 3), and could only practice with tasks visualized in this way between the two tests. We marked them with a ‘2D’ label in the statistical analysis. The second group was able to use 3D visualization (rotatable 3D view, second option of Figure 3) already during the two tests and also during practice, with an additional augmented reality option (1st option of Figure 3). They were marked with a ‘3D’ label in the statistical analysis. Note that this group did not face the challenge of making decisions based solely on 2D images during the test. This is, of course, clearly visible in the results achieved on the first test (Test 1), which were significantly better than the other two groups who had to solve the classic 2D test. Finally, the third test group had to complete the two tests with a 2D visualization similar to the traditional test (3rd option in Figure 3), but in the practice period between the two tests, they could also practice on classical 2D tasks as well as on augmented reality and web-based presentation of tasks that enabled a rotatable 3D view (all three options of Figure 3). This group was denoted by ‘2D+3D’ in the statistical analysis. Thus, this group could use the full spectrum of our multimodal approach, while in the test phase, their performance measurement was completely identical to the classical method. For ease of use, all these options have been integrated into a single application, called ViSkillz [25]; see Figure 3. All three groups, regardless of the visual representation of the test items and the method of practice, completed the same test. To evaluate the internal reliability of the test, we calculated Cronbach’s alpha coefficient, which yielded a value of 0.94. This high coefficient indicates excellent reliability for the questions. This also demonstrates strong internal consistency among the test items, confirming that the test is suitable for assessing the targeted skills [40]. Our hypothesis was that compared to the first (2D, control) and third (2D+3D) groups, who therefore completed the tests in a traditional way (in 2D), the second (3D) group would perform much better on the first test because they can use 3D visualization. Overall, the third group (2D+3D) will experience the greatest progress in terms of spatial abilities due to the multimodal approach. In the first week of the semester, we visited lectures of our 1st- and 2nd-year students and asked them to complete the recently mentioned test in the ViSkillz application. The test consisted of 10 tasks, each worth 1 point for a correct answer and 0 points for a wrong answer. Each task had exactly one correct answer. The three groups were randomly selected, and we used a random code ensuring anonymity. The most important data of the test conditions were the following:
  • The test starts with a short explanation of MCT.
  • The test consists of 10 exercises (maximum score is 10).
  • The 2D viewer is available to all the users, while the 3D viewer is available only to the second group (3D).
During the practicing period, regular 2D tasks were available for the first (‘2D’) group, tasks with a 3D viewer and augmented reality were available for the second (‘3D’) group, and multimodal practicing tools were available for the third (‘2D+3D’) group. After the practicing period, in the second part of the test phase, the test was repeated under the same conditions as the first one.

5. Results

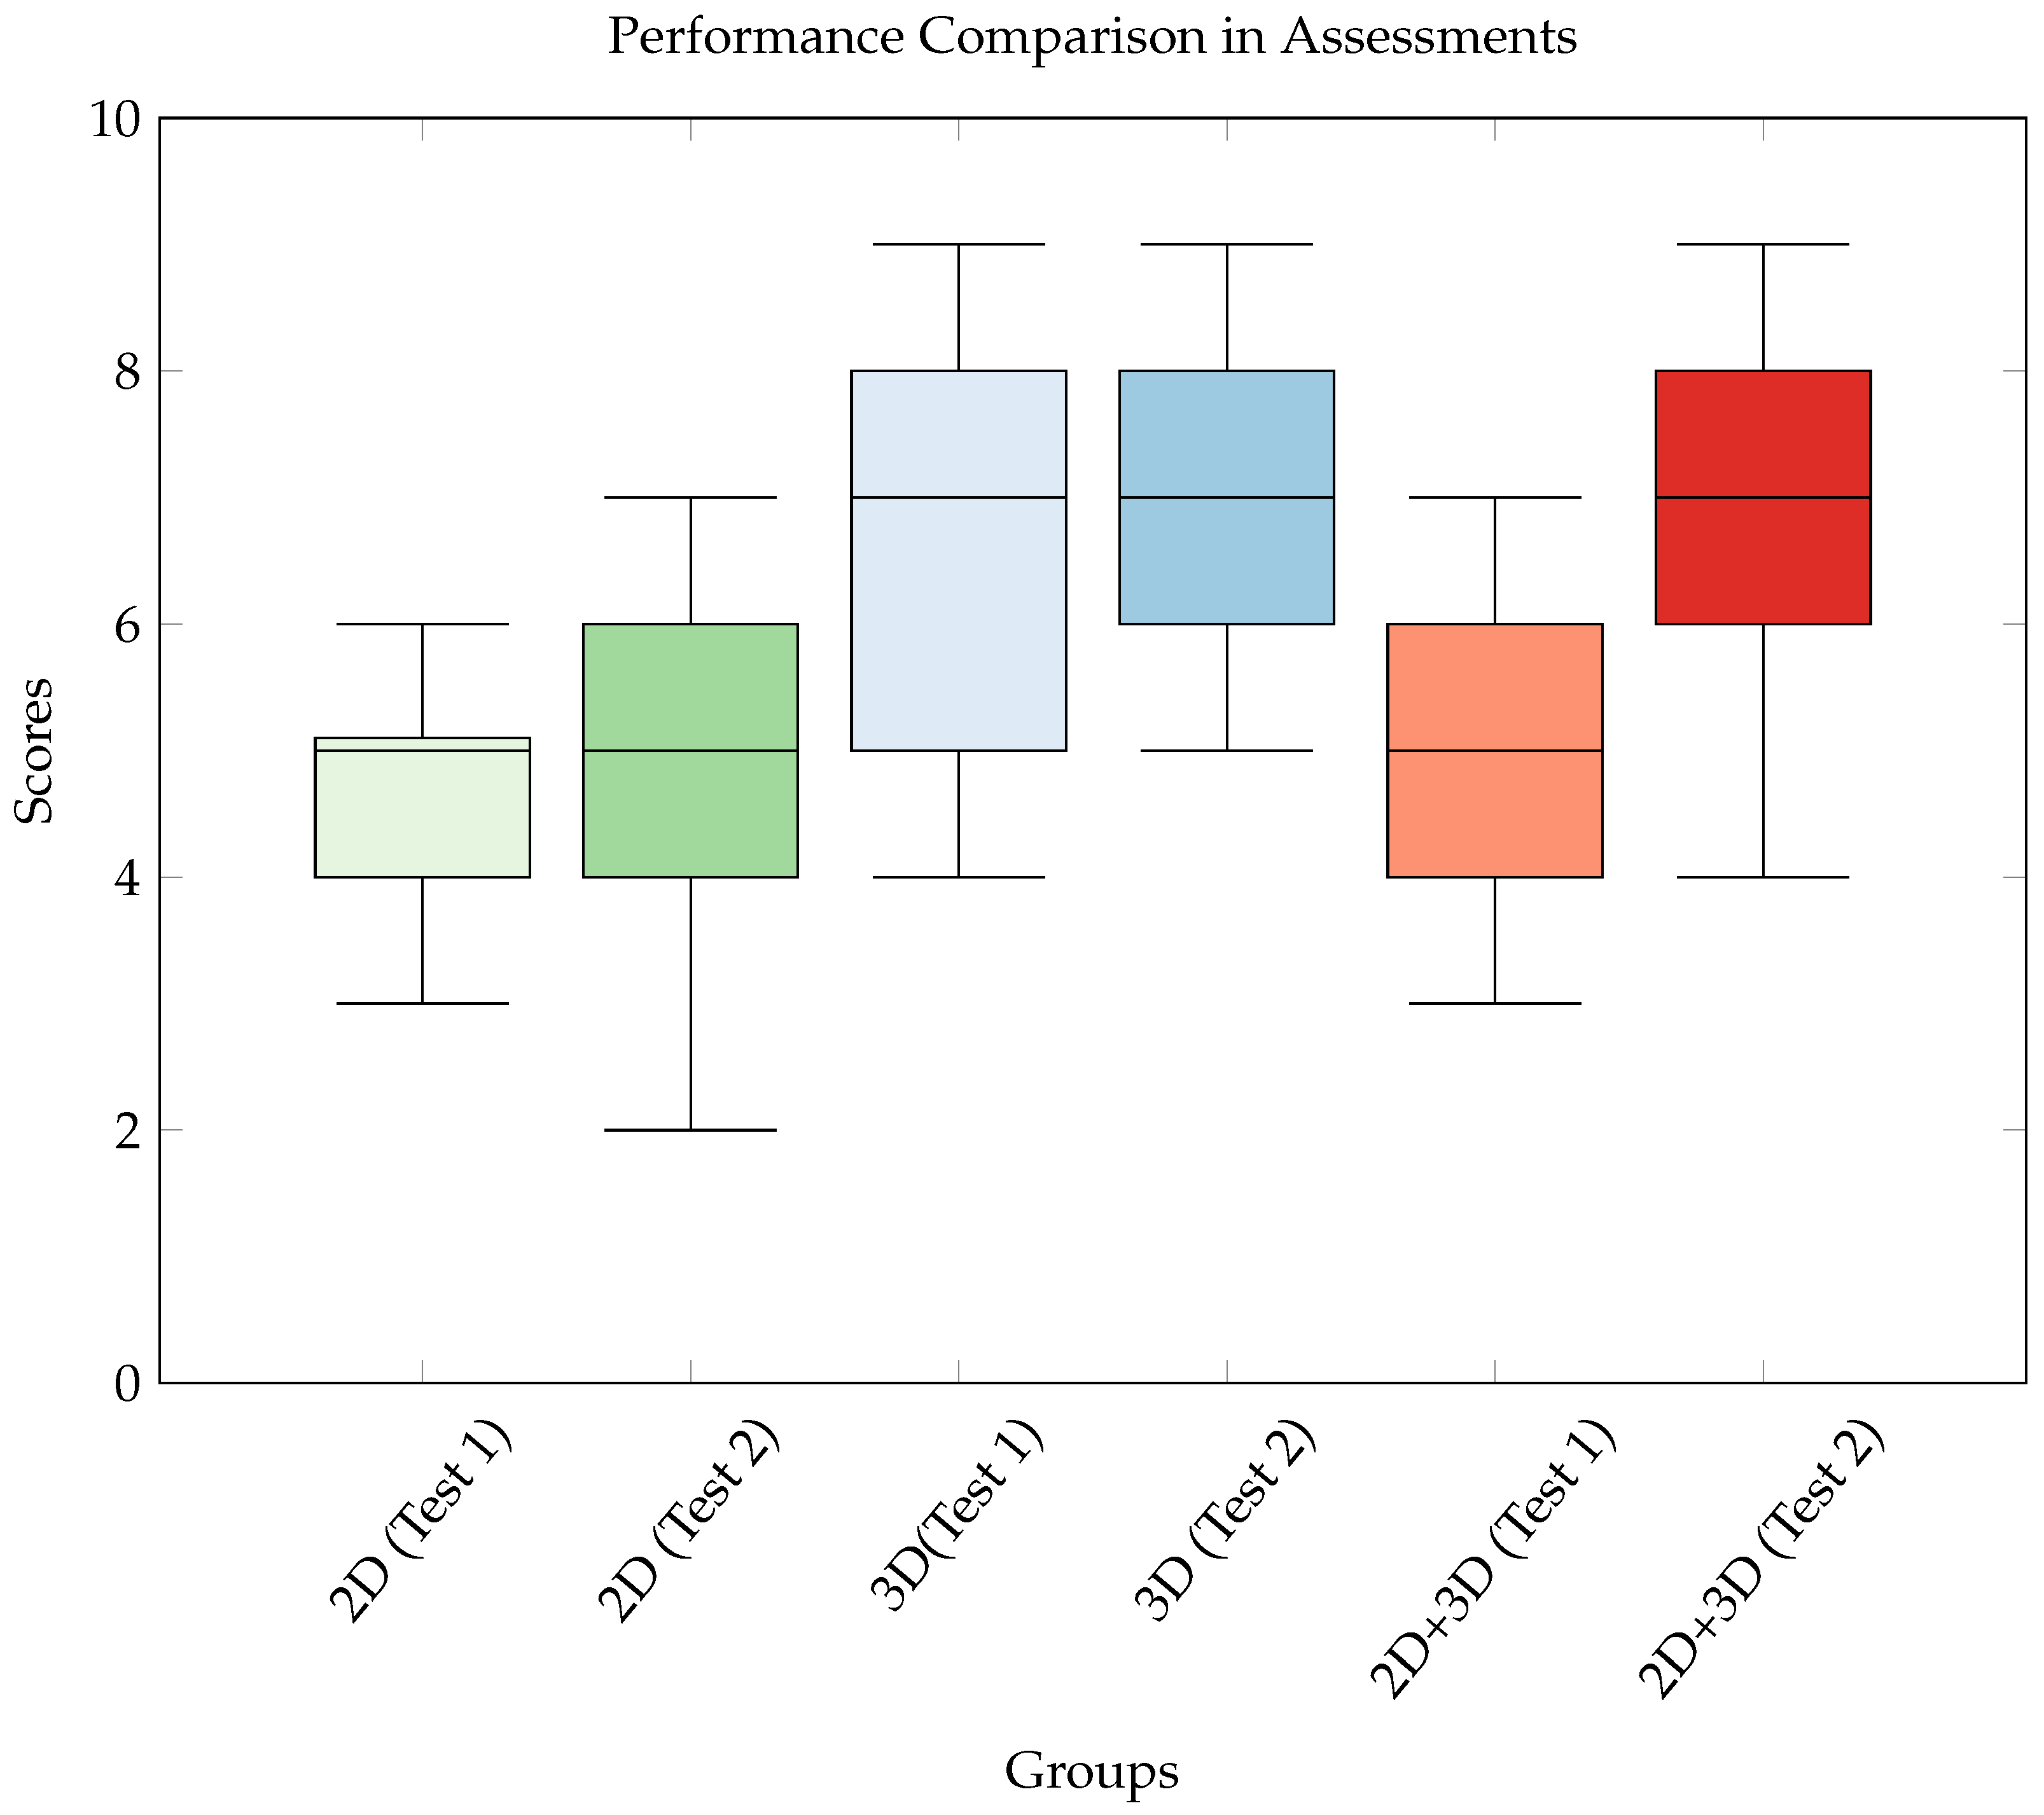
The results from the two assessments for the 2D, 3D, and 2D+3D groups are summarized in Table 1 and visualized as a box plot in Figure 4. The first assessment provides a baseline for each group, while the second assessment, conducted after an intervention, shows the observed changes.
The 2D group exhibited a minor improvement between the two assessments, with the mean score increasing from 3.43 to 3.64, but with the same median score of 5. The standard deviation (1.24 and 1.34, respectively) suggests a relatively consistent level of variability in the group, with no significant shift in the range of scores. The results for the 2D group did not show a statistically significant improvement between the first and second assessments (p > 0.05). This indicates that the traditional 2D approach may be less effective in improving spatial reasoning skills compared to applying the more immersive 3D and augmented reality tools. This is consonant with the preceding results. Previous studies have similarly found that limited visual perspectives in 2D environments do not adequately challenge or enhance spatial cognition [41]. In contrast, the 3D group showed a substantial improvement, with the mean score rising from 5.00 in the first assessment to 6.30 in the second assessment. However, the median score 7 remained the same. The range expanded slightly, but more importantly, the decrease in the standard deviation from 1.96 to 1.49 indicates that the group’s performance became more consistent after the intervention. The improvement in both the mean and the reduction in variability suggests that the use of 3D tools had a positive effect on test performance. However, note that the results of the upper quartile and the best performance of students did not increase, which can be interpreted as this method no longer giving the best performers any further development opportunities. The 2D+3D group demonstrated the most significant improvement among the three groups. The mean score increased from 3.86 to 6.00, indicating that the combination of various 2D and 3D tools led to a significant improvement in performance. The median is also significantly increased from the level of the first (2D) group to the level of the second (3D) group. The standard deviation, which remained relatively stable (2.04 and 2.12, respectively), indicates that the spread of scores within this group did not significantly change. This means that every participant in this group could significantly increase their abilities, and the higher mean suggests that the intervention was highly influential in raising the group’s overall performance. The sample size for each group was adequate to ensure reliable statistical conclusions. The data exhibited a normal distribution, which was verified using the Shapiro–Wilk test [42]. This justified the use of the paired t-test to compare the scores between the first and second assessments. To evaluate whether these improvements were statistically significant, a paired sample t-test was conducted for each group to compare the results of the first and second assessments.
  • 2D Group: The increase in the mean score from 3.43 to 3.64 was not statistically significant, with a p-value > 0.05. This suggests that the observed change was likely due to random variation and not the result of any effective intervention.
  • 3D Group: The improvement in the mean score from 5.00 to 6.30 was statistically significant (p-value < 0.05), indicating that the use of 3D tools had a meaningful impact on the group’s performance. Additionally, the reduction in standard deviation suggests that the intervention was particularly useful for those who underperformed in the first test, and this method not only improved scores but also led to more uniformity in performance across participants.
  • 2D+3D Group: The increase in mean score from 3.86 to 6.00 was also statistically significant (p-value < 0.05). The multimodal combination of 2D and 3D tools appears to be the most effective intervention among the three groups, leading to a substantial improvement in each participant’s overall performance, while the scores’ spread remained similar.
In the initial analysis, we conducted paired t-tests to assess within-group changes between the first and second assessments. While this approach is appropriate for examining within-group improvements, it does not fully address whether there are statistically significant differences among the groups. Based on the results of the Levene and Bartlett tests, which indicated that the variances were homogeneous (p > 0.05), we proceeded with the ANOVA as the most appropriate statistical method [43]. ANOVA provides a robust framework for simultaneously comparing the means of multiple groups, determining whether observed differences are attributable to random variation or represent true disparities between groups. This method is particularly crucial when comparing more than two groups, as conducting multiple t-tests increases the likelihood of type I errors (false positives), potentially leading to misleading conclusions. The F-statistic generated by the ANOVA reflects the variance ratio between group means to the variance within groups. A high F-value indicates that the differences between group means are more significant than what would be expected by chance. In our analysis, the F-value was significantly high (F = 8.91, p = 0.00058), suggesting meaningful differences among the group means. The p-value is well below the conventional significance threshold of 0.05, confirming that the differences between the groups are statistically significant. To further clarify which specific group pairs exhibited statistically significant differences, we also conducted a Tukey HSD (Honest Significant Difference) post hoc test. The results demonstrated that both the 3D and 2D+3D groups differed significantly from the 2D group, and a significant difference was also observed between the 3D and 2D+3D groups. This post hoc analysis reinforced the findings of the ANOVA, providing additional confirmation of the differences among the groups. A further statistical way to approve our hypothesis is the measurement of the progressive effect of the program in each group, for which a well-proven tool is Cohen’s d value [44]. Cohen’s d value is a measure of effect size that quantifies the difference between two data sets in terms of standard deviations. Cohen’s d value is the appropriate effect size measure if two groups have similar standard deviations and are of the same size, and this holds for our data sets; therefore, it can correctly be applied here. It is used to understand how much change has occurred due to an intervention. Cohen’s d values are generally interpreted as follows [44]:
  • Small effect: from d = 0.2 ;
  • Medium effect: from d = 0.5 ;
  • Large effect: d = 0.8 or greater.
The bar chart in Figure 5 illustrates each group’s mean differences and Cohen’s d effect size (2D, 3D, and 2D+3D). Cohen’s d values were calculated to measure the effect size of the interventions. This analysis aims to evaluate the effectiveness of different interventions on the test scores, particularly focusing on the 2D+3D group.
For the 2D group, the mean difference is only 0.07, with a minimal Cohen’s d value of 0.04. This suggests that there is practically no difference between the two test result sets. In contrast, the 3D group shows a more significant change. The mean difference is 1.5, and Cohen’s d value is 0.77, which corresponds to a medium effect size. This indicates that the use of 3D tools had a substantial impact on improving test scores. Finally, the 2D+3D group demonstrates the most significant improvement. The mean difference is 1.86, and Cohen’s d value is 0.81, which corresponds to a large effect size. The 2D+3D group exhibits the most considerable mean difference and the highest Cohen’s d value. This suggests that the combined, multimodal intervention is highly effective in improving test scores. The large effect size indicates that the multimodal method not only led to significant improvement compared to the other groups but also that this improvement is meaningful and robust across participants. Cohen’s d value in this context shows that the intervention had a substantial effect, making it a strong candidate for further use in similar contexts where enhancing performance is critical. In summary, the 2D+3D group showed the most remarkable effectiveness, with both the highest mean difference and the most significant effect size. This indicates that combining 2D and 3D visualization with various visualization tools leads to the most substantial improvement in test scores, providing clear evidence of the method’s success. The 3D group showed a medium effect (d = 0.77), while the 2D+3D group exhibited a significant effect (d = 0.81). According to Cohen’s benchmarks [44], these values suggest that both interventions had a meaningful impact on performance, but it is exceptionally high in the 2D+3D group, where the intervention led to substantial gains. All of this means that our working hypothesis has been confirmed; there is a significant positive difference in the degree of development of those students who were able to develop their spatial abilities armed with a multimodal technological education toolkit. This positive difference is somewhat obvious compared to traditional, two-dimensional paper-based practice, but perhaps surprisingly, the difference is also significant compared to those who used only 3D, augmented reality devices. This last figure once again underlines the fact that the use of the most modern tools, be it the arsenal of AR/VR tools, can significantly improve the understanding of spatial relationships, but cannot exclusively replace traditional methods and educational approaches. It is the combined, proportionate use of these technologies that can lead to the highest degree of development and improvement in spatial abilities.

6. Conclusions and Future Work

In our research, we investigated the multimodal technology that develops spatial abilities. The limited possibilities of traditional tests often provide insufficient opportunities for development, while these tests, especially the Mental Cutting Test, are crucial in students’ lives, as it is a standard measuring tool at several universities. That is why we have set ourselves the goal of providing students with multimodal options that will ultimately help them achieve significantly better results on the traditional test. After creating a multimodal technological framework, as a study control, we tested two groups who could only achieve traditional (2D) test tasks or, on the contrary, could use 3D tools (3D) already during the test phase. As the above statistical results prove, the multimodal group (2D+3D), which was measured on traditional 2D tests while they had the opportunity to use multimodal development tools during practice, showed significantly greater progress than the other two groups.
In summary, we can observe that neither traditional 2D tools nor software-based 3D tools, including augmented reality, are sufficient in themselves to develop spatial abilities with sufficient efficiency. For this, as we have seen, multimodal education is the most suitable approach. Compared to previous approaches, our research is, on one hand, a significant advance in the amount of background material (test items) and the technical implementation of its multimodal presentation. Several previous studies have examined the introduction and impact of extended reality in the development of spatial skills, but it has been proven that the lack of resources of sufficient quality, especially in the XR environment, significantly reduces the profitability of these methods. As is noted, these problems may arise when students request more XR learning materials to support their studies, while teachers have insufficient knowledge in programming and computer-aided design to satisfy this request [35,45]. With our approach, hundreds of new tasks can be generated in a simple way. On the other hand, we have applied a multimodal approach compared to those where XR tools are applied exclusively. As mentioned above, the exclusive use of XR tools ultimately leads to the same unimodal approach as when we only provided 2D paper-based tests and tasks to students [37,38,39]. We have proved in this research that neither of the unimodal methods could yield the same efficiency in improving spatial skills as our multimodal approach. Of course, our approach also has its limitations. At first, there are various other tests with different types of tasks where this multimodal approach has to be tested, and its efficiency is not necessarily of the same level as in the case of MCT. Mental Rotation Tests would probably work in the same manner, but other tests may lose their significance if XR tools are incorporated into the practice phase. This aspect must be investigated in the upcoming period. A further limitation of this research is the relatively short period of evaluation. Future research should also consider further longitudinal studies to assess the sustainability of these gains. Additionally, further investigation into how different learner characteristics (e.g., prior spatial ability, learning preferences, gender) interact with these interventions and technologies could provide valuable insights for personalized learning approaches in the future. For this, a further technological step will be creating an adaptive test environment, which in turn requires the automatic classification of the degree of difficulty of the tasks, which is a real challenge in this context.

Author Contributions

Conceptualization, T.B., M.Z. and M.H.; methodology, T.B., R.T., M.Z. and M.H.; software, R.T.; validation, T.B., R.T. and M.H.; formal analysis, T.B., M.Z. and M.H.; data curation, T.B. and R.T.; writing—original draft preparation, T.B., R.T., M.Z. and M.H.; writing—review and editing, M.H.; visualization, T.B. and R.T.; supervision, M.H.; project administration, R.T. All authors have read and agreed to the published version of the manuscript.

Funding

This research received no external funding.

Institutional Review Board Statement

The study involved data collection from humans. The study was conducted in accordance with the Declaration of Helsinki, and approved by the Institutional Scientific Review Board and Ethics Committee of Eszterházy Károly Catholic University.

Informed Consent Statement

Informed consent was obtained from all subjects involved in the study.

Data Availability Statement

Student data are available on request from the corresponding author. Task data set is available at https://viskillz.inf.unideb.hu/resources/#/supporting/mdpi-mti-2024 (accessed on 30 October 2024).

Acknowledgments

We would like to thank our students who participated in the survey. Their contribution can help us develop the spatial skills of future generations even more effectively. We also thank Balázs Pintér for their technical help in developing the app.

Conflicts of Interest

The authors declare no conflicts of interest.

Abbreviations

The following abbreviations are used in this manuscript:
MCTMental Cutting Test
MRTMental Rotation Test
ULTUrban Layout Test
IPTIndoor Perspective Test
2DPlanar figure, and test with planar view of the task
3DSpatial figure, and test with spatial view of the task

References

  1. Verdine, B.N.; Golinkoff, R.M.; Hirsh-Pasek, K.; Newcombe, N.S.; Bailey, D.H. Links between spatial and mathematical skills across the preschool years. Monogr. Soc. Res. Child Dev. 2017, 82, 1–149. [Google Scholar]
  2. Atit, K.; Power, J.R.; Pigott, T.; Lee, J.; Geer, E.A.; Uttal, D.H.; Ganley, C.M.; Sorby, S.A. Examining the relations between spatial skills and mathematical performance: A meta-analysis. Psychon. Bull. Rev. 2022, 29, 699–720. [Google Scholar] [CrossRef] [PubMed]
  3. Anstey, K.J.; Horswill, M.S.; Wood, J.M.; Hatherly, C. The role of cognitive and visual abilities as predictors in the Multifactorial Model of Driving Safety. Accid. Anal. Prev. 2012, 45, 766–774. [Google Scholar] [CrossRef] [PubMed]
  4. Langlois, J.; Bellemare, C.; Toulouse, J.; Wells, G.A. Spatial abilities and technical skills performance in health care: A systematic review. Med. Educ. 2015, 49, 1065–1085. [Google Scholar] [CrossRef] [PubMed]
  5. Lohman, D.F. Spatial abilities as traits, processes, and knowledge. In Advances in the Psychology of Human Intelligence; Psychology Press: London, UK, 2014; pp. 181–248. [Google Scholar]
  6. Bohlmann, N.; Benölken, R. Complex Tasks: Potentials and Pitfalls. Mathematics 2020, 8, 1780. [Google Scholar] [CrossRef]
  7. Bishop, A.J. Spatial abilities and mathematics education—A review. Educ. Stud. Math. 1980, 11, 257–269. [Google Scholar] [CrossRef]
  8. Tosto, M.G.; Hanscombe, K.B.; Haworth, C.M.; Davis, O.S.; Petrill, S.A.; Dale, P.S.; Malykh, S.; Plomin, R.; Kovas, Y. Why do spatial abilities predict mathematical performance? Dev. Sci. 2014, 17, 462–470. [Google Scholar] [CrossRef]
  9. Cole, M.; Wilhelm, J.; Vaught, B.M.M.; Fish, C.; Fish, H. The Relationship between Spatial Ability and the Conservation of Matter in Middle School. Educ. Sci. 2021, 11, 4. [Google Scholar] [CrossRef]
  10. Carroll, J.B. Human Cognitive Abilities: A Survey of Factor-Analytic Studies; Number 1; Cambridge University Press: Cambridge, UK, 1993. [Google Scholar]
  11. Hegarty, M. Components of Spatial Intelligence. In The Psychology of Learning and Motivation; Academic Press: Cambridge, MA, USA, 2010; Volume 52, pp. 265–297. [Google Scholar]
  12. Shepard, R.N.; Metzler, J. Mental rotation of three-dimensional objects. Science 1971, 171, 701–703. [Google Scholar] [CrossRef]
  13. Porat, R.; Ceobanu, C. Enhancing Spatial Ability among Undergraduate First-Year Engineering and Architecture Students. Educ. Sci. 2024, 14, 400. [Google Scholar] [CrossRef]
  14. Buckley, J.; Seery, N.; Canty, D. A heuristic framework of spatial ability: A review and synthesis of spatial factor literature to support its translation into STEM education. Educ. Psychol. Rev. 2018, 30, 947–972. [Google Scholar] [CrossRef]
  15. Guay, R. Purdue Spatial Vizualization Test; Educational Testing Service: Princeton, NJ, USA, 1976. [Google Scholar]
  16. Bölcskei, A.; Gál-Kállay, S.; Kovács, A.Z.; Sörös, C. Development of Spatial Abilities of Architectural and Civil Engineering Students in the Light of the Mental Cutting Test. J. Geom. Graph. 2012, 16, 103–115. [Google Scholar]
  17. Šipuš, Ž.M.; Cižmešija, A. Spatial ability of students of mathematics education in Croatia evaluated by the Mental Cutting Test. Ann. Math. Inform. 2012, 40, 203–216. [Google Scholar]
  18. Hegarty, M.; Waller, D. Individual differences in spatial abilities. In The Cambridge Handbook of Visuospatial Thinking; Cambridge University Press: Cambridge, UK, 2005; pp. 121–169. [Google Scholar]
  19. Németh, B.; Hoffmann, M. Gender differences in spatial visualization among engineering students. Ann. Math. Inform. 2006, 33, 169–174. [Google Scholar]
  20. Reilly, D.; Neumann, D.L.; Andrews, G. Gender differences in spatial ability: Implications for STEM education and approaches to reducing the gender gap for parents and educators. In Visual-Spatial Ability in STEM Education: Transforming Research into Practice; Springer: Cham, Switzerland, 2017; pp. 195–224. [Google Scholar]
  21. Voyer, D.; Voyer, S.; Bryden, M.P. Magnitude of sex differences in spatial abilities: A meta-analysis and consideration of critical variables. Psychol. Bull. 1995, 117, 250. [Google Scholar] [CrossRef]
  22. Németh, B.; Sörös, C.; Hoffmann, M. Typical mistakes in Mental Cutting Test and their consequences in gender differences. Teach. Math. Comput. Sci. 2007, 5, 385–392. [Google Scholar] [CrossRef]
  23. Uttal, D.H.; McKee, K.; Simms, N.; Hegarty, M.; Newcombe, N.S. How can we best assess spatial skills? Practical and Conceptual Challenges. J. Intell. 2024, 12, 8. [Google Scholar] [CrossRef]
  24. Tóth, R.; Hoffmann, M.; Zichar, M. Lossless encoding of mental cutting test scenarios for efficient development of spatial skills. Educ. Sci. 2023, 13, 101. [Google Scholar] [CrossRef]
  25. Tóth, R.; Tóth, B.; Hoffmann, M.; Zichar, M. viskillz-blender—A Python package to generate assets of Mental Cutting Test exercises using Blender. SoftwareX 2023, 22, 101328. [Google Scholar] [CrossRef]
  26. Tóth, R.; Zichar, M.; Hoffmann, M. Gamified Mental Cutting Test for enhancing spatial skills. In Proceedings of the 2020 11th IEEE International Conference on Cognitive Infocommunications (CogInfoCom), Mariehamn, Finland, 23–25 September 2020; IEEE: Piscataway, NJ, USA, 2020; pp. 299–304. [Google Scholar]
  27. Pinkl, J.; Villegas, J.; Cohen, M. Multimodal Drumming Education Tool in Mixed Reality. Multimodal Technol. Interact. 2024, 8, 70. [Google Scholar] [CrossRef]
  28. Rangarajan, V.; Badr, A.S.; De Amicis, R. Evaluating Virtual Reality in Education: An Analysis of VR through the Instructors’ Lens. Multimodal Technol. Interact. 2024, 8, 72. [Google Scholar] [CrossRef]
  29. Estapa, A.; Nadolny, L. The effect of an augmented reality enhanced mathematics lesson on student achievement and motivation. J. STEM Educ. 2015, 16, 40–48. [Google Scholar]
  30. Chen, Y.c. Effect of mobile augmented reality on learning performance, motivation, and math anxiety in a math course. J. Educ. Comput. Res. 2019, 57, 1695–1722. [Google Scholar] [CrossRef]
  31. del Cerro Velázquez, F.; Morales Méndez, G. Application in Augmented Reality for Learning Mathematical Functions: A Study for the Development of Spatial Intelligence in Secondary Education Students. Mathematics 2021, 9, 369. [Google Scholar] [CrossRef]
  32. Petrov, P.D.; Atanasova, T.V. The Effect of Augmented Reality on Students’ Learning Performance in Stem Education. Information 2020, 11, 209. [Google Scholar] [CrossRef]
  33. Flores-Bascuñana, M.; Diago, P.D.; Villena-Taranilla, R.; Yáñez, D.F. On Augmented Reality for the learning of 3D-geometric contents: A preliminary exploratory study with 6-Grade primary students. Educ. Sci. 2020, 10, 4. [Google Scholar] [CrossRef]
  34. Suselo, T.; Wünsche, B.C.; Luxton-Reilly, A. Using Mobile Augmented Reality for Teaching 3D Transformations. In Proceedings of the 52nd ACM Technical Symposium on Computer Science Education, Virtual, 13–20 March 2021; pp. 872–878. [Google Scholar]
  35. Velázquez, F.d.C.; Méndez, G.M. Systematic review of the development of spatial intelligence through augmented reality in stem knowledge areas. Mathematics 2021, 9, 3067. [Google Scholar] [CrossRef]
  36. Lundin, R.M.; Yeap, Y.; Menkes, D.B. Adverse effects of virtual and augmented reality interventions in psychiatry: Systematic review. JMIR Ment. Health 2023, 10, e43240. [Google Scholar] [CrossRef]
  37. Bartlett, K.A.; Palacios-Ibáñez, A.; Camba, J.D. Design and Validation of a Virtual Reality Mental Rotation Test. ACM Trans. Appl. Percept. 2024, 21, 1–22. [Google Scholar] [CrossRef]
  38. Krüger, J.M.; Palzer, K.; Bodemer, D. Learning with augmented reality: Impact of dimensionality and spatial abilities. Comput. Educ. Open 2022, 3, 100065. [Google Scholar] [CrossRef]
  39. Lampropoulos, G.; Keramopoulos, E.; Diamantaras, K.; Evangelidis, G. Augmented reality and gamification in education: A systematic literature review of research, applications, and empirical studies. Appl. Sci. 2022, 12, 6809. [Google Scholar] [CrossRef]
  40. Cronbach, L. Coefficient alpha and the internal structure of tests. Psychometirka 1951, 16, 297–334. [Google Scholar] [CrossRef]
  41. Hegarty, M.; Waller, D. A dissociation between mental rotation and perspective-taking spatial abilities. Intelligence 2004, 32, 175–191. [Google Scholar] [CrossRef]
  42. Shapiro, S.S.; Wilk, M.B. An analysis of variance test for normality (complete samples). Biometrika 1965, 52, 591–611. [Google Scholar] [CrossRef]
  43. Fisher, R.A. Statistical Methods for Research Workers. In Breakthroughs in Statistics: Methodology and Distribution; Kotz, S., Johnson, N.L., Eds.; Springer: New York, NY, USA, 1992; pp. 66–70. [Google Scholar]
  44. Cohen, J. Statistical Power Analysis for the Behavioral Sciences; Routledge: London, UK, 2013. [Google Scholar]
  45. Gómez-Tone, H.C.; Martin-Gutierrez, J.; Valencia Anci, L.; Mora Luis, C.E. International comparative pilot study of spatial skill development in engineering students through autonomous augmented reality-based training. Symmetry 2020, 12, 1401. [Google Scholar] [CrossRef]
Figure 1. Representation of one of the classical Mental Cutting Test tasks from the paper-based test. One has to choose the only correct planar section of the left polyhedron from the five potential answers (the correct answer is 2). In the real MCT test, the dashed line of the planar section is not visible, and only the rectangular frame of the plane is presented.
Mti 08 00099 g001
Figure 2. Three of the tasks from our Mental Cutting Test Task Generator and Repository. The adjustment of the position of the cutting plane allows us to create multiple tasks for the same body, as well as the change of some parameters and position of the body (the correct answer is 1 in first and second rows, and 5 in the last row).
Mti 08 00099 g002
Figure 3. Multimodal practicing tools for spatial skill development: (1) augmented reality (left), (2) interactive 3D view where the user is allowed to rotate the body (middle), and (3) classical 2D test tool (right) [24].
Mti 08 00099 g003
Figure 4. Performance comparison of the three groups (‘2D’ group—green; ‘3D’ group—blue; ‘2D+3D’ group—red) in the 1st (lighter color) and 2nd (darker color) assessments.
Mti 08 00099 g004
Figure 5. Effectiveness of intervention across groups.
Mti 08 00099 g005
Table 1. Results of the 1st and 2nd tests.
GroupTest 1Test 2
Median Mean Std. Dev. Median Mean Std. Dev.
2D53.431.2453.641.34
3D75.001.9676.301.49
2D+3D53.862.0476.002.12
Disclaimer/Publisher’s Note: The statements, opinions and data contained in all publications are solely those of the individual author(s) and contributor(s) and not of MDPI and/or the editor(s). MDPI and/or the editor(s) disclaim responsibility for any injury to people or property resulting from any ideas, methods, instructions or products referred to in the content.