We conducted an experiment to evaluate, on the one hand, the performance of the effect of the highlight on the touch and, on the other hand, the performance of the combination (touch, highlight) compared to that of the combination (mouse, highlight). This section deals with this experiment. It is structured in two sub-sections: the first one describes the method used to conduct it, and the second one presents and analyzes the results obtained.
4.1. Method
The chosen method consisted of setting up the experimentation space, defining the task to be accomplished and the procedure, defining the evaluation metrics, and selecting the participants.
4.1.1. Context and Task to Be Accomplished
Adding a highlight effect to the selection using the mouse makes it easier to select objects. The objective of this experiment is to see if, as is the case with the mouse, adding the highlight to the touch improves the selection of objects by touch and if this improvement is similar to what brings the highlight to the mouse. Two measurement criteria are used for this evaluation: the time taken to complete a task and the error rate made during the completion of the task. The scenario defined for conducting this experiment is an observation and supervision activity of drones on a mission. We simulate such a system in which objects representing drones move randomly on a flat surface. In the beginning, all the objects are the same color. At each time step i, defined before the start of the mission, one of the objects is chosen (chosen) randomly by the system and marked with a color, yellow in this case. We call this object the elected or target object. The user must select the chosen object. This object remains available for selection for a period of s (selection time).
Three scenarios arise during the selection:
the user selects the target object during this time step s: the object changes its color to green for a duration g (good selection time), then returns to the initial color (color at the start of the mission); this is a correct selection.
the user cannot select the target object during the time step s: the object changes its color to red for a period b (time of bad selection), then returns to the initial color; a selection error is recorded.
the user selects an unelected object (not the target object): the selected object changes its color to red for a period b, then returns to the initial color; a selection error is also counted.
The total number of objects on the stage, the number of objects to be selected, the selection methods (mouse, touch, etc.), the time between two selections (i), the duration of a selection (s), the duration for which the colors of good (g) or bad selection (b) are maintained, are parameters defined before the beginning of the experiment.
4.1.2. Population
A total of 28 subjects, including 4 women and 24 men, aged from 18 to 40 (18–25: 6, 25–35: 16, 35–40: 6), took part in this experiment. These participants were from 5 different profiles, distributed as follows: 7 undergraduate students, 9 doctoral students, 7 research engineers, 4 post-doctoral researchers, and 1 teacher. They were recruited through an email, which we passed on to the mailing list of our engineering school. Users have not received any reward for this work.
4.1.3. Experiment Settings
Several parameters have been defined: the different methods to be used, the number of objects present on the screen during a passage, the total number of objects that will be selected for a passage, the time available to select an object, the time between a selection and the choice of the next target to be selected, etc. For this experiment, we therefore had:
4 methods of selecting objects: mouse, mouse + highlight, touch, touch + highlight (by the orientation of the gaze);
3 different densities (total number of objects on the screen) of objects: 10, 30, and 50 objects;
10 objects to be selected per mission (passage);
i = Time between two elections of the target object = 2 s
s: Hold time of the target object in the “selectable” state by the user = 2 s
g and b: Respective times of green color after a good selection and red after a selection failure = 1 s.
With this demarcation of the various elements, a mission is limited in time. An example of a mission is defined as follows: its modality (m) = hit, the density of the objects on the screen (d) = 30, the number of objects to select (f) = 10, i = 2 s, s = 2 s, g = b = 1 s. A mission is successful if, before the end of its duration, the user has selected all the f objects. In the example of the previous mission, f is equal to 10.
These durations of 1 s and 2 s have been arbitrarily chosen, and a small pilot with a few colleagues of our research team and from Thales validated that it was putting the experimenters in a high-load but still manageable situation.
4.1.4. Procedure
We established a participant time schedule and a charter that explained the project and the experiment, as well as the rights of the participants. Before starting, each participant was briefed on the purpose of the experiment and the operation of the system to be used for this, then followed by an environmental training phase. During the training, each participant made 4 passages at the rate of one passage for each modality. On each pass, they had 10 objects moving on the screen, among which it was necessary to select 5. This session allowed the participants to familiarize themselves with the environment and especially to understand the purpose of the experiment. During the evaluation session, each participant used the 4 modalities (M: Mouse, MH: Mouse and Highlight, T: Touch, TH: Touch and Highlight), and for each of them, he made 3 passages with 3 different densities of objects: 10, 30 and 50 objects, for a total of 12 passages per participant. Each time, he had to select a total of 10 objects. Questionnaires were also submitted to participants: 1 questionnaire after each modality and 1 final questionnaire on the experiment. For the whole experiment, we had a total number of 28 × 4 × 3, i.e., 336 passages. The order of use of the interaction modalities changed from one participant to another. We have numbered the modalities: 1: M, 2: MH, 3: T, and 4: TH. Then, we built a Latin square with these 4 numbers. The first line of this matrix gives the order of passage M–MH–T–TH.
Based on this principle, we determined 4 passage orders, as shown in
Table 1. For these four passages, each modality is used one time at each of the four positions. This order was repeated every four participants; we did 7 repetitions for the 28 participants. Unfortunately, this has only ensured the equitable use of the modalities Touch (with or without Highlight) and Mouse (with and without Highlight) but not of the highlighting and, therefore, not totally reduced the learning effect of the highlight on the results of the experiment. Anyway, as the orders of conditions “with highlight” and “without highlight” are the same for mouse and touch, it does not affect our main objective, which is to compare the enhancement of Touch and Mouse using highlight.
At each passage, the mission data were saved in a file for later analysis. In terms of data, we record, among others, the participant’s identifier, the modality used, the density of objects in the environment, the duration of the mission, the state of the mission (success or failure), the number of selections made at total, the number of wrong selections, etc.
4.1.5. Materials and Apparatus
The hardware platform used in this research consisted of:
a computer running a Windows 7 Enterprise Edition 64-bit operating system; It had an Intel Xeon 3.5 GHz processor, 64 GB of RAM, and an Nvidia Titan XP graphics card;
a Sony touch screen of size 9/16;
a mouse;
a virtual reality system consisting of 1 HTC Vive headset, 2 base stations, 2 controllers, and 1 HTC Vive tracker target.
The touch screen was placed vertically on a table so that participants could use touch while standing for the touch modalities. A table and chair were placed in front of the touch screen when the user had to use the mouse modalities.
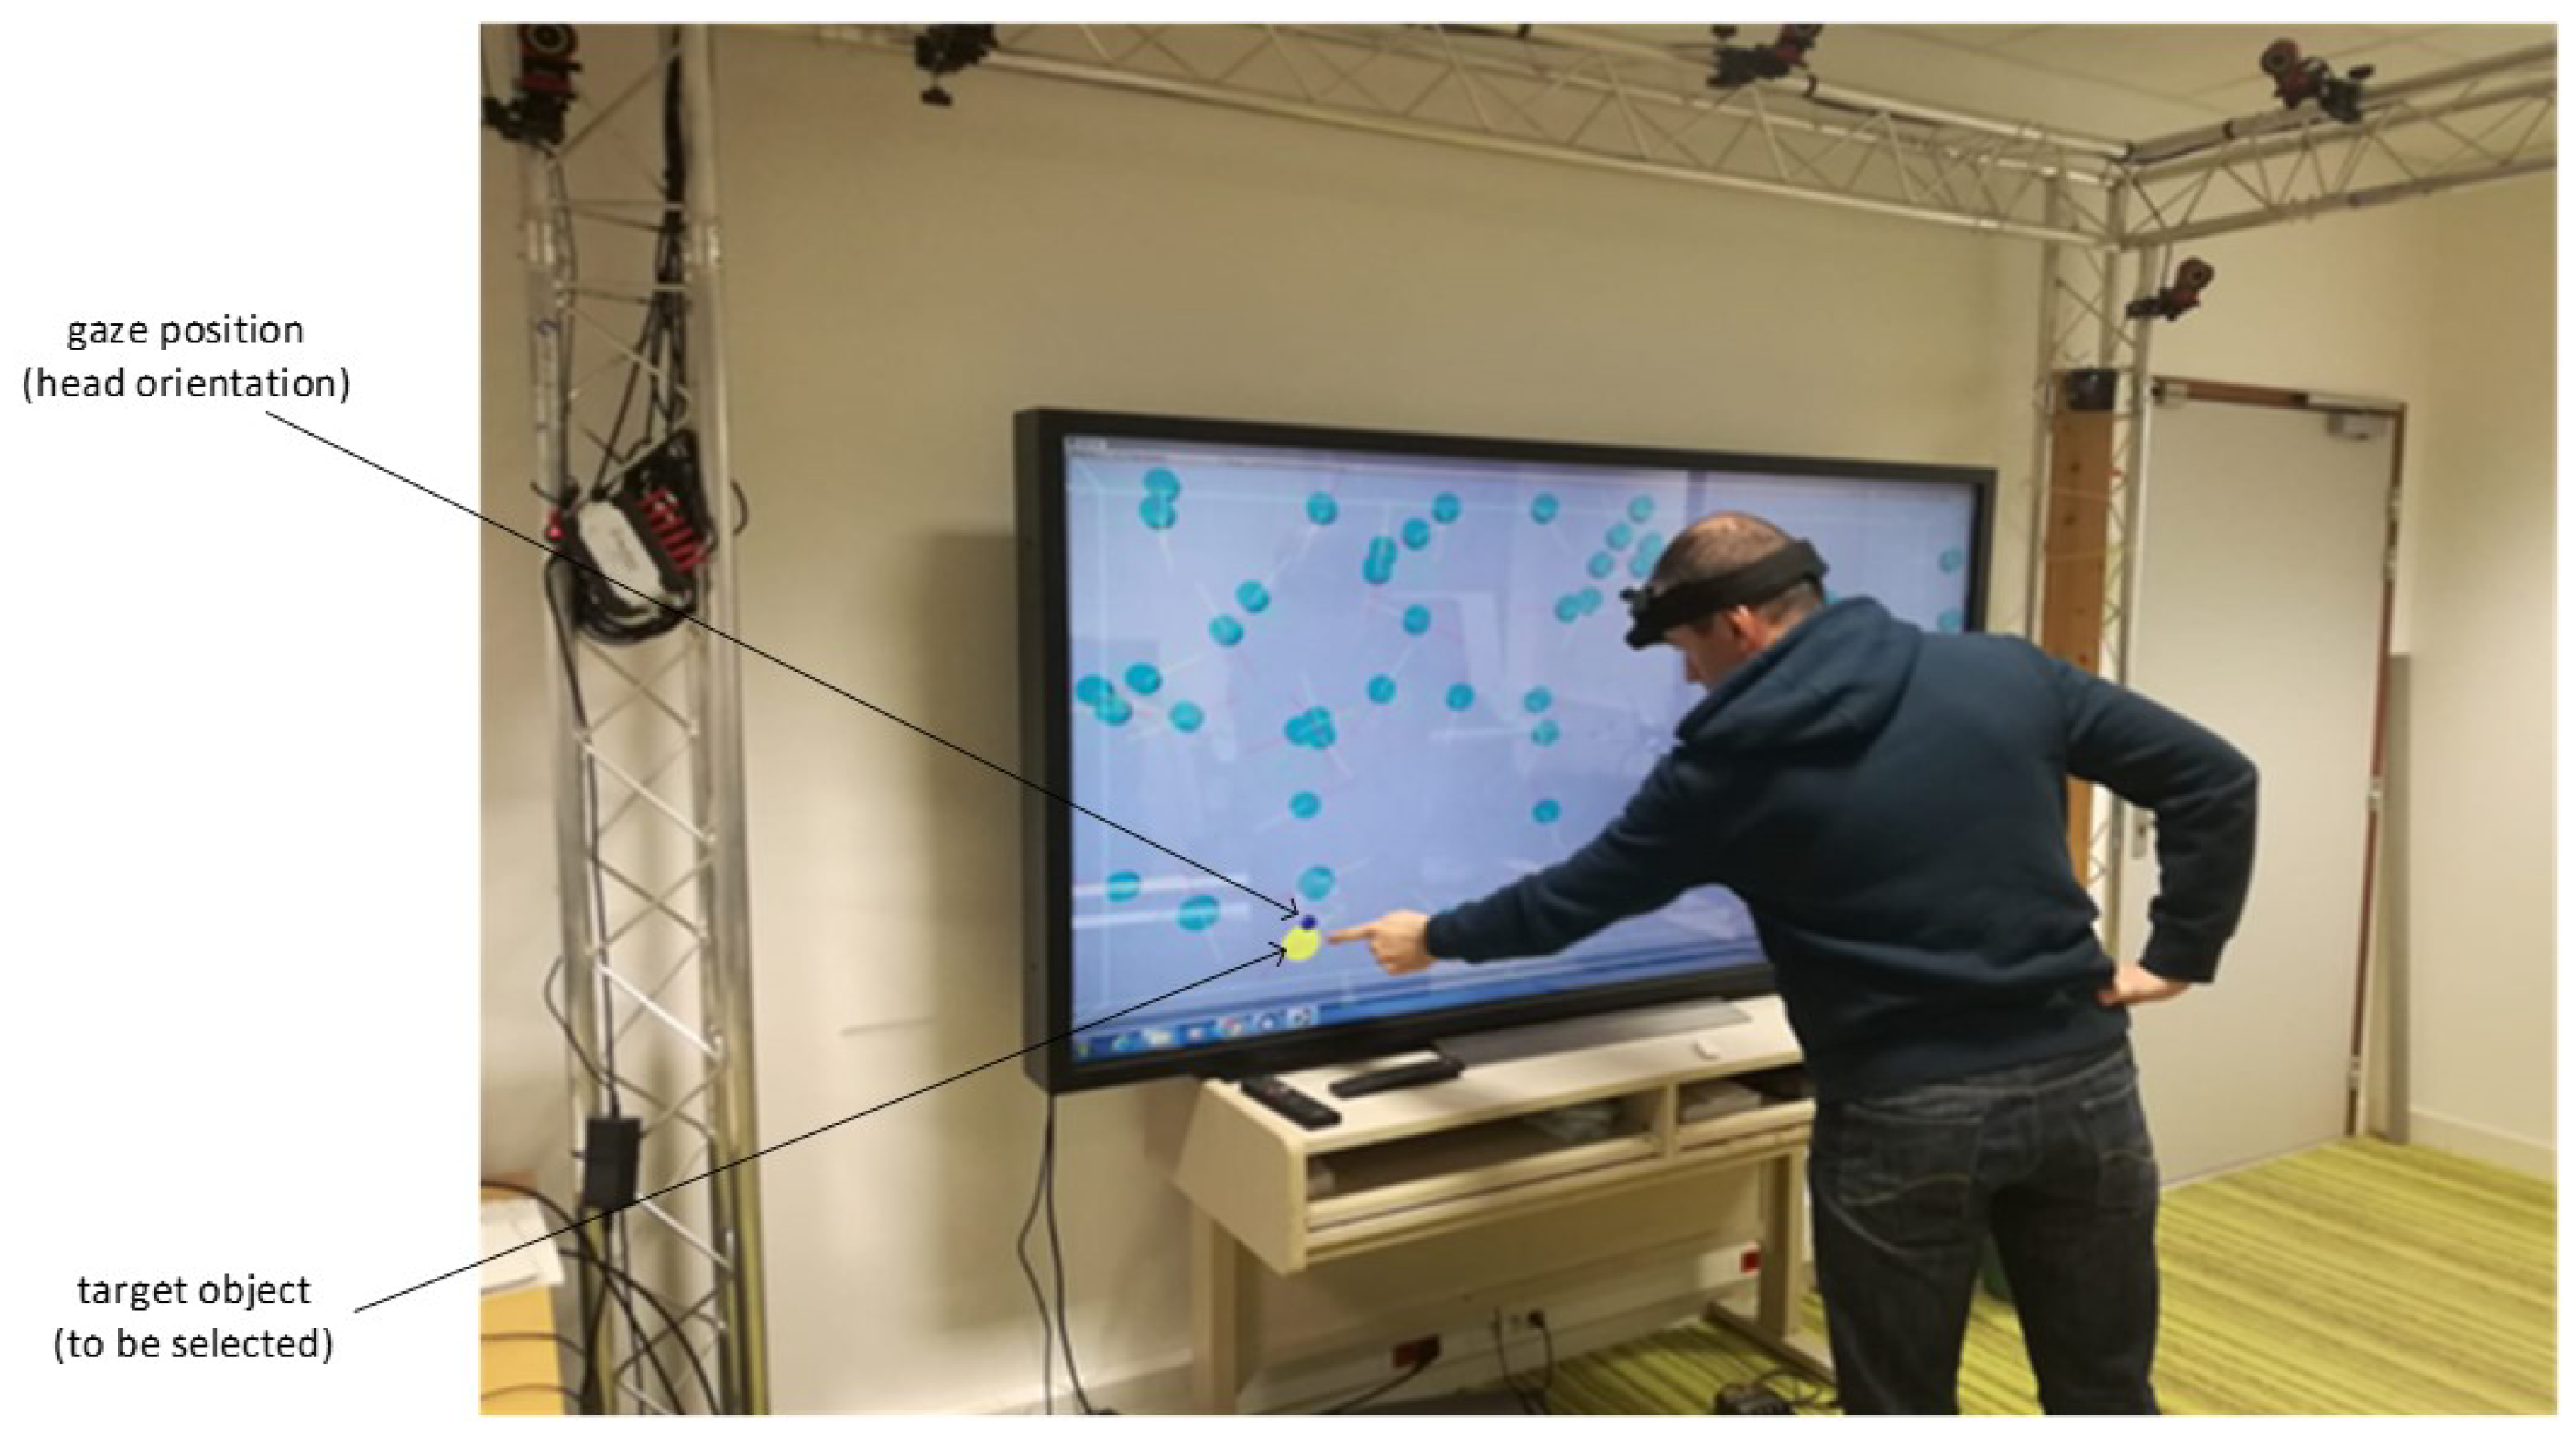
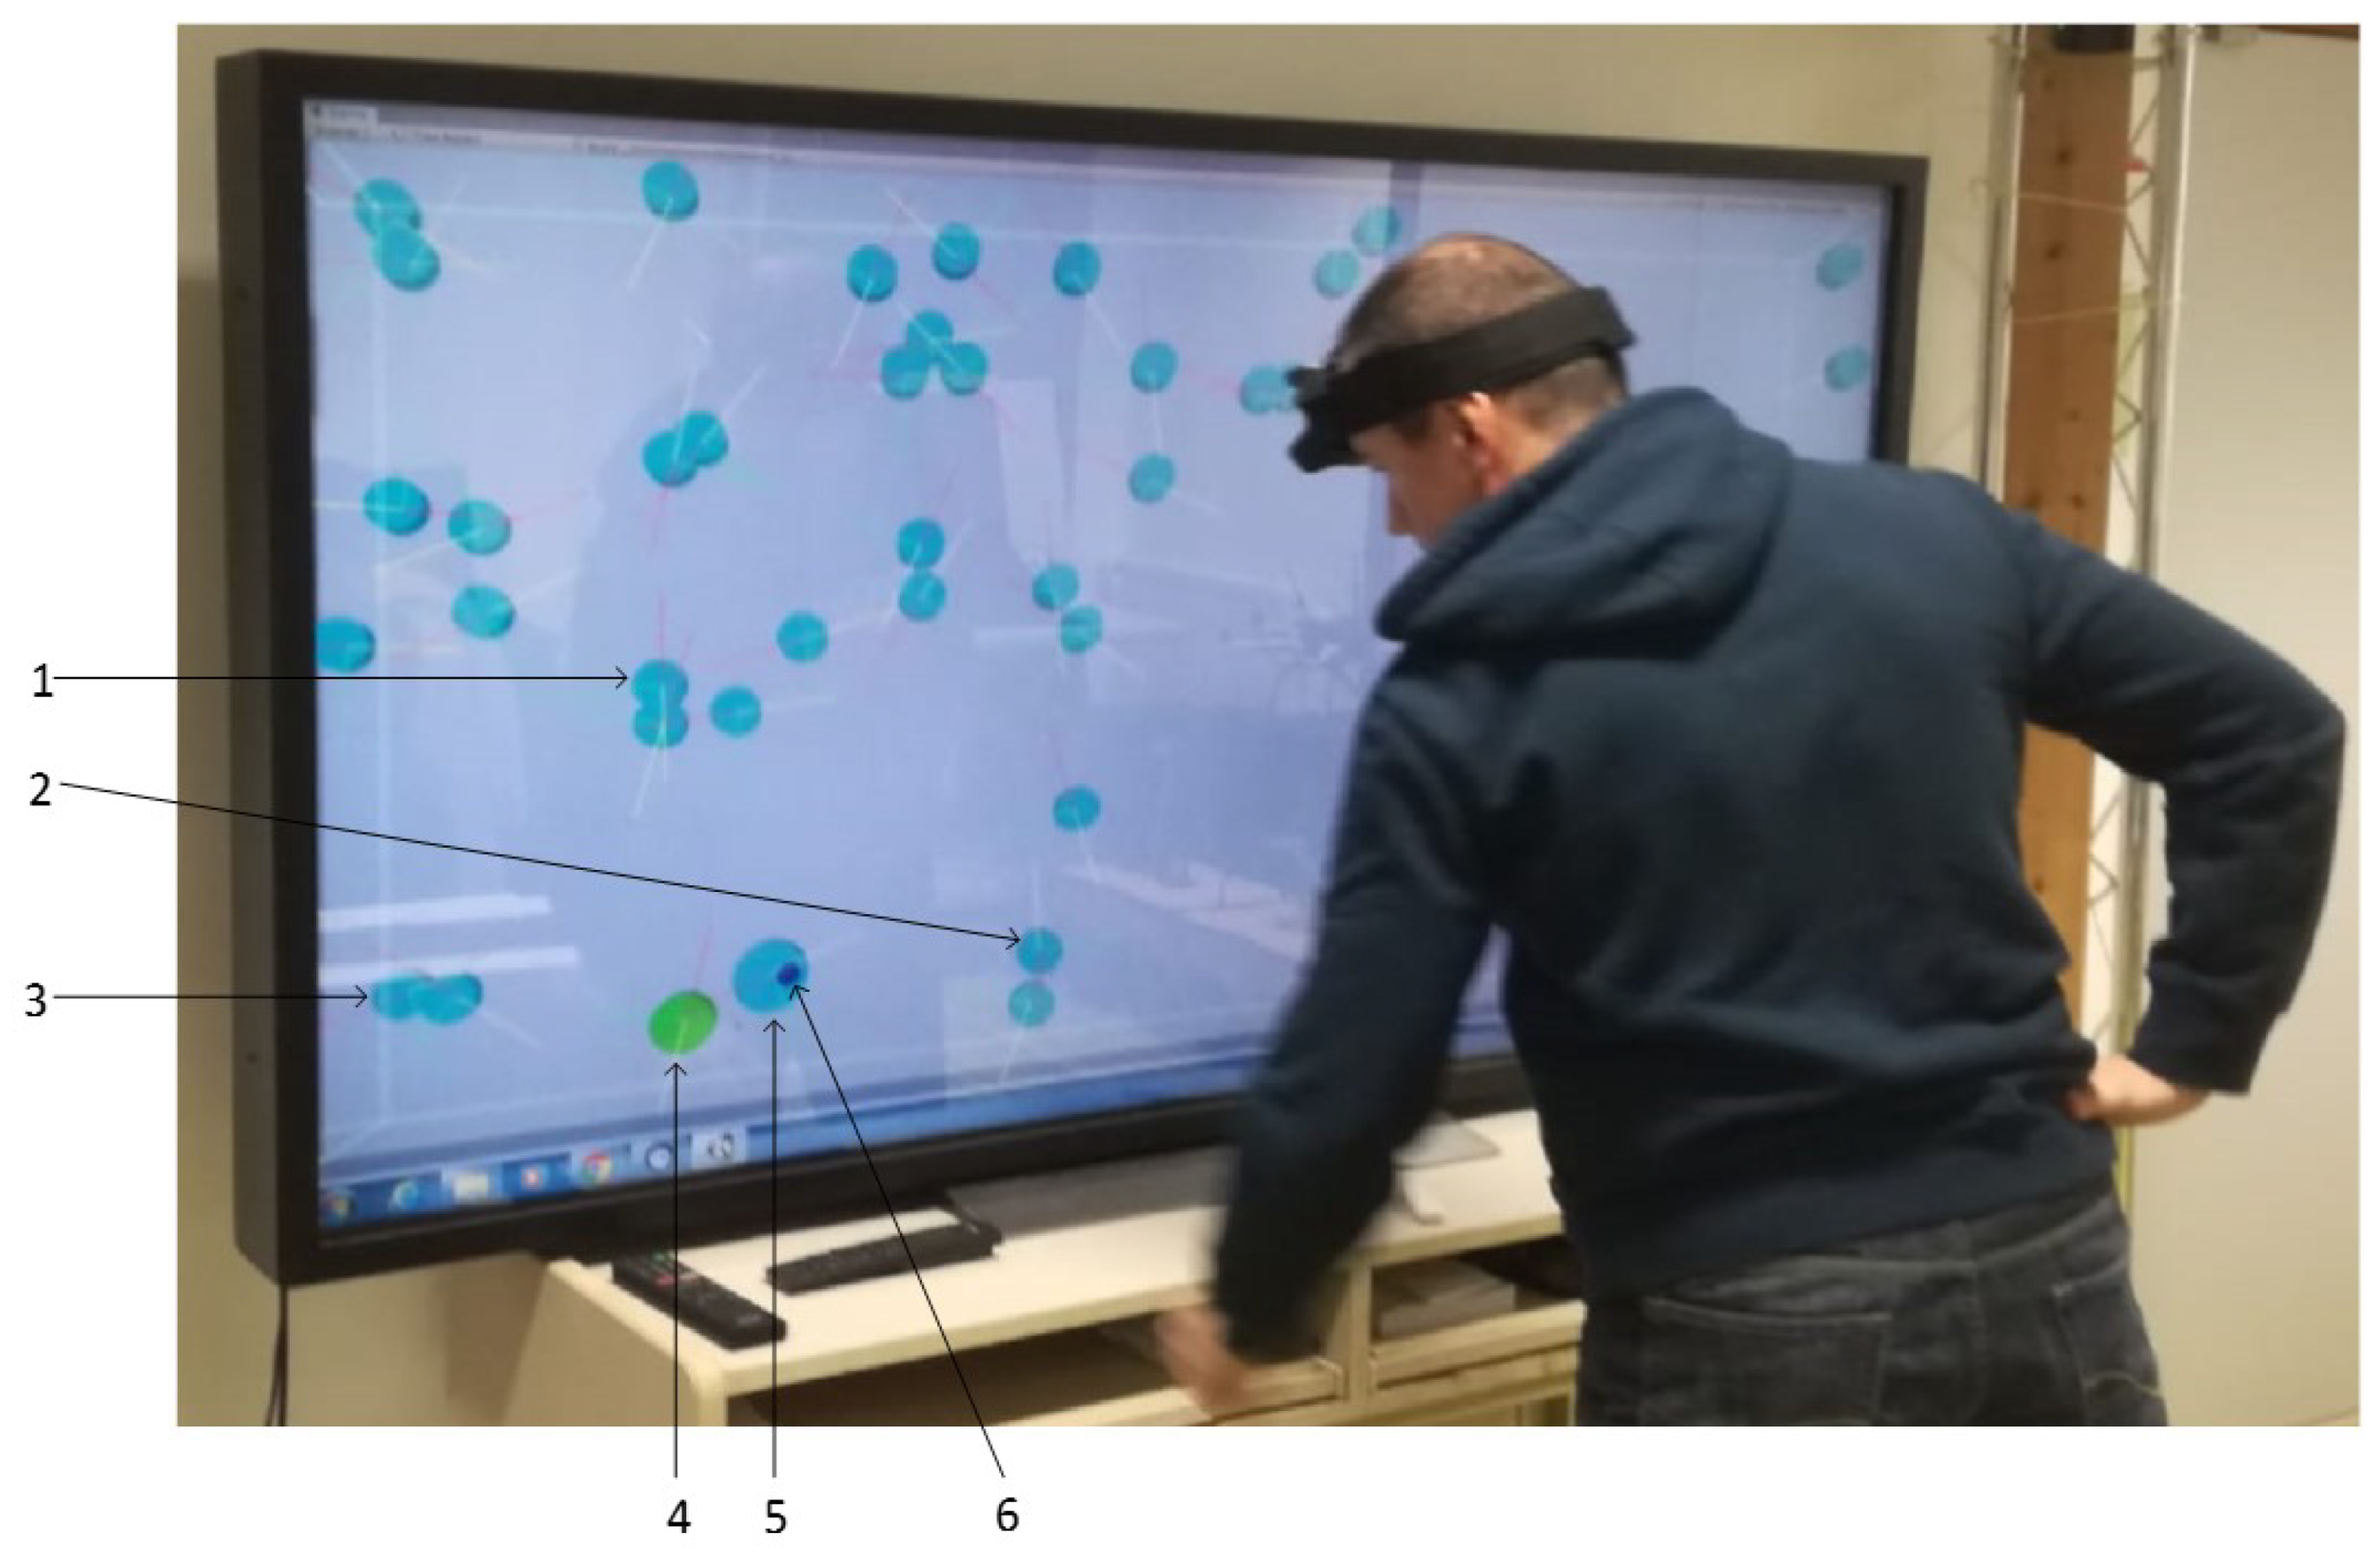
Figure 4 shows a participant during a mission, looking at the target object (yellow color) to select. The direction of his gaze is given by the blue circle on the screen.
In
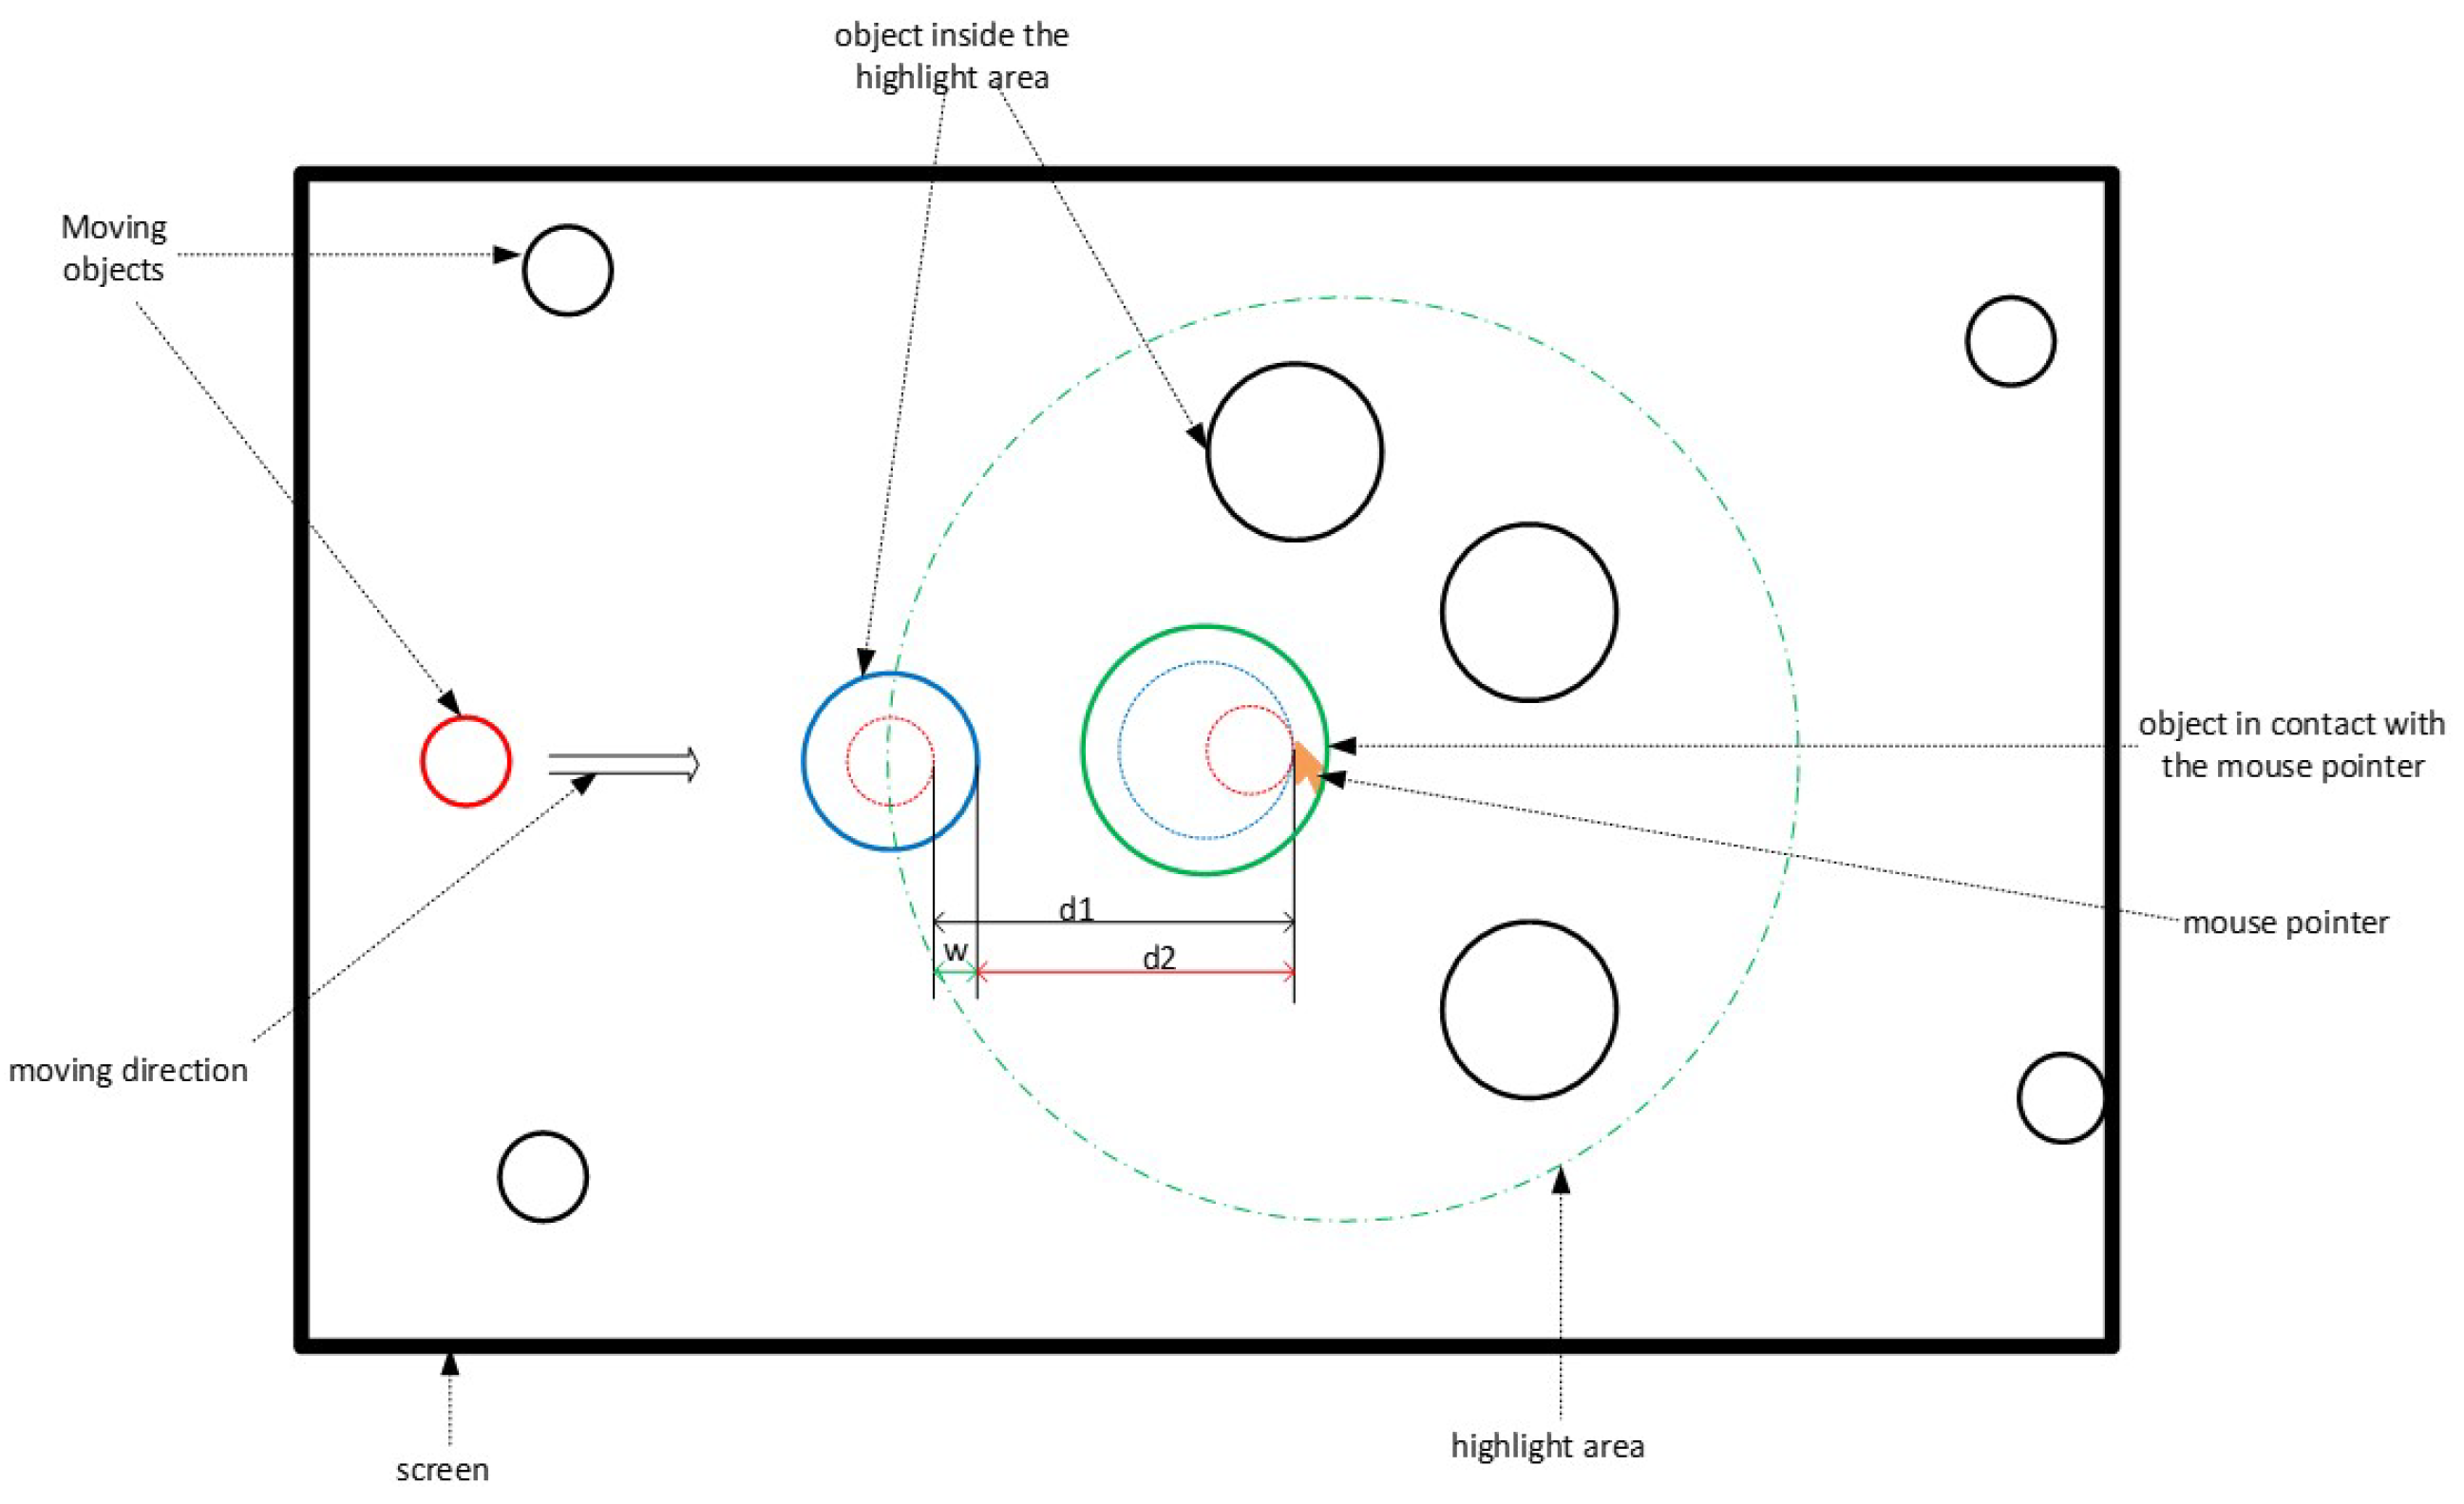
Figure 5, the user has already selected the object that has turned green. Objects 1, 2, and 3 are outside the highlighted area defined around the position of the gaze. Their size has not changed. On the other hand, object 4, which is the target already selected (green color) and is located in the highlighting area thereof, has a size greater than that of objects 1, 2, and 3 (first level of highlighting). On the other hand, the size of object 4 remains smaller than that of object 5, which now has the gaze direction represented by element 6 (second level of highlighting).
4.1.6. Assessment Metrics
To assess the four interaction modalities, and in particular, to compare the contribution of highlighting with the mouse and the touchscreen, we defined 2 objective criteria (variables of interest): the time taken to complete a mission and the rate of selection errors made during a mission. The various types of selection errors are defined above in
Section 4.1.1. We also offered subjective questionnaires to participants.
Completion Time
Mission completion time is a measure of the effectiveness of a modality. Because we consider that performing a task quickly with a modality is a sign of a certain ease of use. Likewise, this means that the modality is well suited to carrying out the task. For each mission, the application records the time taken to complete it for each participant. At the end of a mission, the environment changes color from light gray to dark gray to indicate the end to the participant. The software then ceases to determine the target objects, and therefore, no further selection is possible for the participant.
Selection Error Rate
The rate of errors that occur when selecting objects is also a measure of the effectiveness of the means used for this selection. We consider that the fewer errors made, the less difficulty there is in using this means for the task, and therefore the user is more comfortable. For each mission, the software records each selection or attempted selection made by the participant, distinguishing the good from the bad. More precisely, if we take the case of the mouse, each click made by the participant during a mission is recorded. At the end of the mission, the recording stops. We consider the selection error rate as the number of failed attempts of selections divided by the total number of attempts of selections:
Subjective Questionnaires
Two types of questionnaires were offered to each participant: a questionnaire at the end of each modality to evaluate this modality and an end-of-experimentation questionnaire to compare the modalities and give a general opinion on the experimentation. At the end of the use of a modality, the participant was asked to fill in a questionnaire with a subjective evaluation according to certain criteria, among which are familiarity with the modality, ease of use, self-confidence during use, and tiredness. At the end of the experiment, the participant had to give his opinion on his preferred modality, the least preferred modality, the effect of the highlight on the traditional modalities, etc. Demographic data were also recorded, detailing age, gender, function, and experience with 3D environments.
At the end of the experiments, the data collected were analyzed. The following section presents some results and findings that emerge.
4.2. Results
Using the data collected from the experiment, we carried out a statistical analysis to assess the impact of the factors of selection modality and density of the objects on the scene on our variables of interest, which are the duration of the mission and the rate of mistakes made. Our goal is to compare two modalities (“mouse + highlight” vs. “touch + highlight”) in order to see if the highlight added to the touch allows users to do as well as with the mouse doubtful of a highlight effect. We have conducted ANOVAs. We have 2 interest variables (error rate and completion time) and 2 factors (interaction modality and density of objects) that can influence them. For all our analyses, the risk of the first species chosen is , i.e., a confidence interval of 95%.
4.2.1. Error Rate
Error Rate by Modality
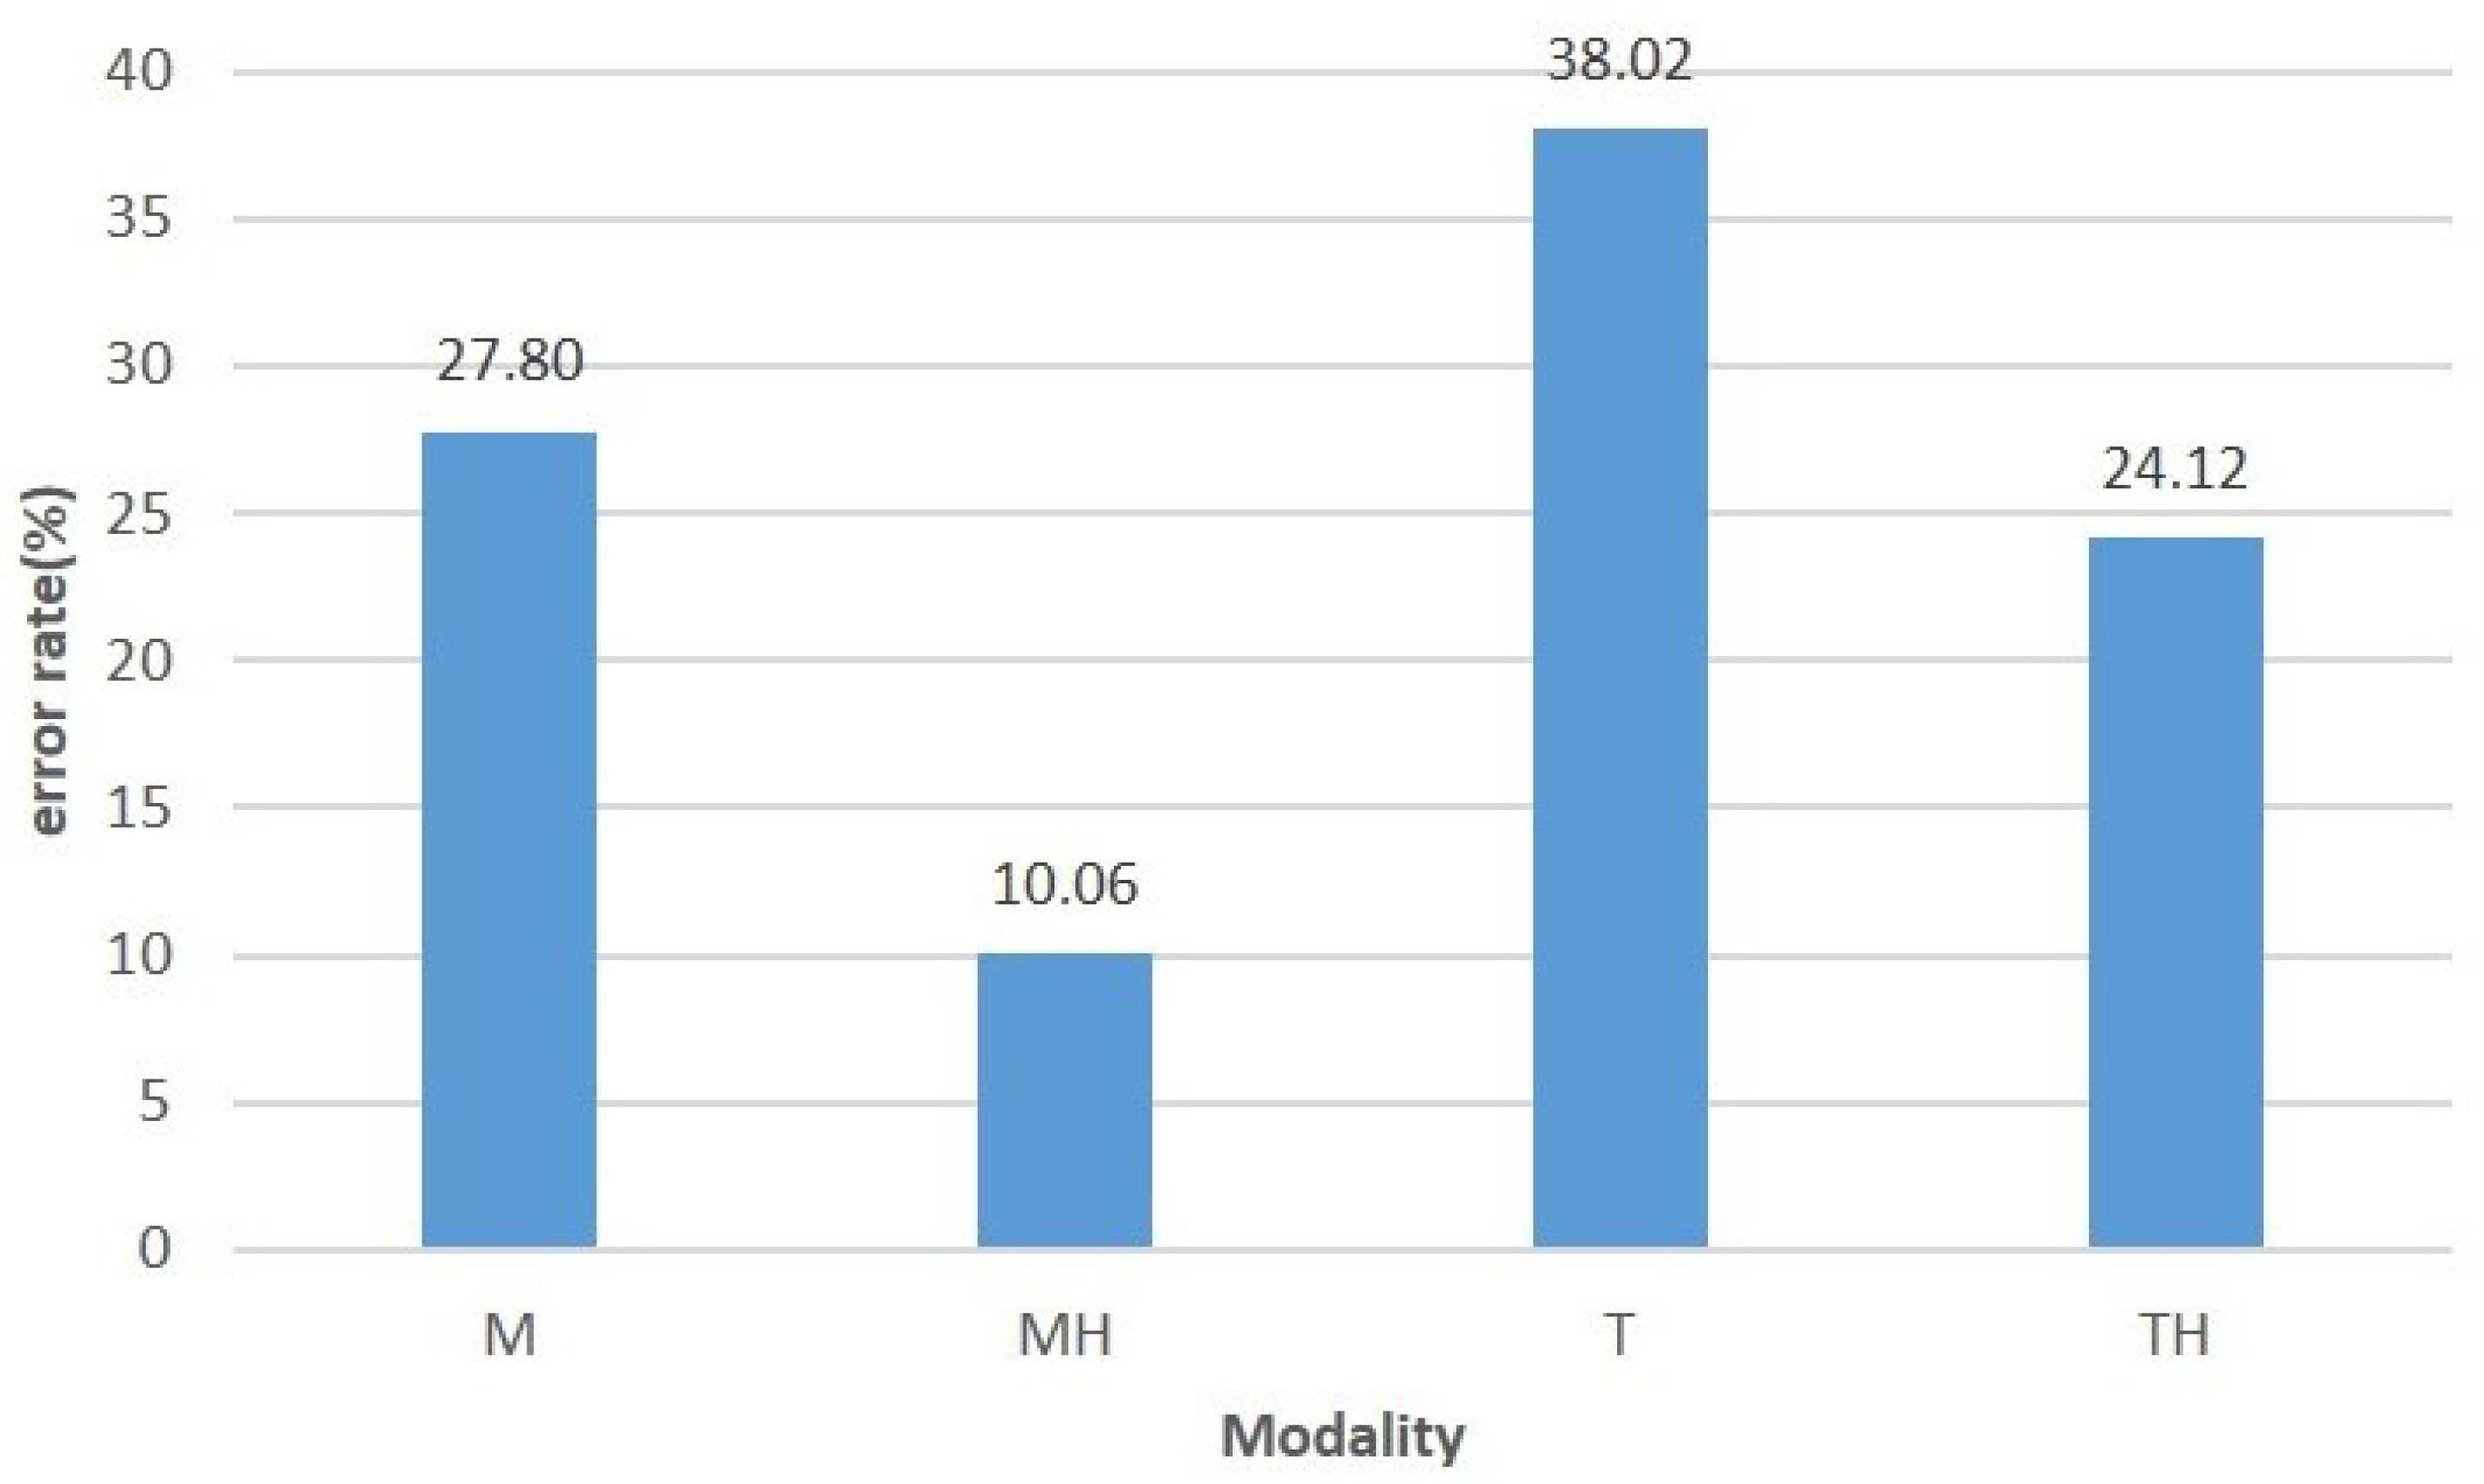
Figure 6 shows the error rate committed according to the interaction modality used.
The ANOVA carried out shows that the effect of the interaction modality on the rate of errors made during the selection is significant (DF = 3, F = 21.65,
p = 7.8 × 10
−13). The graph in
Figure 6 shows that adding highlighting to the mouse and touch reduces the rate of errors made using these modalities, respectively, for the selection of moving objects. The error rate goes from 27.80% to 10.06% for the mouse and from 38.02% to 24.12% for the touch screen.
The result obtained above gives the general impact of all the conditions on the error rate. To verify that this impact is not the effect of a single modality that dominates all the others, we conducted a Tukey HSD (Tukey multiple comparisons of means) between modalities taken 2 by 2. The results are summarized in
Table 2.
As shown in
Table 2, by comparing the effects of the interaction methods taken 2 by 2 on the rate of errors made, the impact remains significant. This means that the reductions in the error rate obtained by adding a highlighting effect on the mouse and touch modes, which are observed in the graph in
Figure 6, are significant.
Error Rate by Modality and Density
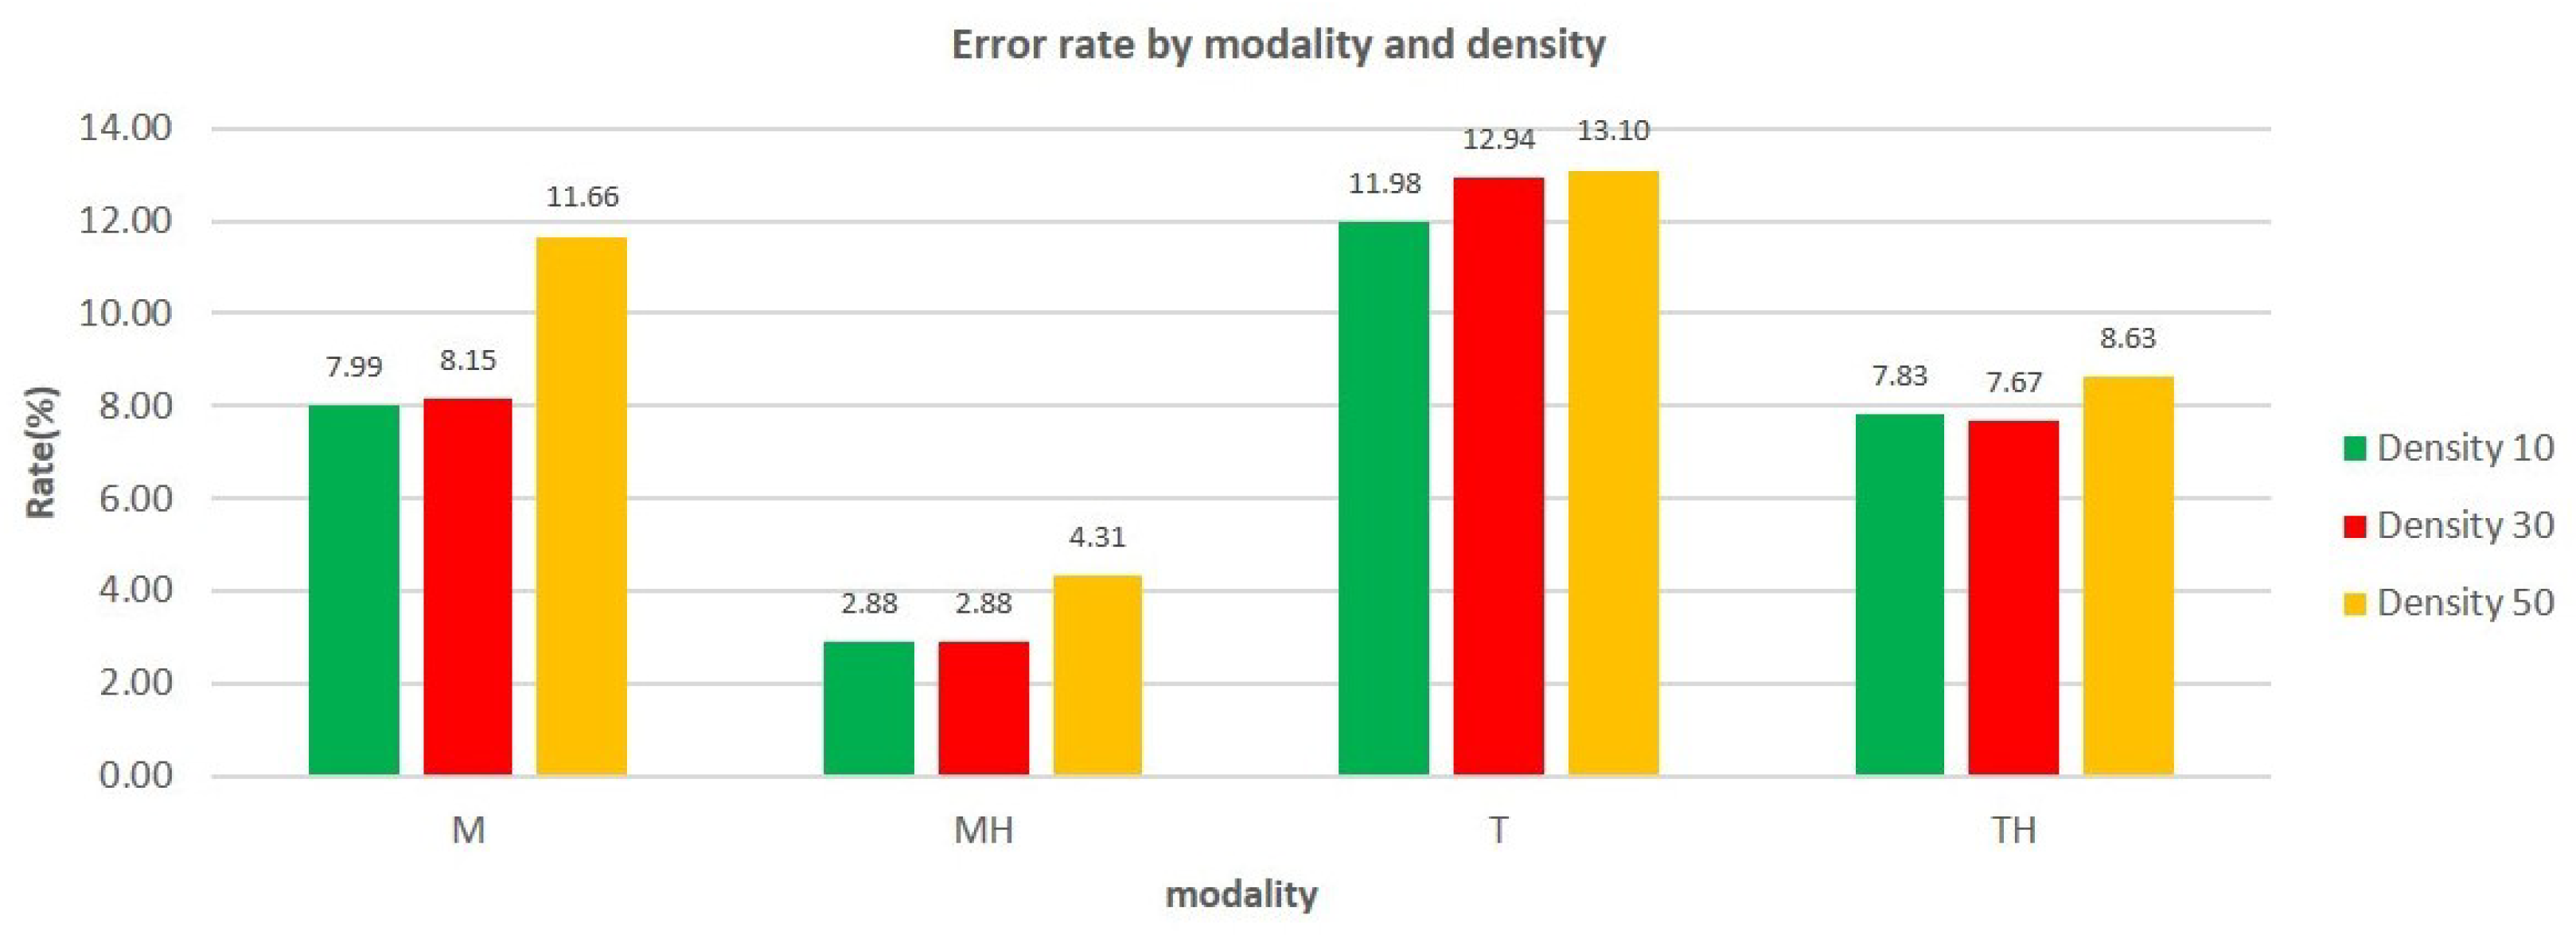
The graph in
Figure 7 shows the rate of errors made as a function of the interaction modality and the density of the objects.
Two observations are made: (i) the error rate increases with density; (ii) although the selection error rate increases with the number of objects present on the scene, adding highlighting to the interaction mode makes it possible to considerably reduce this error rate and therefore improve the quality of selection.
ANOVAs were carried out to judge the relevance of the impact of density on the selection error rates. The 3 of them show that the effect of the interaction modality on the rate of errors made during the selection is significant (
p < 0.05). Here again, we conducted Tukey HSDs between modalities taken 2 by 2.
Table 3 and
Table 4 summarize the results obtained from these analyzes.
In
Table 3, all
p-values are smaller than 0.05. This shows that there is a significant impact between the 2 factors of interaction modality and density of objects on the error rate committed. A comparison of the different modalities gave the results of
Table 4.
For a better understanding, we will name the lines by the pairs (Density, comparison case). For example, (10, M/MH) means the results obtained for the comparison between the modalities M and MH for the density 10.
Table 4 gives several pieces of information: (i) the line (50, T/M) gives a
p-value of
. Therefore, from 50 objects on the scene, the difference between the error rate made with the mouse only and the touch alone is not significant; (ii) all the other differences observed in the graphs in
Figure 7 are significant. In particular:
the lines (10, M/MH), (30, M/MH), (50, M/MH) all have p-values less than 0.05. So, regardless of the density of objects in the environment, adding a highlight effect on the mouse significantly decreases the error rate of object selections.
the lines (10, T/TH), (30, T/TH), (50, T/TH) all have p-values less than 0.05. So, regardless of the density of objects in the environment, the addition of a highlight effect on the touch significantly decreases the error rate of object selections.
4.2.2. Mission Completion Time
We studied the influence of the modality and density factors on the time to complete the mission.
Mission Completion Time by Modality
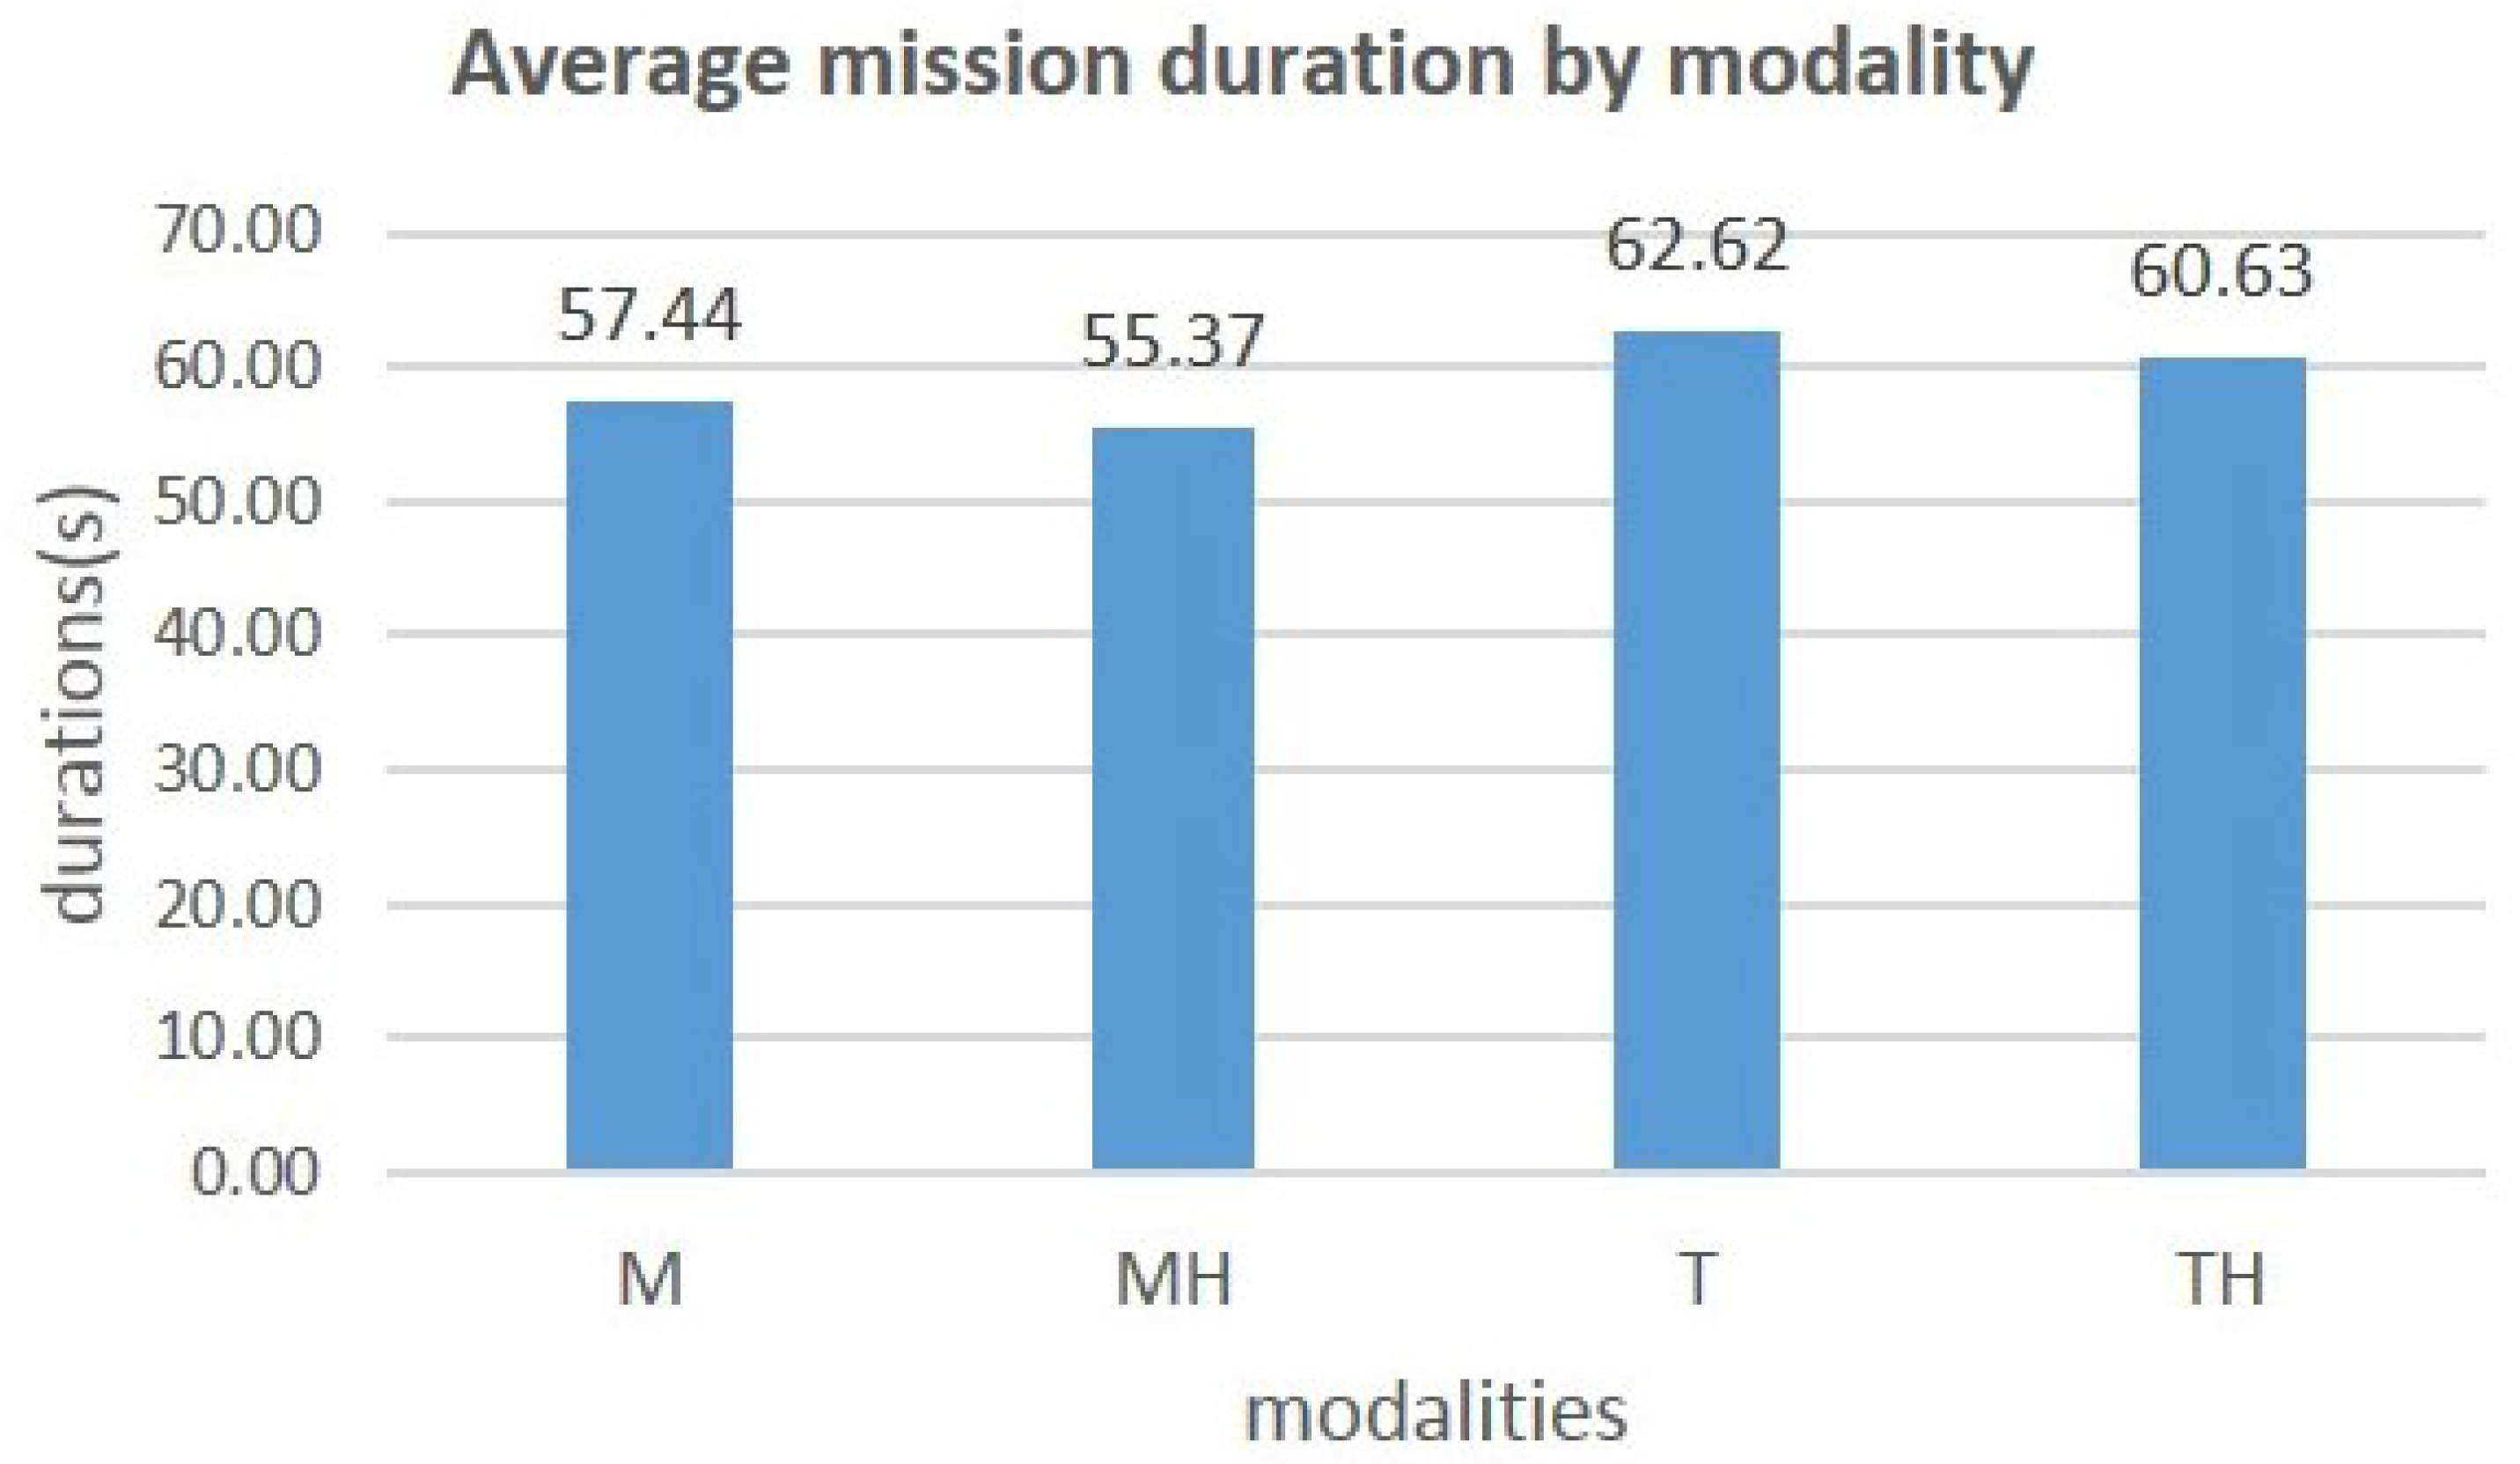
The graph in
Figure 8 shows the variation in the average completion time depending on the modality used.
You can see that adding the highlight to a modality reduces the time taken to complete the mission. We obtain a reduction of 3.60% from 57.44 s to 55.37 s for the mouse and a reduction of 3.20% from 62.62 s to 60.63 s for the touchdown. The ANOVA carried out shows that the effect of the interaction modality on the time duration to complete the mission is significant (DF = 3, F = 95.84,
p = 1 × 10
−44), so the impact of the interaction modality on the completion time thus observed in the graph in
Figure 8 is therefore significant. The result obtained above shows the general impact of all the modalities on completion time. Here again, we conducted a Tukey HSD between modalities taken 2 by 2. The results are summarized in
Table 5.
All the p-values obtained are smaller than 0.05, so we can say that the modality of interaction significantly influences the completion time of a mission, especially when adding highlight to the mouse and touch modes.
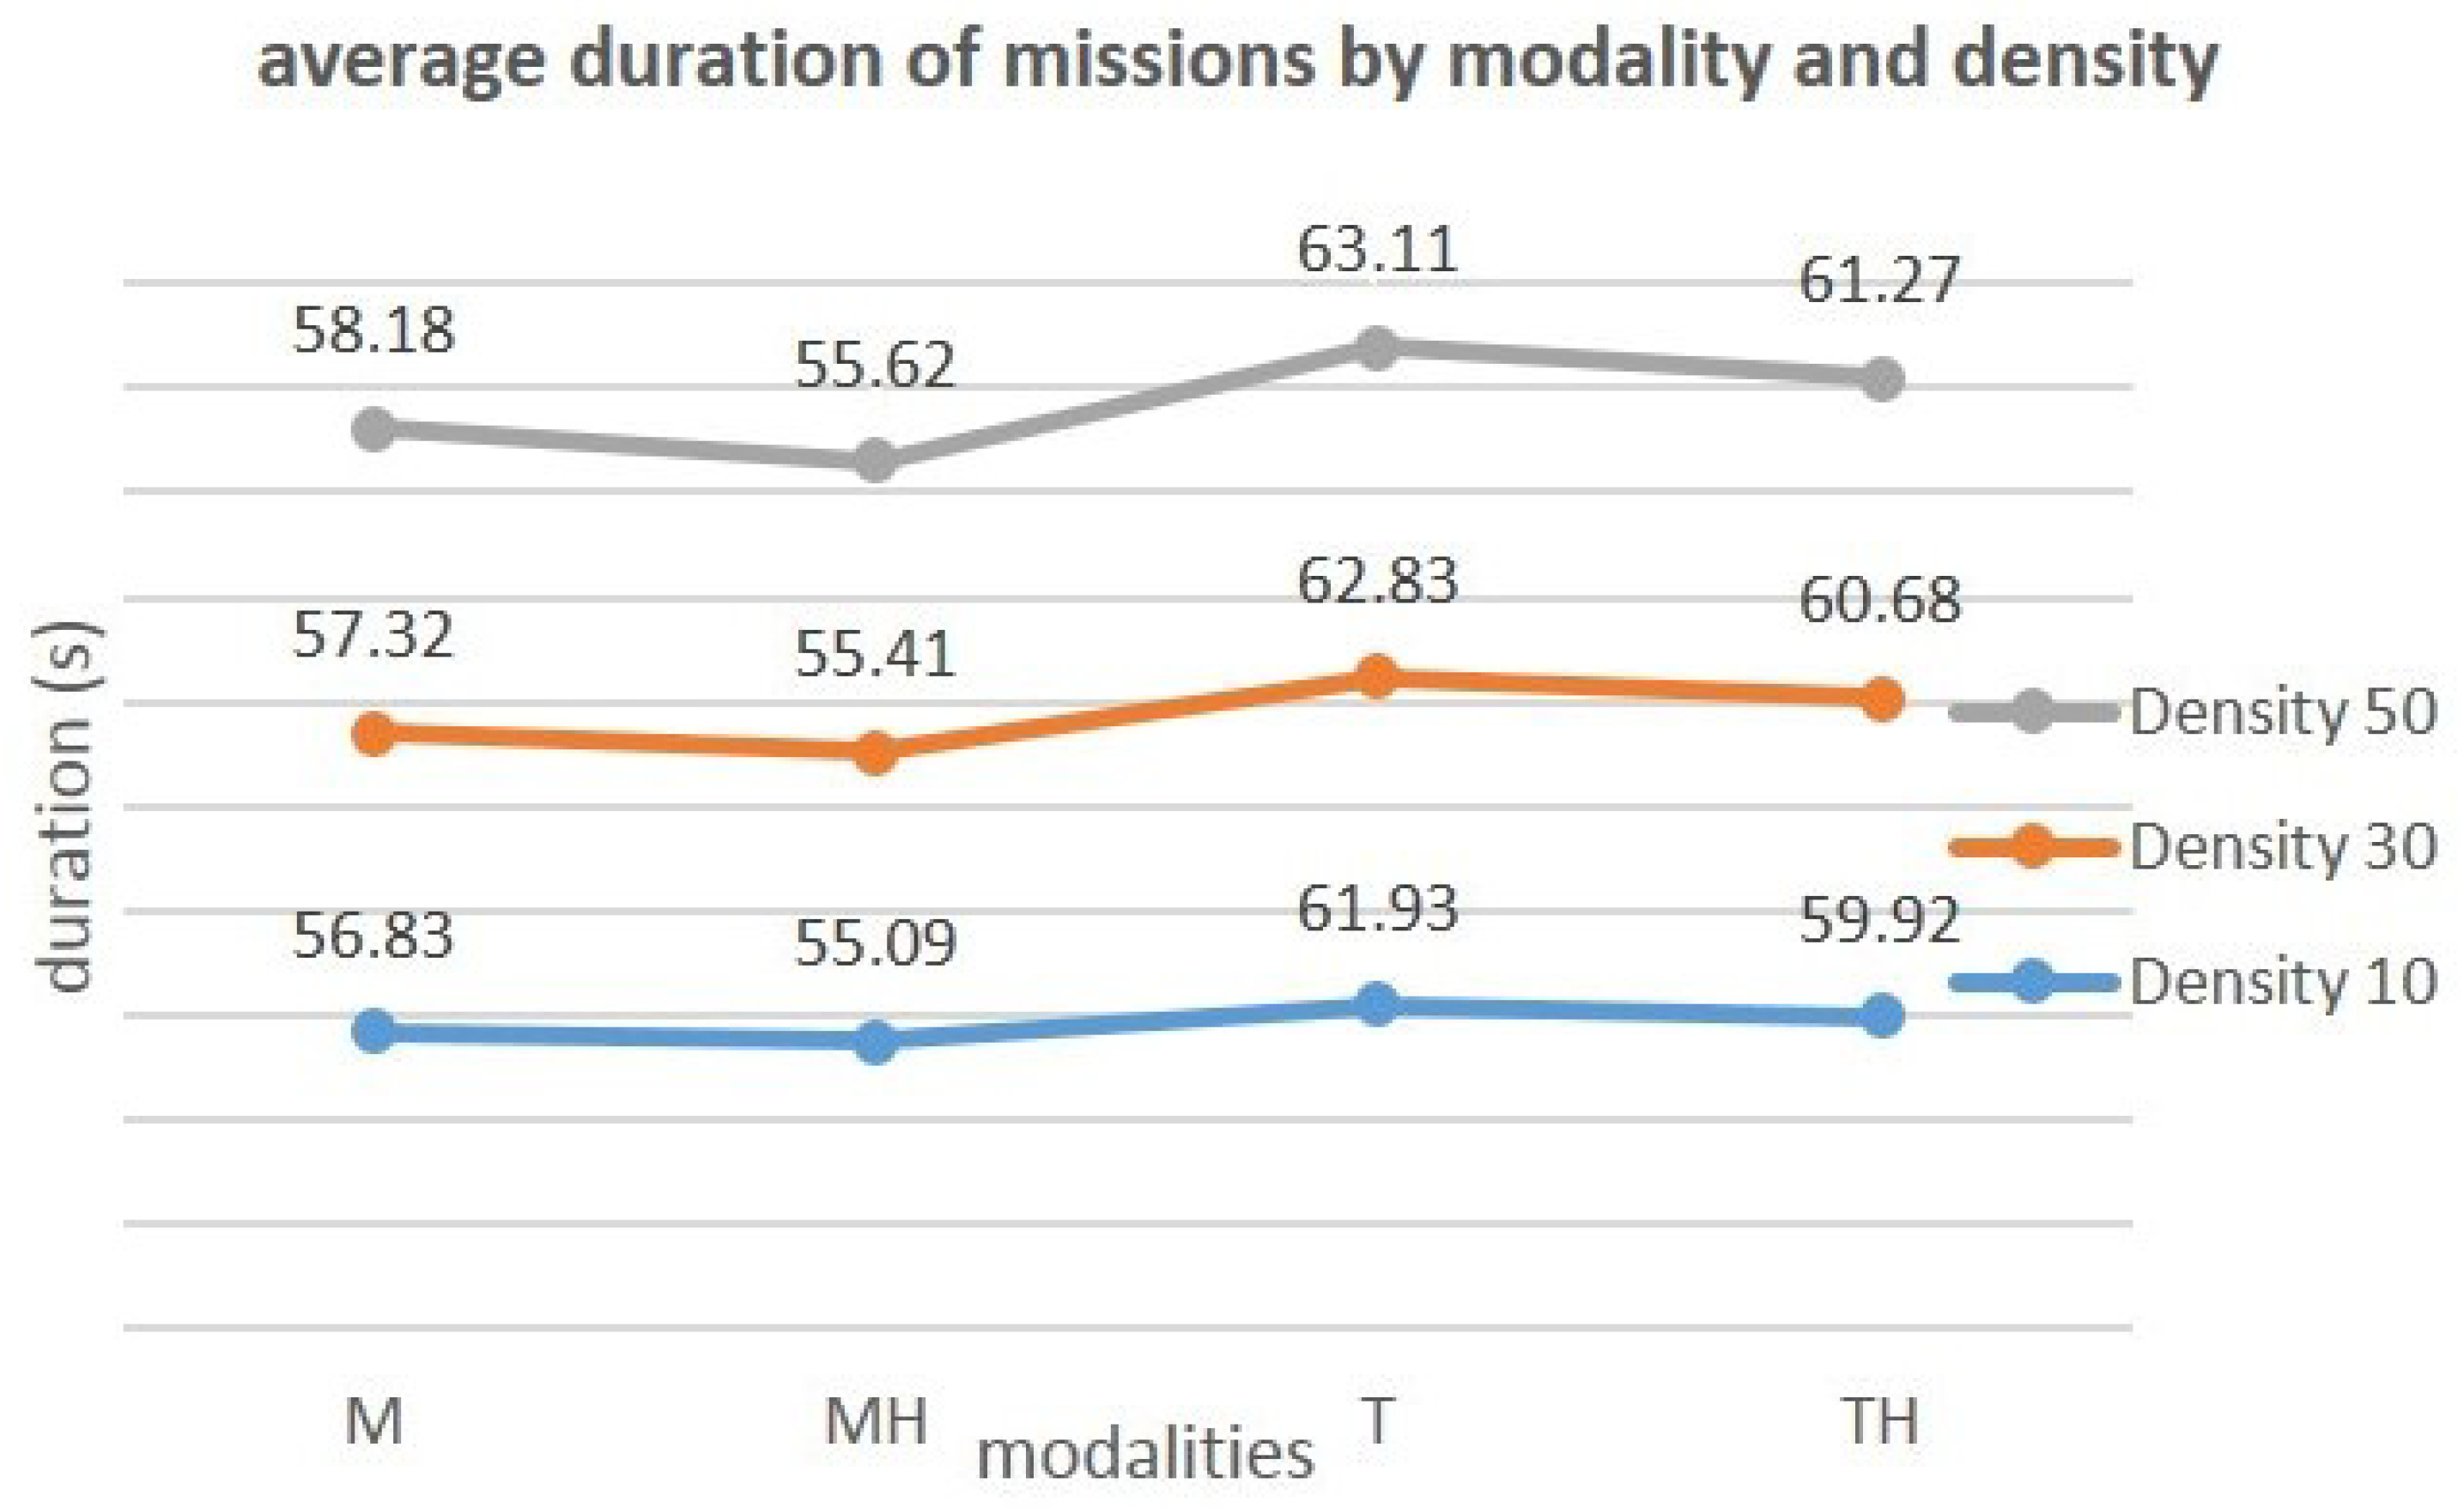
Mission Completion Time by Modality and by Density
The graph in
Figure 9 shows the average completion times based on terms and densities.
We note that although the duration of the mission increases with the density of the objects, adding the highlight to a modality still makes it possible to decrease this duration despite the increase in the number of objects on the scene.
Two other observations are also made: (i) the time to complete a mission increases with density; (ii) although this time increases with the number of objects present in the environment, the addition of the highlighting to the interaction modalities reduces the completion time. ANOVAs were carried out to assess the relevance of this impact of the modality according to the density of the objects.
Table 6 summarizes the results obtained from these analyzes.
In
Table 6, all
p-values are smaller than 0.05. This shows that there is a significant impact of the 2 factors, interaction modality and density of objects, on the mission completion time. The results obtained by comparing the impacts of the modalities taken 2 by 2 for each density are summarized in
Table 7.
In
Table 7, all the comparison cases carried out give a
p-value smaller than 0.05. There is, therefore, a significant interaction between the modality and density factors over the completion time, regardless of the density and modality used.
4.2.3. Subjective Questionnaire
As indicated in paragraph Subjective Questionnaires of Section Assessment Metrics, the participants answered a subjective questionnaire at the end of the experiment. The questions contained in the questionnaire made it possible to collect the opinions (ratings) of the participants on various criteria.
The participants first had to give a score between 1 and 5 on the following criteria:
Ease of use: Would you like to use this modality for the selection of moving objects?
Suitability for selection: is the modality suitable for the selection of moving objects?
Complexity: is the selection procedure unnecessarily complicated?
Size of the objects: is the size proposed for the objects appropriate for their selection?
Density and difficulty: does the increase in the number of objects in the environment make selection more difficult?
Self-confidence: what level of confidence did you have when using the modality?
Then, they ended the session by giving their opinion with a score between 1 and 10 on the contribution of the highlight (did the addition of the highlight to the modalities improve/facilitate the selection?). Friedman’s ANOVAs were performed on the questionnaire responses; the observed means and the
p-values are presented in
Table 8.
According to these data, first, the participants found that the highlighted modalities were very easy to use, that they were more suitable for the selection of objects than the traditional modalities, and that they had more self-confidence during the use of highlight. They also found that the size of the objects seemed correct for selection and that the density of the objects in the environment made selection more difficult.
Second, participants found that adding highlighting to a modality greatly improved (average > 8.5 out of 10) the selection of objects. The p-value of this criterion is ; therefore, the difference in sentiment observed in the participants’ response to this question is not significant. In other words, the latter notes that the comfort brought by the addition of highlighting on the mouse and the addition of highlighting on touch for the activity of selecting moving objects is substantially the same in the 2 cases. Finally, when asked which method they preferred, 16 participants, i.e., 57.14%, chose the mouse and the highlight against 12, or 42.86%, for the touch and the highlight.


