Abstract
Erosion damage can occur in fans and blowers during industrial processes, cooling, and mine ventilation. This study focuses on investigating erosion caused by particulate air flows in a centrifugal fan with forward-inclined blades. This type of fan is particularly vulnerable to erosion due to its radial flow component and flow recirculation. The flow field was solved separately, and the data transferred to the particle trajectory and erosion code. This in-house code implements the Lagrangian approach and the random walk algorithm, including statistical descriptions of particle sizes, release positions, and restitution factors. The study involved two types of dust particles, with a concentration between 100 and 500 μg/m3: The first type is the Saharan (North Africa) dust, which has a finer size between 0.1 and 100 microns. The second type is the Coarse Arizona Road Dust, also known as AC-coarse dust, which has a larger size ranging from 1 to 200 microns. The complex flow conditions within the impeller and scroll, as well as the concentration and size distribution of particles, are shown to affect the paths, impact conditions, and erosion patterns. The outer wall of the scroll is most heavily eroded due to high-impact velocities by particles exiting the impeller. Erosion is more pronounced on the pressure side of the full blades compared to the splitters and casing plate. The large non-uniformities of erosion patterns indicate a strong dependence with the blade position around the scroll. Therefore, the computed eroded mass is cumulated and averaged for all the surfaces of components. These results provide useful insights for monitoring erosion wear in centrifugal fans and selecting appropriate coatings to extend the lifespan.
1. Introduction
Erosion phenomenon resulting from particulate turbulent flows is frequently observed in power generation, industrial processes, air cooling, and ventilation, leading to a reduction in equipment performance and lifespan. During the peak season of dust storms in North Africa and the Middle East, high concentrations of dust particles are frequently encountered. The particles range in size from very fine to large sizes reaching up to 700 microns [1]. Fans and blowers that handle flows containing these abrasive particles are at risk of experiencing erosion damage, reduced aerodynamic performance, and structural failure [2]. Fan erosion is primarily characterized by changes in the blade’s leading edge (LE), trailing edge (TE), thickness, and tip clearance [3].
Balan and Tabakoff [4] conducted tests to assess the effects of sand ingestion on an NACA axial flow compressor. They revealed erosion from LE and the pressure side (PS) of blades with an increase in roughness, leading to an overall shift (drop) in the pressure rise coefficient and efficiency versus the flow coefficient. Additionally, Ghenaiet et al. [5,6] investigated the erosion effects in a high-speed axial fan stage through experimental and numerical analyses. As a result, the efficiency and pressure rise coefficient decreased by 7.1% and 9.5%, respectively, along with a 55% decrease in the surge margin, after 9 h of sand ingested at a concentration of 775 mg/m3.
Modeling various physical aspects related to particle dynamics and erosion damage remains a difficult task because of the complexity of multiple interconnected parameters. Although inspections during service can provide some information about erosion wear and its development, the full testing remains very intricate. Over the past decades, efforts have been made to develop reliable semi-empirical models and adapt them for the numerical assessment of erosion in turbomachinery. Hussein and Tabakoff [7] were the first to develop a two-dimensional model for the particle trajectory in an axial blade cascade. However, in centrifugal blades, the trajectories of particles consistently differ due to the flow field characterized by jet and eddy structures, in addition to the effects of Coriolis and centrifugal forces. Elsayed and Rashed [8] were the first to investigate erosion in a centrifugal compressor operating in a polluted environment. Mengiiturk and Sverdrup [9] obtained early estimates of erosion in a centrifugal fan caused by fly ash from steam power generation. Elfeki and Tabakoff [10] computed the trajectories of particles and erosion in a centrifugal impeller, characterized by frequent collisions throughout the entire PS, while its suction side (SS) was mainly impacted near the LE. Harris [11] performed erosion calculations in a turboshaft centrifugal impeller. Based on a comparison with experimental results, he has concluded that the erosion features of the main blades were successfully predicted, unlike the splitters. In a centrifugal fan of an industrial application, Cardillo et al. [12] predicted the main areas of erosion at the LE and TE from the PS of the blade. Fritsche et al. [13], using the CFX code, analyzed methods to reduce erosion in a large radial fan while maintaining its performance. Aldi et al. [14] used the code Fluent to analyze the erosion behavior of a large centrifugal fan from a cement factory and analyzed the surface of the wear-resistant plates to minimize erosive.
Several solutions have been suggested to reduce fan erosion, including wear-resistant plates placed in regions most affected by impacts (Mandi and Yaragatti [15] and Holzdeppe [16]) and the adoption of bionic blade surfaces (Zhang et al. [17] and Han et al. [18]).
A review of the existing literature has identified a lack of thorough investigation into particle dynamics in centrifugal fans, as well as a lack of quantitative and qualitative analyses of the erosion process. This study aims to address these gaps by examining erosion damage in a centrifugal fan with forward blades of highly unstable flows. The focus is on how the flow details, particle size and concentration, and impeller–scroll interaction affect the particle movement and erosion. The particle trajectory and erosion were calculated adopting an in-house code validated by Ghenaiet et al. [5,6] and used in other studies of turbomachinery erosions [19,20,21,22,23,24].
2. Fan Model
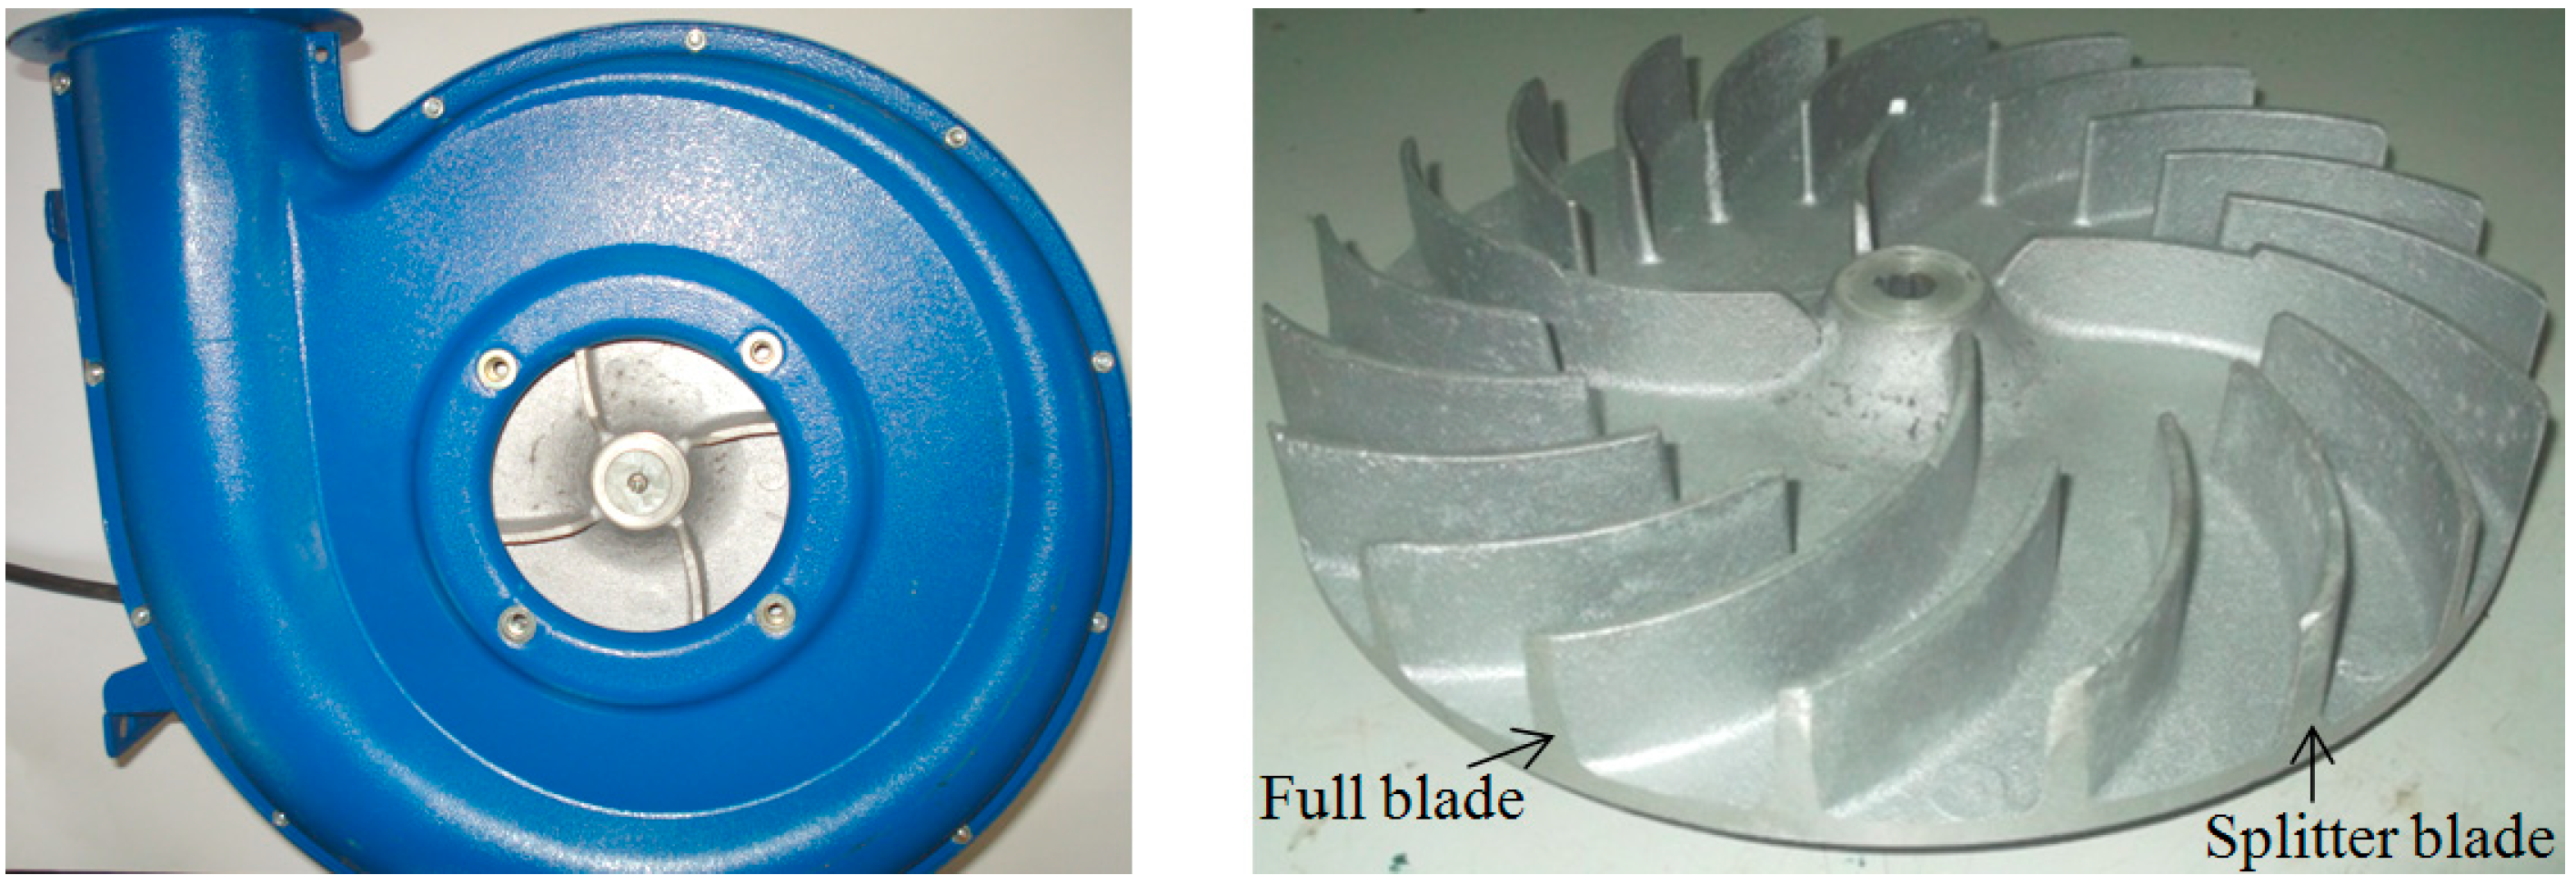
The centrifugal fan, shown in Figure 1(left), is constructed from an aluminum alloy and rotates at a speed of 2820 rpm. The unshrouded impeller (Figure 1(right)) consists of 4 full blades and 16 splitters with a forward-inclined design and an outlet angle of 30 degrees. The full blades provide flow guidance at the inlet and increase the impeller stiffness. The splitters are placed between the full blades to help direct the flow at the impeller outlet, enhancing the work transfer without obstructing the flow at the inlet. The fan has an outer diameter of 249 mm and an inner diameter of 89 mm. The height of the blades is 26.1 mm, and there is a 2.9 mm gap between the blades and the casing plate, which becomes larger along the extended parts of the full blades.

Figure 1.
Centrifugal fan (left) and impeller (right).
3. Flow Field Solution
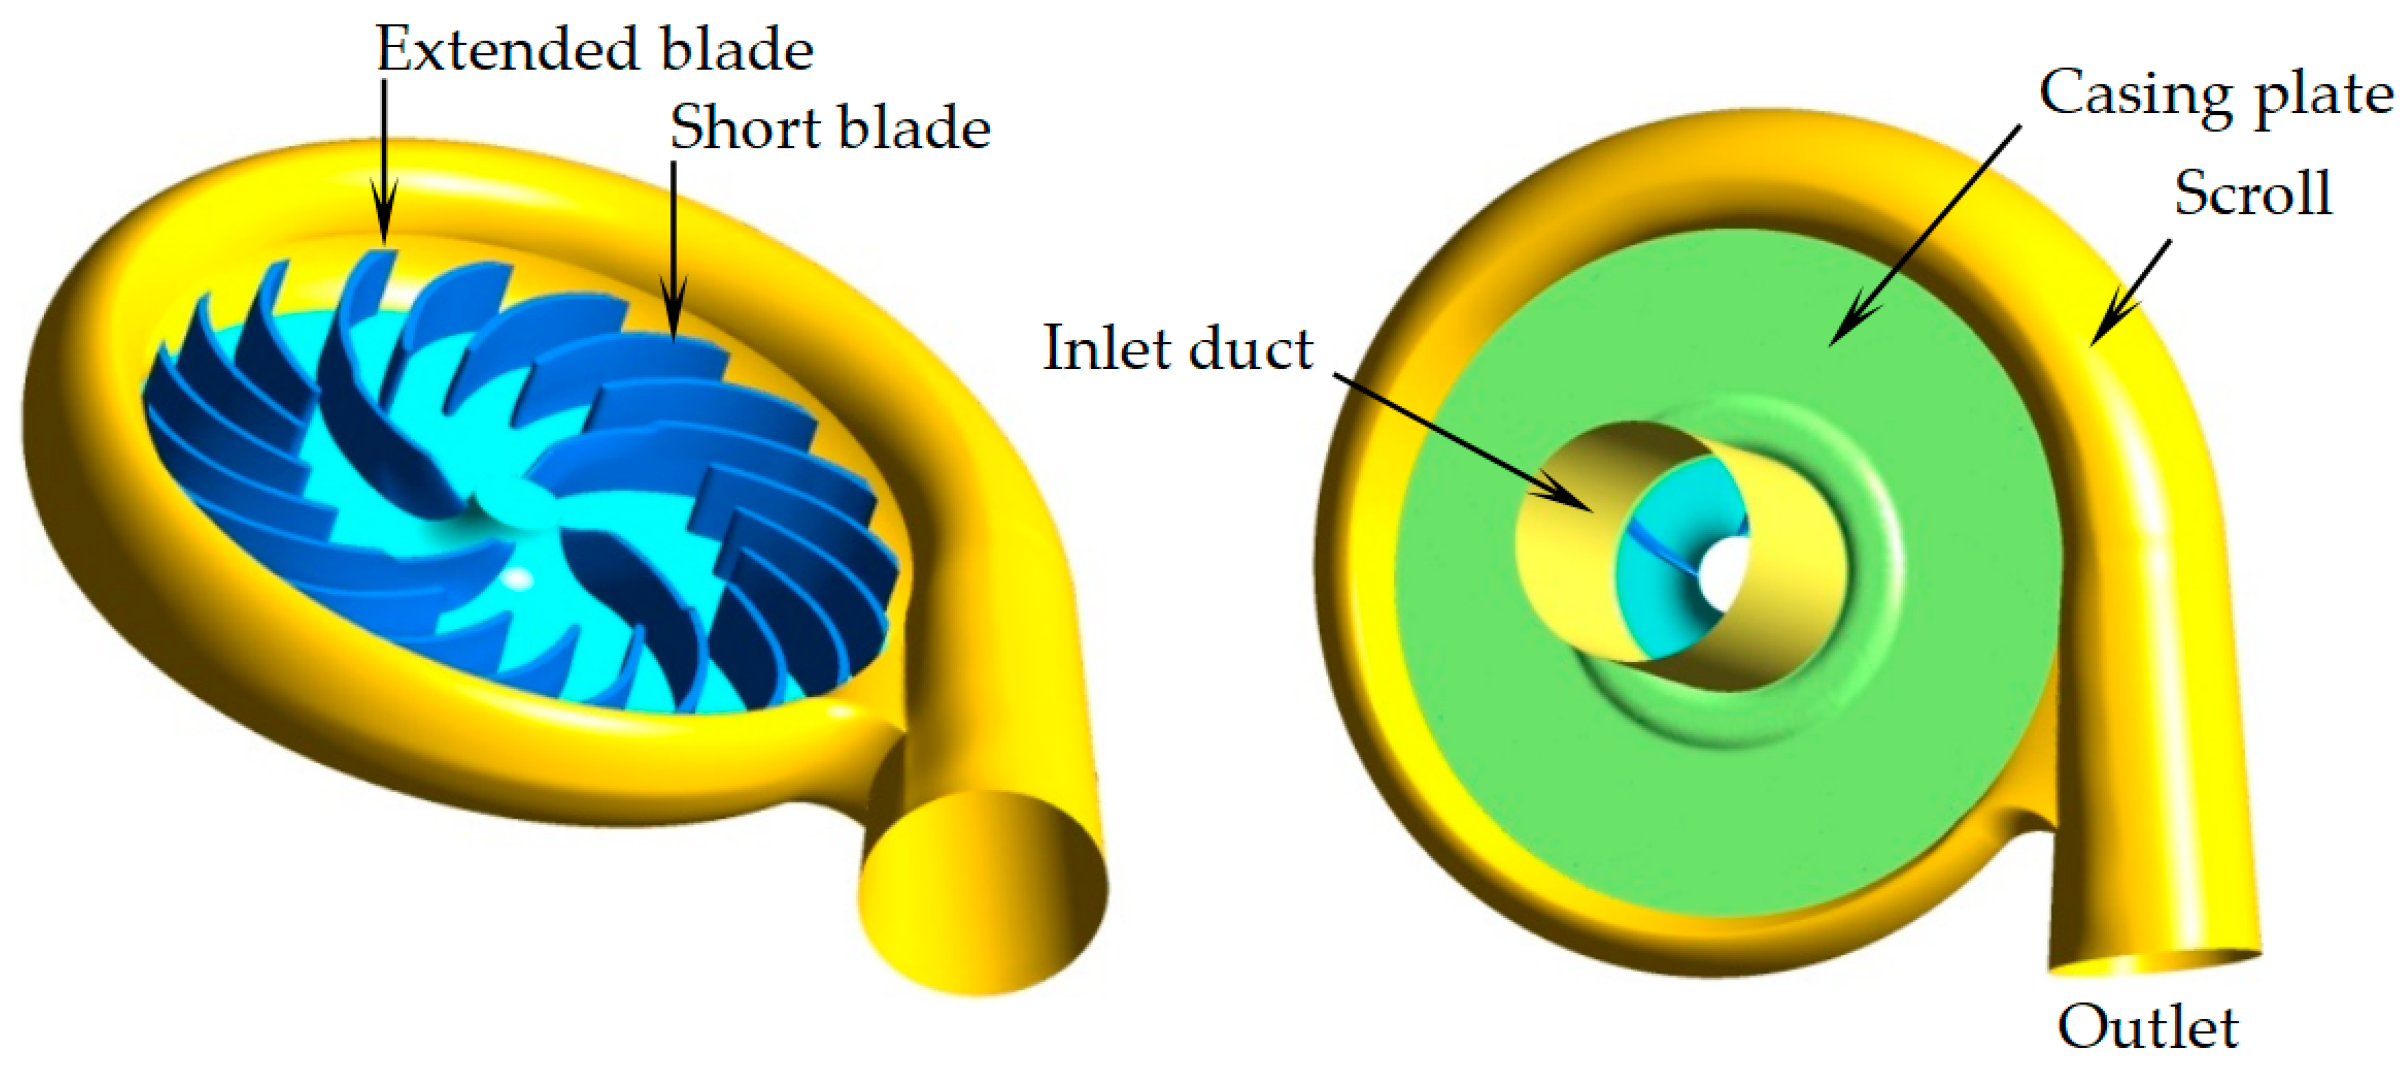
The flow in this centrifugal fan with forward blades is complex and asymmetric, and affected by the interaction between the impeller and the scroll. To accurately analyze this airflow, the computational domain (shown in Figure 2) needs to include the entire impeller and scroll.
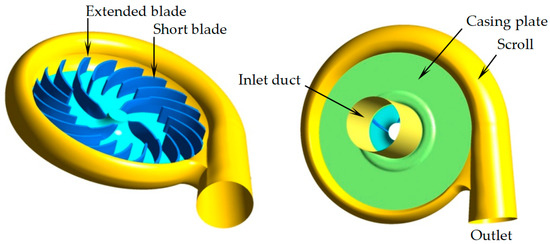
Figure 2.
Computational domain.
Different turbulence models capture the turbulence at different scales, with Direct Numerical Simulation (DNS) being the most accurate but computationally demanding and Large Eddy Simulation (LES) being more affordable but exceeding our computing capabilities. Despite its limitations in handling large separations, Reynolds-Averaged Navier–Stokes (RANS) turbulence models are widely used in the industry due to their simplicity and efficiency in producing reliable results. The flow analysis was performed using the CFX solver, with air being modeled as a real gas. The inlet conditions were set to the standard atmosphere values for total pressure and temperature and the mass flow rate at the scroll exit. The inlet turbulence intensity was specified at 4%, estimated from based on an empirical correlation for pipe flows [25].
3.1. Mesh Generation
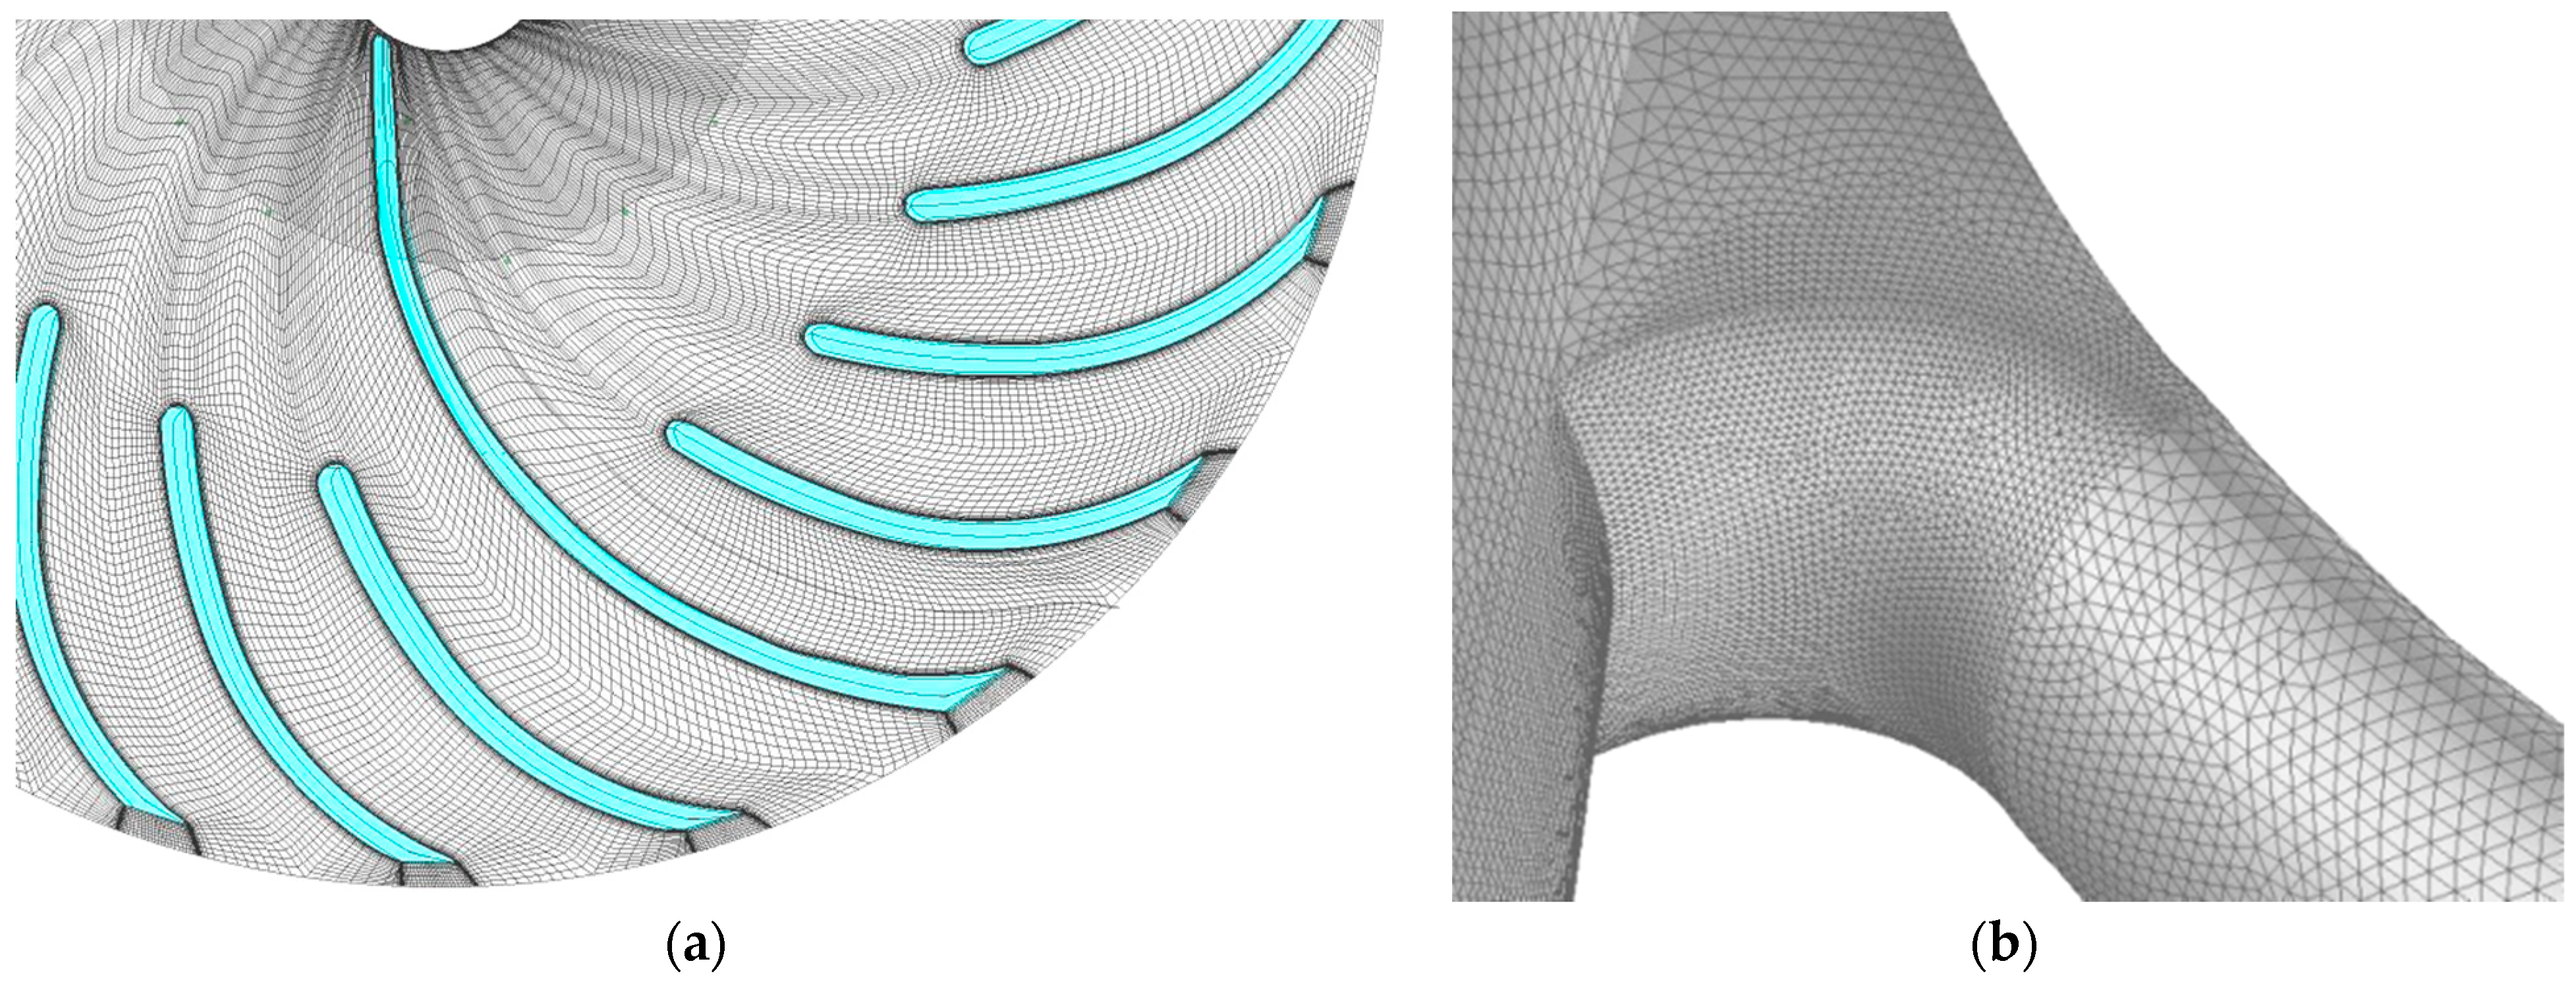
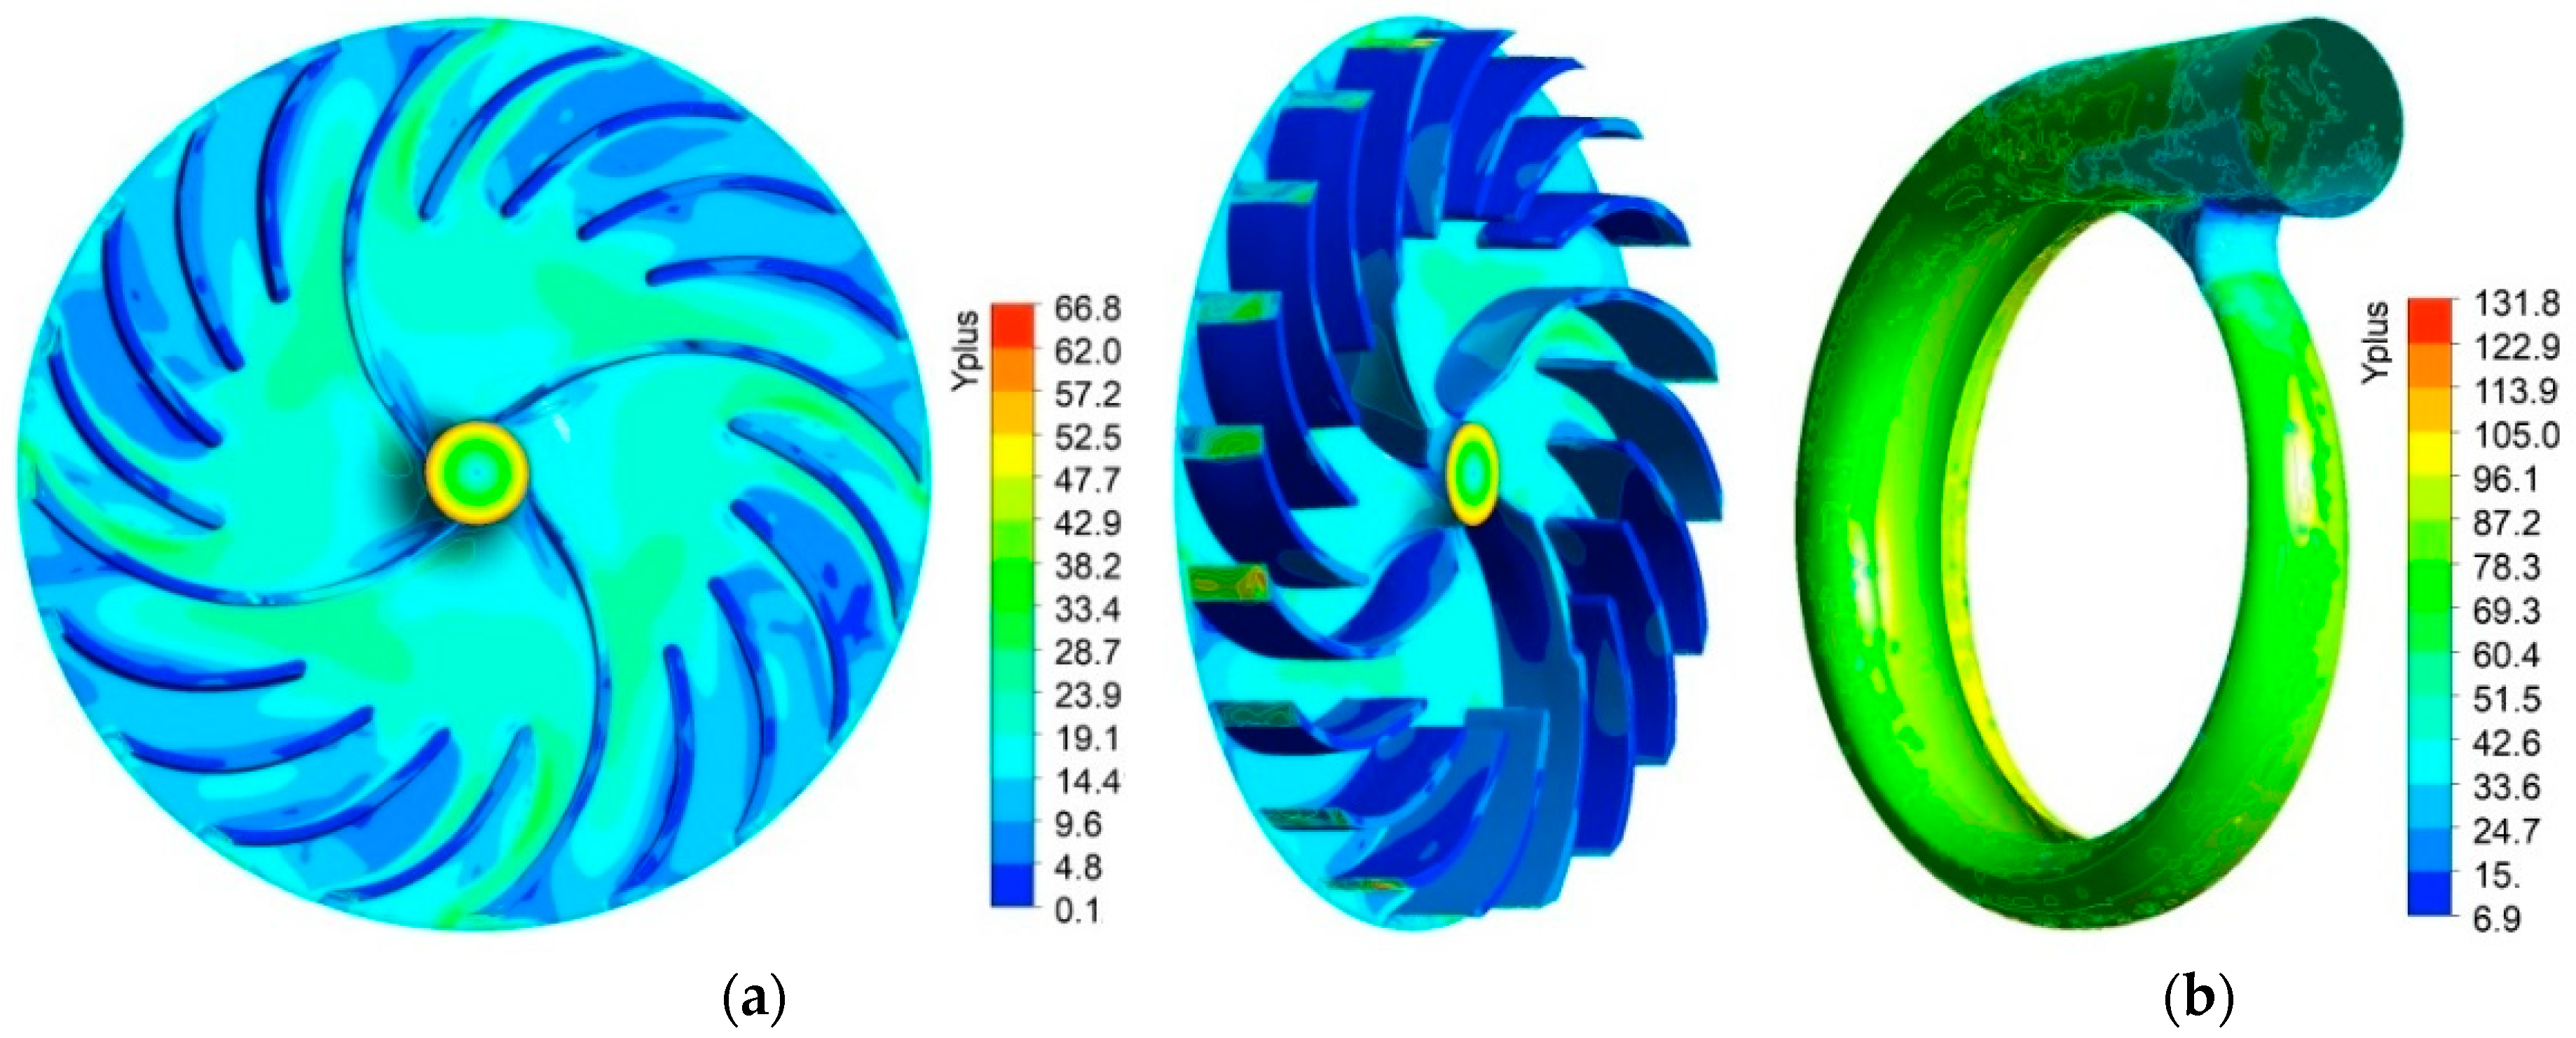
Hexahedral elements were used to mesh the inlet duct and impeller (Figure 3a) and tetrahedral elements for the scroll (Figure 3b). Near the blades, hub, and casing, the distance of the first node targeted the dimensionless parameter . The parameter , is the free velocity outside the boundary layer and the friction factor [26]. The Reynolds number () of the impeller blades is based on the blade chord, while the hydraulic diameter is considered for the scroll duct. The turbulence model kω-based SST allows switching between the low Reynolds model for a finer mesh and the wall function. Figure 4 shows that the y+ values are between 0.12 and 15 around the PS and SS and over the blade tip. As also observed, values of the hub do not exceed 40. Moreover, the highest values of are observed at the TE of blades and the impeller bulb, reaching up to 67. Furthermore, the scroll displays low values of around the critical region of the tongue, in contrast to the outer wall, reaching approximately 100.
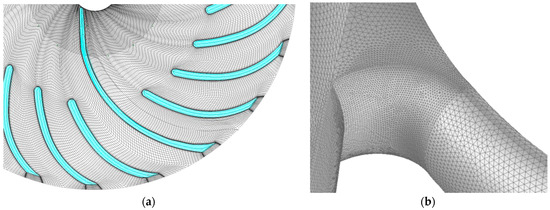
Figure 3.
Meshing of the (a) impeller and (b) scroll tongue region.

Figure 4.
Distribution of y+: (a) impeller and (b) scroll.
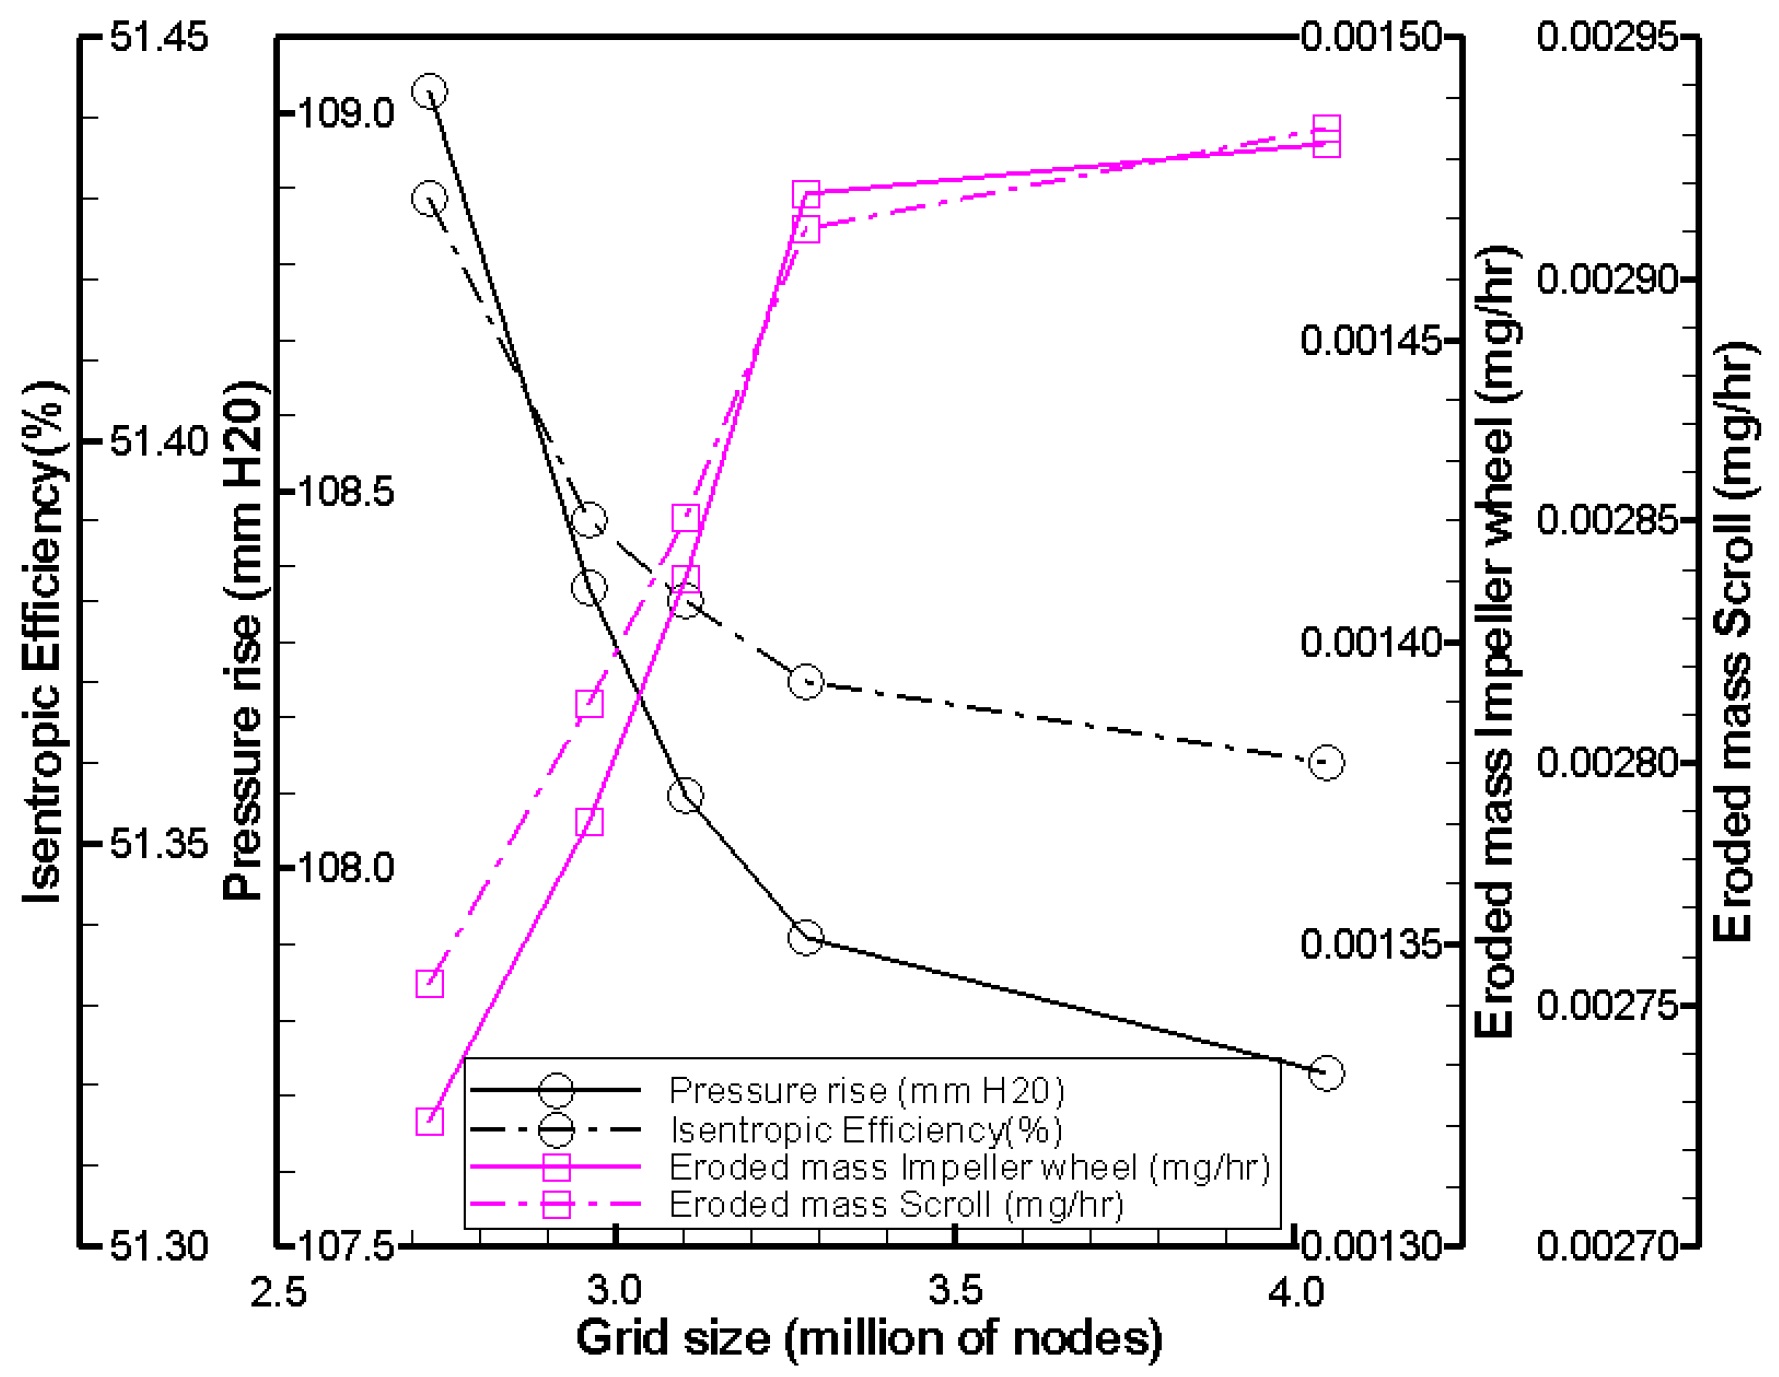
The independence of the grid size (Figure 5) was initially assessed in relation to the fan performance that exhibited slight variations beyond the fourth mesh size. Moreover, when examining the erosion predicted at the nominal point and a particle concentration of 500 μg/m3, there was no noticeable change in the hourly eroded mass of the impeller and scroll beyond the fourth mesh size. In conclusion, the grid size of 3,281,648 nodes was considered acceptable (given the computational resources) to compute both the flow field and the particle trajectory.
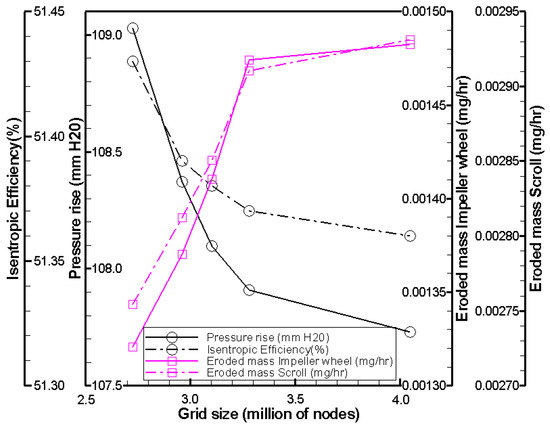
Figure 5.
Grid size independence verification.
3.2. Flow Results
3.2.1. Fan Performance
A high-resolution scheme was used for the advection terms in the equations of momentum and turbulent model in the steady RANS flow solution. The fixed value of the time step equal to 1/ω (ω is the rotational speed in revolutions per second) was used over the entire domain. The convergence criterion is based on reducing the root mean square residuals to the level of 10−6. There are two options available for modeling the rotating parts in CFX code: The frozen rotor interface is most effective when there are significant circumferential variations in the flow properties. This interface connects the stationary and rotating frames in a way that ensures fixed relative positions, allowing for a steady solution to be obtained for the multiple frames of reference and accounting for interactions between them. On the other hand, the stage interface is more suitable when the circumferential variation of the flow is of the order of the component pitch. This interface uses a quasi-steady algorithm that averages the discrete fluxes through the interface and applies them as boundary conditions to the adjacent zone. This is the interface plane, which is commonly used for predicting the aerodynamic performance.
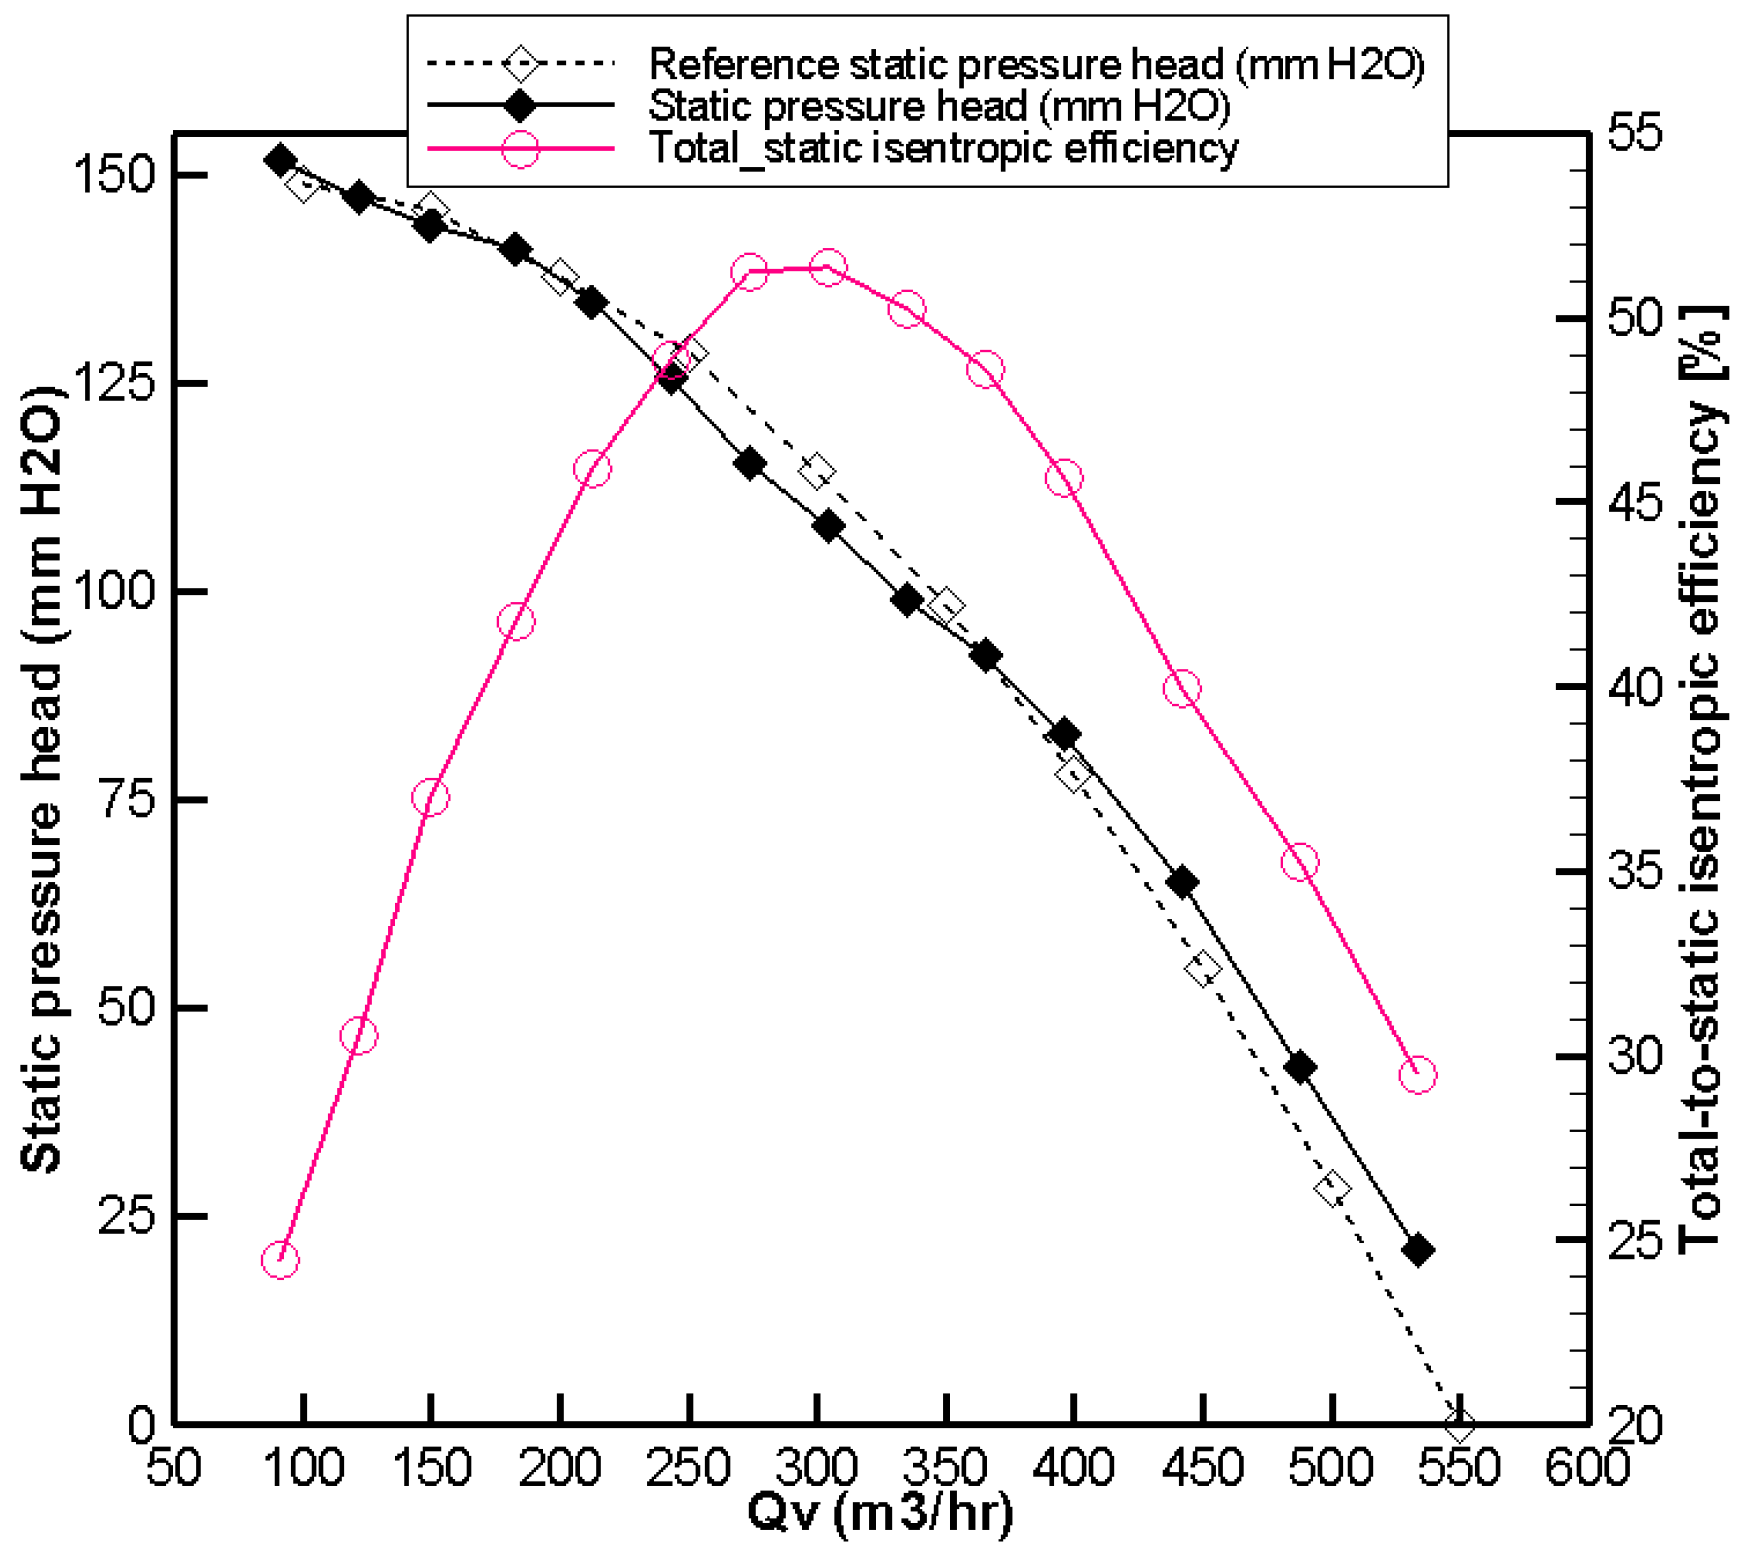
Evaluations of different parameters and properties at the inlet and outlet from the computational domain used the circumferential mass averaging. The performance parameters are given in terms of the static pressure rise (pressure head) in mmH2O and the total-to-static isentropic efficiency . The net power is derived from the torque obtained by integrating the static pressure , across the impeller total surfaces ∑, including the full blades, splitters and hub. In Figure 6, the pressure head displays a steep slope starting from the maximum flow rate and then flattens as it approaches the unstable branch. The total-to-static isentropic efficiency follows an almost parabolic pattern, reaching an efficiency of 51.37% at the nominal point corresponding to a volume flow rate QN = 304.2 m3/h and a rotational speed of 2820 rpm. At the minimum flow rate, the predicted = 151.6 mmH2O, close to the measured value of 150 mmH2O (Figure 6), while, at the maximum flow rate, the predicted = 20.8 mmH2O compared to the measured value of 9.9 mmH2O. At the nominal point, the predicted = 107.9 mmH2O is close to the measured value of 113.1 mmH2O. A comparison between the calculated and measured pressure head shows a reasonable agreement at the nominal point within 4.6% and an acceptable error along the full range of flow rates. This impeller design, with a large hub-to-tip ratio and inlet area, is characterized by a high exit whirl velocity component. The forward-curved blades seem to produce a greater pressure rise compared to the backward-curved blades of the same diameter and rotational speed.
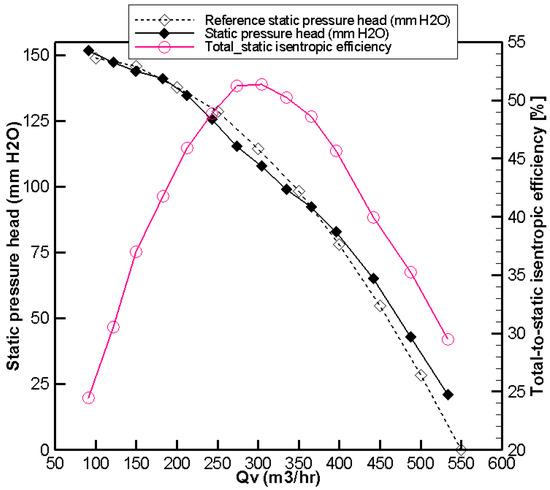
Figure 6.
Computed performance compared with reference (dashed line).
3.2.2. Flow Characterization
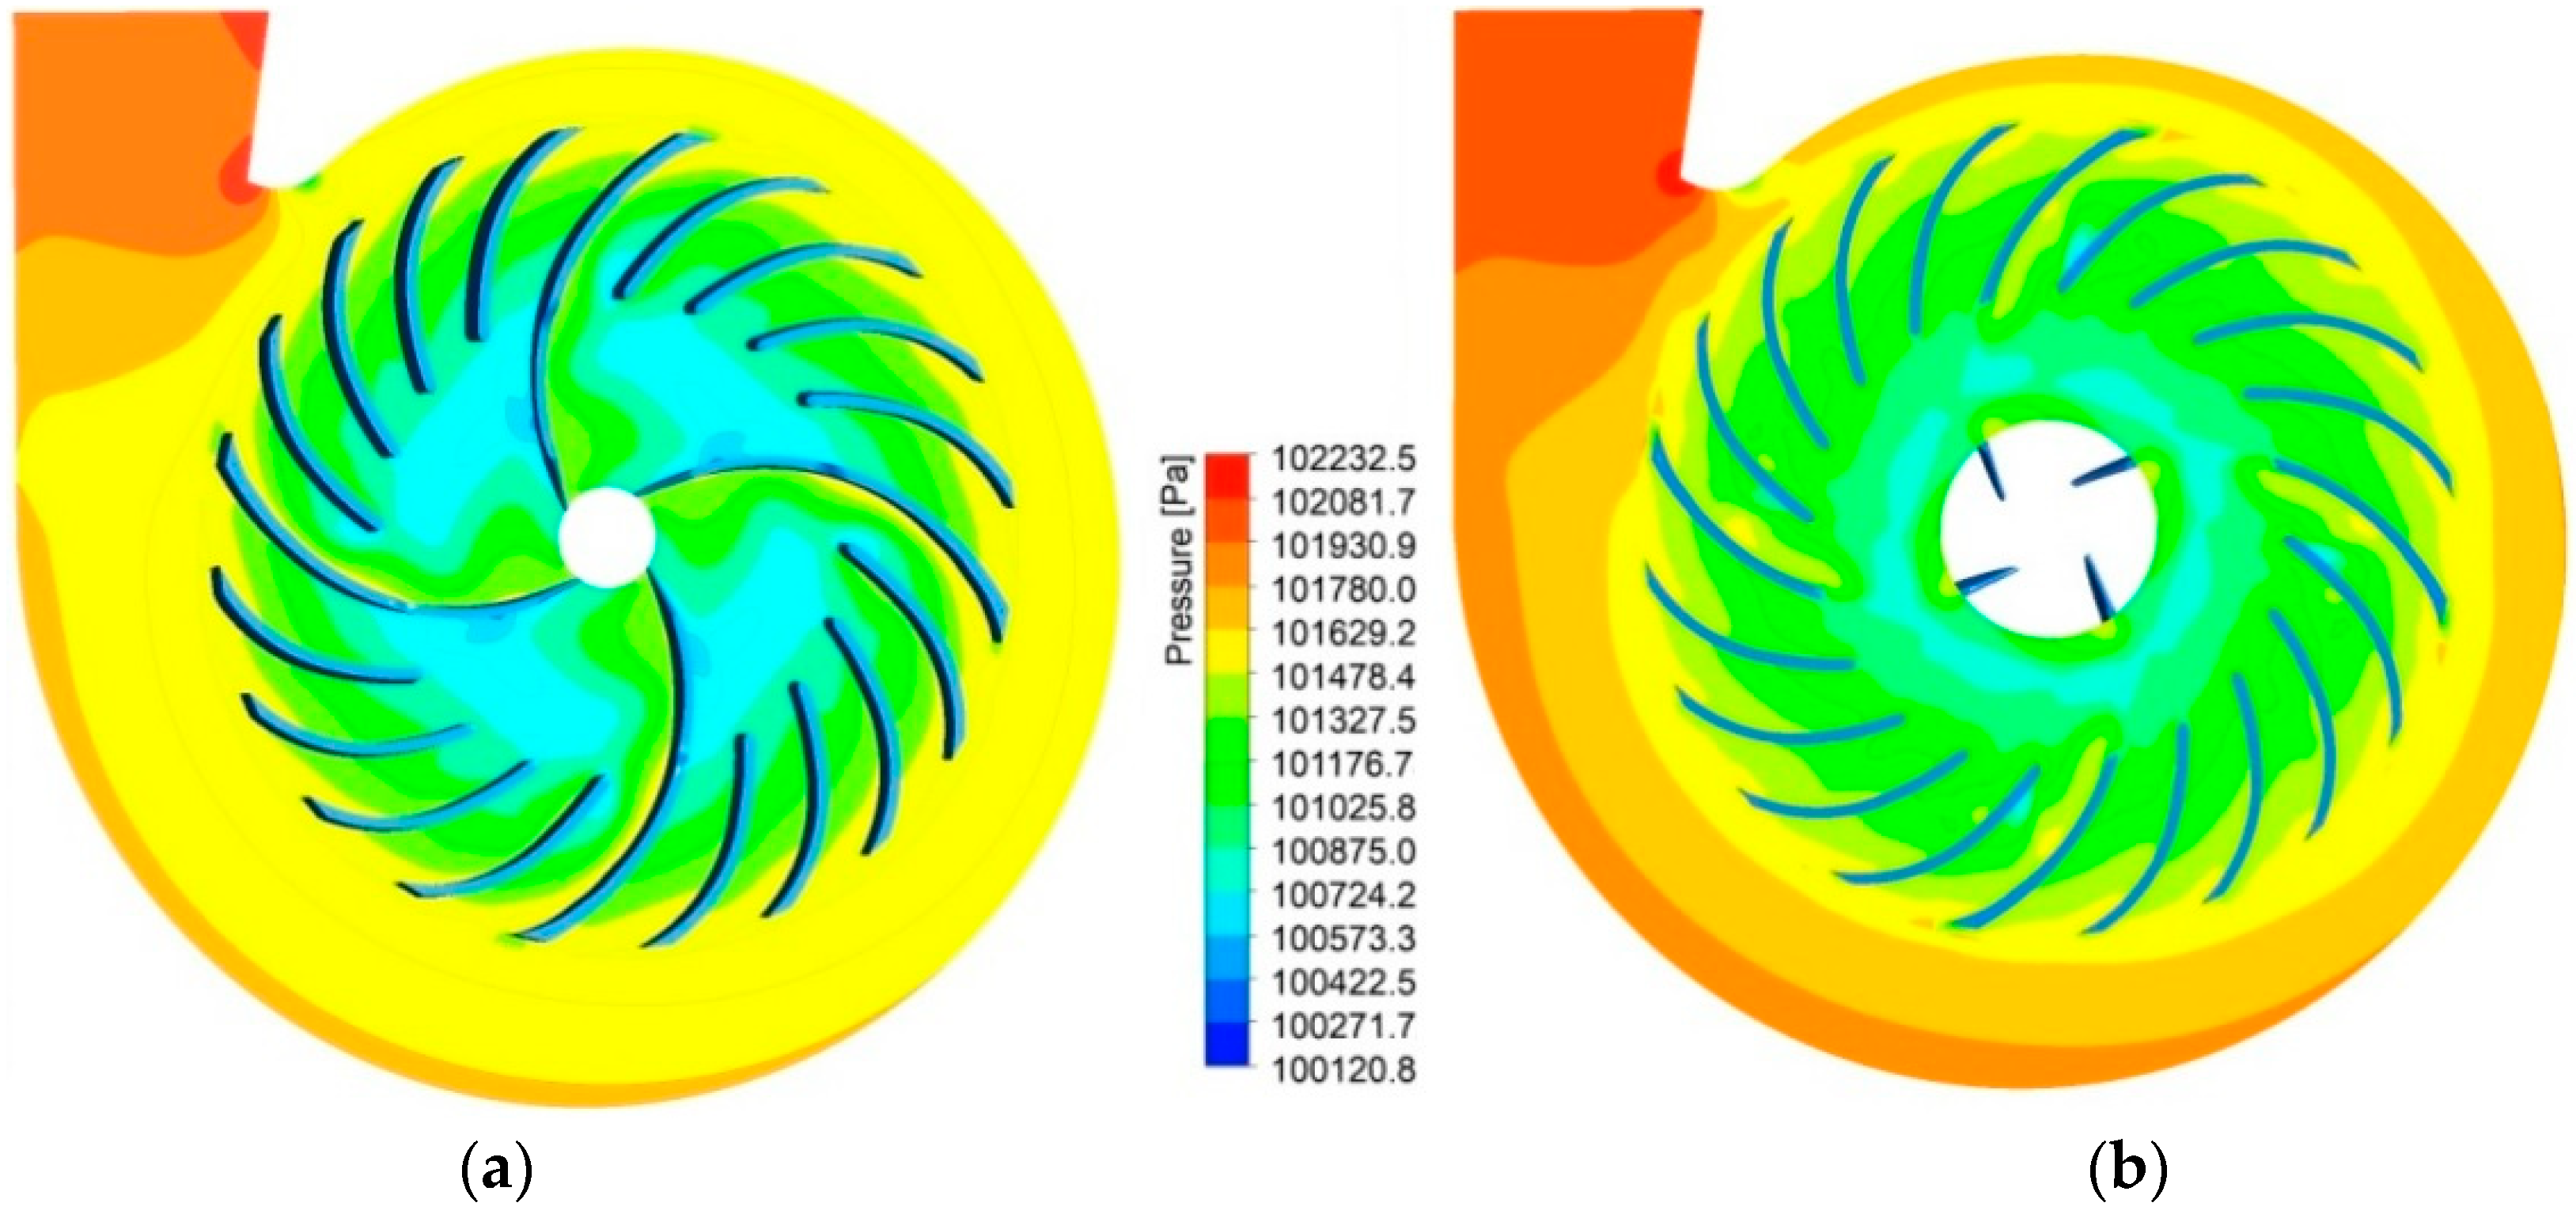
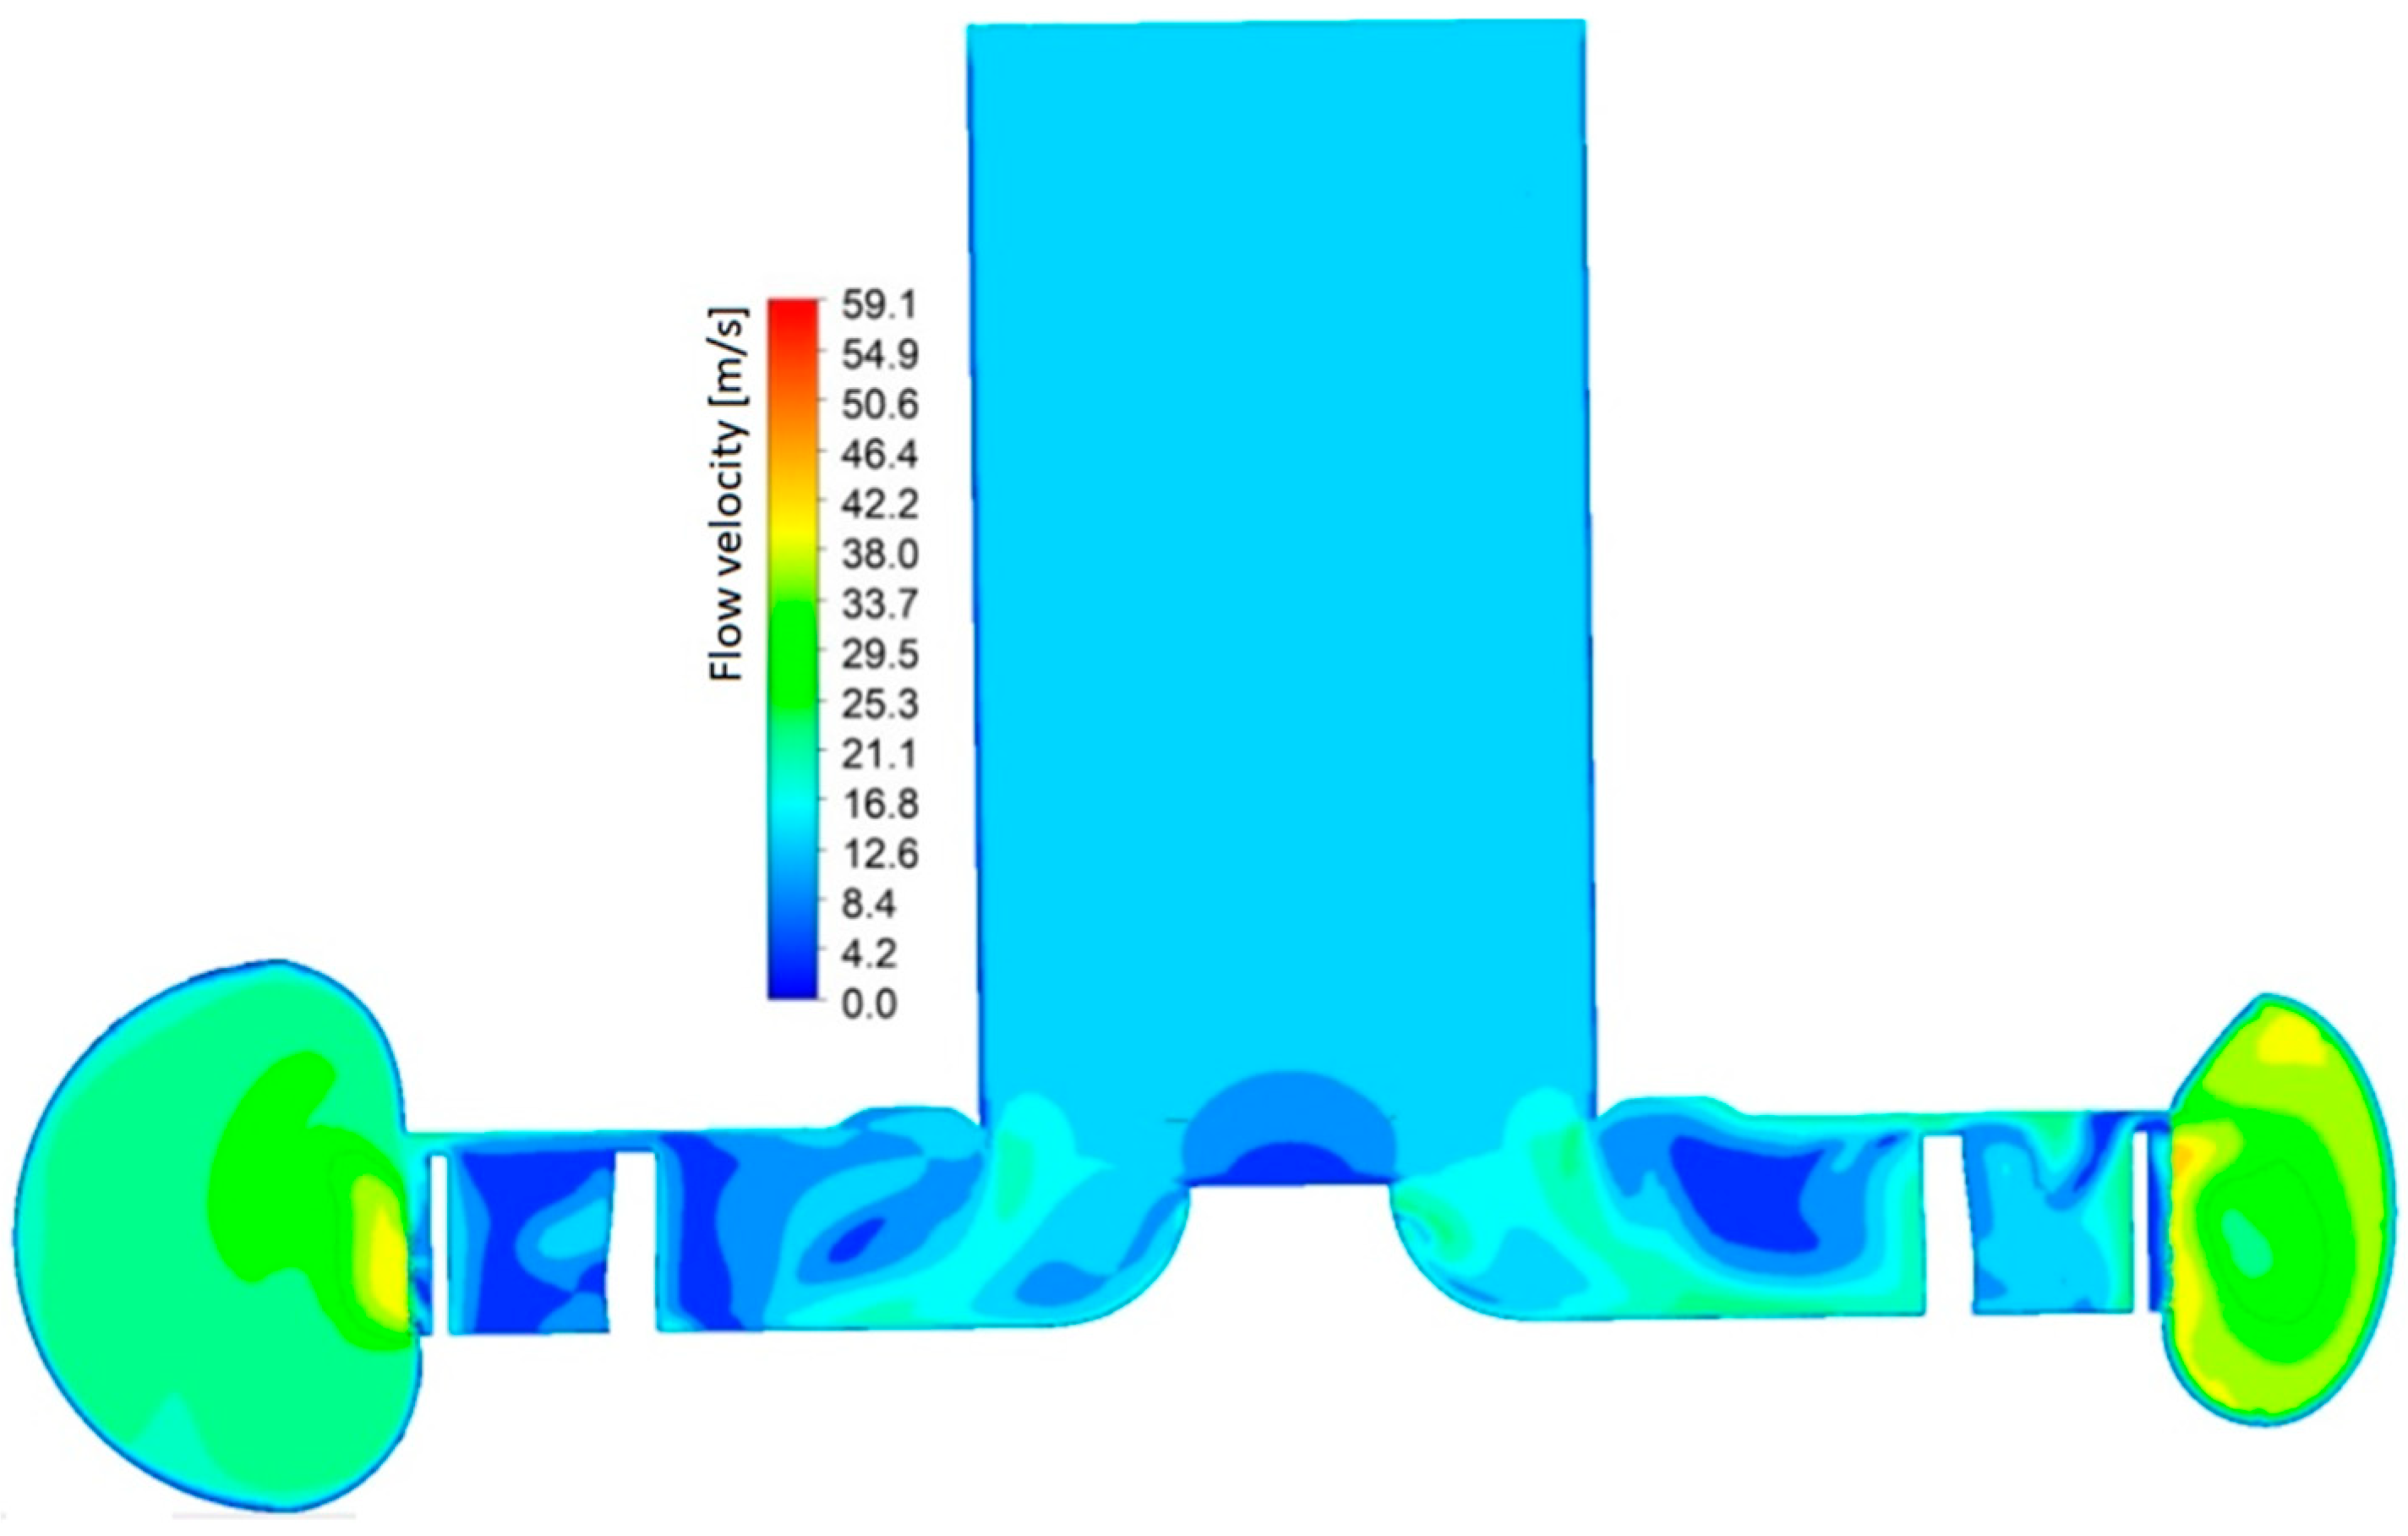
Even when operating at the nominal conditions, the impeller of this centrifugal fan with forward-curved blades displays intricate flow patterns, such as vortical flows and recirculations, inadequate flow guidance at the blade entrance, and non-uniformities at the exit of impeller blades. Figure 7 depict the diffusion process at the mid-span and near the tip of the blades and splitters, and along the scroll. There are large pressure differences between the blade sides, with a marked decrease near the hub as the flow turns from axial to radial direction. The upper sections of the blades experience higher loads than the lower sections. The outer sections of the scroll have higher static pressure, typically towards the exit, while the tongue has the lowest static pressure and the highest dynamic pressure. Higher static pressure is displayed (Figure 7b) at the upper sections of blades and splitters. Figure 8 displays contours of flow velocity plotted at a the meridional plane halving the fan components. The flow arrives axially at the inlet of impeller and caused a large separated flow over the front of admission section, followed by a flow turning to the radial direction where a large stagnation region is formed with high losses. The flow patterns exhibit dissimilarities between the channels of the full blades and splitters. The lowers sections of impeller are characterized by higher velocities compared to the upper sections, where the large gap and cavity over the full blades depict large circulating flow. The flow exits the impeller in the form of jet and wake discharging to the scroll. Thereafter, the flow is animated by high rotational component that diffuses along the toroidal section of the scroll.
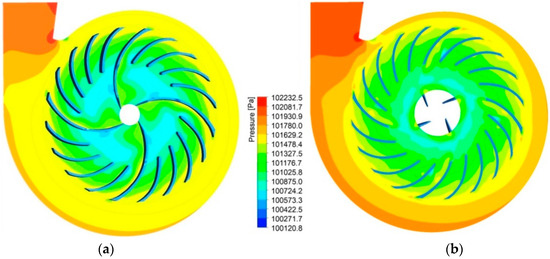
Figure 7.
Static pressure at (a) mid-span and (b) near blade tip.
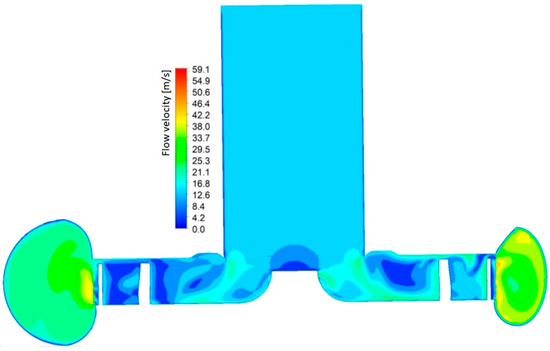
Figure 8.
Flow velocity at the meridional plane halving the fan components.
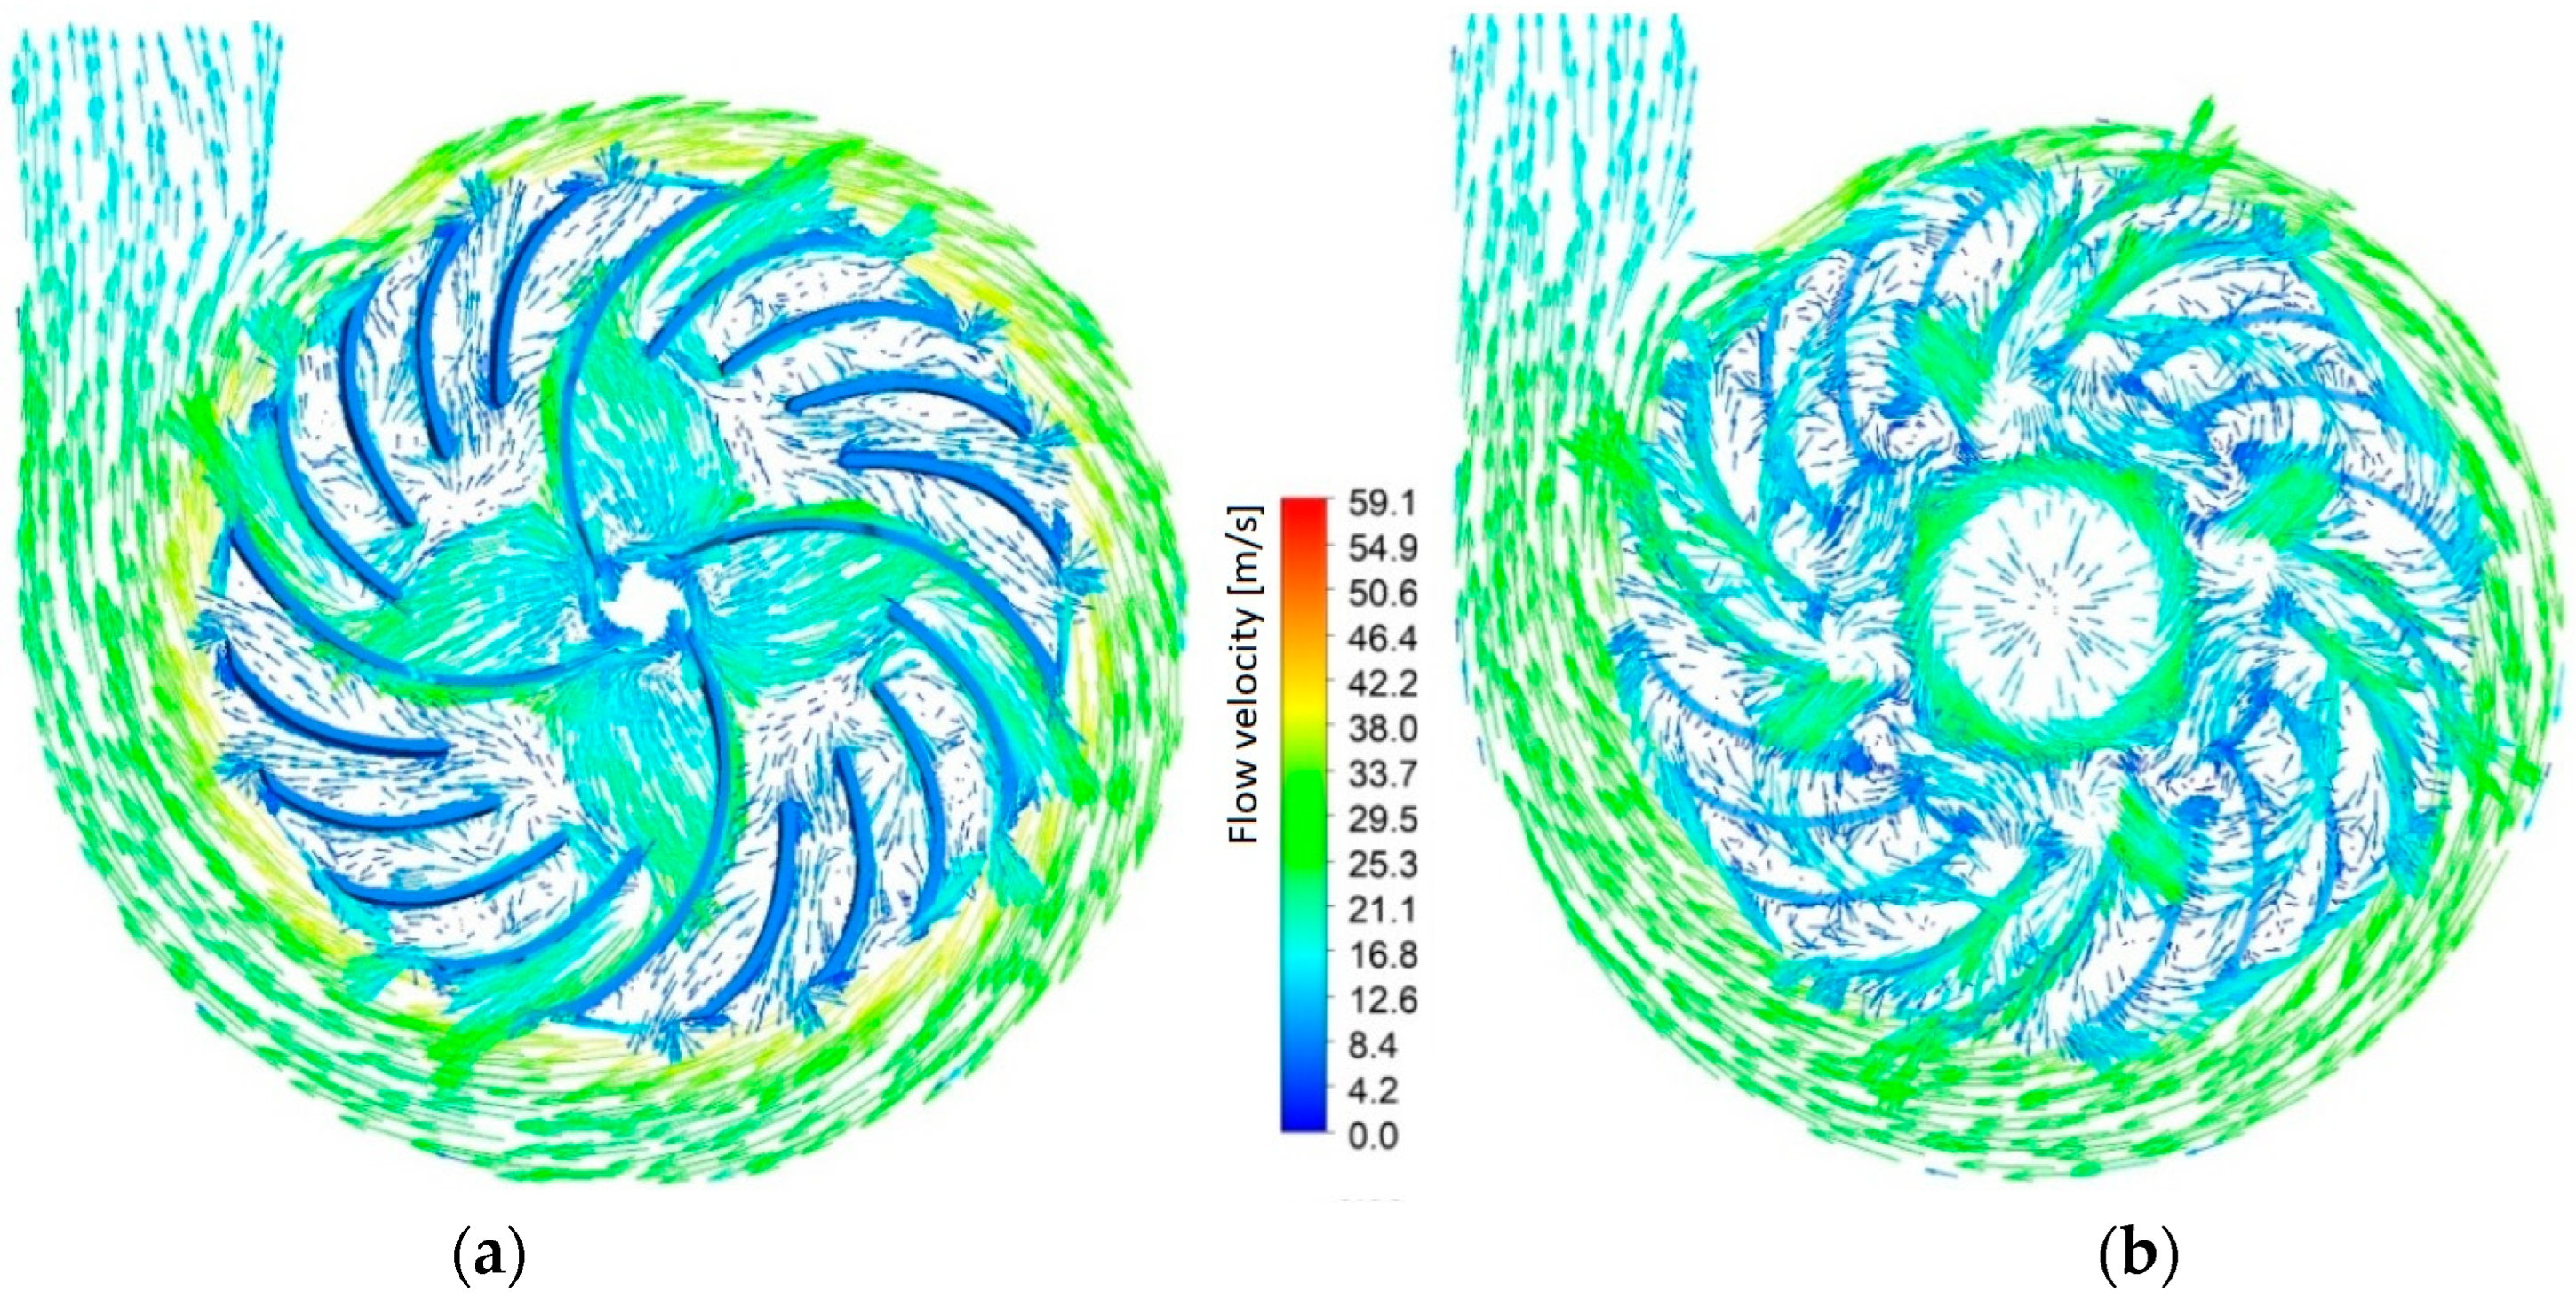
Figure 9 depict vectors of the flow velocities at the mid-span and near the tip of blades and splitters, and along the scroll. As the flow enters the impeller through an annular section, at the bent region of the impeller eye large flow recirculations occur. The flow arrives at the forepart of the full blades in high direction angles, and such flow conditions affect the relative flow angle at the blade, triggering significant separations and local flow recirculations. Also, the splitters present large separations observed from the SS. The upper sections of the full blades and splitters depict more flow separations and recirculations. At the upper sections of blades and splitters near the tip a significant leakage flow is observed (Figure 9b), with evidence of large vortical zone of stalled flow. The velocity distributions between the blades vary significantly, indicating asymmetrical flow characteristics in this centrifugal fan design. Over the full blades higher velocities are shown compared to the splitters. At the scroll interface, high jet flow and wake structure occurs, added to the jet formed at the scroll tongue until an azimuthal position of 90 degrees. At three-quarters of the scroll, the high flow velocities gradually convert into static pressure. A significant decrease in velocity is observed at the straight discharging duct, marking the end of the diffusion process.

Figure 9.
Flow velocity at (a) mid-span and (b) near blade tip.
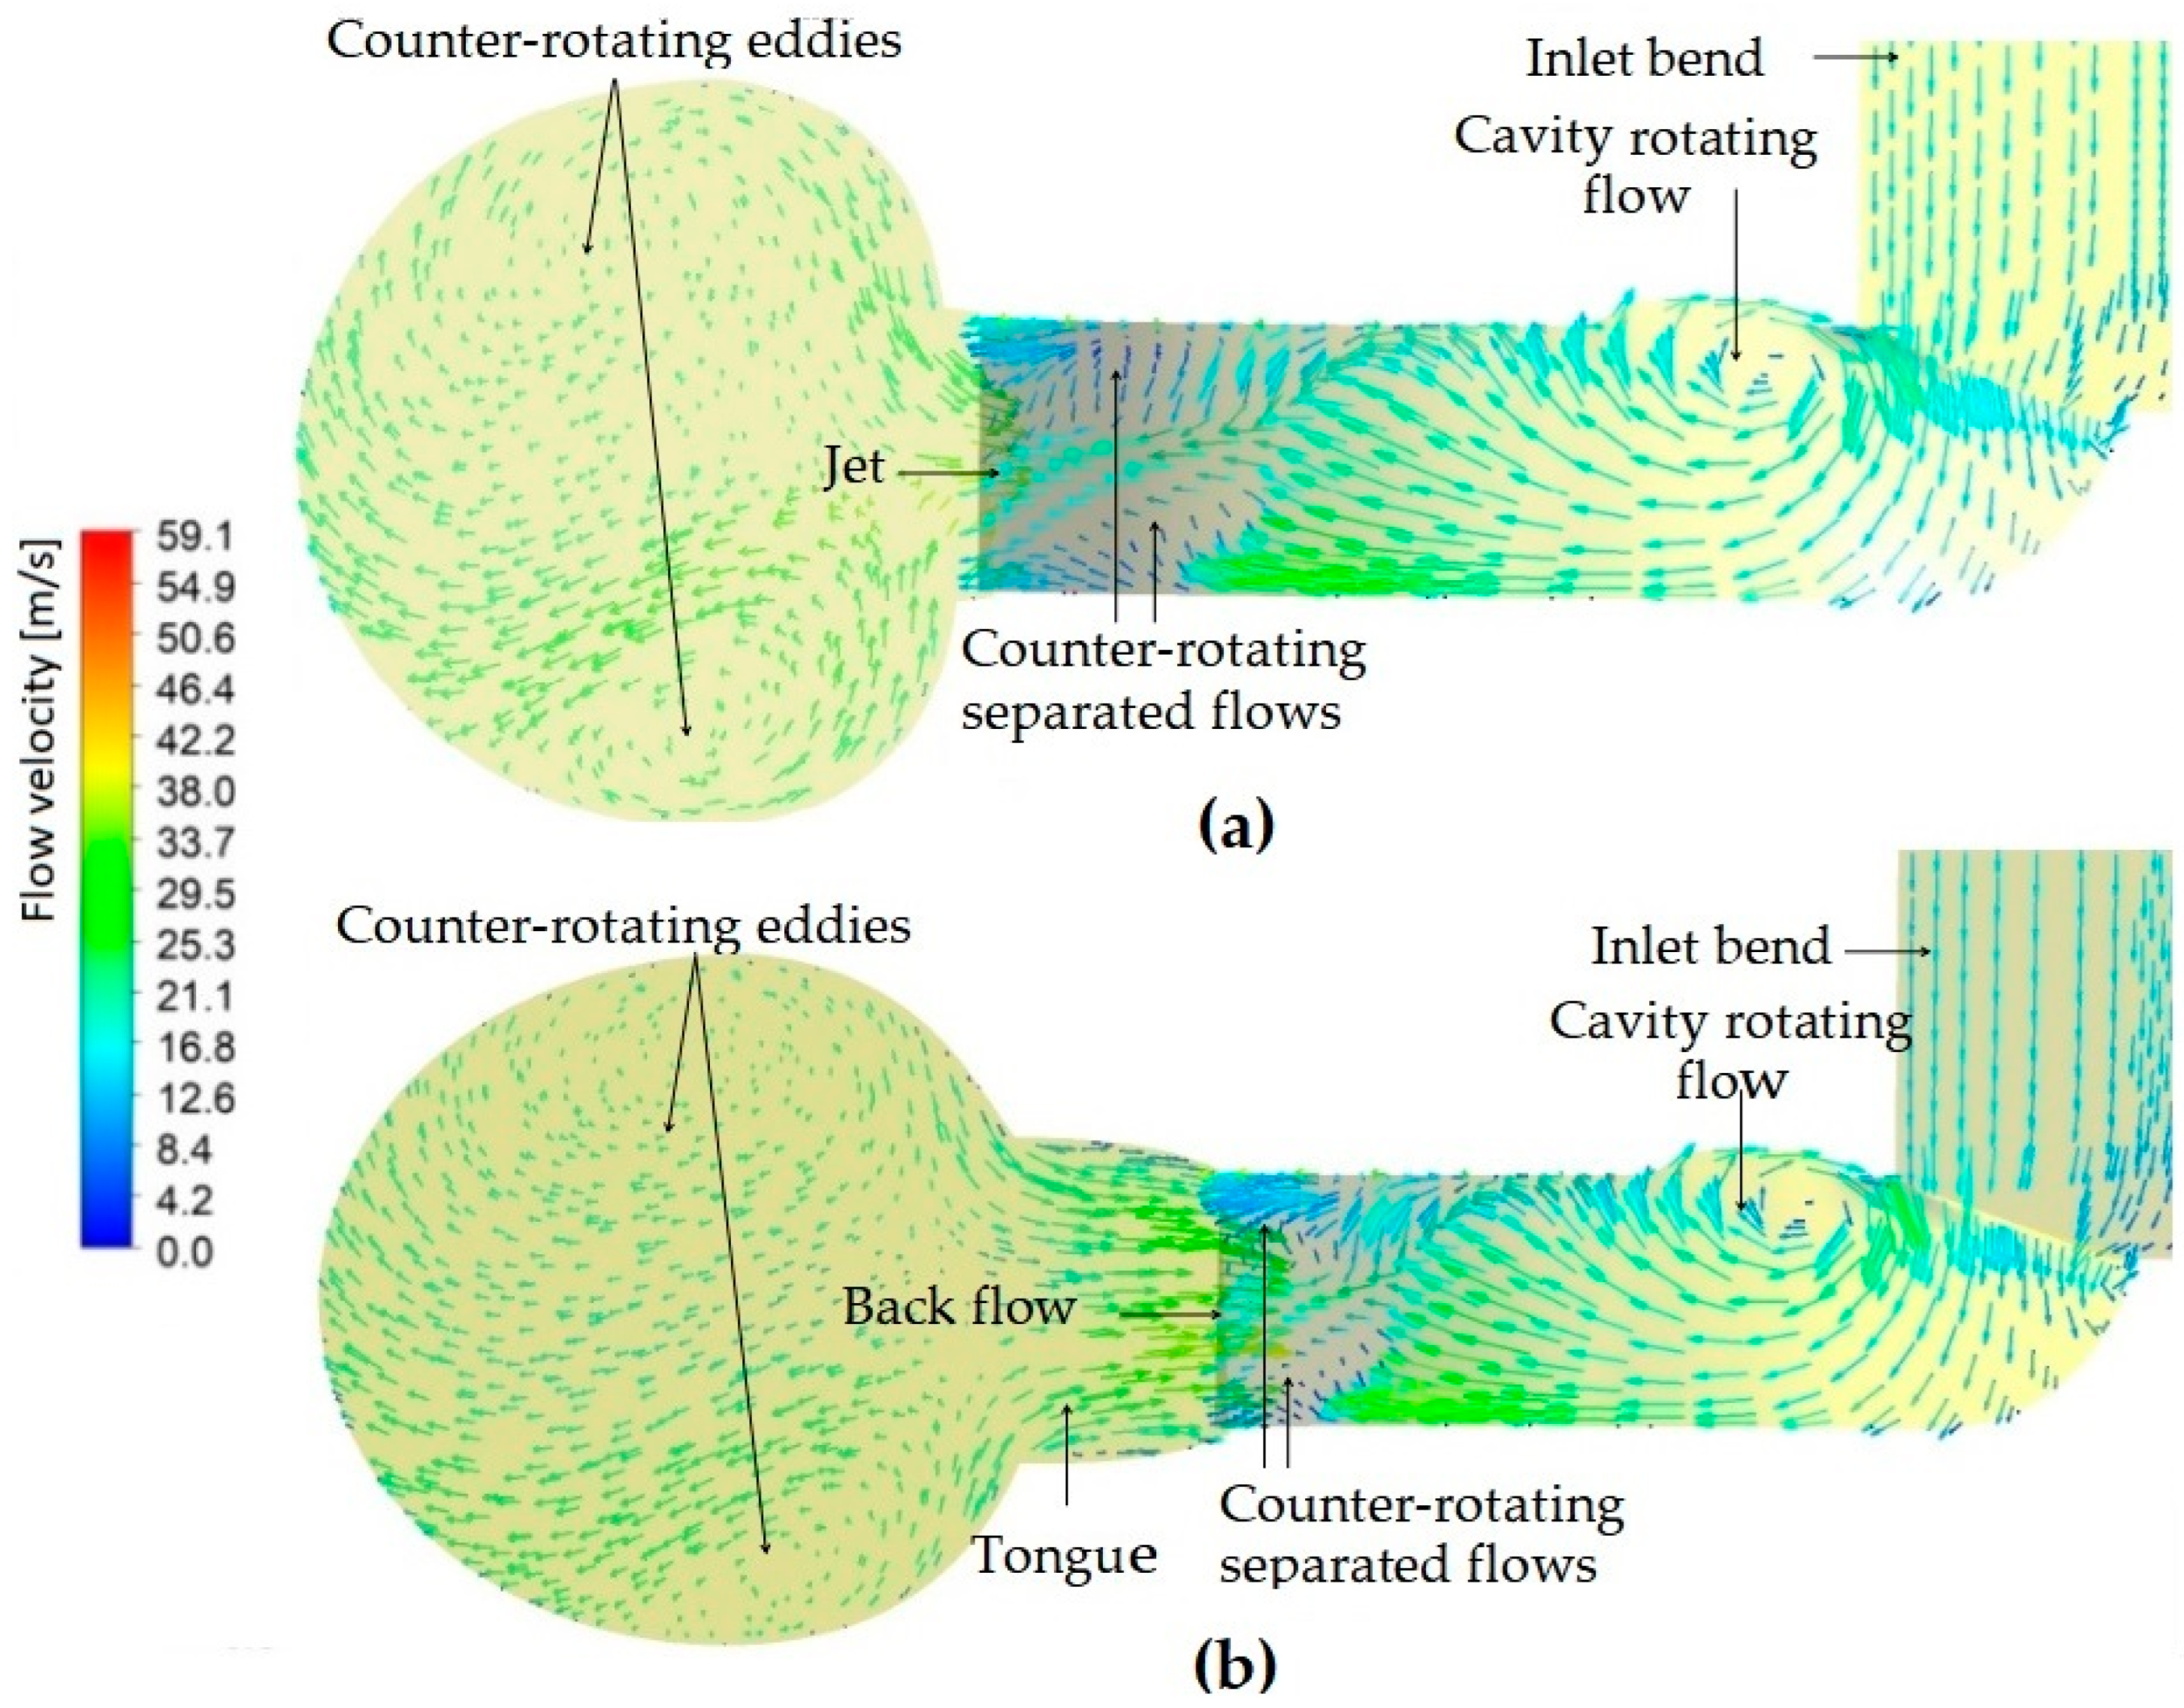
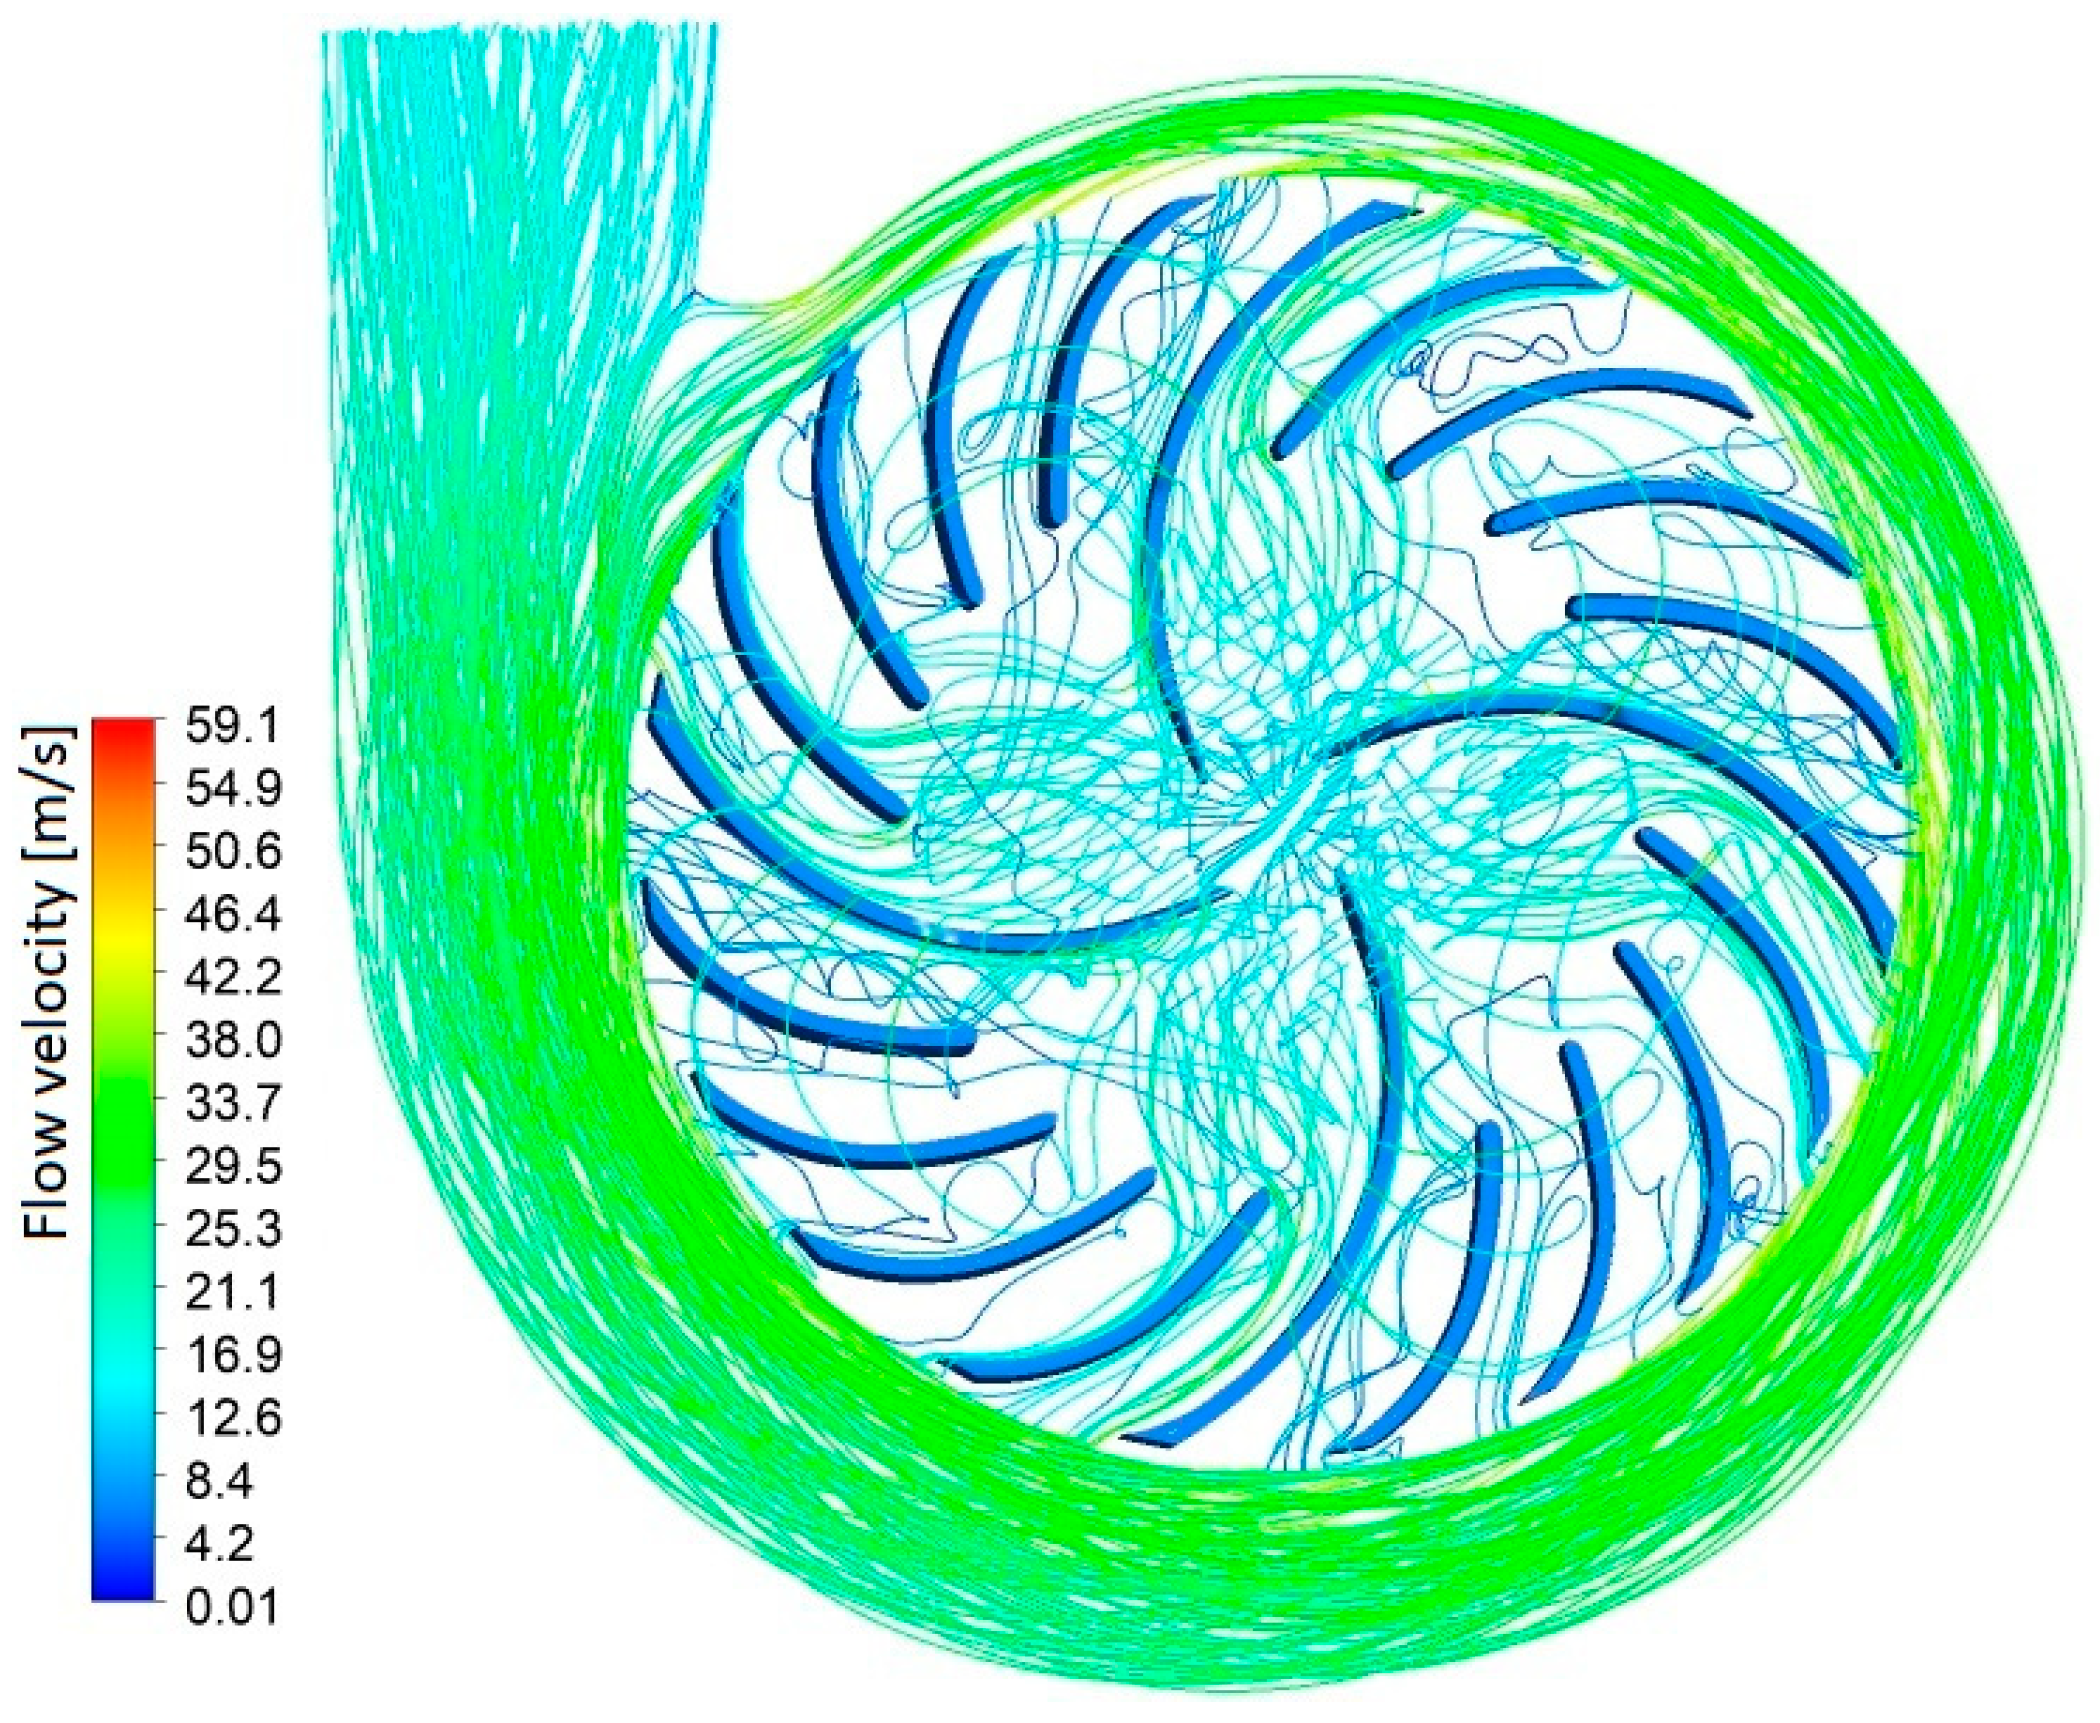
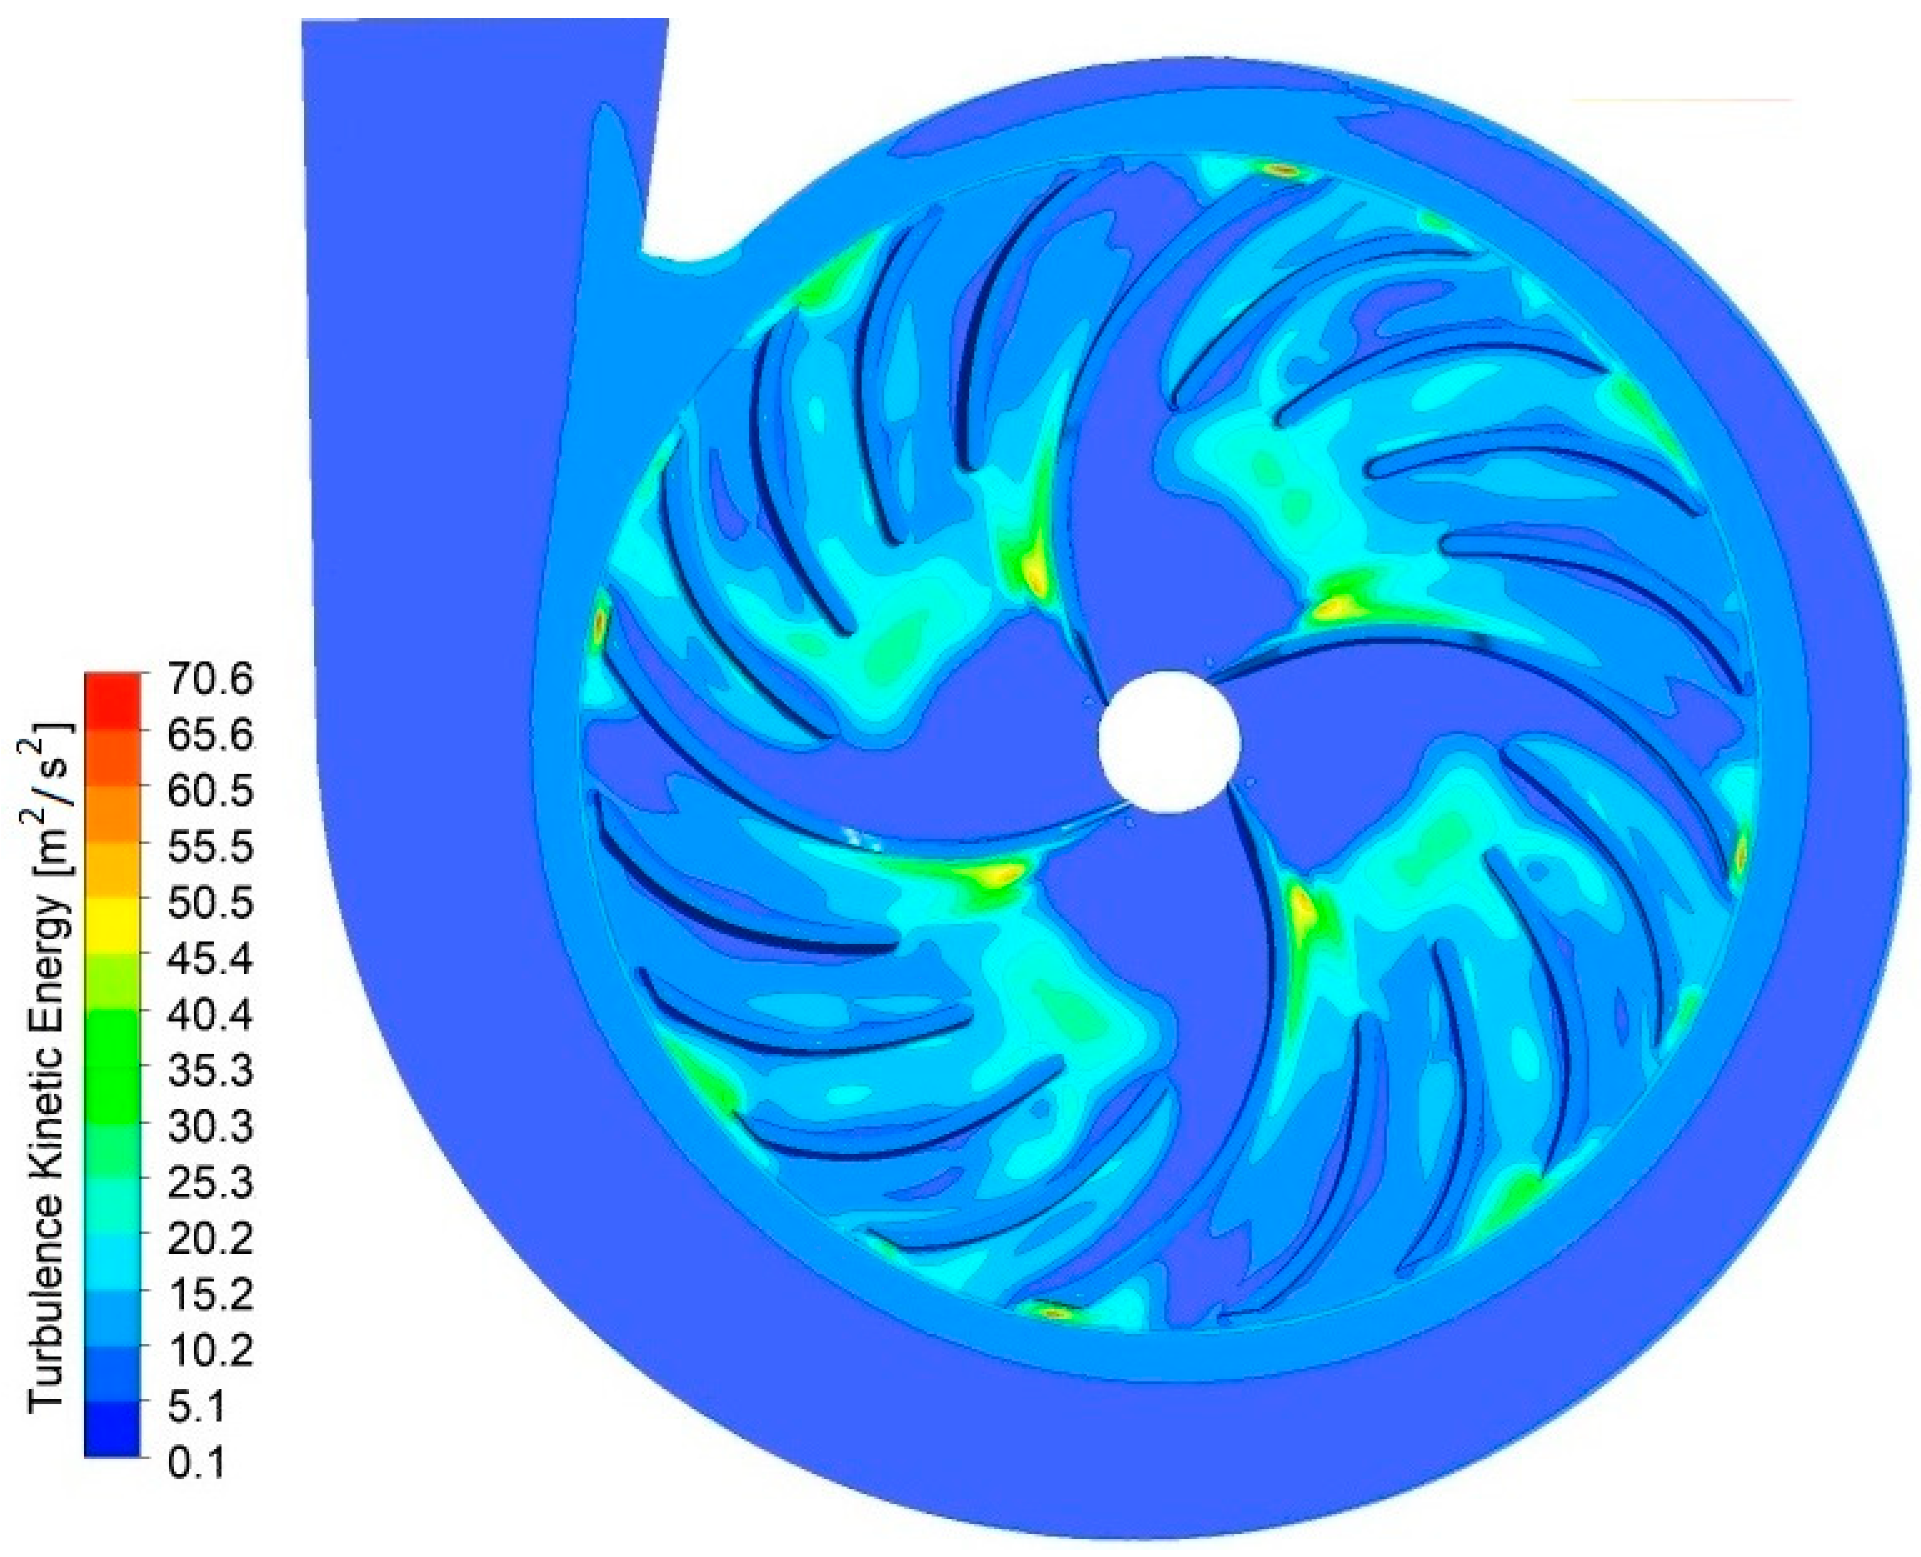
The flow details in two meridional planes are presented in Figure 10. The first plane is near the straight part of the scroll, while the second plane cuts the tongue section. The flow field features highly vortical structures, with the first occurring in the shroud cavity and the second near the exit of the impeller, as seen in Figure 10a. The scroll is characterized by two large counter-rotating eddies that occupy the entire cross-section, separated by a jet flow discharging into the scroll. Due to the blockage at the tongue, some fluid recirculates in the volute to pass through the impeller inlet, as seen in Figure 10b. The vortices at the tip of the blades and near the hub mix with the backflow from the tongue, and thus lead to large separated flows. As observed in Figure 11, the inlet section to the impeller has an asymmetrical distribution of the flow velocities in the tangential direction. Further examination of the flow structure at different cross-sections reveals large, separated flows originating from the LE, which increase in size along the SS of both full and splitter blades. The jet flow is more prominent on the PS of the full blades, while the largest wake formation occurs on the SS of the same blades. The wake and jet appear to spread out more between the splitters. The interaction between the volute tongue and the impeller wake causes premature flow instabilities in this forward-blade design. The flow streamlines, as shown in Figure 12, exhibit distinct flow patterns that characterize this centrifugal fan with forward-curved blades, including a strong vortical flow, large eddies, separated flows, and recirculations. These complex flow patterns are more noticeable within the splitters compared to the full blades. Finally, the turbulent kinetic energy (Figure 13) demonstrates the highly turbulent nature of the flow, particularly at the entrance of the splitters and the exit of the impeller, while the turbulence along the scroll is relatively uniform.

Figure 10.
Meridional flow velocities near (a) the exit from the scroll and (b) tongue.
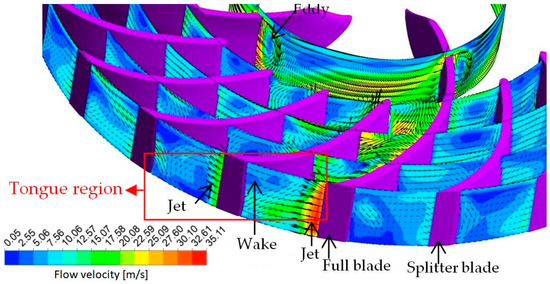
Figure 11.
Flow structures at cross-sections of the impeller.
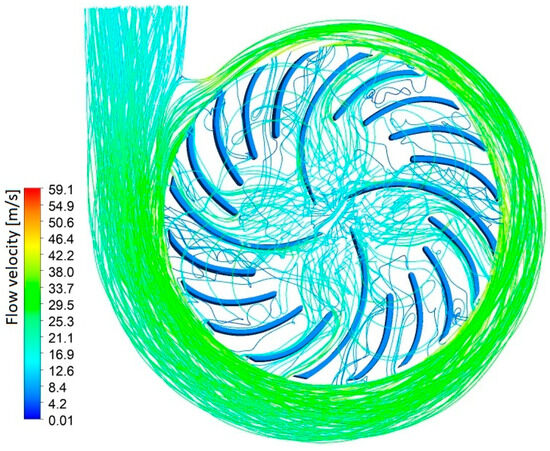
Figure 12.
Flow streamlines.
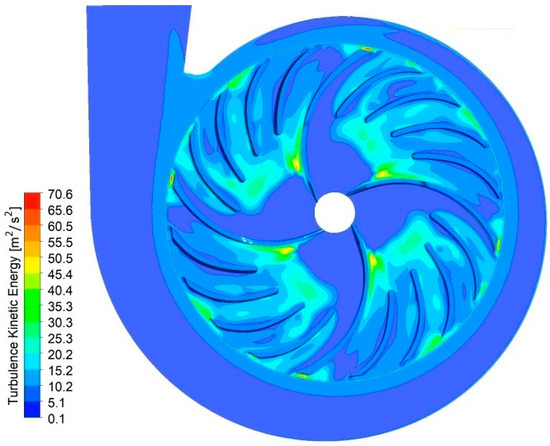
Figure 13.
Turbulent kinetic energy.
In order to properly track the movement of solid particles in the impeller and scroll, it is essential to capture all the flow details in the blades passages and the scroll. The flow details have a significant influence on the trajectories of particles and erosion development. For the selected angular positions of the impeller blades, the flow was solved and the data transferred to the particle trajectory code to perform the computations. The erosion patterns, represented as erosion rate densities, were averaged over the full rotation of the impeller to get a better representation of the erosion patterns while the blades moved in a quasi-steady approach.
4. Particle Trajectory Modeling
If the volume fraction of solid particles is below 4 × 10⁻⁷ [27], a two-phase flow can be considered a one-way coupling. In that case, the Lagrangian approach is used to track the movement of large numbers of particles within the flow field. This model can better describe the particle dynamics and their interactions with walls. The governing equations of particle motion in a rotating frame consider the balance between the momentum derivative and external forces. The left side of Equation (1) accounts for inertia, Coriolis, and centrifugal forces, while the right side includes external forces that are reduced by the particle mass (N/kg), such as drag , combined gravity and buoyancy force , slip–shear layer-induced (Saffman) force , and Magnus force . Neglected are the pressure gradient and added mass forces, as the density of particles is about 2120 times that of air.
The reduced drag force is the dominant force, which is essentially the function of the particle Reynolds number .
For the Stokes regime, 0.1, and the drag coefficient Herein, the four-parameters correlation (Haider and Levenspiel [28]), which is valid for 0.01 2.6 × 10⁵, is considered.
Since the particles are of irregular shapes, the constants , , and are a function of the shape factor (ratio between the area of a sphere of equivalent volume and the actual area of the particle ). Thompson and Clark [29] related the shape factor with a more generic hydrodynamic shape descriptor called scruple that characterizes the irregularity of a particle given as . For a nearly round Saharan dust particle . However, for desert dune sand, which is coarser, the correction factor equals 0.75 [30].
The combined gravitational force and buoyancy force per unit of mass is given by
Saffman [31] produced the first expression for the slip–shear lift force, which, when developed in 3D and reduced by the particle mass, becomes
With the lift coefficient [27]
The correction function was proposed by Mei [32] for particle Reynolds numbers in the range and
The shear flow Reynolds number () is as follows:
The slip–rotation lift force, also known as the Magnus force, is introduced assuming that the dust particles are nearly of spherical shape. This force is a function of the particle Reynolds number and the Reynolds number of the particle rotation () [33], defined as follows:
When reduced by the mass of the particle, it becomes as follows:
The coefficient of the Magnus force is estimated according to Oesterle and Bui Dinh [34] for .
The torque acting on a rotating particle is a function of the rotational coefficient [35]. By assuming the moment of inertia , the particle rotational speed is easily integrated through the time step as below, assuming an initial particle rotating velocity equal to zero.
4.1. Turbulence Effect
The stochastic random walk treatment is based on the eddy interaction model [36], which assumes that a particle interacts with an eddy if [37] (minimum between eddy lifetime and transit time ) is lesser than the eddy lifetime and the particle displacement relative to an eddy is lesser than the eddy length , defined according to Shirolkar et al. [38].
The transit time is required by a particle to traverse through an eddy, which has been linearized [36] in terms of eddy length and relaxation time :
When a particle is inside an eddy, the turbulent components are added to the main fluid components through a Gaussian random number . This has to be updated if the particle encounters a new mesh cell or exceeds the eddy lifetime.
4.2. Particle Tracking
The solution of the nonlinear differential Equation (1) is obtained by the Runge–Kutta–Fehlberg seventh-order technique. At each particle position, the local flow properties are interpolated from the nodal values based on the finite element method (FEM). The particle tracking algorithm requires transforming the physical coordinates into the local coordinates. If a local value exceeds unity, the particle is considered outside, and the cell number is updated. The time step depends on the cell size and the flow velocities; however, the effective time step corresponds to . The flow data is updated and transferred locally at each step angle to compute the particle trajectory and erosion.
4.3. Boundary Conditions
There are three types of boundary conditions specified in the present computations of particle trajectory in the case of this centrifugal fan.
First is the inlet condition, where the release positions are assigned for the particles of sizes randomly specified as described in the section below. The initial slip velocity was set in terms of the local inlet flow velocities according to the experiments of Ghenaiet et al. [5].
The next boundary condition is the particle and wall interaction. The impact distance is set at the half-diameter (Figure 14) in order to prevent a non-physical trajectory and impact. Accordingly, a precise time step is obtained to update the position of impact. Upon collision with a wall, the erosion damage is indicated by a variation in kinetic energy, and the restitution coefficients are used to determine the new velocity amplitude and its direction. The restitution coefficients for the aluminum 2024 and many other aeronautical materials were determined experimentally by Tabakoff et al. [39], which are presented in terms of the mean values and standard deviations:
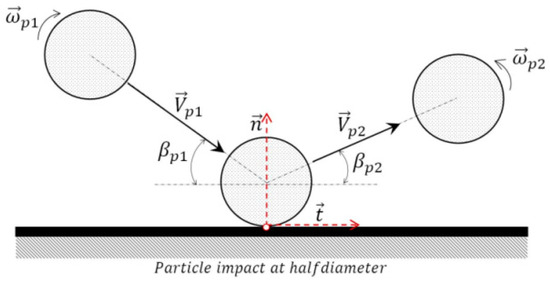
Figure 14.
Impact conditions.
The local surface unit vectors and (Figure 14) and impact velocity components are computed at each impact and thereafter, the new rebound particle velocity and direction are determined. The model of Sommerfeld [40] extended to 3D by Breuer et al. [41] is used to determine the new angular velocity of the particle after an impact.
Finally, there are interfaces between the stationary and rotating frames and between the rotating and stationary frames. At these interfaces, the coordinates of a particle are locally transferred to the next frame, and the same FEM procedure is used to search and update for the next cell number. The particle velocity from a stationary frame to a rotating frame and vice versa is updated according to
4.4. Particle Seeding
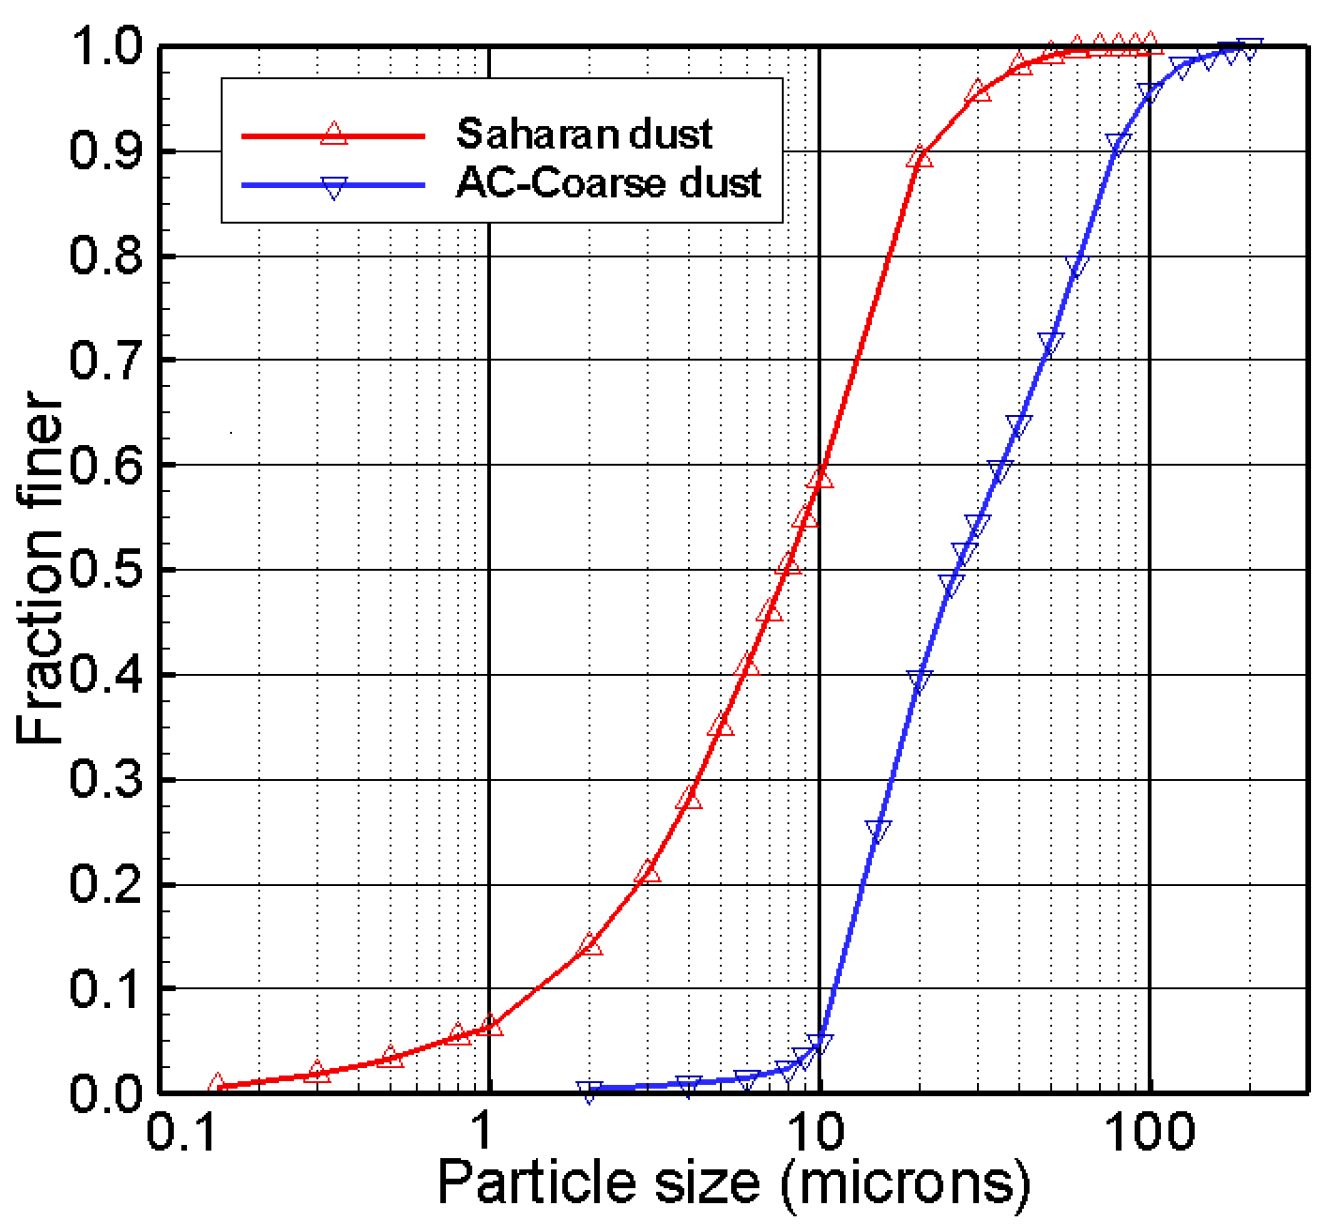
The particle mass rate is obtained by multiplying the actual air volume flow rate and the average particle concentration. The number of injected particles of random sizes and initial release positions conform to the specified concentration and particle size distribution, given a dust density of 2500 kg/m3. Two samples of dust particles (shown in Figure 15) were analyzed within the same concentration range. The first sample represents the dust found in the polluted atmosphere of North Africa and the Sahara, with a concentration ranging from 100 to 500 μg/m3 [42]. The size distribution of this sample is between 0.1 and 100 microns [43], with a mean diameter equal to 10.4 microns and a standard deviation of 9.9 microns. The second sample follows the engine testing standard dust based on the Coarse Arizona Road Dust “AC-coarse” of a size range between 1 and 200 microns [44]. For this sample, the mean diameter equals 37.7 microns, and the standard deviation is 30.3 microns.
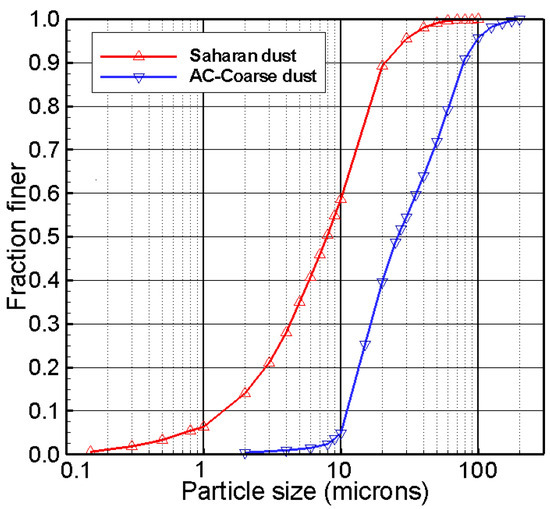
Figure 15.
Dust particle size distributions.
The diameters of the particles were randomly distributed according to the particle size distribution (Figure 15), concentration profile, and a Gaussian random number. A subprogram iterated for the particle numbers, sizes, and initial release positions in both the radial and tangential directions until the convergence of the total particle mass rate. Figure 16 presents the release positions of the dust particles, sizes, and numbers at the highest concentration of Saharan dust, which were randomly generated as beforehand. As shown, the particle distributions were obtained using different randomness factors.
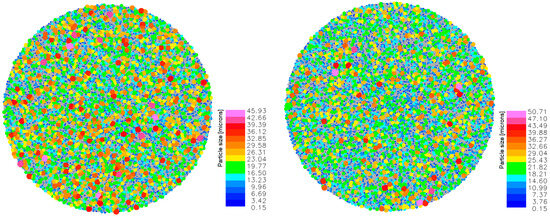
Figure 16.
Release positions and sizes of Saharan dust particles at the highest concentration for two randomness factors.
5. Erosion Assessment
Based on the majority of the experiments, the erosion phenomenon depends on the impingement velocity and angle and the restitution coefficients of the particle and target material combination. The erosion rate is defined as the amount of mass (in milligrams) that is removed from a surface per unit mass of particles (in grams) that strike the surface. Finnie [45] developed the basis of sand erosion, and later, Bitter [46] enhanced it to account for the plastic deformation effects. Grant and Tabakoff [47] developed a successful erosion model that combines two mechanisms: one is predominant at low-impact angles and the other prevailing at high-impact angles. These researchers conducted tests on aluminum alloy 2024 and established a correlation for the local erosion rate.
The tangential restitution ratio and .
For an aluminum alloy, the material constants are ,, , and .
The eroded mass at an impact point is calculated from the local erosion rate by Equation (19). An area around each node is formed and denoted the centred area . The values of mass erosion per unit of time (second) are summed and divided by the area to calculate the equivalent erosion rate (mg/s·mm2) according to Equation (20). This procedure is used to obtain all the nodal values.
6. Results and Discussion
This section presents the results and discussion of the particle trajectories, followed by the results of erosion and its characterization.
6.1. Particle Trajectory Results
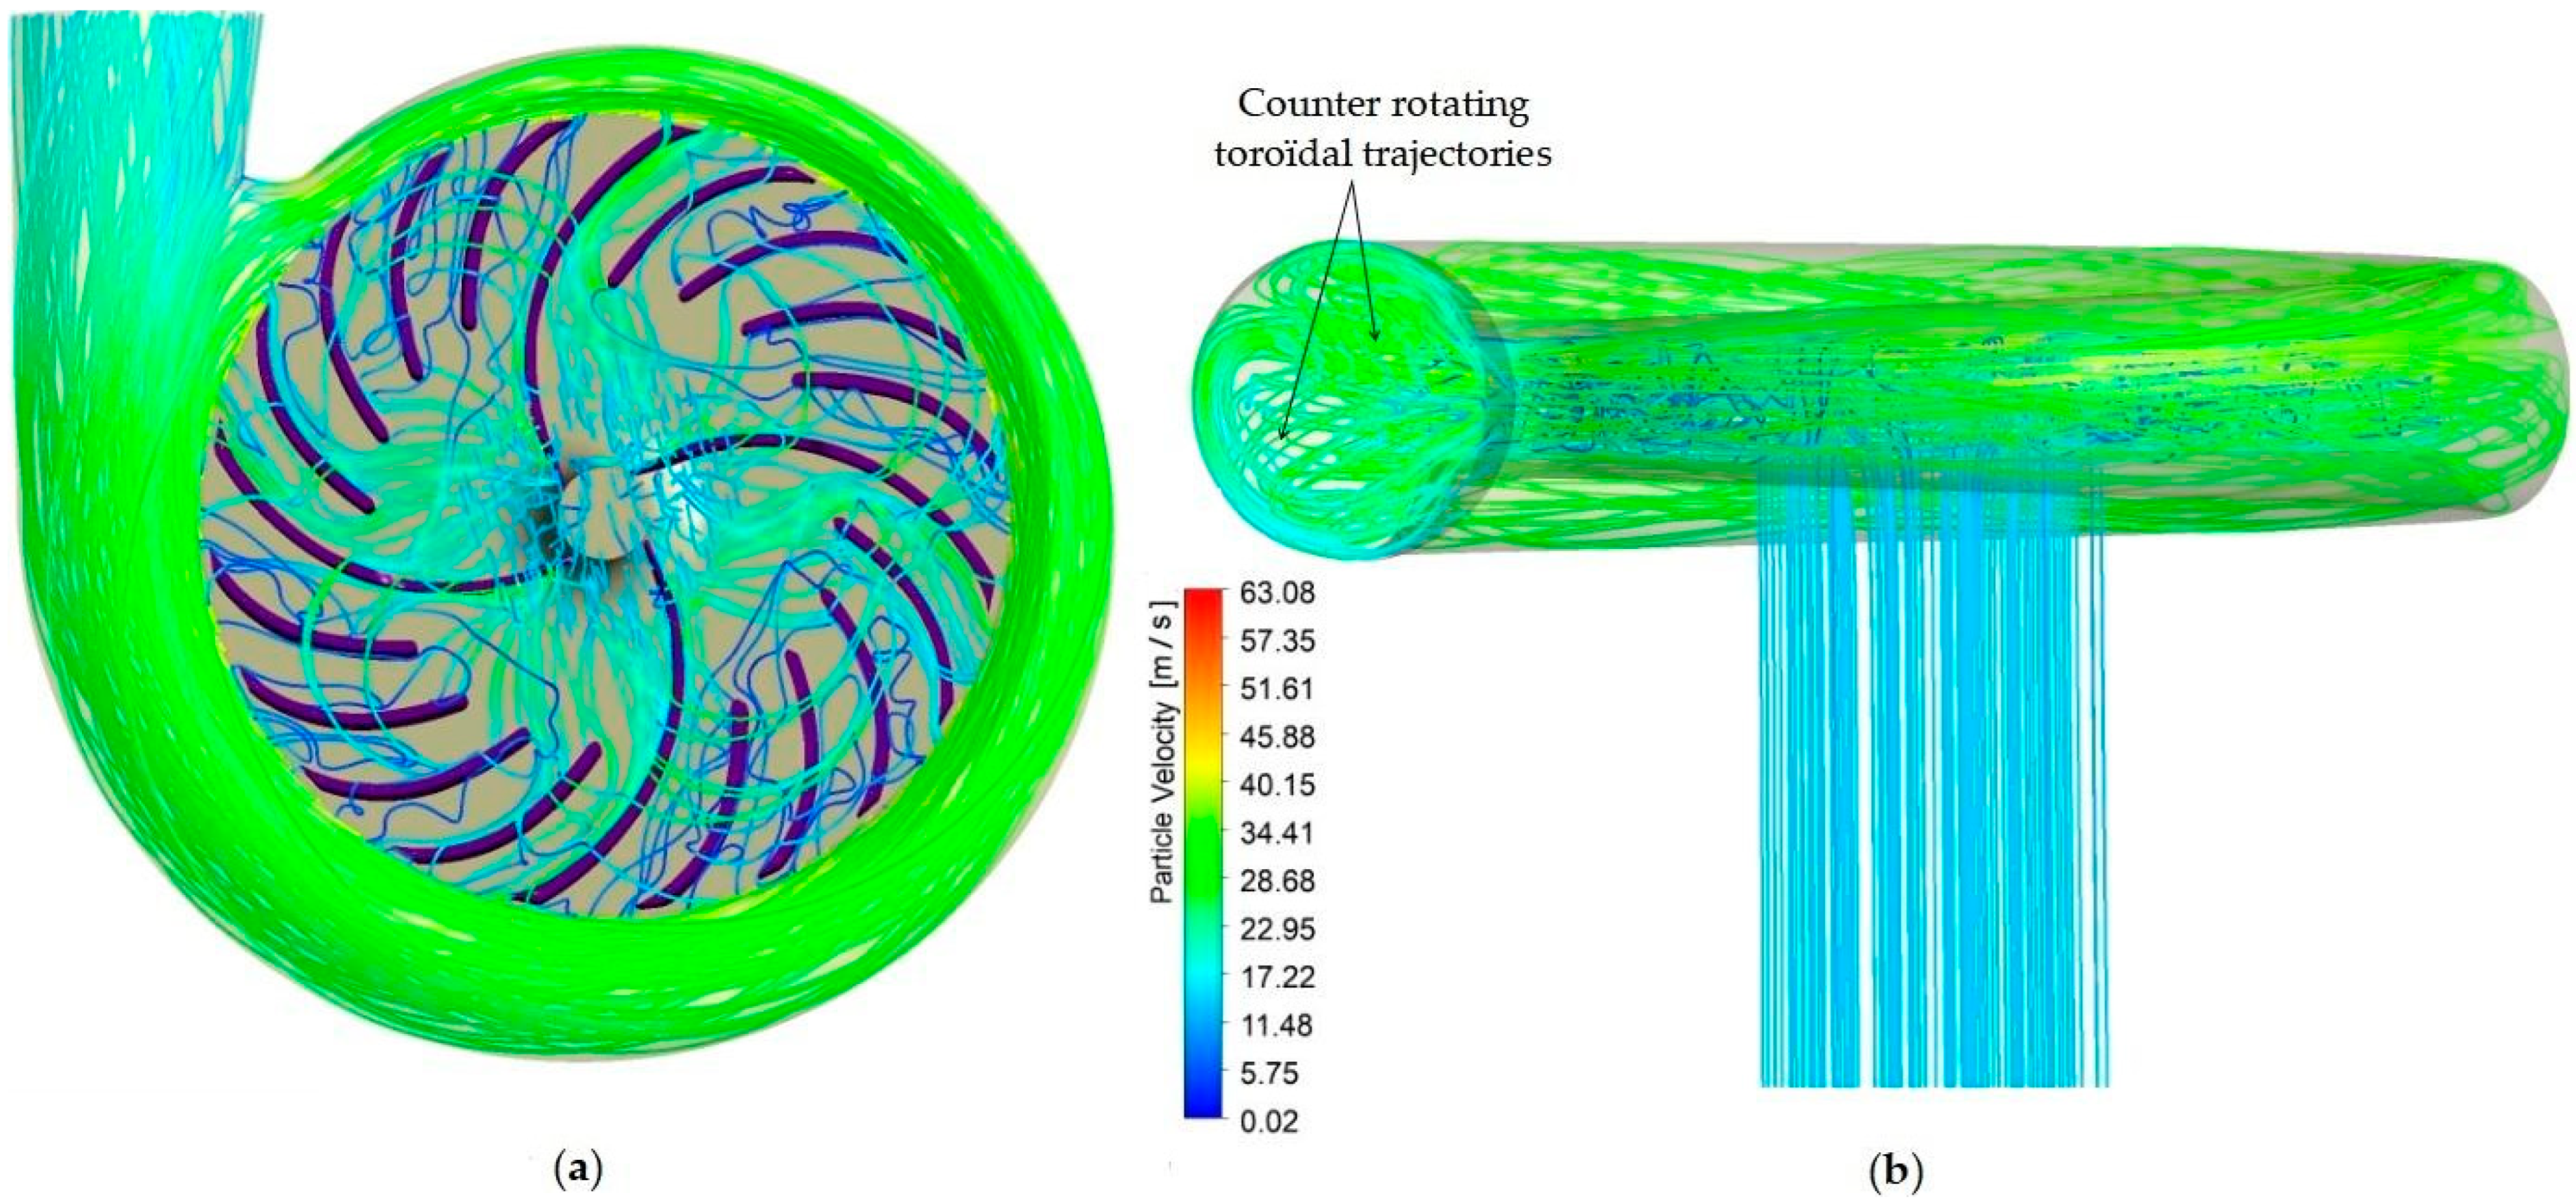
To illustrate the effect of particle size on trajectories, a specific number of dust particles of constant size were released at the inlet (Figure 17, Figure 18 and Figure 19) and tracked along their paths while the centrifugal fan operated at the nominal point. As observed, the smaller particles like those of 1 micron tend to closely follow the flow streamlines due to the influence of drag force, turbulence, secondary flows, and leakage flow. Near the blade entry, these small particles stay close to the recirculation region caused by the curvature of the impeller entry region. As depicted in Figure 17, these particles repeatedly impact the four full blades from the LE to the mid of PS at velocities between 20 and 40 m/s until exiting the impeller. The sixteen splitters are impacted around the LE at high impingement angles, while the PS is characterized by an uneven distribution of impacts compared to the full blades. After crossing the tip clearance of the full blades, some small particles (Figure 17a) reach around the mid-section of the opposite blades and near the TE, causing multiple impacts. As these small particles cross the impeller/scroll interface, they move closer to the outer wall and gradually dissipate their kinetic energy due to repeated collisions. The tiny particles are shown to travel through the scroll several times via the tongue and cause multiple impacts. From the tongue to the first half of the scroll, the particle velocities reach up to 40 m/s, but in the second half, they become less than 30 m/s after inducing multiple impacts. The side view in Figure 17b illustrates the toroidal trajectories in the scroll, while the cross-section shows the counter-rotating path lines.
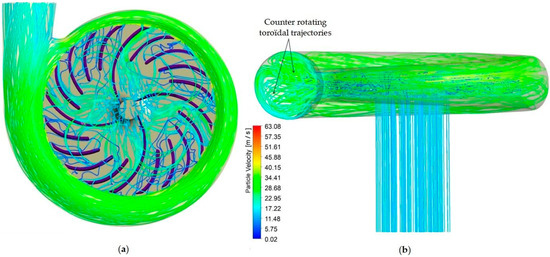
Figure 17.
Samples of particle (1 μm) trajectories coloured by velocity: (a) top view and (b) side view.
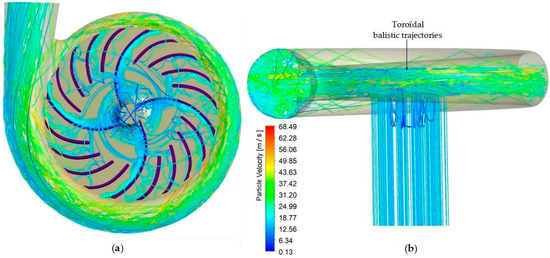
Figure 18.
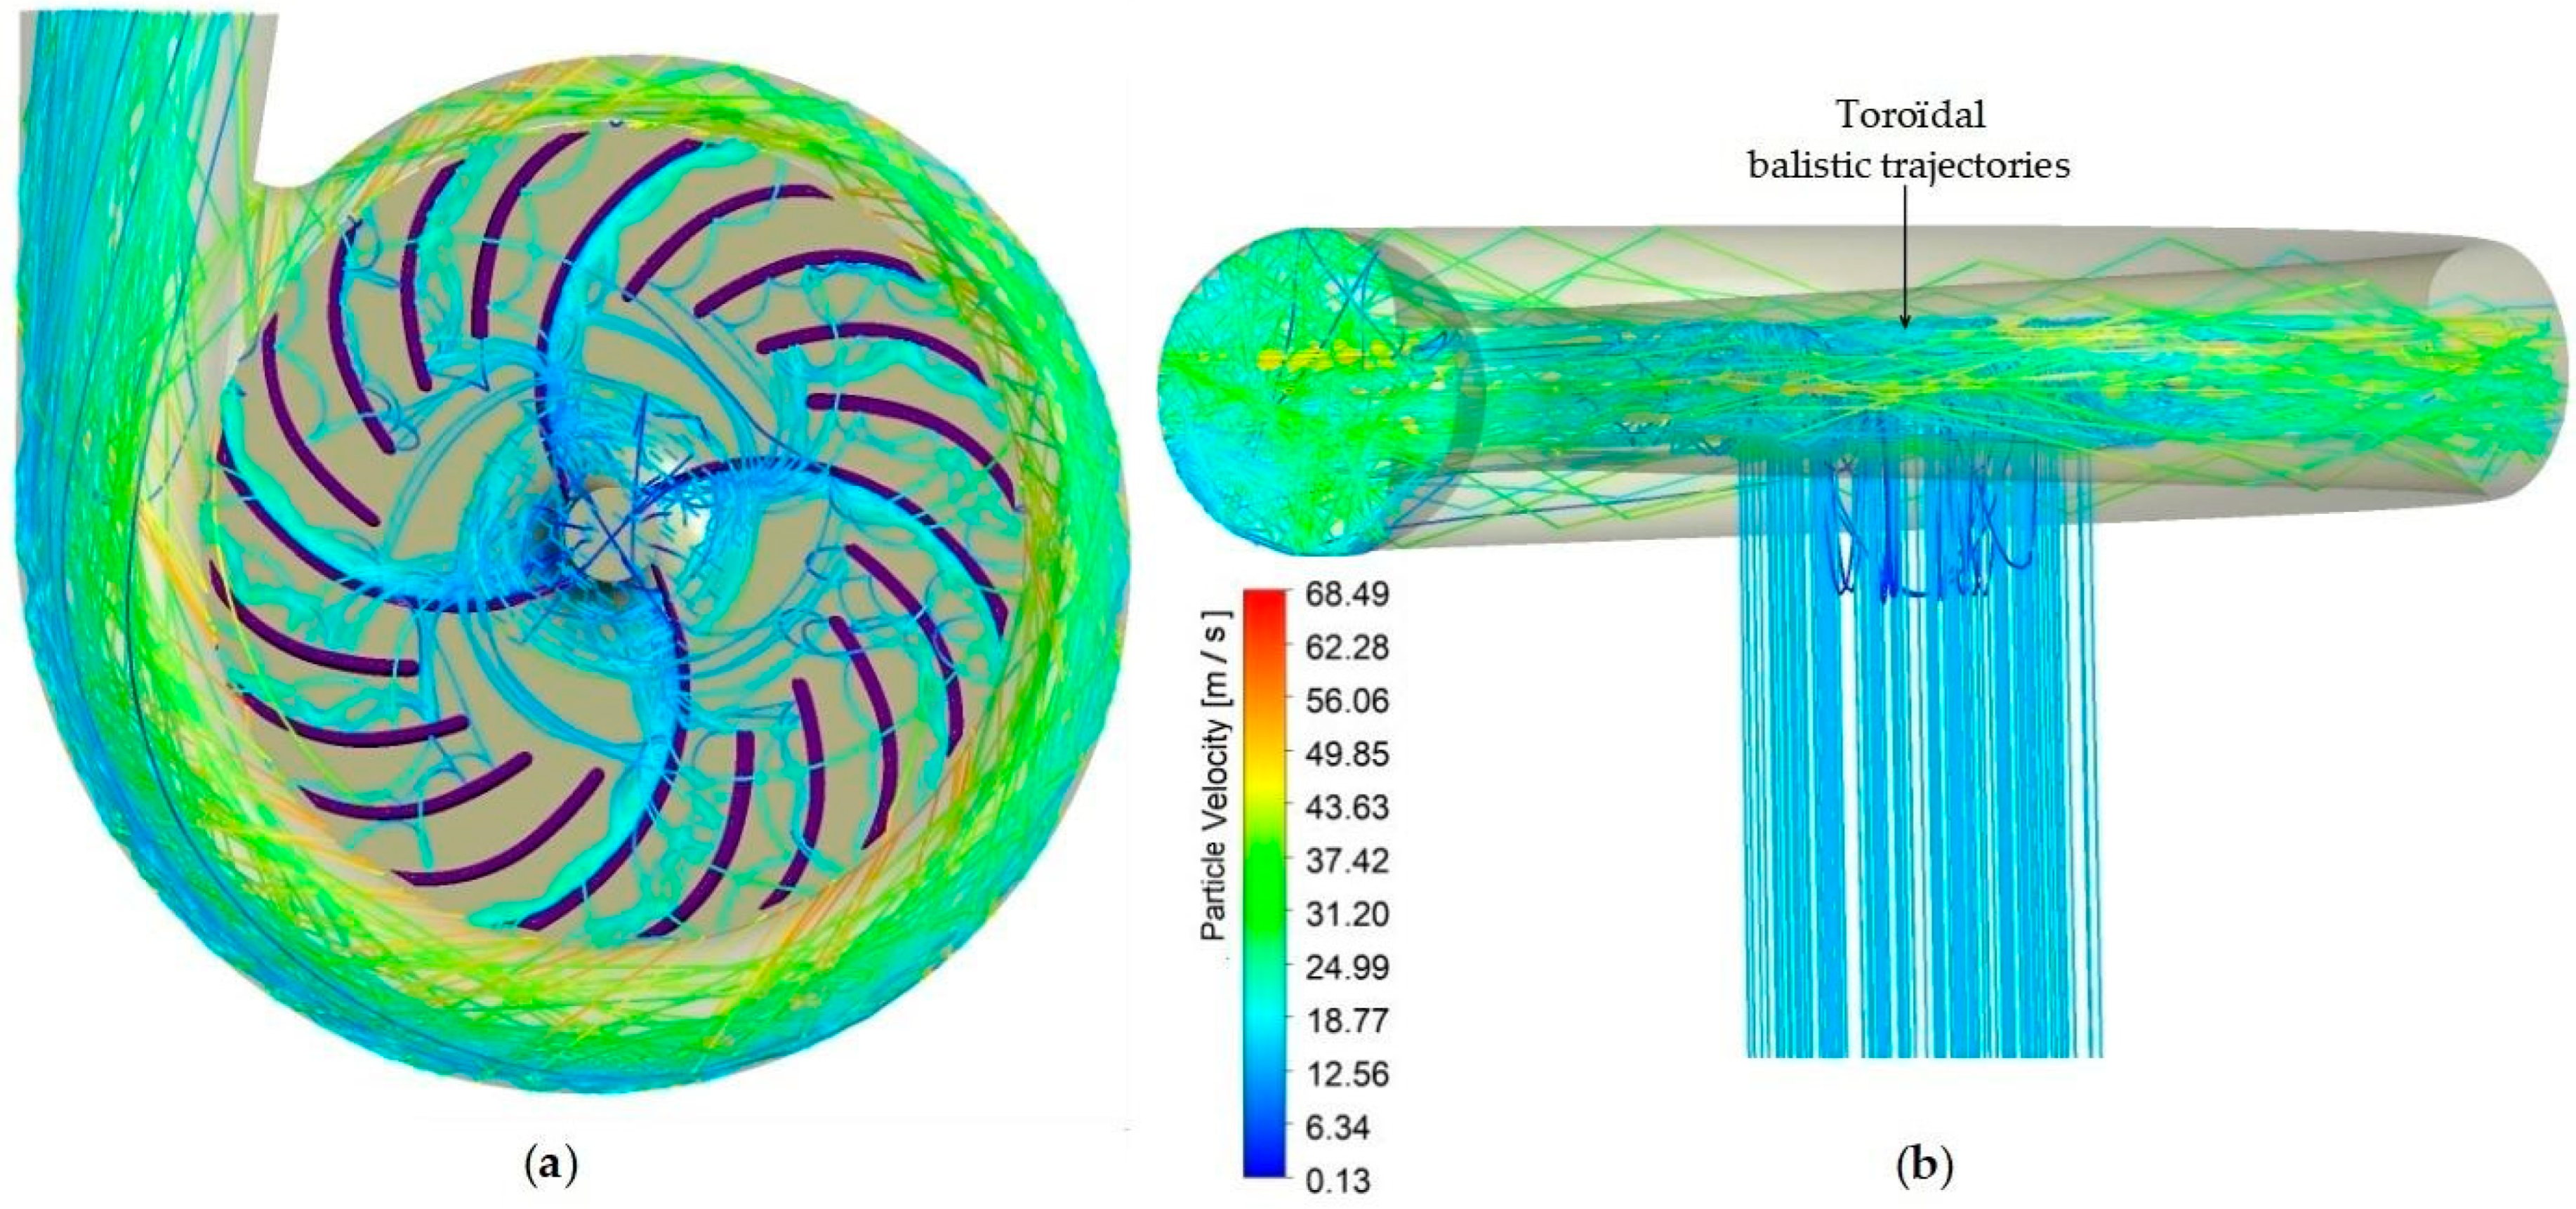
Samples of particle (100 μm) trajectories coloured by velocity: (a) top view and (b) side view.

Figure 19.
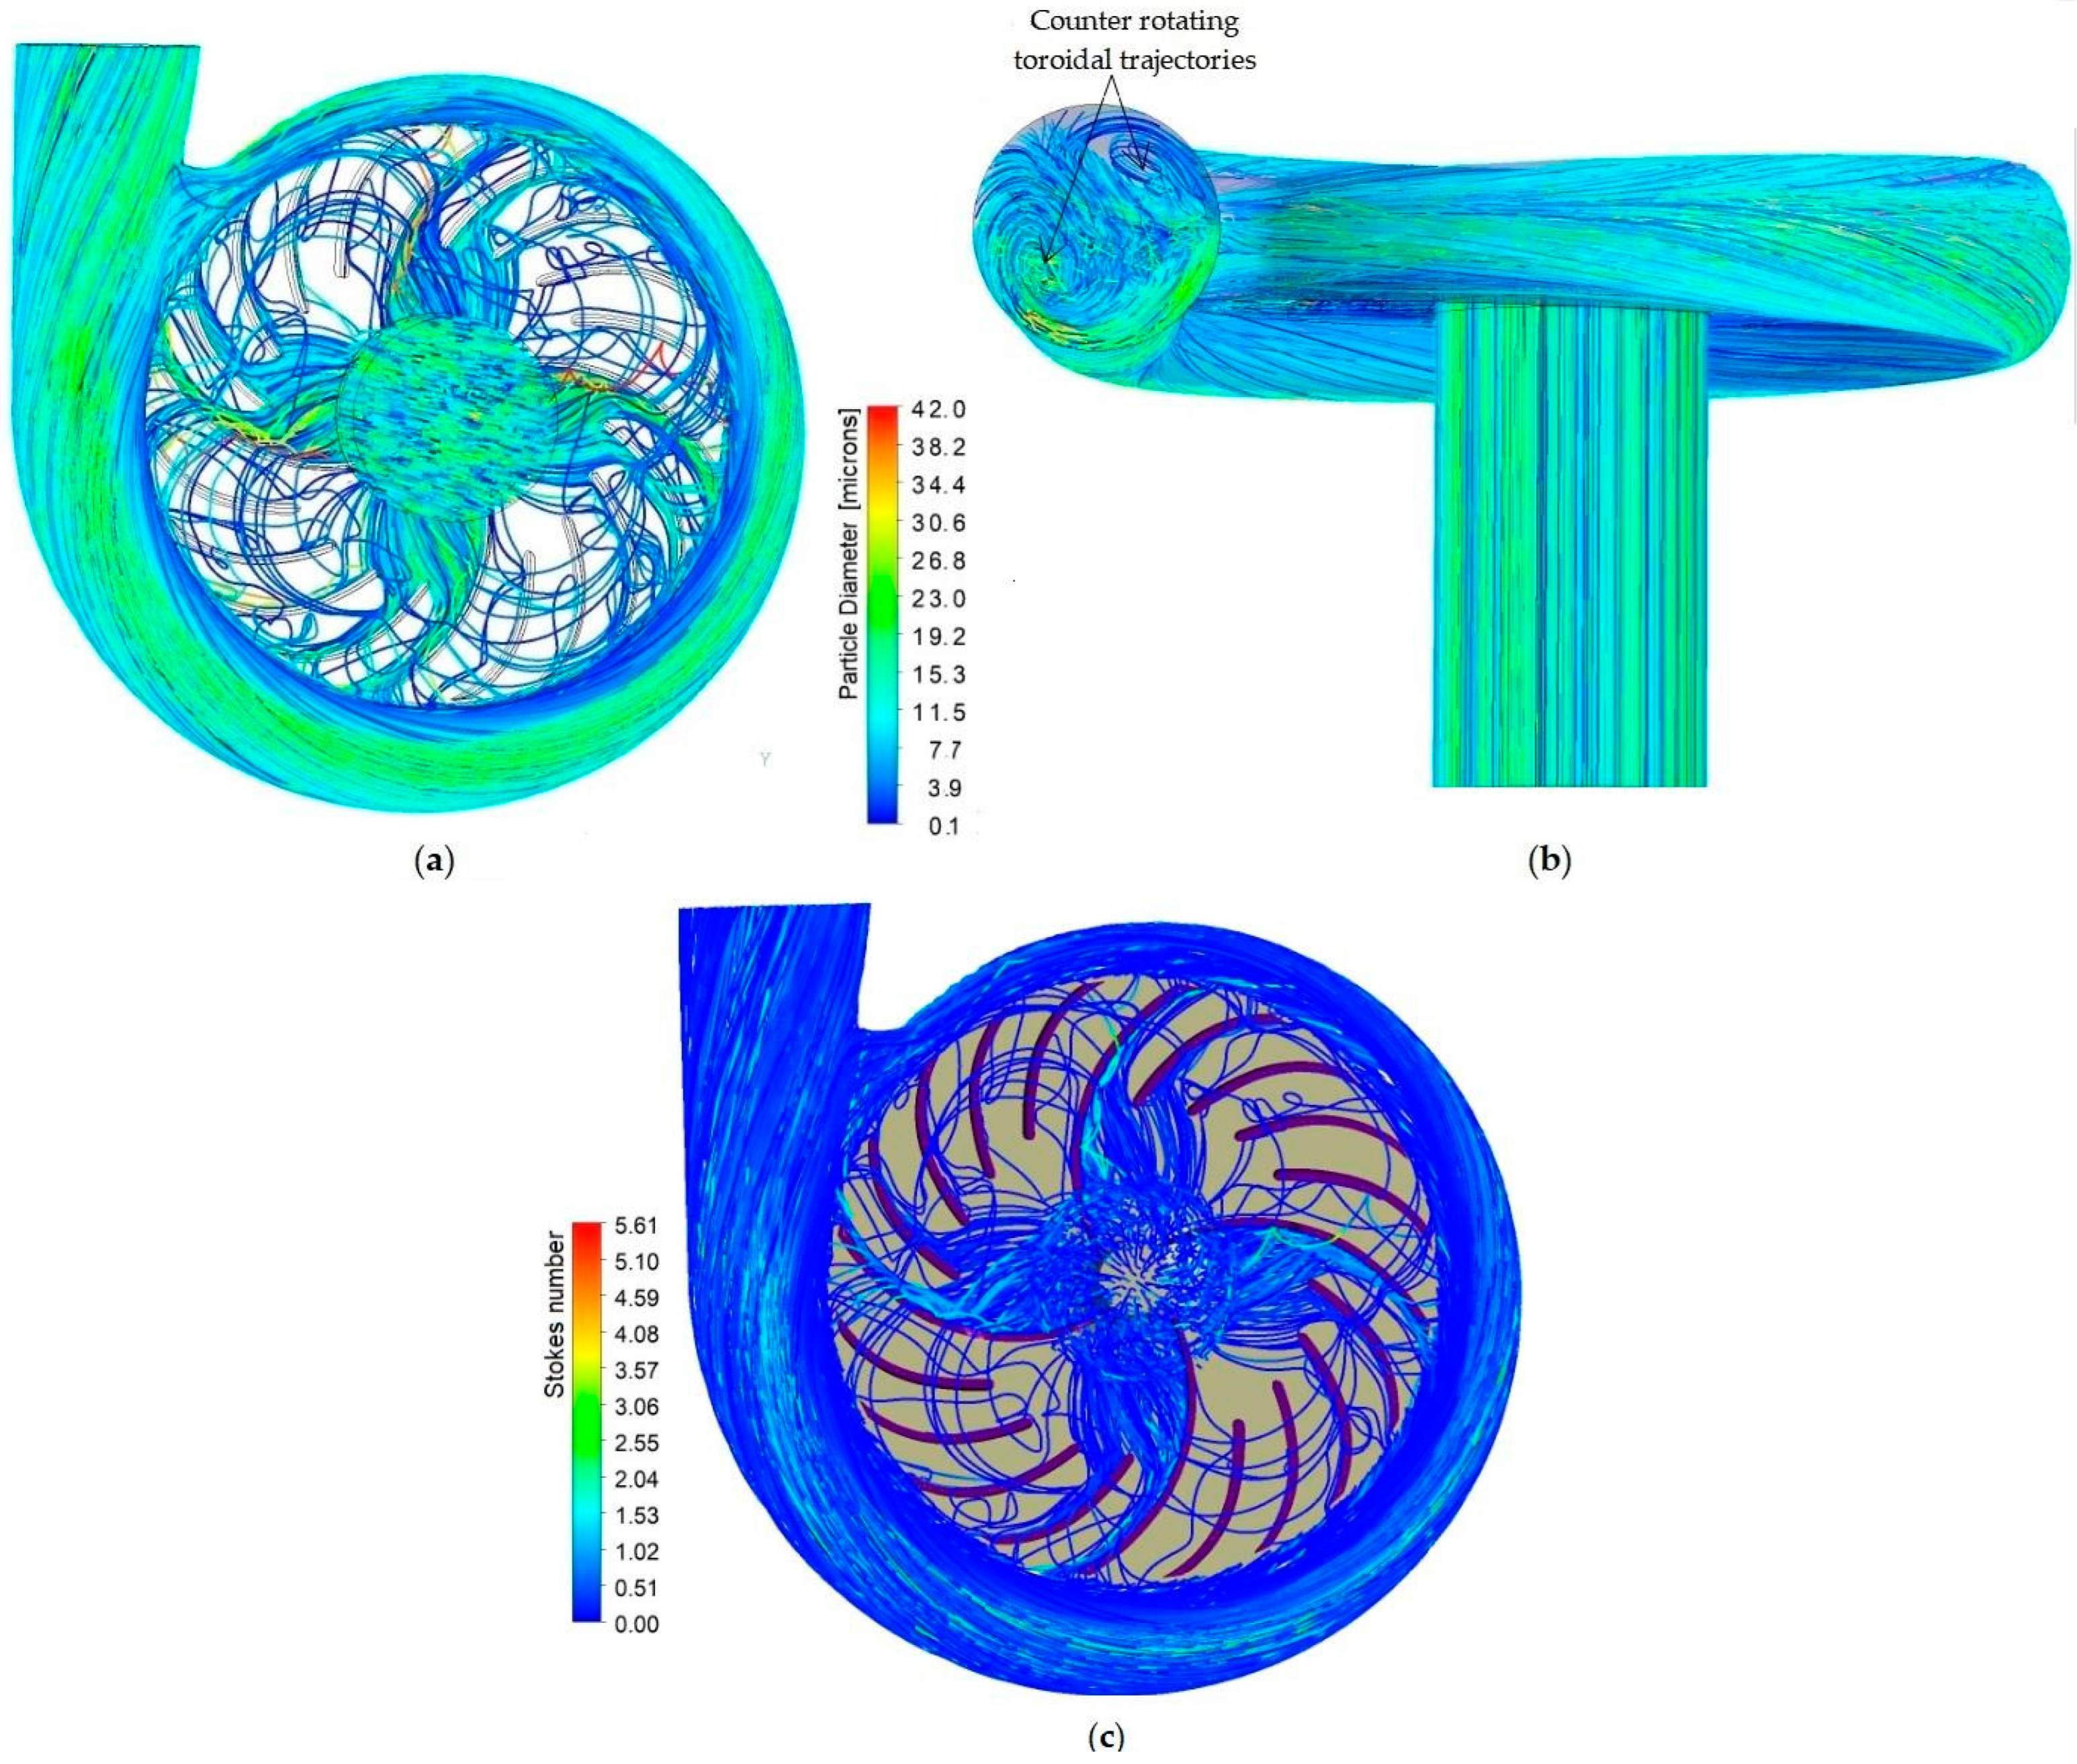
Trajectories of Saharan dust (0.1–100 microns) colored by (a) the particle diameter, (b) side view, and (c) Stokes number.
The behavior of large particles, such as 100 microns, is different due to higher inertia and imparted centrifugal force compared to drag force. These large particles, as shown in Figure 18a, noticeably deviate from the flow streamlines and bounce back after hitting the impeller’s eye. Their velocities increase rapidly as they pass through the impeller. Upon impacting the full blades and splitters, they bounce off and collide with the PS several times until reaching the TE. There are many particles after bouncing off from the LE follow ballistic trajectories and impact the aft of the PS, while others reach the SS of the opposite blade. Some particles that bounce off from the PS traverse via the tip clearance and repeatedly collide with the casing plate. The PS is impacted at velocities of 20–30 m/s, with the highest velocity observed towards the TE. At the interface between the impeller and scroll, the particles with higher velocities reach straight the outer wall of the scroll, causing multiple impacts of a high erosion rate. After multiple impacts at mid-angles, the particles lose their kinetic energy and follow the outer wall of the scroll. Some of large particles crossing the tongue induce more impacts on the scroll. The side view in Figure 18b shows large particles exiting the impeller in straight paths collide repeatedly with the scroll and bounce, keeping near the outer wall. The large particles strike the outer wall of the scroll near-optimum angle, resulting in higher local erosion rates, while the small particles impact the scroll from low to optimum impact angle.
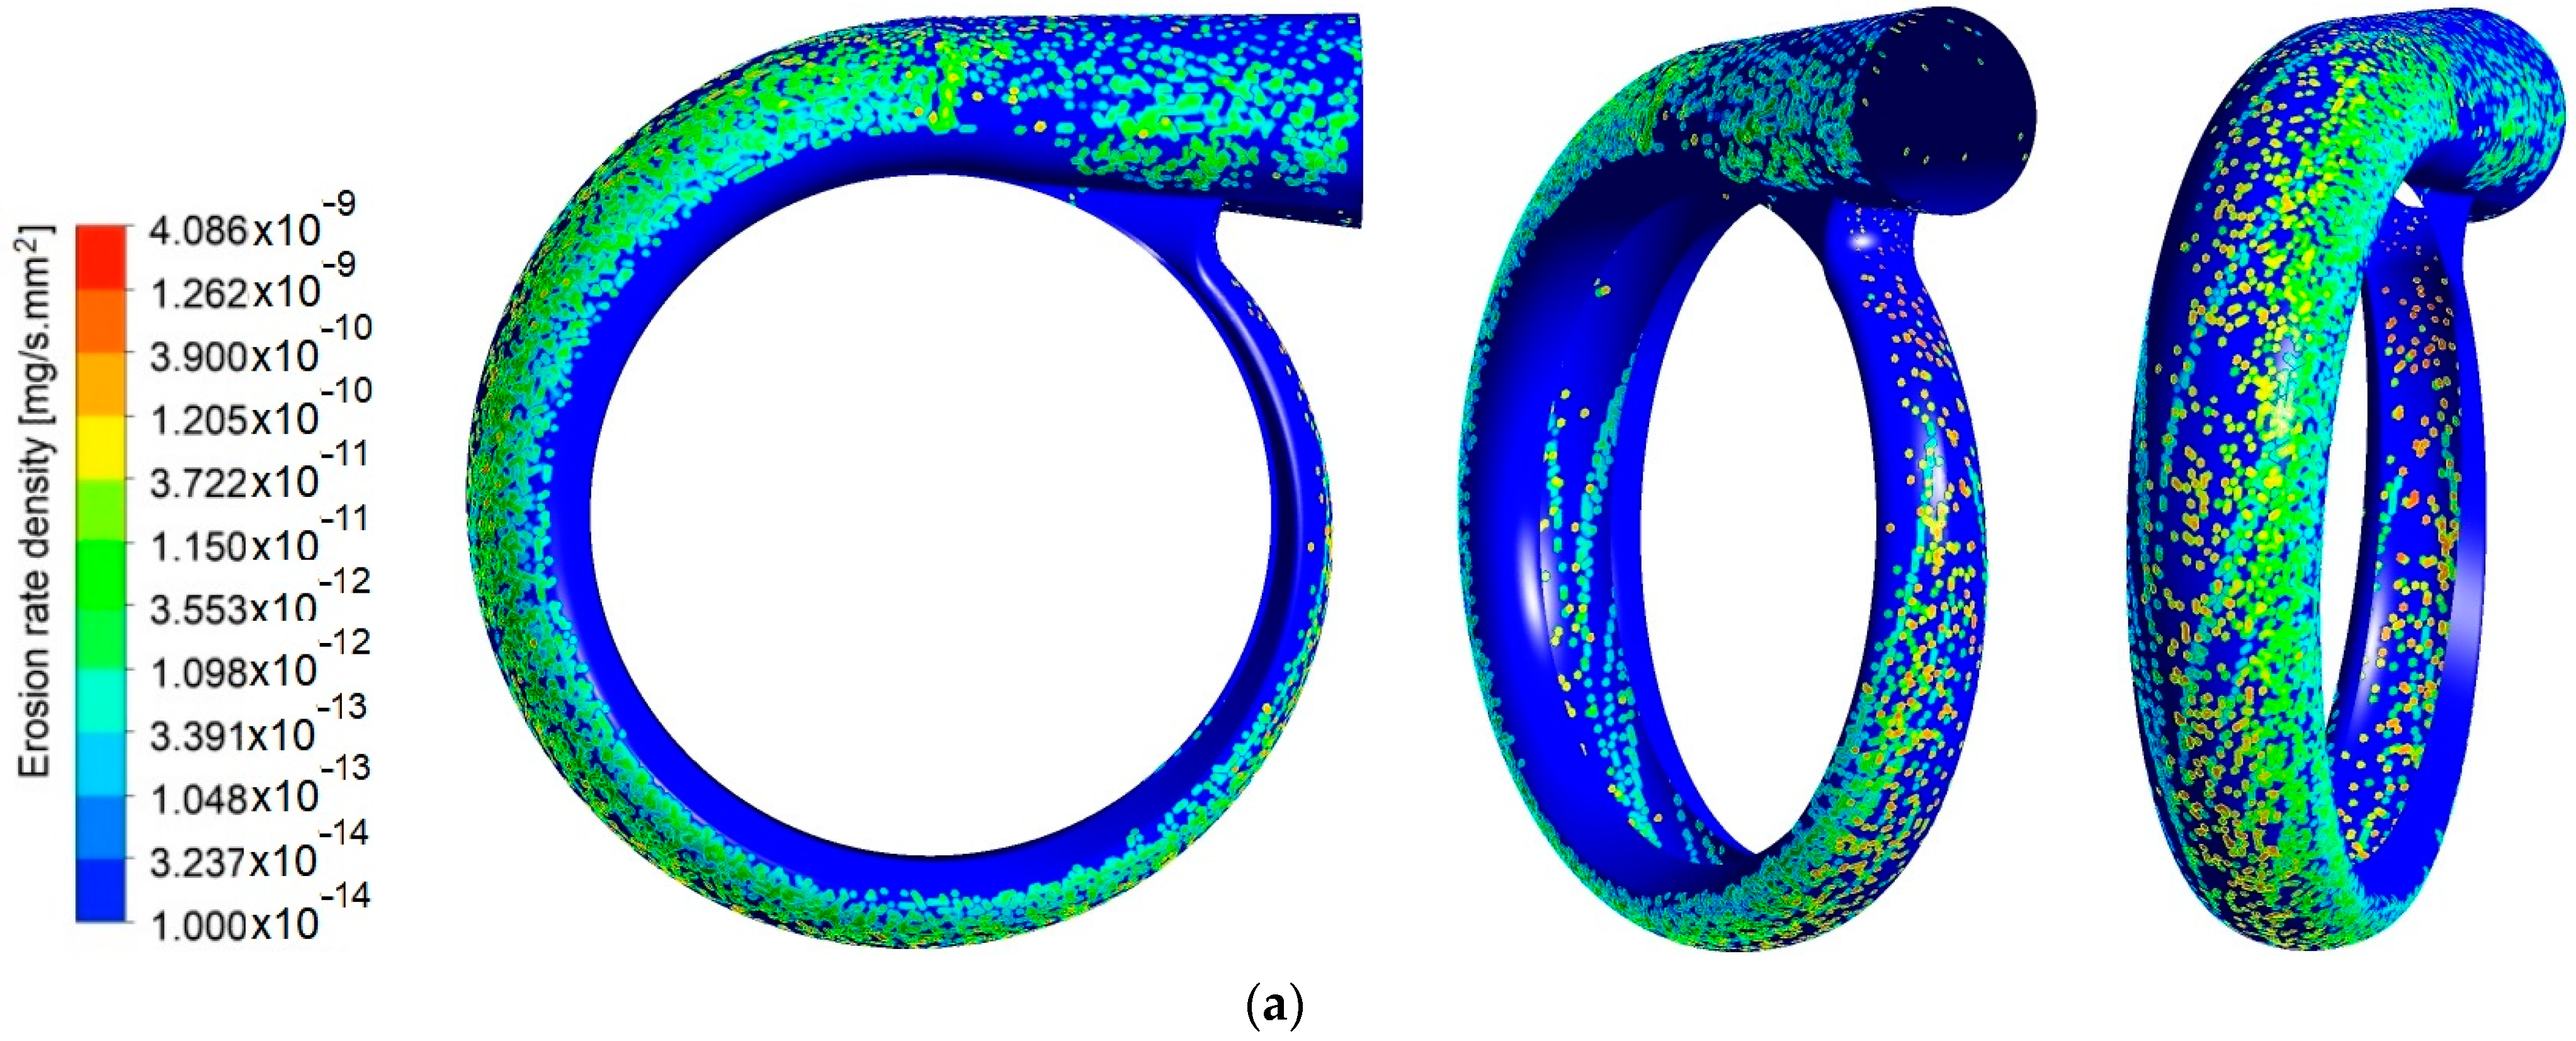
Figure 19 illustrates the movement of dust particles of different sizes within the range of 0.1–100 microns. When these particles are released at the inlet duct, they gain both axial and tangential velocity components as they enter the impeller eye. Due to the phase shift between the particles and streamline, these particles do not directly interact with the impeller surfaces. Large particles (Figure 19a) follow parabolic trajectories and collide and bounce off the PS before collecting near the TE and being discharged towards the scroll in a dense flux of particles. On the other hand, small particles tend to follow the streamlines after impacting the blade’s LE. Some of these small particles are shown to cross through the tip gap and repeatedly collide with the casing plate. At the interface between the impeller and the scroll, particles reach their maximum velocities and directly hit the outer wall of the scroll. The particles, despite losing kinetic energy due to multiple collisions, are entrained by the scroll’s flow and continue moving very closely along the outer wall, causing the spreading of erosion. The side view, shown in Figure 19b, depicts toroidal particle trajectories of various sizes. As observed, the particles crossing multiple times via the scroll tongue leads to high-impact frequencies. The cross-section of the scroll displays counter-rotating path lines, many of which are attributed to small particles under 20 microns. The high number of impacts and velocities in the scroll result in elevated erosion rate densities compared to the impeller. Figure 19c presents the Stokes number, , based the average chord (c) of the blade. Particles with < 1 do not interact with the walls, whereas above this value particles are more likely to impact the PS, which is typical of the full blades.
6.2. Erosion Results
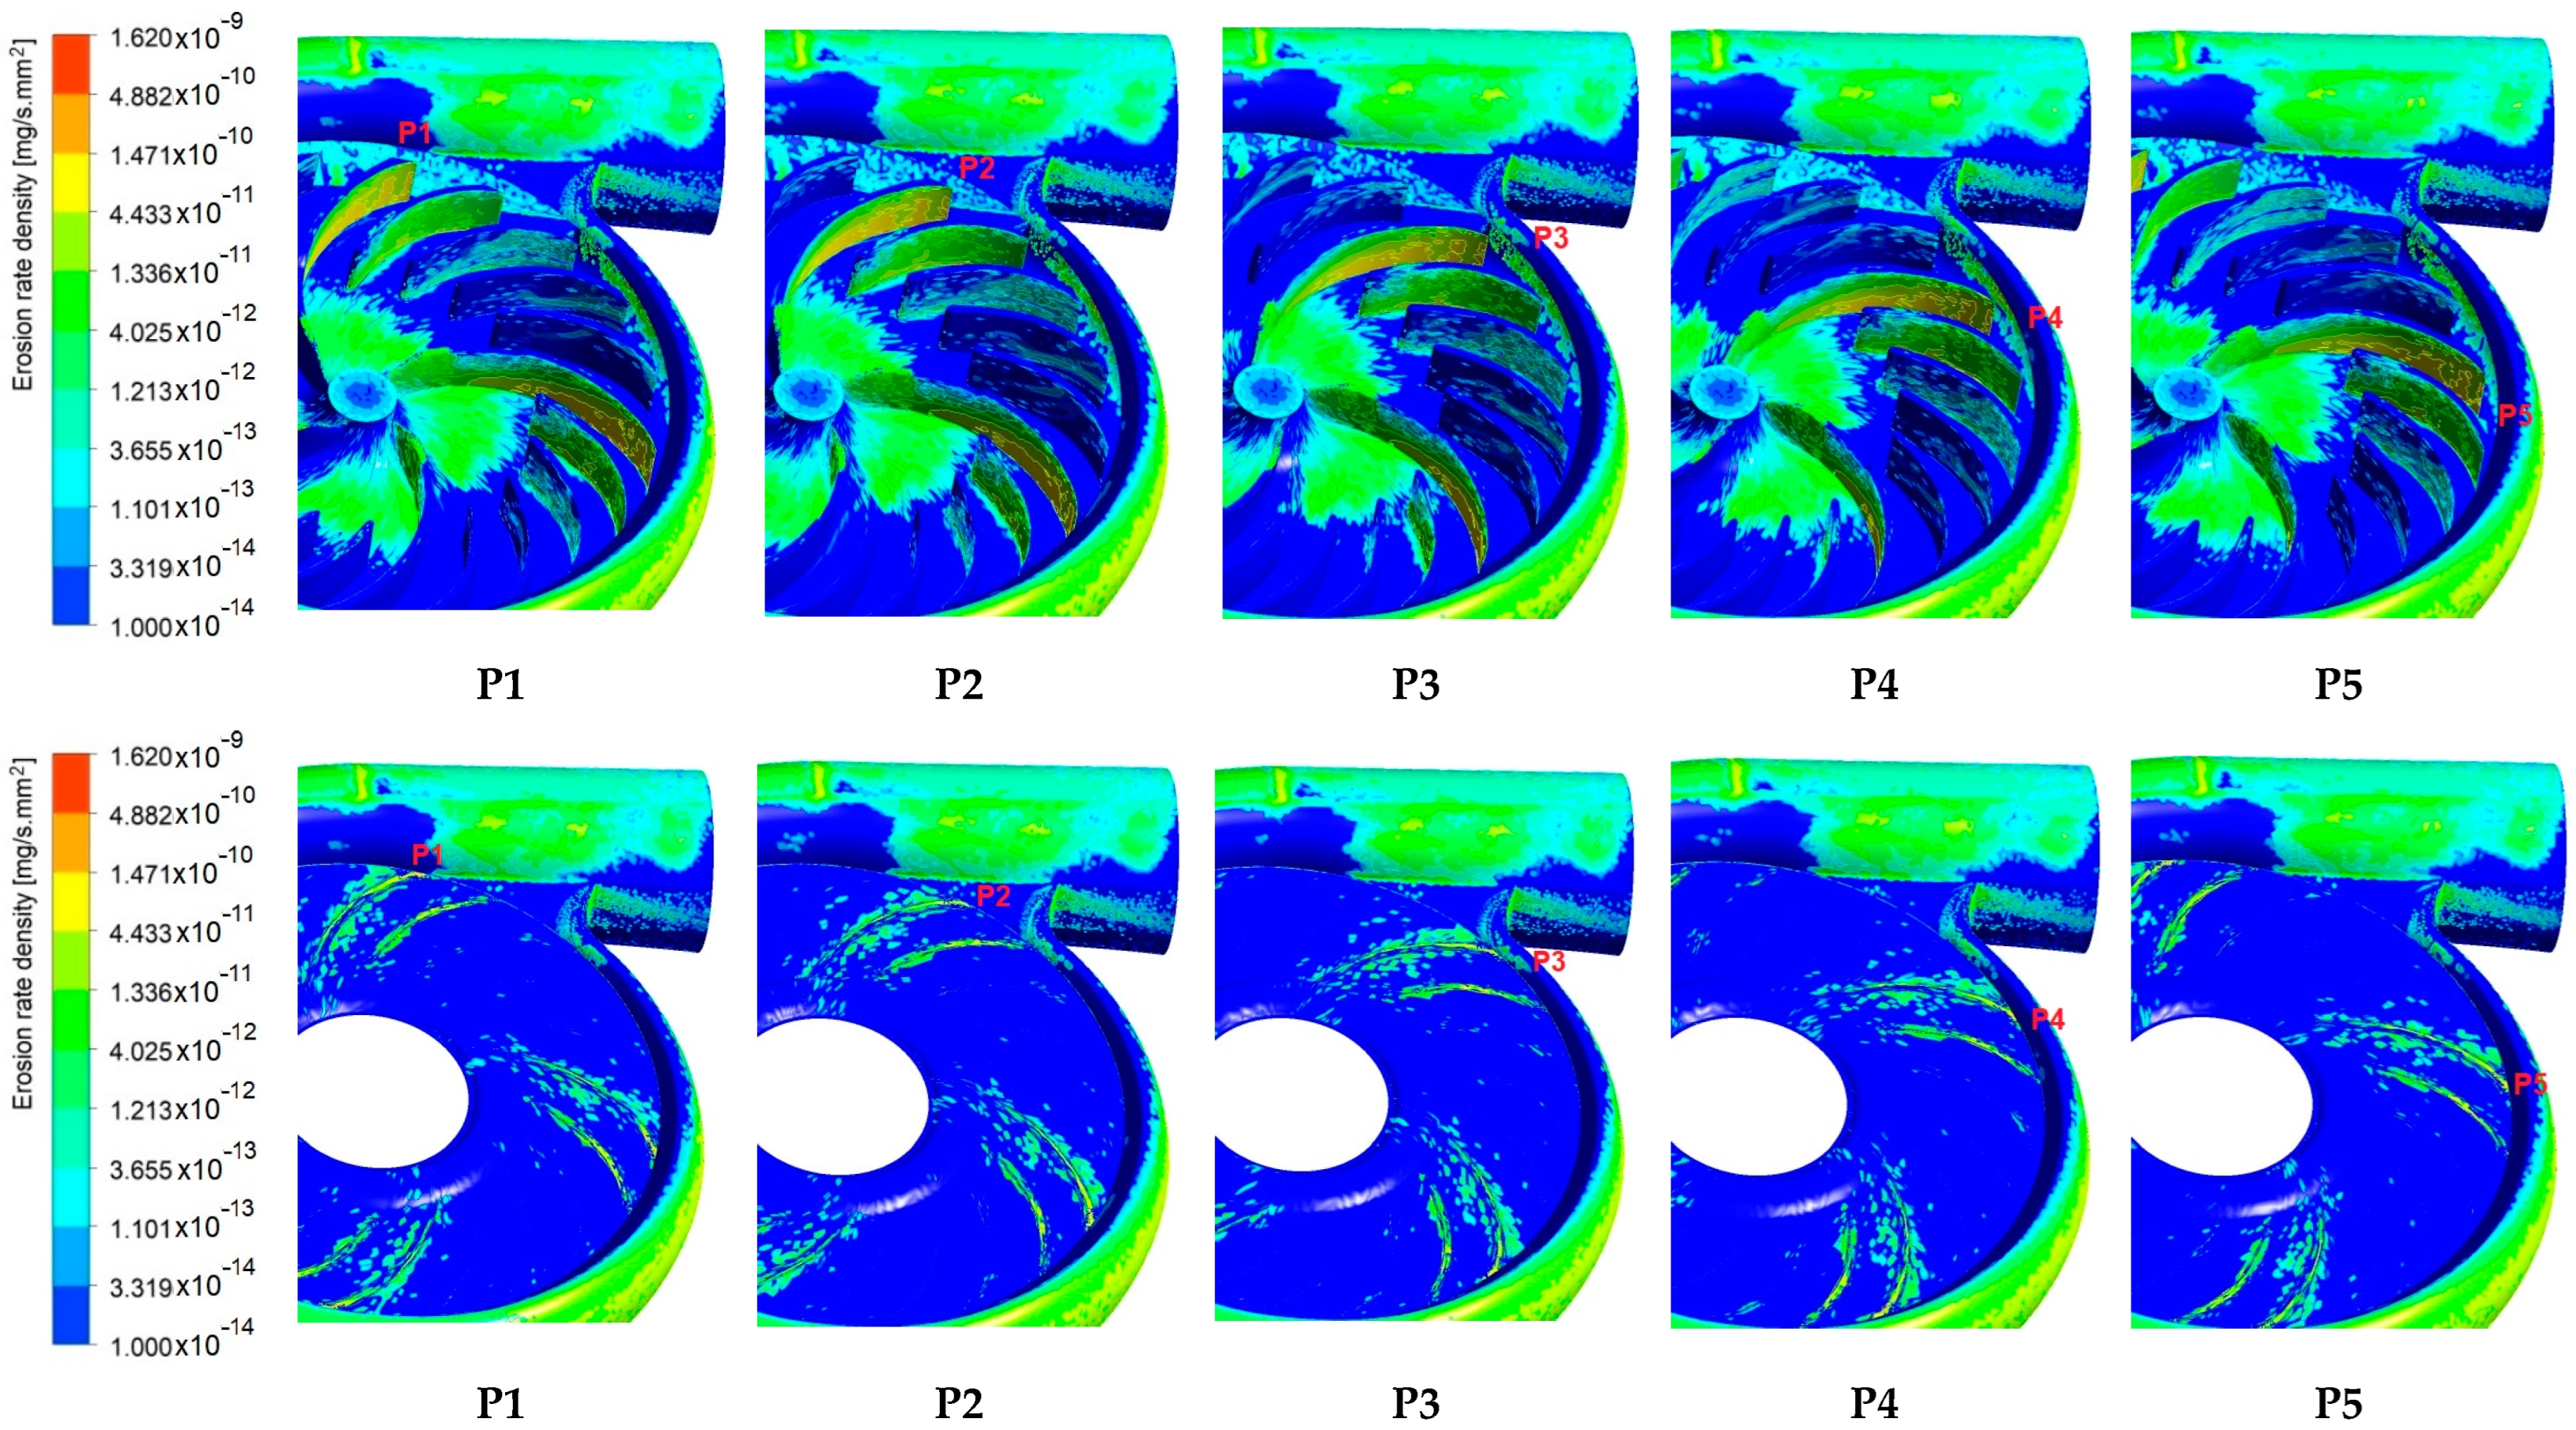
Owing to the high frequency of impacts on the face of a mesh element, the local erosion rates calculated from Equation (19) are used to evaluate the erosion rate density ( according to Equation (20). The erosion patterns are plotted in Figure 19 in terms of the erosion rate density and relate to Saharan dust (0.1–100 microns) with a concentration of 500 μg/m3. With the same scales, it is possible to compare between the erosion patterns when the positions of the blades varied from the straight duct position P1 via the scroll tongue farther to the downstream position P5. It is observed that the full blades and the first nearest splitter are more eroded compared to the three other splitters (Figure 20). The positions of the blades appear to have an impact on the erosion rates and its spread. Figure 20 depicts the erosion patterns over the casing plate, mainly around the full blade and the first splitter. The noticeable region of erosion in the marked area is practically caused by the infiltrated particles at the tips of the full blade and the first splitter, as well as the particles being reflected and centrifuged upwards.

Figure 20.
Erosion with the blades’ positions, caused by Saharan dust (0.1–100 microns) of the concentration 500 μg/m3: impeller blades, casing plate, and volute.
The average erosion rate density (AERD) (mg/s·mm2) is another index to characterize the erosion wear and its development. It depends on the local erosion rates, mass rates of the impacting particles, and the surface of the concerned component. The AERD is obtained by integrating the erosion rate density , given by Equation (20), over the concerned component’s surface and dividing it by the total area. Additionally, the eroded mass per hour (EMPH) (mg/h) provides an overall measure of the material removal from a component. The EMPH is obtained from AERD multiplied by the area of the component and duration of 3600 s.
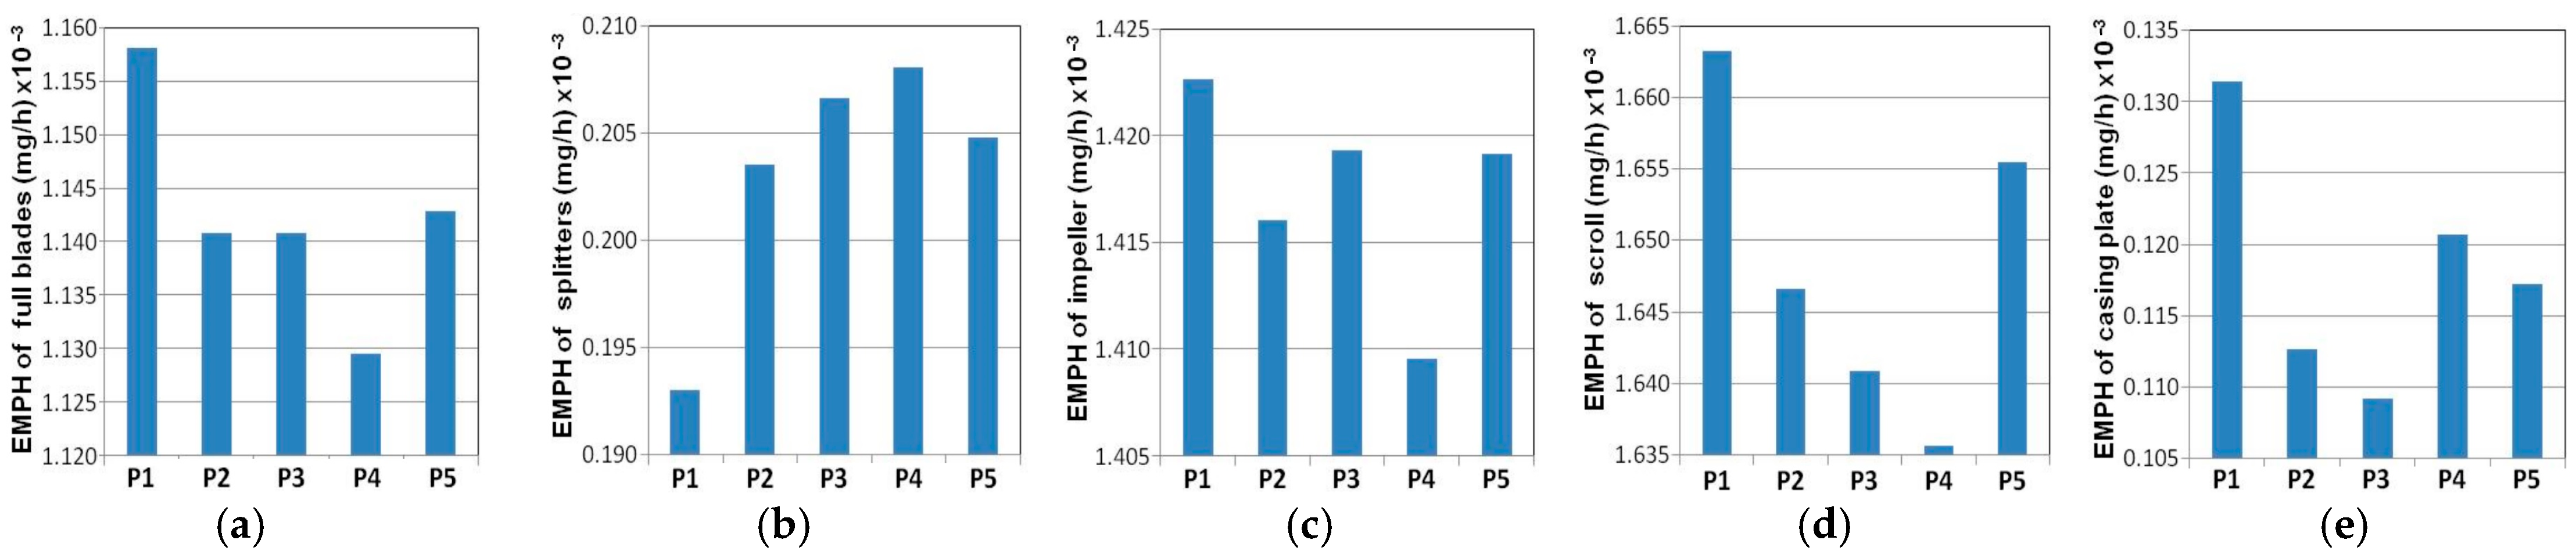
Figure 21 depicts the erosion patterns caused by Saharan dust (0.1–100 microns) of the concentration 500 μg/m3. Among the positions of the full blades, the position P1 seems to produce the highest AERD and EMPH of the full blades, followed by the position P5. However, the positions P4 and P3 are particularly important for the splitters. The entire impeller (blades, splitters, and hub) experiences extreme values of AERD and EMPH for position P1, followed by position P3. For the casing plate, the position P1 is critical, followed by P4. As for the scroll, the positions P1 and P5 are significant in terms of erosion. Ultimately, position P1 is the most critical for both the entire impeller and the scroll, as seen in Figure 21. To consider the effects of the relative blade positions on the erosion patterns, typically around the tongue, sixteen simulated circumferential positions are cumulated and averaged to obtain more representative values of erosion and material removal.
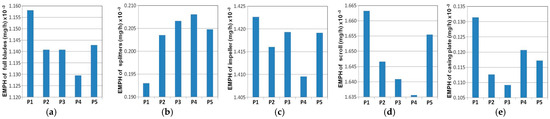
Figure 21.
EMPH with blades’ positions caused by Saharan dust (0.1–100 microns) of the concentration 500 μg/m3: (a) full blades, (b) splitters, (c) impeller, (d) casing plate, and (e) scroll.
The first computations of particle trajectory and erosion focused on the Saharan dust (0.1–100 microns) at concentrations ranging from 100 to 500 , while the centrifugal fan operated at the nominal point and maximum discharge.
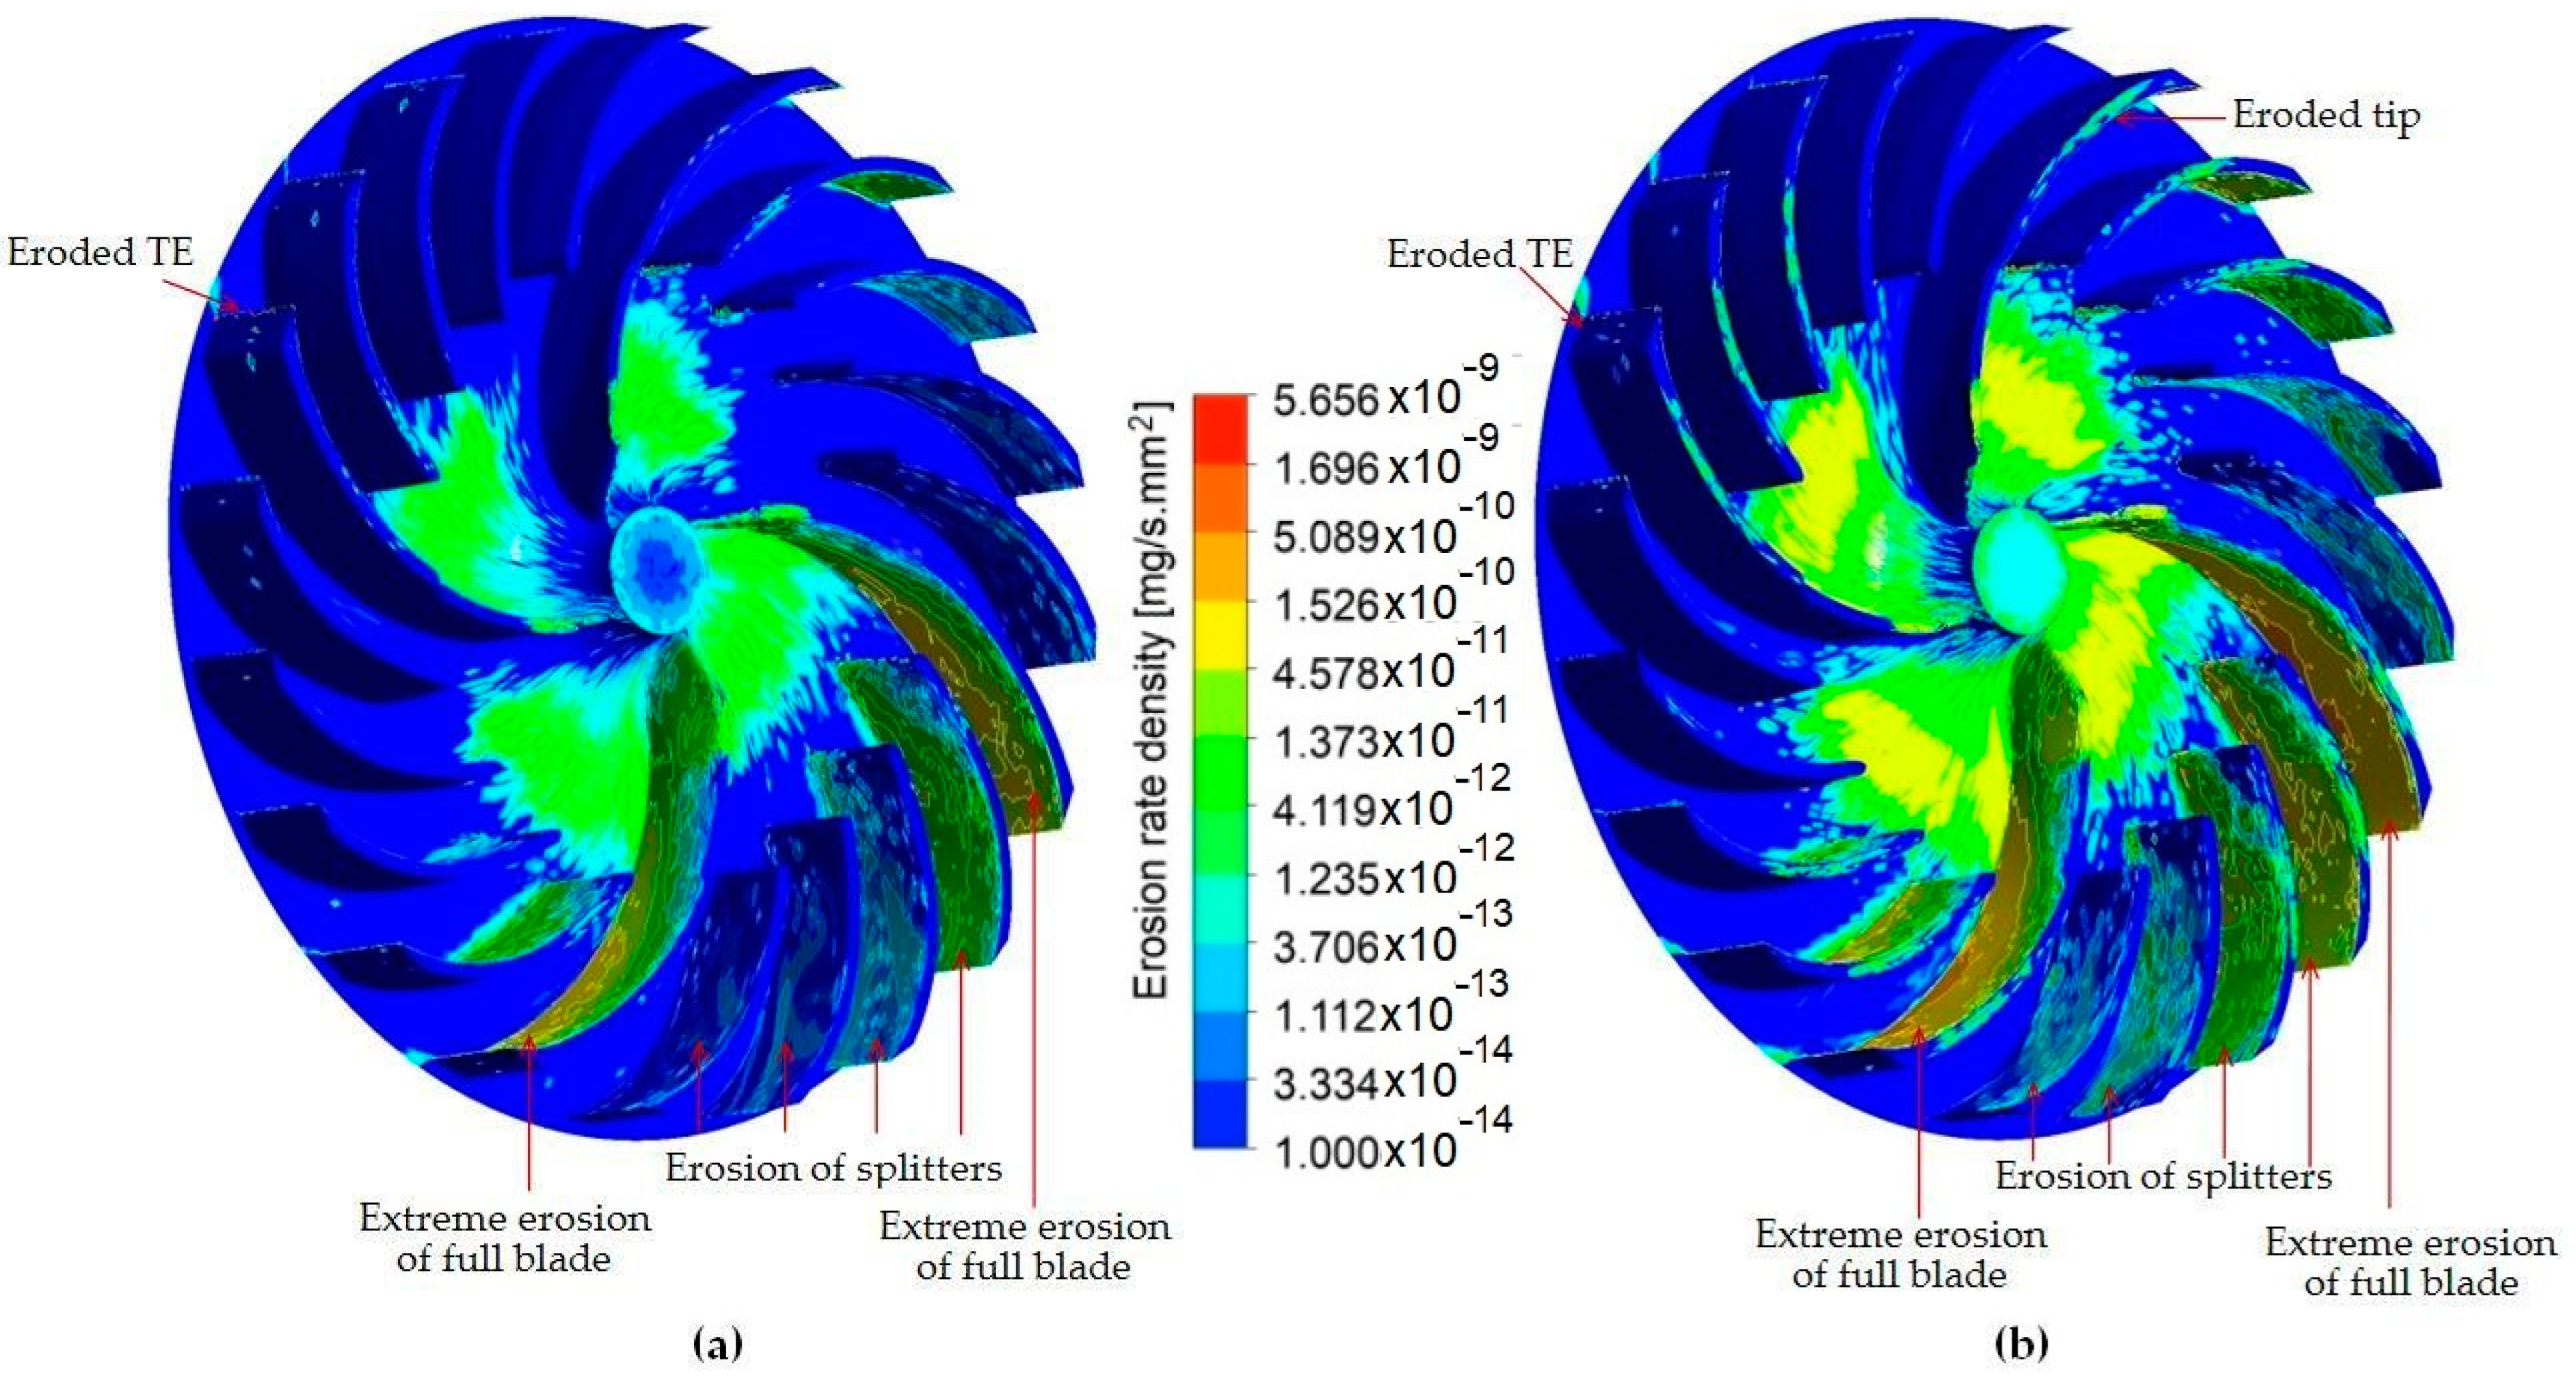
The contours of the erosion rate density are plotted with consistent scales to facilitate better comparisons between the erosion patterns. As shown in Figure 22, the areas experiencing significant erosion, caused by frequent impacts, include the paraxial region of the impeller bend, the LE and PS of the full blades, and the junction of blades with the hub. The hub from the entrance is hit by several particles, mostly at low velocities. The PS of the blades experiences a high-impact frequency by medium and large particles of high inertia force, while smaller particles, influenced by secondary flows, primarily impact the lower sections of the blades. In Figure 22a, the LE and front part of the PS of blades are impacted at normal angles, while the rear part is impacted at low and optimum angles, resulting in higher erosion rate densities in the second half of the PS, particularly towards the TE, due to centrifugal force. Small particles infiltrating the tip clearance caused marked erosion wear on the tips of blades. Although there are some impacts on the front part of the blades from the SS, the erosion rate density is insignificant. The full blades experience greater material removal compared to the splitters, as shown in Figure 22a. Erosion wear on the casing plate is attributed to ballistic impacts and repeated collisions by small particles. The distinct erosion patterns are more noticeable on the four full blades extending from the PS and SS junctions but with lower erosion rate densities.
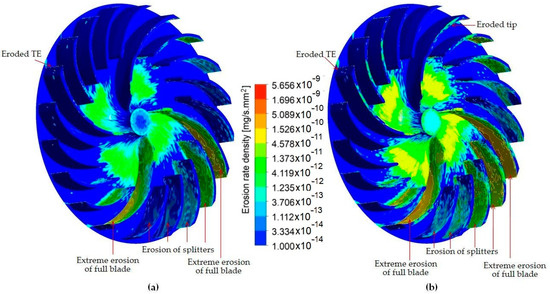
Figure 22.
Erosion patterns in the impeller, caused by Saharan dust (0.1–100 microns) of the concentration 500 μg/m3, operating at (a) the nominal flow rate and (b) maximum discharge.
The erosion process appears to be significantly influenced by the operating conditions when comparing Figure 22a with Figure 22b. Operating the fan at maximum flow discharge resulted in higher impingement velocities, impact frequency, and erosion rates due to increased particle flow velocities. The spreading of severe erosion is mostly apparent on the full blades from the PS, hub junction, and middle of the hub. On the other hand, the splitters exhibit uneven erosion rates compared to the full blades.
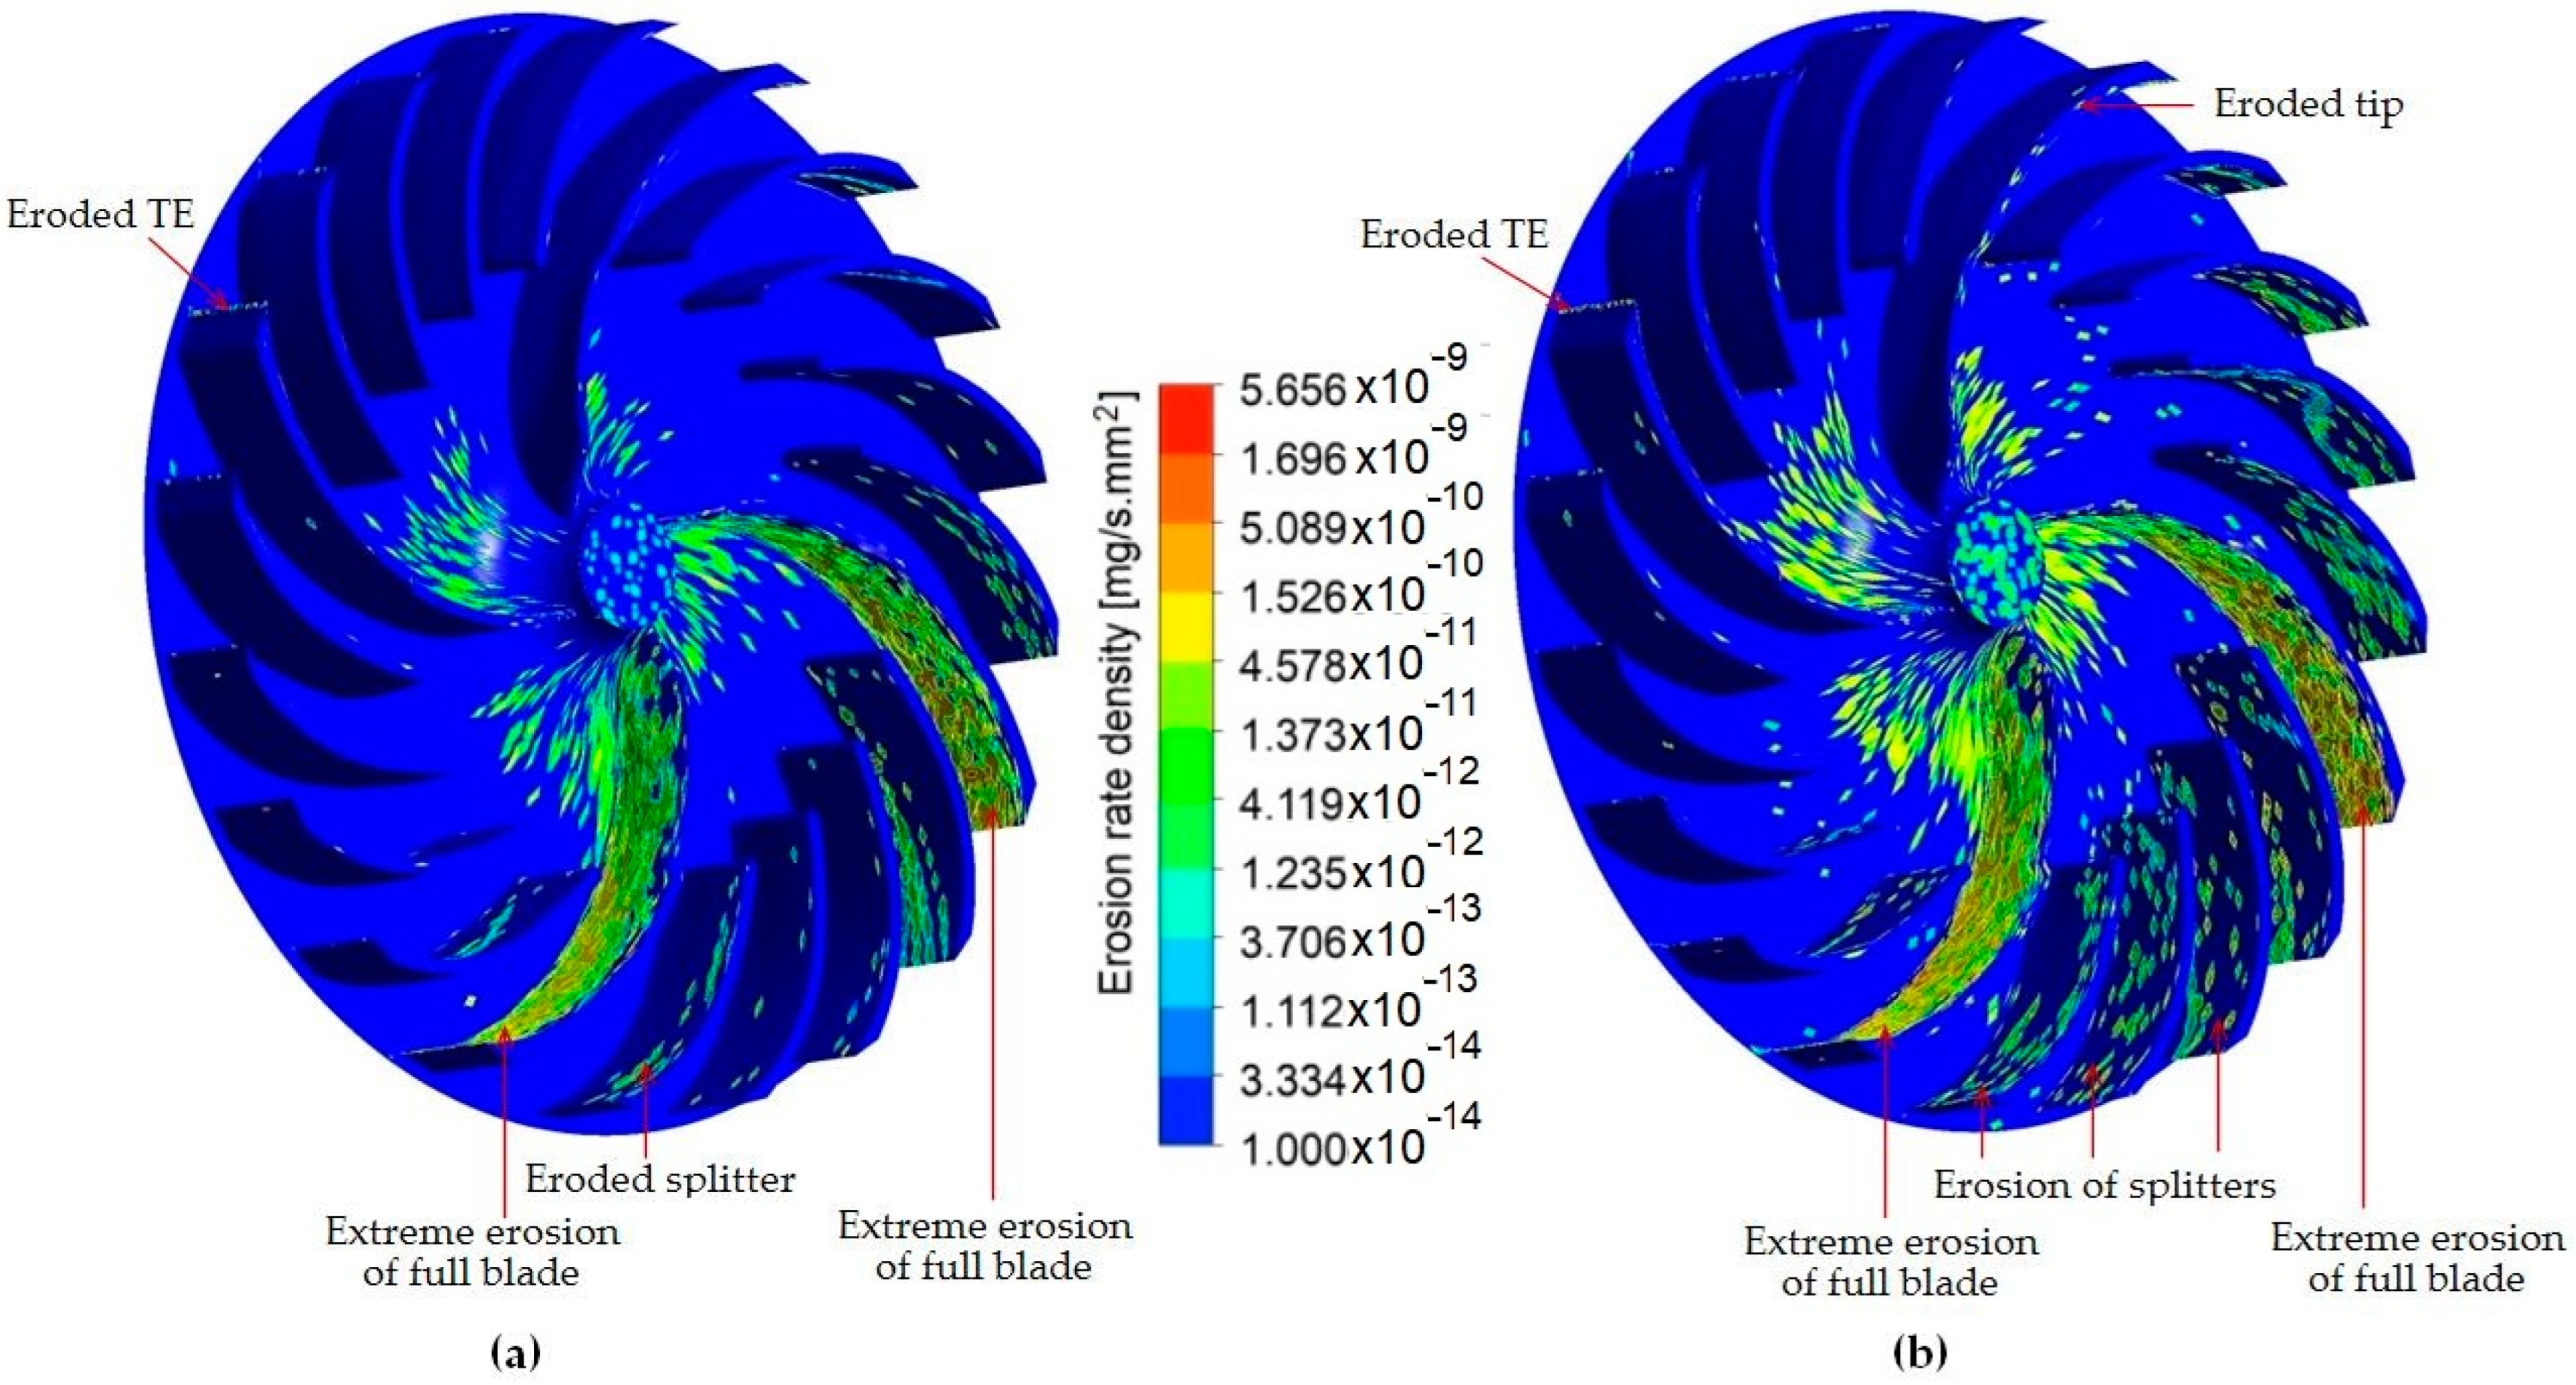
The computation results for AC-coarse dust (1–200 microns) considered the same concentration range while the centrifugal fan operated at both the nominal point and the maximum flow discharge. Larger dust particles caused higher local erosion rate densities and resulted in more dispersed impacts and scattered erosion for the impeller, as observed in Figure 23a,b. A comparison with the erosion patterns due to Saharan dust reveals distinct erosion rates and patterns, attributed to different inertia of particles, trajectories, and impacts. The scattered erosion caused by AC-coarse dust depicts dense spots with high erosion rates, while the erosion caused by Saharan dust is widespread. Typically, the central regions of the hub and the PS of the full blades are the most eroded by these coarser and heavier particles. In Figure 23b, erosion is shown to spread more over the splitters when operating at the maximum flow discharge.
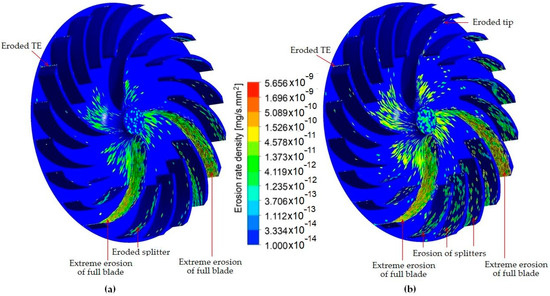
Figure 23.
Erosion patterns in the impeller, caused by AC-coarse dust (1–200 microns) of the concentration 500 μg/m3, operating at (a) the nominal flow rate and (b) maximum discharge.
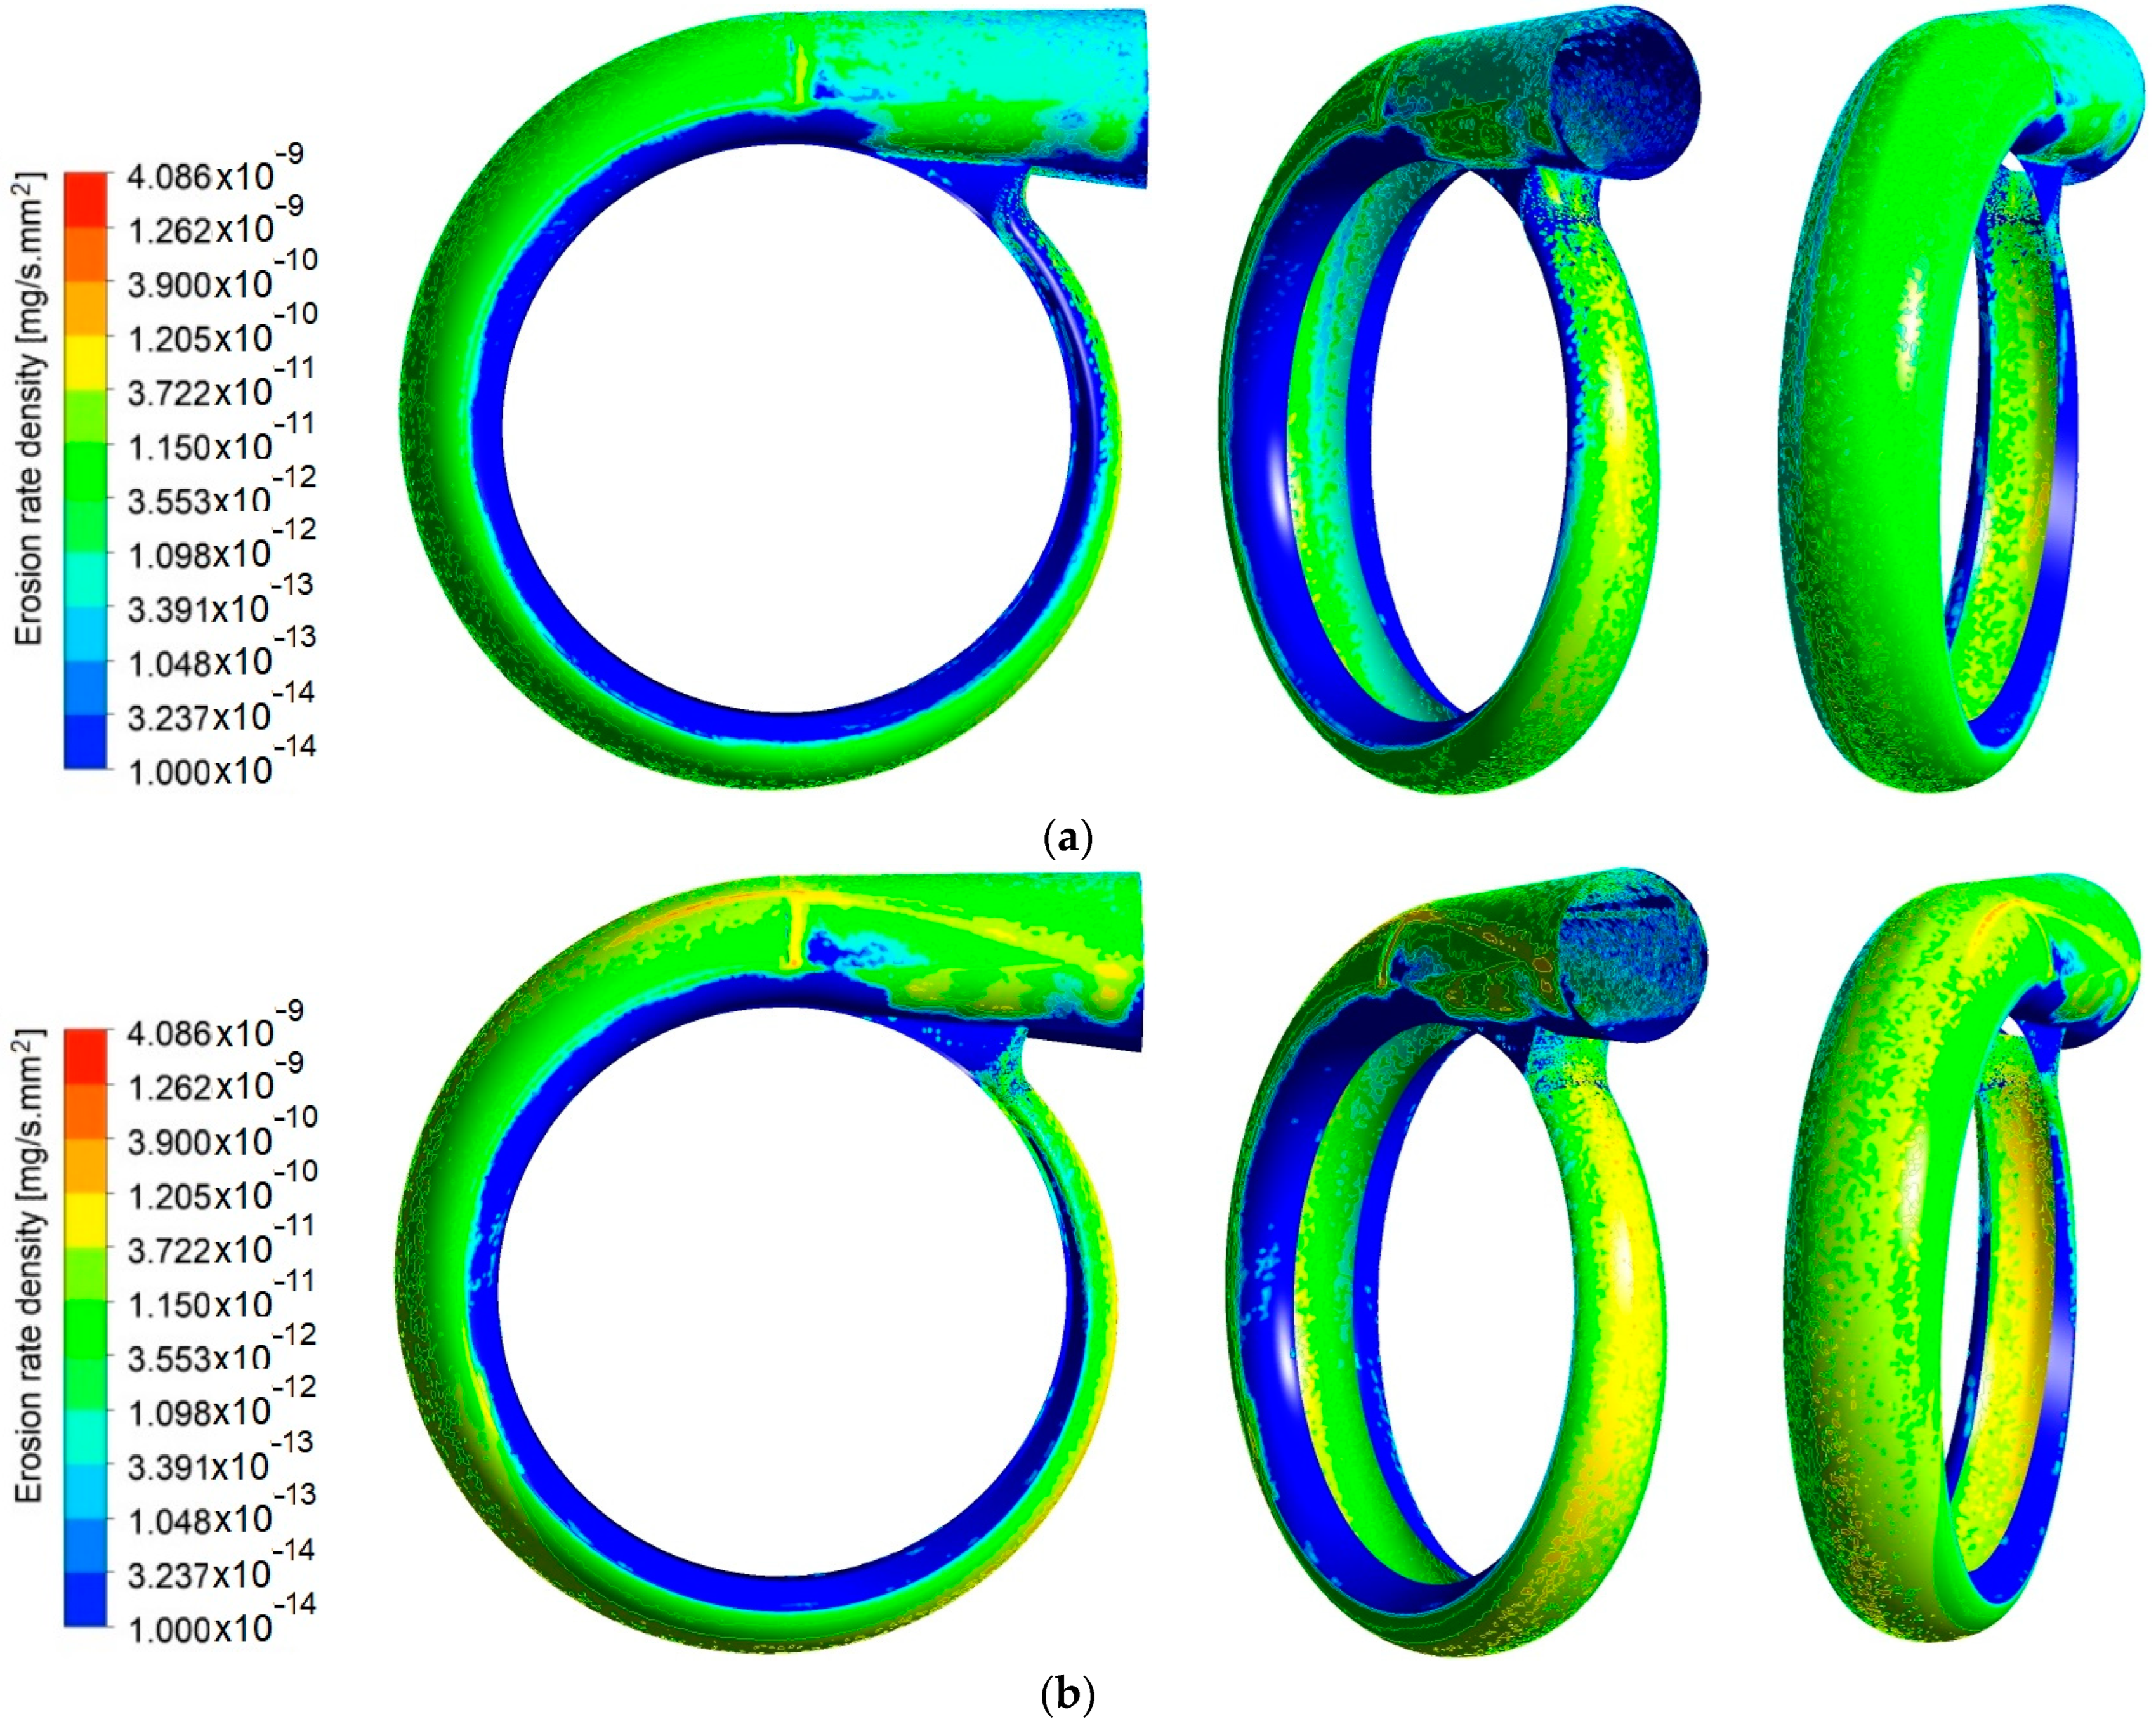
After exiting the impeller, dust particles enter the scroll with a high level of kinetic energy and particles continue their paths, resulting in multiple impacts on the wall of the scroll. The erosion rate density contours, with the same scale, are presented in Figure 24 and Figure 25 and compared. As shown in Figure 24a,b, the outermost diameter of the scroll experiences higher erosion rates, with noticeable spotted areas of extreme erosion rates caused by dense particles directly hitting the wall of the scroll. In contrast, the tongue region has lower erosion rates due to fewer impacts compared to the outer wall. Larger particles after impacts rebound and follow ballistic trajectories to cause high rates of erosion. On the other side, smaller particles tend to follow streamlines in the scroll and collide several times with the outer wall, resulting in lower erosion rates. It is evident that the erosion patterns in the scroll are affected by the operating conditions, as revealed by comparing between Figure 24a,b. This is attributed to the higher number of particles with higher velocities, leading to more frequent intense impacts.

Figure 24.
Erosion rate density in the scroll, caused by Saharan (0.1–100 microns) of the concentration 500 μg/m3, operating at (a) the nominal flow rate and (b) maximum discharge.
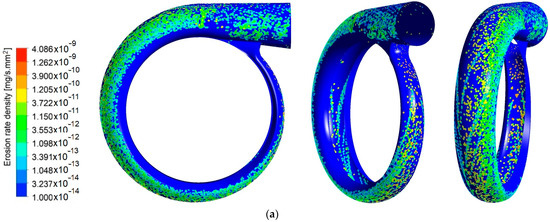
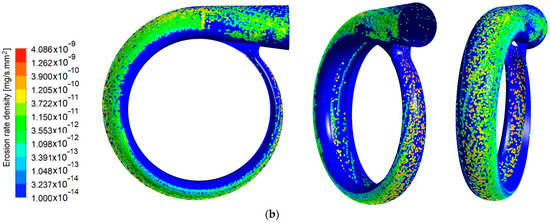
Figure 25.
Erosion rate density (mg/s·mm2) in the scroll, caused by AC-coarse dust (1–200 microns) of the concentration 500 μg/m3, operating at (a) the nominal flow rate and (b) maximum discharge.
Similar observations are made regarding the erosion caused by AC-coarse dust particles (1–200 microns). Concentrated areas of high erosion rates spreading over the outer wall of the scroll are presented in Figure 25a,b, as being primarily impacted by larger particles compared to the first dust sample. However, the region around the tongue is less eroded owing to the influence of the jet flow structure on small particles. The erosion rates are observed to increase and spread more while operating at the maximum flow discharge, since the particles have higher kinetic energy and higher impact velocities.
It can be inferred that the erosion patterns and development in this forward-curved blade centrifugal fan are primarily influenced by the high frequency of impacts related to the complex geometry and flow conditions. Areas with frequent impacts and high impingement velocity show noticeable erosion densities on the PS of the full blades and first splitter. In addition there are scattered erosion patterns on the casing plate facing the full blades and first splitter. The scroll exhibits large spreads of high erosion rates due to dense particle fluxes exiting the impeller and directly impinging the outer wall of the scroll, added to particles entrained by the fluid and being repeatedly colliding until exiting the scroll.
Table 1 presents a summary of the results in terms of the AERD (mg/s·mm2) and EMPH (mg/h) obtained for the centrifugal fan components under Saharan dust particle concentrations between 100 and 500 μg/m3 for the two operating conditions. It appears that the AERD of the full blades reaches the highest levels at about 11.220 × 10⁻¹² and 35.390 × 10⁻¹² mg/s·mm2 at the maximum dust concentration for the nominal point and maximum flow rate, respectively. The corresponding EMPH values for these two conditions are 1.148 × 10⁻³ and 3.621 × 10⁻³ mg/h. The impeller, including the full blades, splitters, and hub, has an overall AERD of about 2.739 × 10⁻¹² and 10.865 × 10⁻¹² mg/s·mm2, with EMPH values of 1.425 × 10⁻³ and 5.653 × 10⁻³ mg/h for the nominal point and maximum flow rate, respectively. The casing plate has an AERD of about 0.768 × 10⁻¹² and 5.003 × 10⁻¹² mg/s·mm2, resulting in EMPH values of 0.127 × 10⁻³ and 0.832 × 10⁻³ mg/h for the two operating conditions, respectively. Lastly, the scroll has an AERD of about 3.101 × 10⁻¹² and 9.048 × 10⁻¹² mg/s·mm2, and subsequently, the EMPH values are 1.621 × 10⁻³ and 4.729 × 10⁻³ mg/h for the nominal point and the maximum flow rate.

Table 1.
Erosion parameters of the centrifugal fan caused by Saharan dust (0.1–100 microns).
Table 2 presents results of AC-coarse dust ingestion for the same concentration range and operating conditions. It is clear that both the AERD and EMPH reach their highest values at the maximum concentration when operating at the high discharge. The impeller has an AERD of about 3.201 × 10⁻¹² and 8.006 × 10⁻¹² mg/s·mm2, resulting in an EMPH of 1.666 × 10⁻³ and 4.195 × 10⁻³ mg/h, between the nominal point and maximum flow rate, respectively. On the other side, the casing plate has an AERD of about 1.347 × 10⁻¹² and 6.600 × 10⁻¹² mg/s·mm2, with an EMPH of 0.224 × 10⁻³ and 1.097 × 10⁻³ mg/h, between the two operating conditions. Lastly, the scroll exhibits an AERD of about 6.794 × 10⁻¹² and 16.320 × 10⁻¹² mg/s·mm2, resulting in an EMPH of 3.551 × 10⁻³ and 8.531 × 10⁻³ mg/h, between the nominal point and maximum flow rate, respectively.
Table 2.
Erosion parameters of the centrifugal fan caused by AC-coarse dust (1–200 microns).
When referring to the highest concentration of Saharan dust, it is clear that the full blades exhibit the highest AERD values of about 11.220 × 10⁻¹² and 35.390 × 10⁻¹² mg/s·mm2, respectively, between the nominal point and maximum discharge. Then follows the scroll with AERD values of about 3.101×10⁻¹² and 9.048×10⁻¹² mg/s·mm2, respectively. The cumulated AERD of the impeller composed of full blades, splitters, and hub become 2.739 × 10⁻¹² and 10.865 × 10⁻¹² mg/s·mm2, attributed to less erosion on the three splitters. On the other side, AC dust results in the highest AERD values for the full blades, of about 14.130 × 10⁻¹² and 30.730 × 10⁻¹² mg/s·mm2, respectively, between the nominal point and maximum discharge, followed by the scroll of an AERD of 6.794 × 10⁻¹² and 16.320 × 10⁻¹² mg/s·mm2, respectively. Finally, the impeller has an overall AERD of 3.201 × 10⁻¹² and 8.062 × 10⁻¹² mg/s·mm2, respectively.
The reasons for different erosion patterns between the two dust samples can be attributed primarily to their dissimilar sizes and shapes. At their initial release points, according to inlet area, concentration, and flow conditions, the particles are assigned random sizes within the particle size distribution range, which is broader for the case of AC-coarse dust. According to sizes and inertia of particles, the trajectories, impacts locations and frequency and their induced erosion patterns behave differently.
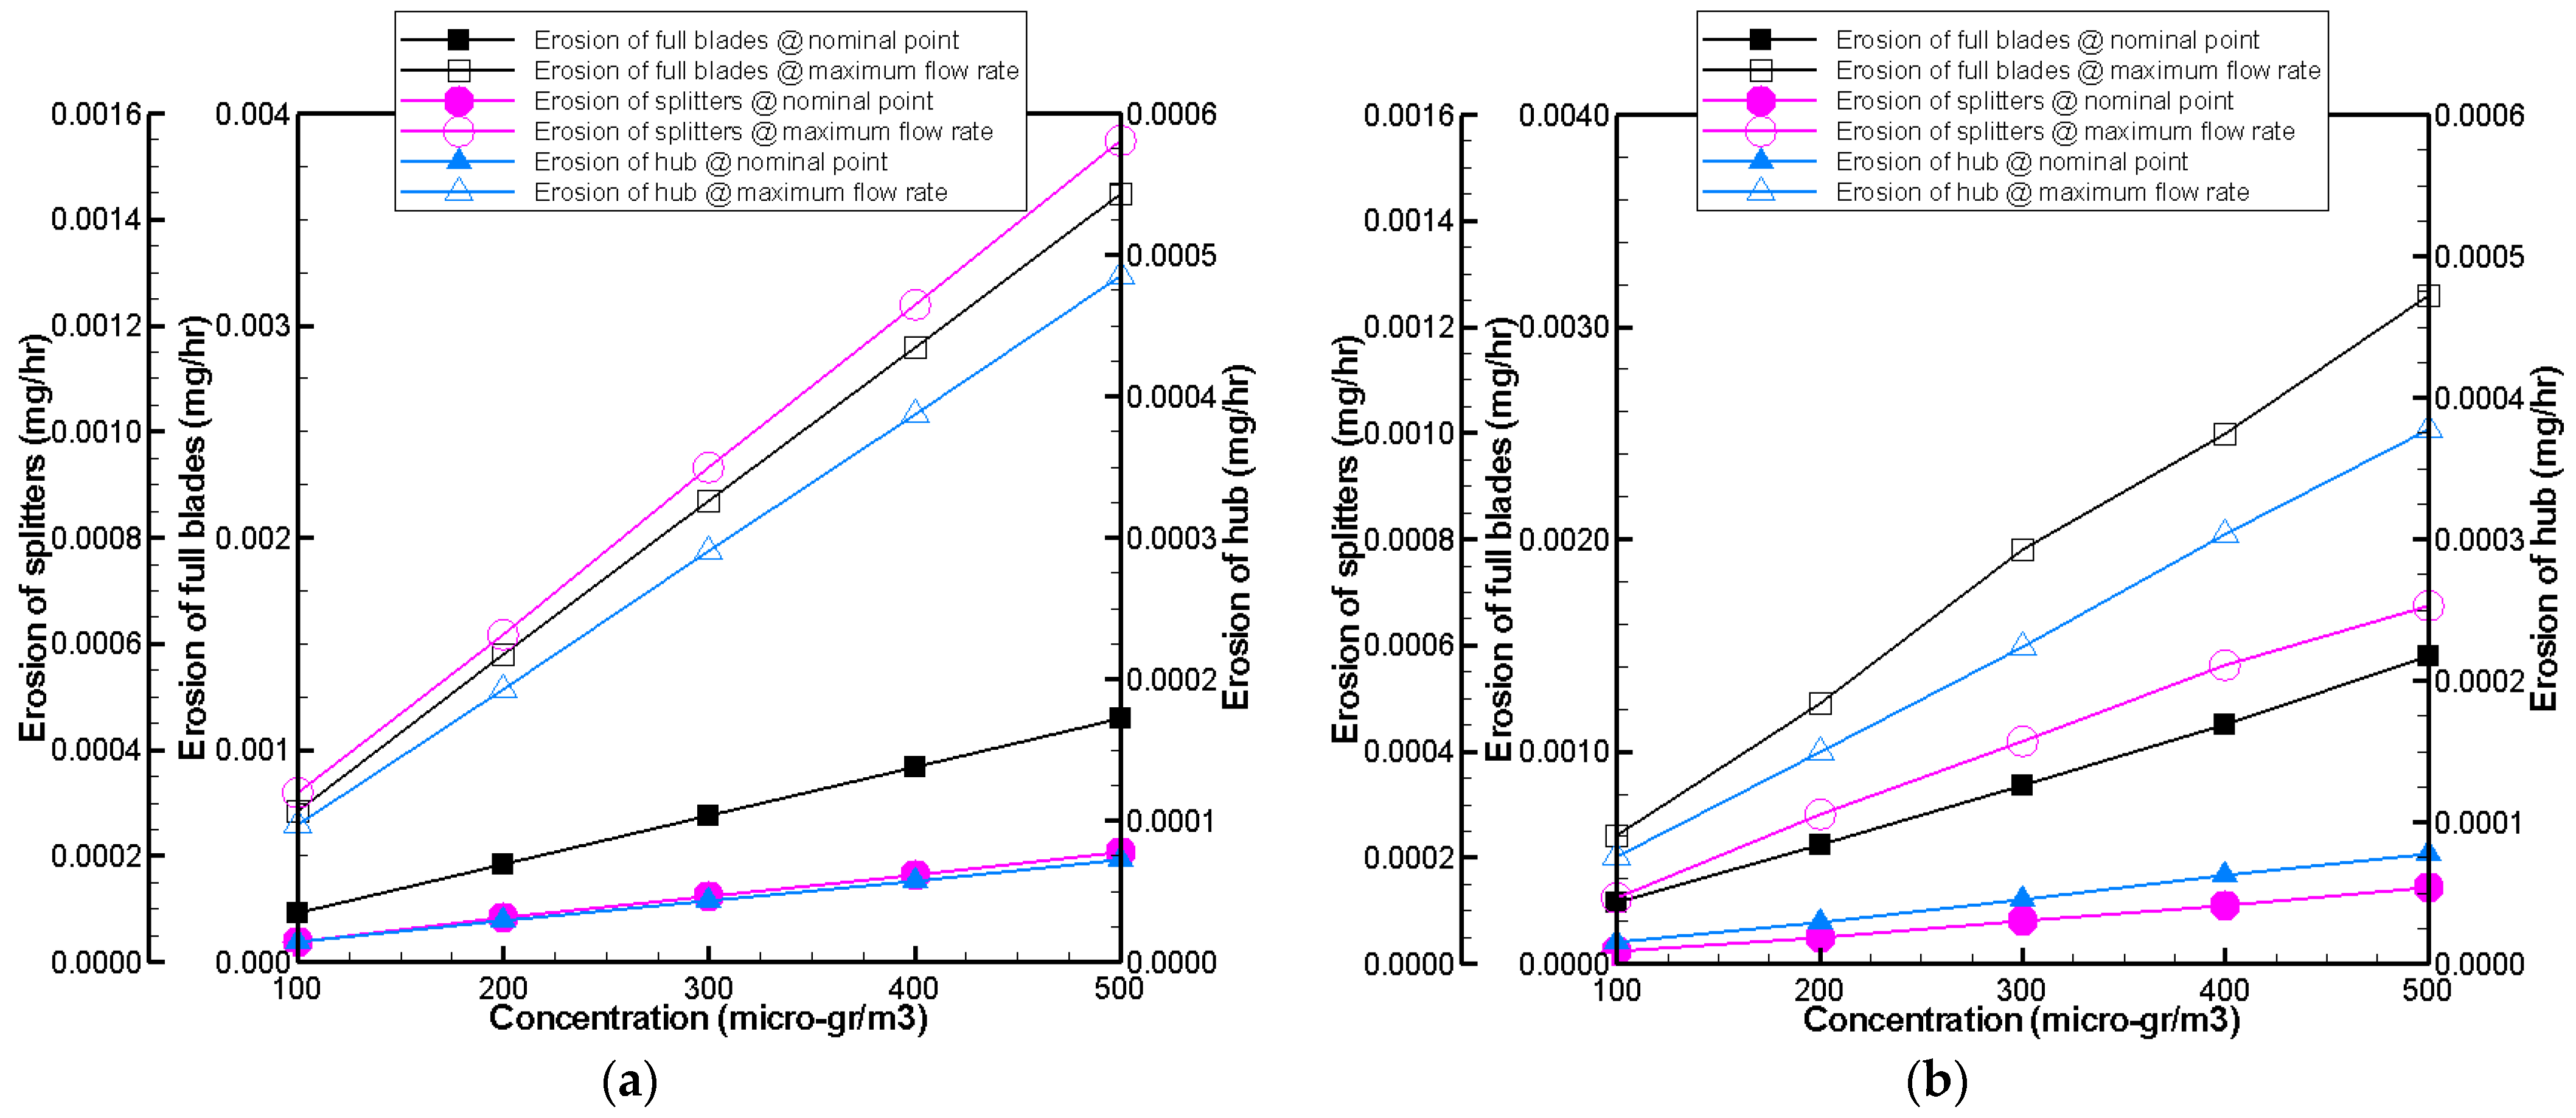
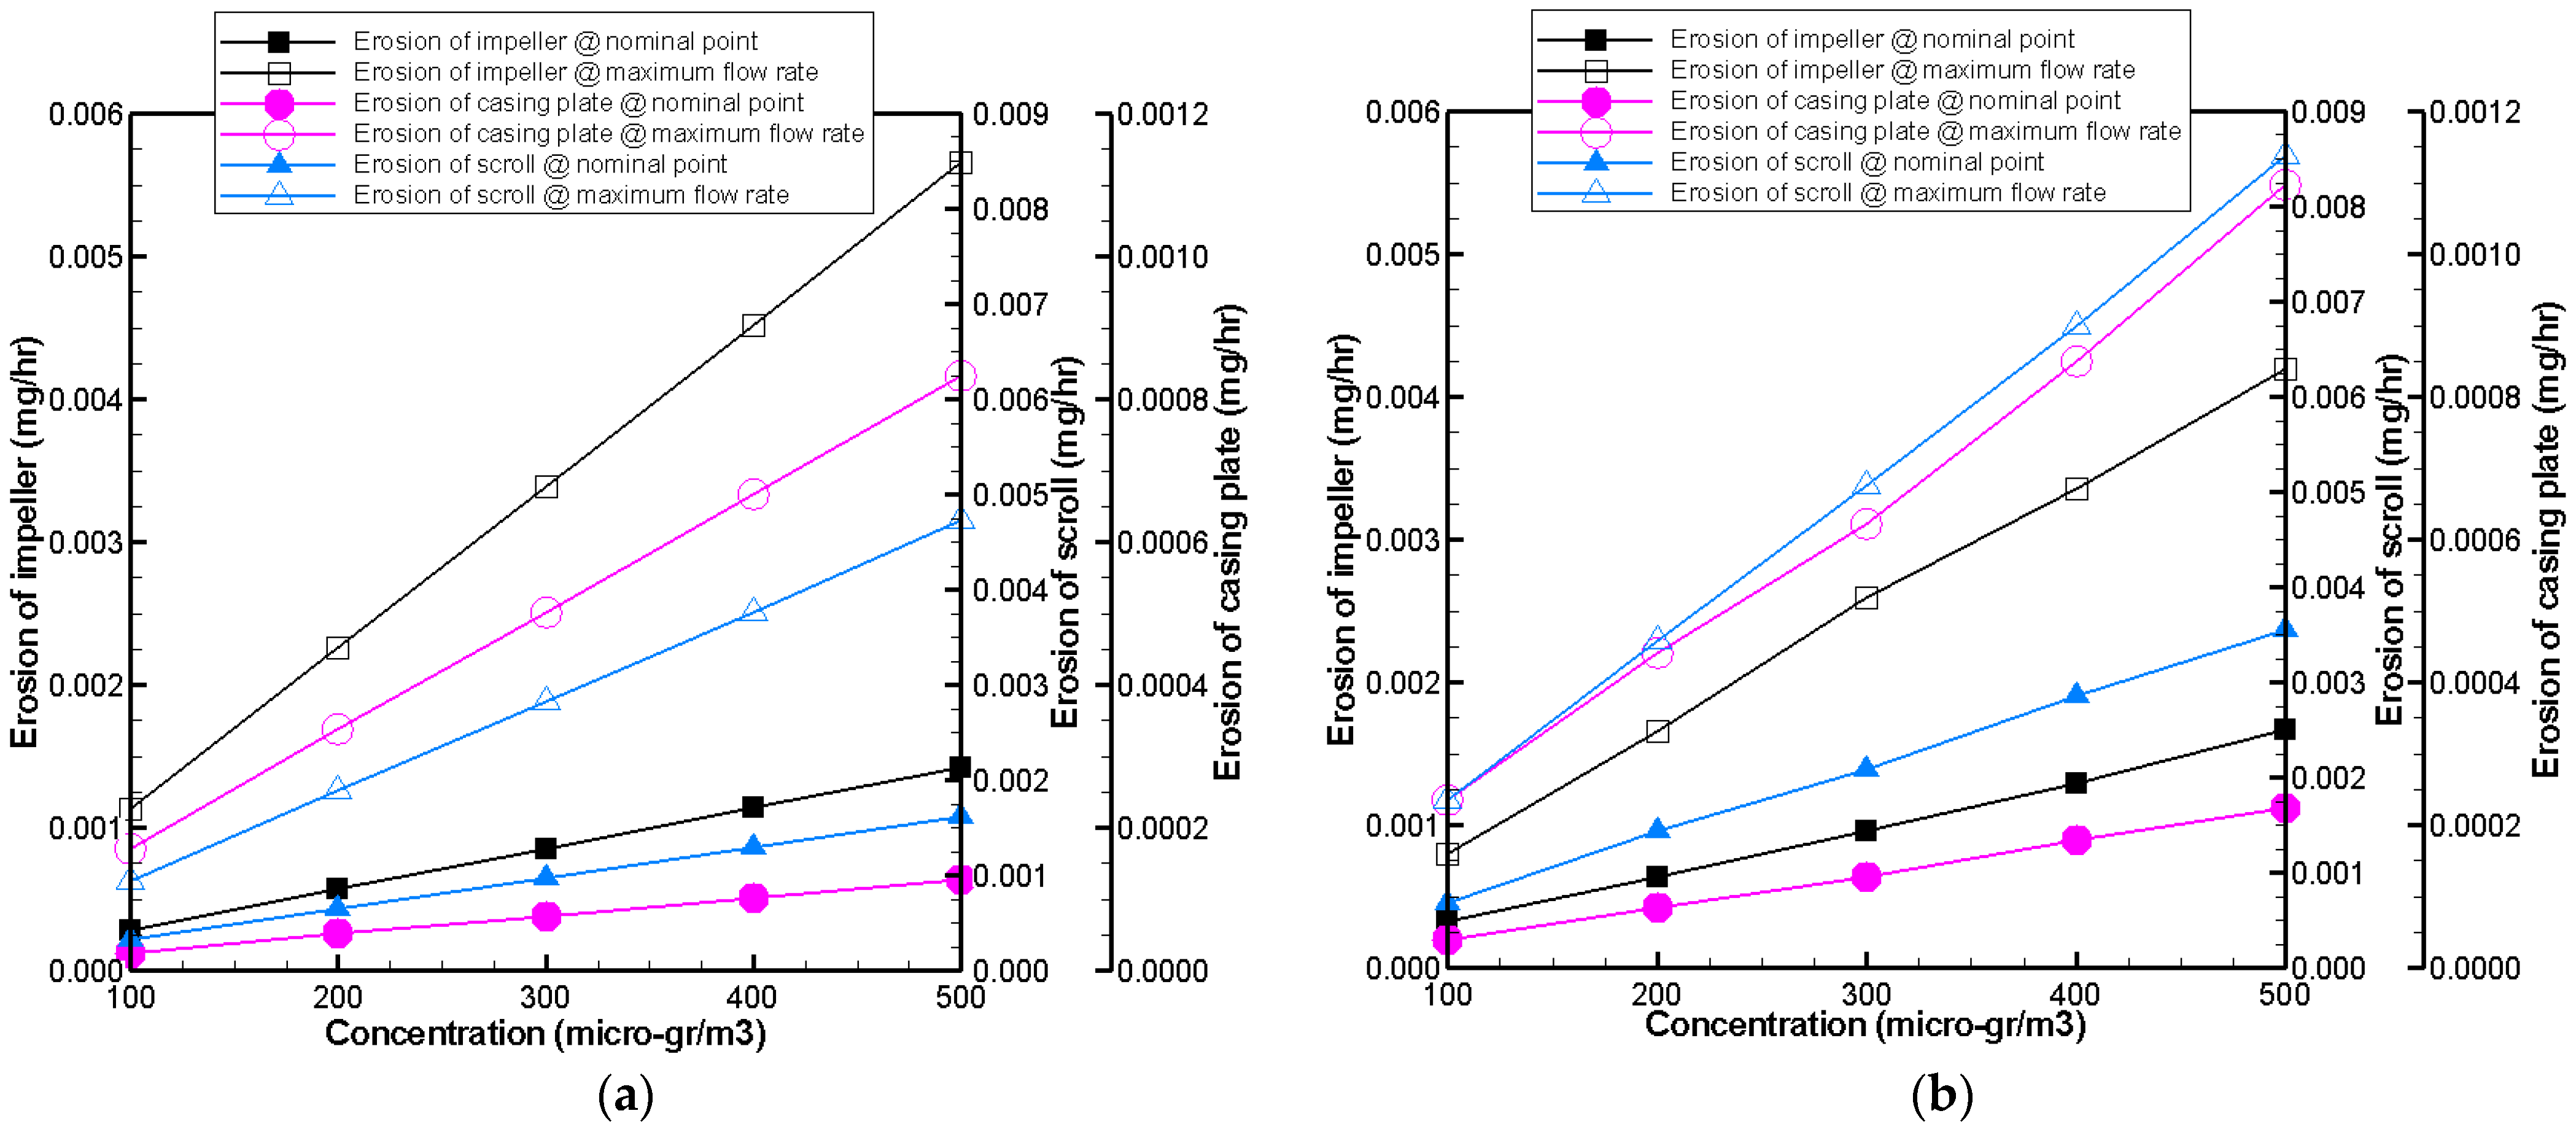
Figure 26a,b and Figure 27a,b depict the erosion damage to the fan components, which is influenced by factors like particle concentration, type and size, and fan operating conditions. Increasing the airflow rate more particles are ingested at higher velocities, leading to a higher frequency of impacts and erosion. The dust particles of type AC-coarse are more aggressive compared with the finer Saharan dust and caused higher erosion rate densities. However, the involved number of AC-coarse particles is less which caused scattered erosion compared to the Saharan dust of finer sizes and higher number of particles that induced a higher frequency of impacts and widespread erosion.

Figure 26.
EMPH (mg/h) of the impeller, caused by (a) Saharan dust (0.1–100 microns) and (b) AC-coarse dust (1–200 microns).
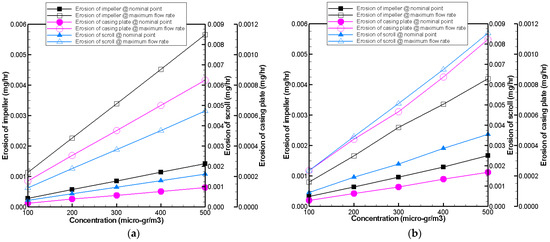
Figure 27.
EMPH (mg/h) of centrifugal fan parts, caused by (a) Saharan dust (0.1–100 microns) and (b) AC-coarse dust (1–200 microns).
It can be concluded that the material removal as quantified in terms of EMPH depends not only on the particle concentration but also on particle type and size and the flow details related to the fan operation.
Table 3 recapitulates the material removal from the components in relation to the EMPH. The scroll and casing plate are both heavily eroded by AC-coarse dust compared to Saharan dust. However, the erosion of the impeller surfaces differs due to variations in the particle numbers, sizes, and flow structures that depend on the fan’s operating point. The EMPH of the full blades is higher with AC-coarse dust, having a value of 1.4457 μg/h at the nominal point, but at high flow discharge, Saharan dust caused more material removal of about 3.6208 μg/h. On the other side, when considering Saharan dust the EMPH of the splitters is the highest and equals 0.2058 and 1.5475 μg/h at the two operating points, respectively. The impeller hub also experiences higher EMPH due to the Saharan dust. The entire impeller has a higher EMPH of about 1.6659 μg/h compared with the AC-coarse dust. In contrast, at high discharge, the Saharan dust caused more erosion and an EMPH of about 5.6535 μg/h. In conclusion, the scroll and casing plate are subject to significant erosion independently of the fan operation, while the impeller is more eroded by AC-coarse dust when operating at the nominal point and by Saharan dust at a high discharge.
Table 3.
Compared EMPH at the highest concentration.
The continuation of erosion calculations for different rotational speeds and flow rates is extremely helpful to obtain a comprehensive erosion map and establish a correlation for predicting blade surface deterioration for similar fan designs.
7. Conclusions
The current calculations of particle trajectories highlight the erosion damage in this category of forward-curved blade centrifugal fans, where the following points are enumerated:
- ▪
- This forward-curved blade impeller exhibits flow complexity due to regions of swirl and recirculation, poor flow guidance at the blade entrance, and non-uniformity at the impeller exit.
- ▪
- The scroll is characterized by two large counter-rotating eddies occupying the entire cross-sections.
- ▪
- The blockage in the tongue region caused the fluid to be recirculated from the volute through the impeller inlet.
- ▪
- Small particles are more susceptible to the drag force, and sensitive to the secondary flows and leakage flow, so they closely follow the streamlines. In contrast, large particles behave differently owing to their greater inertia and centrifugal force relative to the drag force.
- ▪
- The high frequency of impacts on the outer wall of the scroll is caused by particles travelling multiple times via the tongue and colliding with the scroll.
- ▪
- The axial–radial bend of the impeller hub and the full blades exhibit high erosion rates, while the splitters have unevenly distributed erosion over the PS.
- ▪
- The casing plate depicts noticeable erosion alongside the full blades and first splitter.
- ▪
- The scroll shows significant erosion rates across the outer walls, associated with the dense flux of particles exiting the impeller at high velocities.
- ▪
- The non-uniformities of erosion patterns may be related to the flow nature of the impeller, as characterized by large recirculations and flow separations.
- ▪
- It can be inferred that AC-coarse dust particles caused significant erosion of the scroll and casing plate, independently of the fan operation.
- ▪
- The impeller is more affected by AC-coarse dust when operating at the nominal point compared to the high discharge point, where Saharan dust caused more erosion.
- ▪
- The identification of areas prone to erosion will help selecting adequate coatings to improve erosion resistance.
A correlation can be established between the degradation of the performance, the type and size of the particles, concentration, and the operating conditions for this specific category of centrifugal fans.
Funding
This research received no external funding.
Institutional Review Board Statement
Not applicable.
Informed Consent Statement
Not applicable.
Data Availability Statement
Data are contained within the article.
Conflicts of Interest
The author declared no potential conflicts of interest with respect to the research, authorship, and/or publication of this article.
Nomenclature
| area (m2) | |
| c | chord (m) |
| drag coefficient | |
| shear lift force coefficient | |
| slip–rotation lift coefficient | |
| rotational coefficient | |
| d | diameter of particle (m) |
| E | erosion rate density (mg/s·mm2) |
| f | force reduced by mass (N/kg) |
| F | force (N) |
| g | gravity (m/s2) |
| H | pressure head (mmH2O) |
| k | turbulent kinetic energy (m2/s2) |
| m | mass (kg) |
| normal unit vector | |
| p | pressure (Pa) |
| P | power (W) |
| r | radius, radial co-ordinate (m) |
| Re | Reynolds number |
| particle Reynolds number | |
| shear flow Reynolds number | |
| time (s) | |
| tangential unit vector | |
| torque (N·m) | |
| velocity (m/s) |
Greek Symbols
| β | impact angle (deg) |
| local erosion rate (mg/g) | |
| η | efficiency |
| ρ | density (kg/m3) |
| μ | dynamic viscosity (kg/m.s) |
| blade speed of rotation (rad/s) | |
| fluid rotation (s−1) | |
| relative fluid rotation (s−1) | |
| angular velocity of particle (s−1) |
Subscripts
| abs | absolute |
| f | fluid |
| in | input |
| p | particle |
| r | radial |
| rel | relative |
| s | static |
| t-s | total-to-static |
| θ | tangential direction |
| z | axial direction |
| 1, 2 | impact/rebound |
Abbreviations
| AERD | average erosion rate density |
| EMPH | eroded mass per hour |
| LE | leading edge |
| PS | pressure side |
| SS | suction side |
| TE | trailing edge |
References
- Meher-Homji, C.; Bromley, A.F.; Stalder, J.P. Gas turbine performance deterioration and compressor washing. In Proceedings of the 2nd Middle East Turbomachiery Symposium, Doha, Qatar, 17–20 March 2013. [Google Scholar]
- Atkin, M.L.; Duke, G.A. Erosion Prediction in Turbomachinery Resulting From Environmental Particles; Aeronautical Research Laboratory: Melbourne, VIC, Australia, 1971.
- Kurz, R.; Brun, K. Degradation in Gas Turbine Systems. J. Eng. Gas Turbines Power 2001, 123, 70–77. [Google Scholar] [CrossRef]
- Tabakoff, W.; Balan, C. Effects of Solid Particles Suspended in Fluid Flow through an Axial Flow Compressor Stage. In Proceedings of the International Symposium on Air Breathing Engines, Bangalore, India, 16–18 February 1981. Paper No. 75. [Google Scholar]
- Ghenaiet, A.; Tan, S.C.; Elder, R.L. Experimental investigation of an axial fan erosion and performance degradation. Proc. Inst. Mech. Eng. Part A J. Power Energy 2004, 218, 437–450. [Google Scholar] [CrossRef]
- Ghenaiet, A.; Tan, S.C.; Elder, R.L. Prediction of an Axial Turbomachine Performance degradation. Proc. Inst. Mech. Eng. Part A J. Power Energy 2005, 219, 273–287. [Google Scholar] [CrossRef]
- Hussein, M.F.; Tabakoff, W. Dynamic Behavior of Solid Particles Suspended by Polluted Flow in a Turbine Stage. J. Aircr. 1973, 10, 434–440. [Google Scholar] [CrossRef]
- Elsayed, A.F.; Rashed, M.I.I. Erosion in Centrifugal Compressors. In Proceedings of the Fifth International Conference on Erosion by Liquid and Solid Impact, Cambridge, UK, 2–6 September 1979; University of Cambridge: Cambridge, UK, 1979. Paper No. 55. [Google Scholar]
- Mengiiturk, M.; Sverdrup, E.F. Computer Calculation of Fan Erosion in Coal-Fired Power Plants. Part 1: Centrifugal Fans. Int. J. Turbo Jet Engines 1985, 2, 169–176. [Google Scholar] [CrossRef]
- Elfeki, S.; Tabakoff, W. Erosion Study of Radial Flow Compressor with Splitters. ASME J. Turbomach. 1987, 109, 62–69. [Google Scholar] [CrossRef]
- Harris, P.K. Erosion in Centrifugal Compressor Impellers. Ph.D. Thesis, Cranfield University, Wharley End, UK, 1996. [Google Scholar]
- Cardillo, L.; Corsini, A.; Delibra, G.; Rispoli, F.; Sheard, A.G.; Venturini, P. Simulation of Particle-Laden Flows in a Large Centrifugal Fan for Erosion Prediction. In Proceedings of the ASME Turbo Expo 2014, Düsseldorf, Germany, 16–20 June 2014. Paper No. GT2014-25865. [Google Scholar] [CrossRef]
- Fritsche, M.; Epple, P.; Steber, M.; Rußwurm, H.J. Erosion Optimized Radial Fan Impellers and Scrolls for Particle Flows. In Proceedings of the ASME 2017 International Mechanical Engineering Congress and Exposition, Tampa, FL, USA , 3–9 November 2017; American Society of Mechanical Engineers: New York, NY, USA, 2017. Paper No. IMECE2017-71825. [Google Scholar] [CrossRef]
- Aldi, N.; Casari, N.; Pinelli, M.; Suman, A.; Vulpio, A.; Saccenti, P.; Beretta, R.; Fortini, A.; Merlin, M. Erosion Behavior on a Large-Sized Centrifugal Fan. In Proceedings of the 13th European Conference on Turbomachinery Fluid dynamics & Thermodynamics ETC13, Lausanne, Switzerland, 8–12 April 2019. Paper ID: ETC2019-389. [Google Scholar]
- Mandi, R.P.; Yaragatti, U.R. Energy Efficiency Improvement of Auxiliary Power Equipment in Thermal Power Plant through Operational Optimization. In Proceedings of the 2012 IEEE International Conference on Power Electronics, Drives and Energy Systems, Bengaluru, India, 16–19 December 2012. [Google Scholar]
- Holzdeppe, D. Particle Flow Erosion at Ventilator Components. In Basic Principles of Erosion and Materials/Coatings Resistant against ParticleFlow Erosion; TLT-Turbo GmbH: Zweibrücken, Germany, 2015. [Google Scholar]
- Zhang, J.; Han, Z.; Yin, W.; Wang, H.; Ge, C.; Jiang, J. Numerical Experiment of the Solid Particle Erosion of Bionic Configuration Blade of Centrifugal Fan. Acta Metall. Sin. 2013, 26, 16–24. [Google Scholar] [CrossRef]
- Han, Z.; Yin, W.; Zhang, J.; Jiang, J.; Niu, S.; Ren, L. Erosion-Resistant Surfaces Inspired by Tamarisk. J. Bionic. Eng. 2013, 10, 479–487. [Google Scholar] [CrossRef]
- Ghenaiet, A. Effects of Sand Ingestion through an Axial Fan with Blade Staggering. In Proceedings of the ASME Turbo Expo 2008: Power for Land, Sea, and Air, Berlin, Germany, 9–13 June 2008; American Society of Mechanical Engineers: New York, NY, USA, 2008; pp. 239–255, Paper No. GT2008-50338. [Google Scholar] [CrossRef]
- Ghenaiet, A. Simulation of Erosive Effects of Sand Particle Impacts in Axial Turbomachinery; AIP, American Institute of Physics: College Park, MD, USA, 2010; CP1220; pp. 78–90. ISBN 978-0-7354-0766-4. [Google Scholar]
- Ghenaiet, A. Study of Sand Particle Trajectories and Erosion Into the First Compression Stage af a Turbofan. ASME J. Turbomach. 2012, 134, 051025. [Google Scholar] [CrossRef]
- Ghenaiet, A. Simulation of Particle Trajectories and Erosion in a Centrifugal Compressor. ASME J. Turbomach. 2012, 134, 051022. [Google Scholar] [CrossRef]
- Ghenaiet, A. Effects of Solid Particle Ingestion through an Hp Turbine. In Proceedings of the ASME Turbo Expo 2012: Turbine Technical Conference and Exposition, Copenhagen, Denmark, 11–15 June 2012; American Society of Mechanical Engineers: New York, NY, USA, 2012; pp. 1583–1595, Paper No. GT2012-69875. [Google Scholar] [CrossRef]
- Ghenaiet, A. Prediction of Erosion in Radial Turbine Components. In Proceedings of the ASME Turbo Expo 2010: Power for Land, Sea, and Air, Glasgow, UK, 14–18 June 2010; American Society of Mechanical Engineers: New York, NY, USA, 2010. Paper No. GT2010-22419. [Google Scholar]
- Fluent 6.1 User’s Guide; Fluent Inc.: New York, NY, USA, 2003.
- White, F.M. Fluid Mechanics, 5th ed.; McGraw-Hill: New York, NY, USA, 2003; p. 467. [Google Scholar]
- Sommerfeld, M. Theoretical and Experimental Modelling of Particulate Flow; Technical Report Lecture Series; Von Karman Institute for Fluid Dynamics: Sint-Genesius-Rode, Belgium, 2006. [Google Scholar]
- Haider, A.; Levenspiel, O. Drag Coefficient and Terminal Velocity of Spherical and Non Spherical Particles. J. Powder Technol. 1989, 58, 63. [Google Scholar] [CrossRef]
- Soo, S.L. Fluid Dynamics of Multiphase Systems; Ginn and Blaisdell Publishing Co.: Waltham, MA, USA, 1967. [Google Scholar]
- Thompson, T.L.; Clark, N.N. A Holistic Approach to Particle Drag Prediction. Powder Technol. 1991, 67, 57–66. [Google Scholar] [CrossRef]
- Saffman, P. The lift on a Small Sphere in a Slow Shear Flow. J. Fluid Mech. 1965, 22, 385–400. [Google Scholar] [CrossRef]
- Mei, R. An approximated Expression for the Shear Lift Force on a Spherical Particle at Finite Reynolds Number. Int. J. Multiph. Flow 1992, 18, 145–147. [Google Scholar] [CrossRef]
- Crowe, C.T.; Sommerfeld, M.; Tsuji, Y. Multiphase Flows with Droplets and Particles; CRC Press: Boca Raton, FL, USA, 1998. [Google Scholar]
- Oesterlé, B.; Dinh, T.B. Experiments on the lift of a spinning sphere in a range of intermediate Reynolds numbers. Exp. Fluids 1998, 25, 16–22. [Google Scholar] [CrossRef]
- Dennis, S.C.R.; Singh, S.N.; Ingham, D.B. The Steady Flow Due To Rotating Sphere at Low And Moderate Reynolds Numbers. J. Fluid Mech. 1980, 101, 257–279. [Google Scholar] [CrossRef]
- Gosman, A.D.; Ionnides, E. Aspects of Computer Simulation of Liquid Fuelled Combustors. In Proceedings of the 19th Aerospace Science Meeting, St. Louis, MO, USA, 12–15 January 1981. Paper AIAA 81-0323. [Google Scholar]
- Brown, D.J.; Hutchinson, P. The Interaction of Solid or Liquid and Turbulent Fluid Flow Fields—A Numerical Simulation. ASME J. Fluids Eng. 1979, 101, 265–269. [Google Scholar] [CrossRef]
- Shirolkar, J.S.; Coimbra, C.F.M.; Queiroz, M.Q. Fundamental Aspects of Modeling Turbulent Particle Dispersion in Dilute Flows. Prog. Energy Combust. Sci. 1996, 22, 363–399. [Google Scholar] [CrossRef]
- Sommerfeld, M. Modelling of Particle-Wall Collisions in Confined Gas-Particle Flows. Int. J. Multiph. Flow 1992, 18, 905–926. [Google Scholar] [CrossRef]
- Breuer, M.; Alletto, M.; Langfeldt, F. Sand Grain Roughness Model for Rough Walls Within Eulerian-Lagrangian Predictions of Turbulent Flows. Int. J. Multiph. Flow 2012, 43, 157–175. [Google Scholar] [CrossRef]
- Tabakoff, W.; Hamed, A.; Murugan, D.M. Effect of Target Materials on the Particle Restitution Characteristics for Turbomachinery Application. J. Propuls. Power 1996, 12, 260–266. [Google Scholar] [CrossRef]
- Schulz, M.; Tsyro, S.; Mortier, A.; Valdebenito, A.; Benedictow, A. Saharan Dust Episode of 13–18 March 2022, Episode Analysis: CAMS2_71 Report N°01 in 2022. Issued by Norwegian Meteorological Institute. Available online: https://atmosphere.copernicus.eu/sites/default/files/publications/CAMS271_2021SCx_D1.1.1._202306_2022_Interim_Assessment_Report_v3.pdf (accessed on 30 April 2022).
- Ryder, C.L.; Marenco, F.; Brooke, J.K.; Estelles, V.; Cotton, R.; Formenti, P.; McQuaid, J.B.; Price, H.C.; Liu, D.; Ausset, P.; et al. Coarse-mode mineral dust size distributions, composition and optical properties from AER-D aircraft measurements over the tropical eastern Atlantic. Atmos. Chem. Phys. 2018, 18, 17225–17257. [Google Scholar] [CrossRef]
- Mund, M.G.; Guhne, H. Gas Turbines—Dust—Air Cleaners: Experience and Trends. In Proceedings of the ASME 1970 International Gas Turbine Conference and Products Show, Brussels, Belgium, 24–28 May 1970; American Society of Mechanical Engineers: New York, NY, USA, 1970. 27p; Paper No. 70-GT-104, V01BT02A037. [Google Scholar] [CrossRef]
- Finnie, I. Erosion of Surfaces by Solid Particles. Wear 1960, 3, 87–103. [Google Scholar] [CrossRef]
- Bitter, J.G.A. A Study of Erosion Phenomena. Wear 1963, 6, 5–21, 169–190. [Google Scholar] [CrossRef]
- Grant, G.; Tabakoff, W. Erosion Prediction in Turbomachinery Due to Environmental Solid Particles. In Proceedings of the AIAA 12th Aerospace Sciences Meeting, Washington, DC, USA, 30 January–1 February 1974. AIAA Paper No. 74-16. [Google Scholar] [CrossRef]


Disclaimer/Publisher’s Note: The statements, opinions and data contained in all publications are solely those of the individual author(s) and contributor(s) and not of MDPI and/or the editor(s). MDPI and/or the editor(s) disclaim responsibility for any injury to people or property resulting from any ideas, methods, instructions or products referred to in the content. |
© 2024 by the author. Licensee MDPI, Basel, Switzerland. This article is an open access article distributed under the terms and conditions of the Creative Commons Attribution (CC BY-NC-ND) license (https://creativecommons.org/licenses/by-nc-nd/4.0/).