


Factors Affecting Single and Multivehicle Motorcycle Crashes: Insights from Day and Night Analysis Using XGBoost-SHAP Algorithm

 ,
, 
 ,
,  and
and 
Abstract
1. Introduction
2. Data Collection
2.1. Obtaining the Crash Report Data
2.2. Empirical Setting
3. Methodology
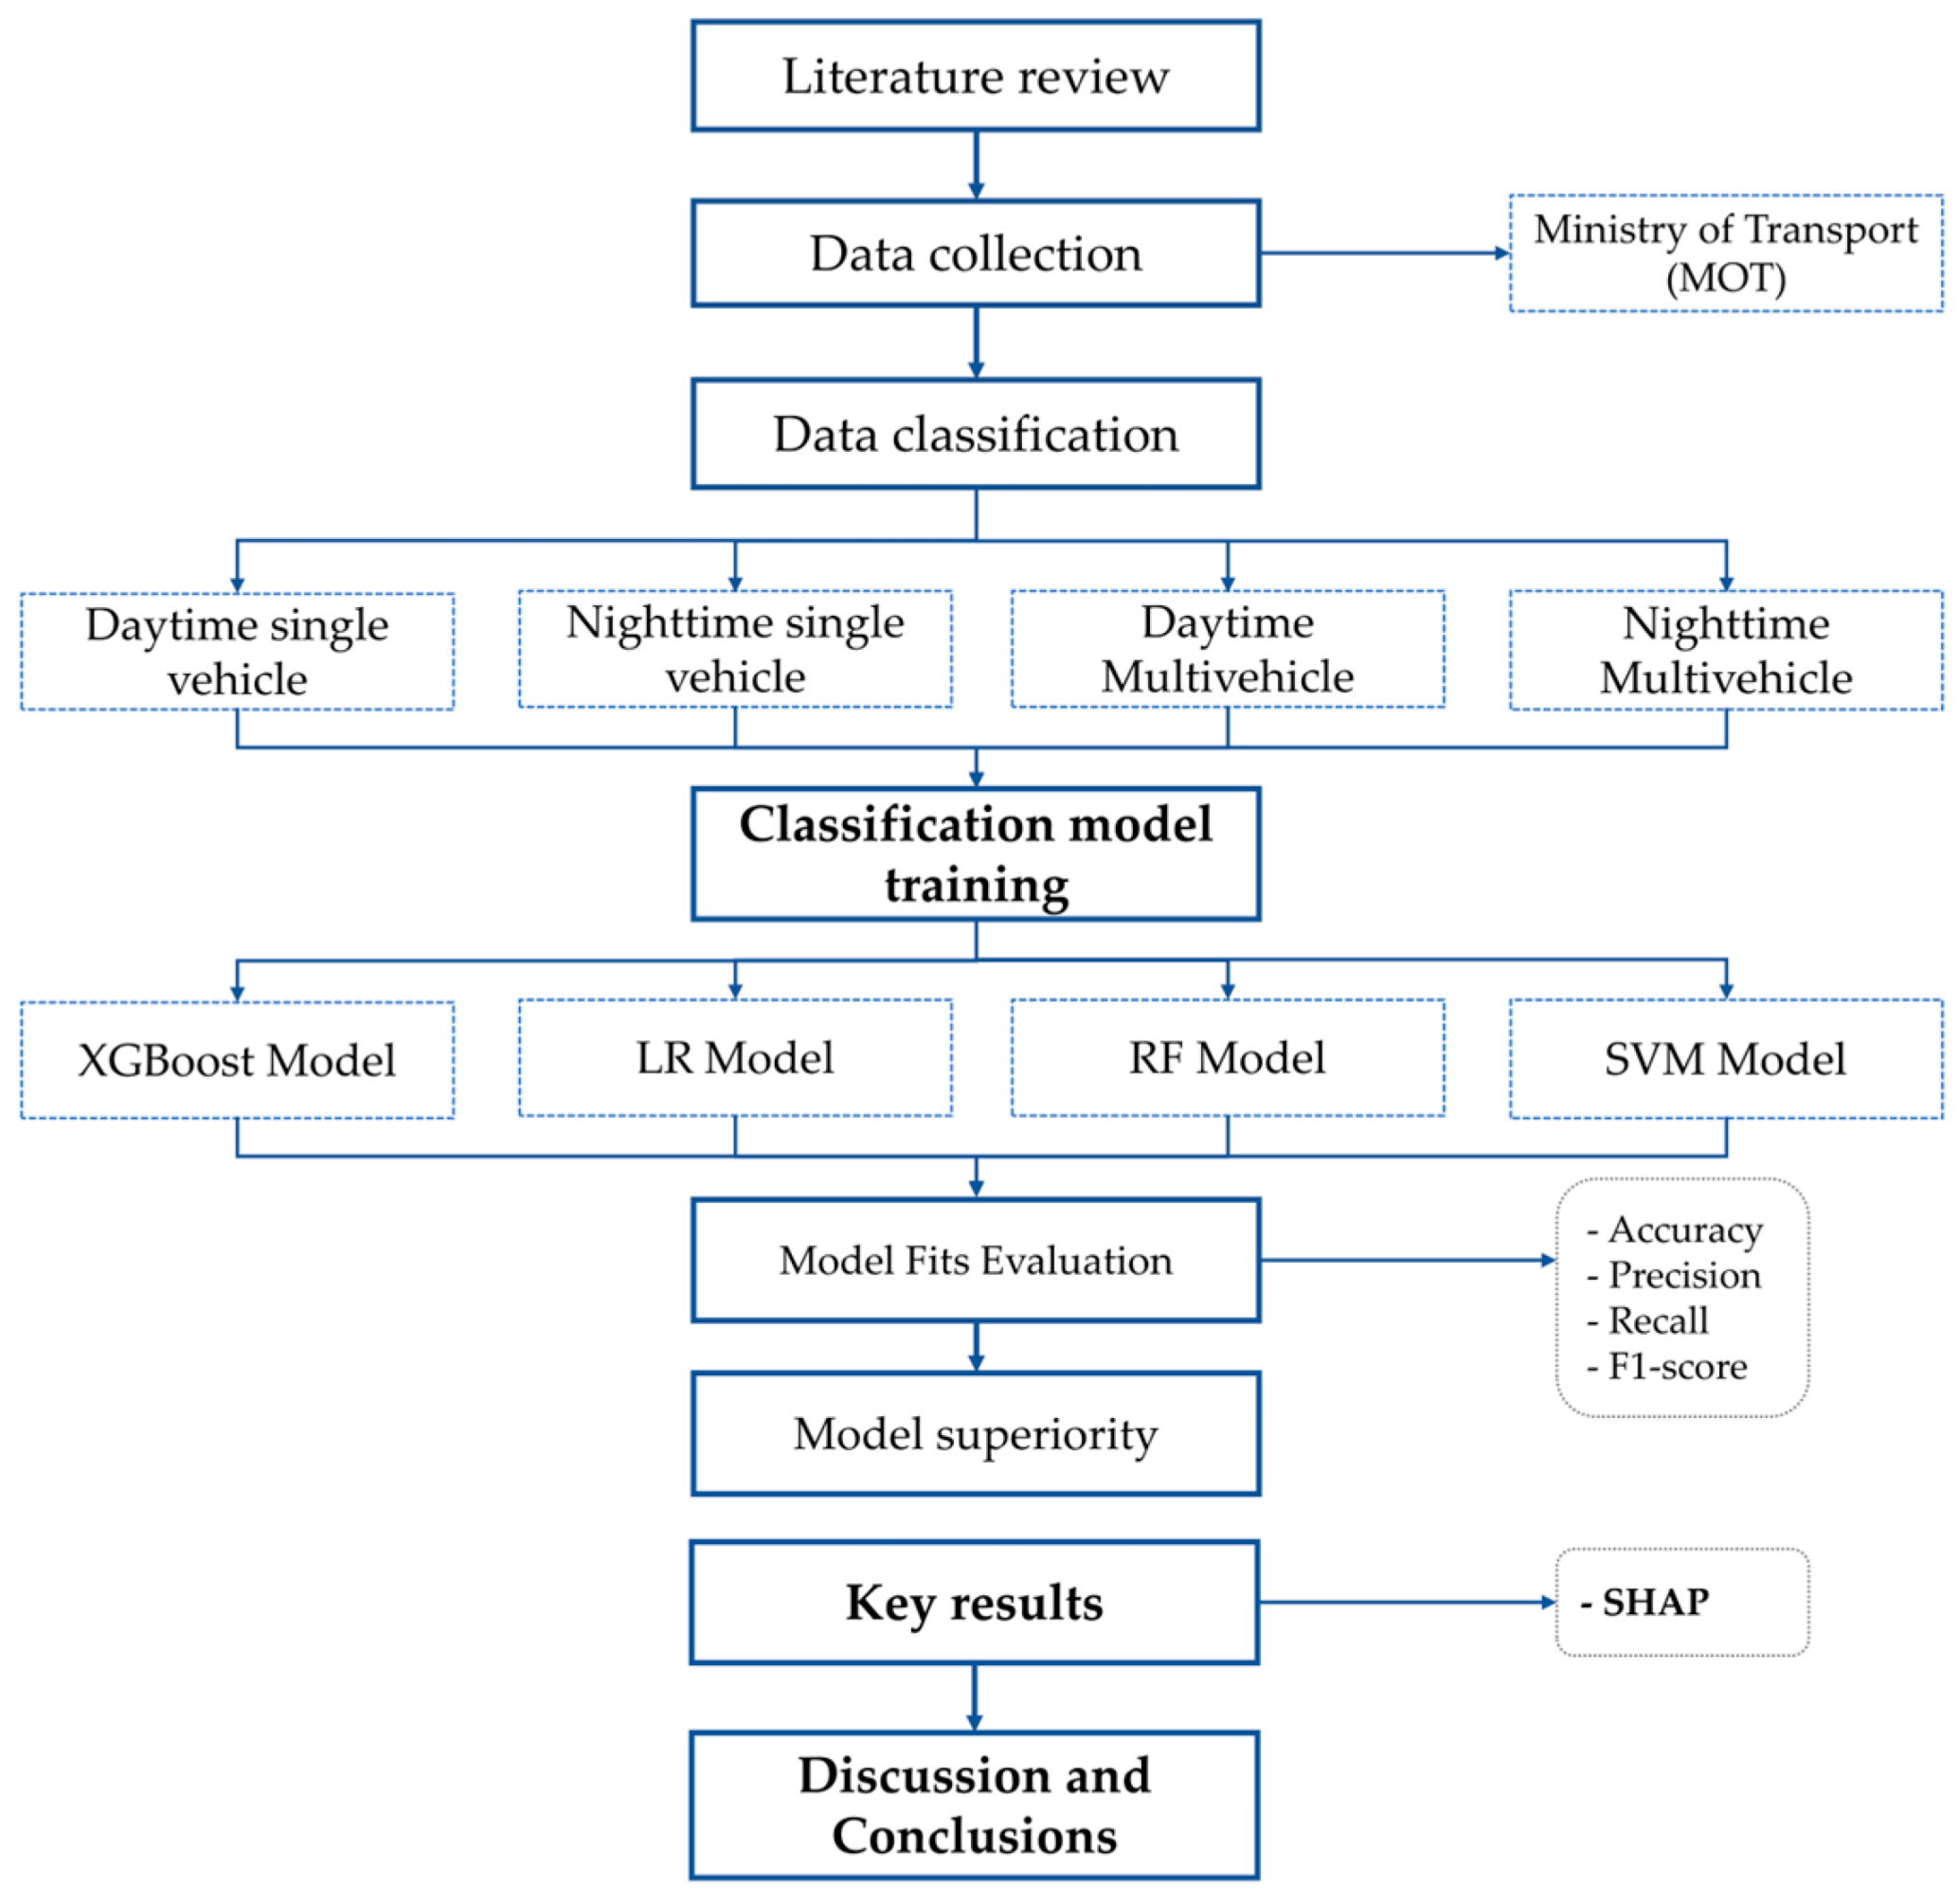
3.1. Overall Research Framework
3.2. Model Specification
3.2.1. Extreme Gradient Boosting (XGBoost) Model
3.2.2. SHapley Additive exPlanations (SHAP)
3.3. Modeling Process and Evaluation
4. Result and Discussion
4.1. Factors Influencing Crash Severity of Nighttime Single Motorcycle Crashes
4.2. Factors Influencing Crash Severity of Daytime Single Motorcycle Crashes
4.3. Factors Influencing Crash Severity of Nighttime Multivehicle Motorcycle Crashes
4.4. Factors Influencing Crash Severity of Daytime Multivehicle Motorcycle Crashes
4.5. Measure and Policy Implications
5. Conclusions and Recommendation for Future Works
- Nighttime single motorcycle crashes: Recommended measures include implementing speed management strategies, enhancing nighttime driving support, and installing curve protection devices.
- Daytime single motorcycle crashes: Rider awareness and education, along with support for nighttime driving, are crucial to addressing the issues associated with high-traffic periods, such as during Songkran, and nighttime incidents.
- Daytime multivehicle motorcycle crashes: The study recommends rider education, the implementation of exclusive motorcycle lanes, and the introduction of physical barriers and median separations on hazardous roadways.
Author Contributions
Funding
Institutional Review Board Statement
Informed Consent Statement
Data Availability Statement
Acknowledgments
Conflicts of Interest
Appendix A

| Model | Injury Severity | Training | Test | ||||
|---|---|---|---|---|---|---|---|
| Precision | Recall | F1-Score | Precision | Recall | F1-Score | ||
| Daytime single motorcycle | Minor | 0.60 | 0.99 | 0.75 | 0.63 | 0.99 | 0.77 |
| Severe | 1.00 | 0.00 | 0.01 | 0.00 | 0.00 | 0.00 | |
| Fatal | 0.71 | 0.11 | 0.20 | 0.62 | 0.11 | 0.19 | |
| Nighttime single motorcycle | Minor | 0.56 | 0.78 | 0.65 | 0.51 | 0.79 | 0.62 |
| Severe | 0.00 | 0.00 | 0.00 | 0.00 | 0.00 | 0.00 | |
| Fatal | 0.53 | 0.51 | 0.52 | 0.56 | 0.46 | 0.51 | |
| Daytime multivehicle motorcycle | Minor | 0.64 | 0.93 | 0.76 | 0.62 | 0.92 | 0.74 |
| Severe | 0.42 | 0.02 | 0.03 | 0.38 | 0.01 | 0.02 | |
| Fatal | 0.54 | 0.29 | 0.38 | 0.50 | 0.27 | 0.35 | |
| Nighttime multivehicle motorcycle | Minor | 0.62 | 0.80 | 0.70 | 0.59 | 0.76 | 0.66 |
| Severe | 0.69 | 0.08 | 0.14 | 0.31 | 0.03 | 0.06 | |
| Fatal | 0.59 | 0.58 | 0.58 | 0.58 | 0.57 | 0.57 | |
References
- World Health Organization. Global Status Report on Road Safety 2023; World Health Organization: Geneva, Switzerland, 2023. [Google Scholar]
- NHTSA. Traffic Safety Facts: Motorcycles 2022; U.S. Department of Transportation: Washington, DC, USA, 2022. [Google Scholar]
- United Nations. Sustainable Development Goals. Available online: https://www.un.org/sustainabledevelopment/ (accessed on 2 July 2024).
- Se, C.; Champahom, T.; Jomnonkwao, S.; Wisutwattanasak, P.; Laphrom, W.; Ratanavaraha, V. Temporal Instability and Transferability Analysis of Daytime and Nighttime Motorcyclist-Injury Severities Considering Unobserved Heterogeneity of Data. Sustainability 2023, 15, 4486. [Google Scholar] [CrossRef]
- Hua, C.; Fan, W. Injury severity analysis of time-of-day fluctuations and temporal volatility in reverse sideswipe collisions: A random parameter model with heterogeneous means and heteroscedastic variances. J. Saf. Res. 2023, 84, 74–85. [Google Scholar] [CrossRef]
- Yuan, R.; Xiang, Q.; Huang, Y.; Gu, X. Investigating the difference in factors influencing the injury severity between daytime and nighttime speeding-related crashes. Can. J. Civ. Eng. 2023, 51, 60–72. [Google Scholar] [CrossRef]
- Behnood, A.; Mannering, F. Time-of-day variations and temporal instability of factors affecting injury severities in large-truck crashes. Anal. Methods Accid. Res. 2019, 23, 100102. [Google Scholar] [CrossRef]
- Song, L.; Fan, W.; Li, Y. Time-of-day variations and the temporal instability of multi-vehicle crash injury severities under the influence of alcohol or drugs after the Great Recession. Anal. Methods Accid. Res. 2021, 32, 100183. [Google Scholar] [CrossRef]
- Alogaili, A.; Mannering, F. Differences between day and night pedestrian-injury severities: Accounting for temporal and unobserved effects in prediction. Anal. Methods Accid. Res. 2022, 33, 100201. [Google Scholar] [CrossRef]
- Zhang, K.; Hassan, M. Crash severity analysis of nighttime and daytime highway work zone crashes. PLoS ONE 2019, 14, e0221128. [Google Scholar] [CrossRef] [PubMed]
- Liu, S.; Li, Y.; Fan, W. Mixed logit model based diagnostic analysis of bicycle-vehicle crashes at daytime and nighttime. Int. J. Transp. Sci. Technol. 2022, 11, 738–751. [Google Scholar] [CrossRef]
- Zou, W.; Wang, X.; Zhang, D. Truck crash severity in New York city: An investigation of the spatial and the time of day effects. Accid. Anal. Prev. 2017, 99, 249–261. [Google Scholar] [CrossRef]
- Dzinyela, R.; Adanu, E.K.; Lord, D.; Islam, S. Analysis of factors that influence injury severity of single and multivehicle crashes involving at-fault older drivers: A random parameters logit with heterogeneity in means and variances approach. Transp. Res. Interdiscip. Perspect. 2023, 22, 100974. [Google Scholar] [CrossRef]
- Li, J.; Fang, S.; Guo, J.; Fu, T.; Qiu, M. A Motorcyclist-Injury Severity Analysis: A Comparison of Single-, Two-, and Multi-Vehicle Crashes Using Latent Class Ordered Probit Model. Accid. Anal. Prev. 2021, 151, 105953. [Google Scholar] [CrossRef] [PubMed]
- Hou, Q.; Huo, X.; Leng, J.; Mannering, F. A note on out-of-sample prediction, marginal effects computations, and temporal testing with random parameters crash-injury severity models. Anal. Methods Accid. Res. 2022, 33, 100191. [Google Scholar] [CrossRef]
- Peng, Z.; Wang, Y.; Wang, L. A comparative analysis of factors influencing the injury severity of daytime and nighttime crashes on a mountainous expressway in China. Int. J. Inj. Control Saf. Promot. 2021, 28, 503–512. [Google Scholar] [CrossRef]
- Wang, M.-H. Investigating the Difference in Factors Contributing to the Likelihood of Motorcyclist Fatalities in Single Motorcycle and Multiple Vehicle Crashes. Int. J. Environ. Res. Public Health 2022, 19, 8411. [Google Scholar] [CrossRef]
- Zheng, Z.; Lu, P.; Lantz, B. Commercial truck crash injury severity analysis using gradient boosting data mining model. J. Saf. Res. 2018, 65, 115–124. [Google Scholar] [CrossRef]
- Dong, S.; Khattak, A.; Ullah, I.; Zhou, J.; Hussain, A. Predicting and Analyzing Road Traffic Injury Severity Using Boosting-Based Ensemble Learning Models with SHAPley Additive exPlanations. Int. J. Environ. Res. Public Health 2022, 19, 2925. [Google Scholar] [CrossRef]
- Scarano, A.; Rella Riccardi, M.; Mauriello, F.; D’Agostino, C.; Pasquino, N.; Montella, A. Injury severity prediction of cyclist crashes using random forests and random parameters logit models. Accid. Anal. Prev. 2023, 192, 107275. [Google Scholar] [CrossRef]
- Santos, K.; Dias, J.P.; Amado, C. A literature review of machine learning algorithms for crash injury severity prediction. J. Saf. Res. 2022, 80, 254–269. [Google Scholar] [CrossRef] [PubMed]
- Wu, S.; Yuan, Q.; Yan, Z.; Xu, Q. Analyzing Accident Injury Severity via an Extreme Gradient Boosting (XGBoost) Model. J. Adv. Transp. 2021, 2021, 3771640. [Google Scholar] [CrossRef]
- Guo, M.; Yuan, Z.; Janson, B.; Peng, Y.; Yang, Y.; Wang, W. Older Pedestrian Traffic Crashes Severity Analysis Based on an Emerging Machine Learning XGBoost. Sustainability 2021, 13, 926. [Google Scholar] [CrossRef]
- Laphrom, W.; Se, C.; Champahom, T.; Jomnonkwao, S.; Wipulanusatd, W.; Satiennam, T.; Ratanavaraha, V. XGBoost-SHAP and Unobserved Heterogeneity Modelling of Temporal Multivehicle Truck-Involved Crash Severity Patterns. Civ. Eng. J. 2024, 10, 1890–1908. [Google Scholar] [CrossRef]
- Goswamy, A.; Abdel-Aty, M.; Islam, Z. Factors affecting injury severity at pedestrian crossing locations with Rectangular RAPID Flashing Beacons (RRFB) using XGBoost and random parameters discrete outcome models. Accid. Anal. Prev. 2023, 181, 106937. [Google Scholar] [CrossRef] [PubMed]
- Shi, X.; Wong, Y.D.; Li, M.Z.-F.; Palanisamy, C.; Chai, C. A feature learning approach based on XGBoost for driving assessment and risk prediction. Accid. Anal. Prev. 2019, 129, 170–179. [Google Scholar] [CrossRef]
- Savolainen, P.; Mannering, F. Probabilistic models of motorcyclists’ injury severities in single- and multi-vehicle crashes. Accid. Anal. Prev. 2007, 39, 955–963. [Google Scholar] [CrossRef]
- Geedipally, S.R.; Lord, D. Investigating the effect of modeling single-vehicle and multi-vehicle crashes separately on confidence intervals of Poisson–gamma models. Accid. Anal. Prev. 2010, 42, 1273–1282. [Google Scholar] [CrossRef]
- Ministry of Transport. Road Accident Report 2024; Ministry of Transport: Bangkok, Thailand, 2024. [Google Scholar]
- Zhang, P.; Jia, Y.; Shang, Y. Research and application of XGBoost in imbalanced data. Int. J. Distrib. Sens. Netw. 2022, 18, 15501329221106935. [Google Scholar] [CrossRef]
- Chen, T.; Guestrin, C. Xgboost: A scalable tree boosting system. In Proceedings of the 22nd ACM SIGKDD International Conference on Knowledge Discovery and Data Mining, Washington, DC, USA, 14–18 August 2016; pp. 785–794. [Google Scholar]
- Lundberg, S.M.; Lee, S.-I. A unified approach to interpreting model predictions. arXiv 2017, arXiv:1705.07874. [Google Scholar]
- Mansoor, U.; Jamal, A.; Su, J.; Sze, N.N.; Chen, A. Investigating the risk factors of motorcycle crash injury severity in Pakistan: Insights and policy recommendations. Transp. Policy 2023, 139, 21–38. [Google Scholar] [CrossRef]
- Se, C.; Champahom, T.; Jomnonkwao, S.; Karoonsoontawong, A.; Ratanavaraha, V. Temporal stability of factors influencing driver-injury severities in single-vehicle crashes: A correlated random parameters with heterogeneity in means and variances approach. Anal. Methods Accid. Res. 2021, 32, 100179. [Google Scholar] [CrossRef]
- Ahmed, M.M.; Franke, R.; Ksaibati, K.; Shinstine, D.S. Effects of truck traffic on crash injury severity on rural highways in Wyoming using Bayesian binary logit models. Accid. Anal. Prev. 2018, 117, 106–113. [Google Scholar] [CrossRef]
- Zubaidi, H.A.; Obaid, I.A.; Alnedawi, A.; Das, S. Motor vehicle driver injury severity analysis utilizing a random parameter binary probit model considering different types of driving licenses in 4-legs roundabouts in South Australia. Saf. Sci. 2021, 134, 105083. [Google Scholar] [CrossRef]
- Yan, X.; He, J.; Zhang, C.; Liu, Z.; Qiao, B.; Zhang, H. Single-vehicle crash severity outcome prediction and determinant extraction using tree-based and other non-parametric models. Accid. Anal. Prev. 2021, 153, 106034. [Google Scholar] [CrossRef]
- Arteaga, C.; Paz, A.; Park, J. Injury severity on traffic crashes: A text mining with an interpretable machine-learning approach. Saf. Sci. 2020, 132, 104988. [Google Scholar] [CrossRef]
- Rahman, M.H.; Zafri, N.M.; Akter, T.; Pervaz, S. Identification of factors influencing severity of motorcycle crashes in Dhaka, Bangladesh using binary logistic regression model. Int. J. Inj. Control Saf. Promot. 2021, 28, 141–152. [Google Scholar] [CrossRef]
- Champahom, T.; Wisutwattanasak, P.; Chanpariyavatevong, K.; Laddawan, N.; Jomnonkwao, S.; Ratanavaraha, V. Factors affecting severity of motorcycle accidents on Thailand’s arterial roads: Multiple correspondence analysis and ordered logistics regression approaches. IATSS Res. 2022, 46, 101–111. [Google Scholar] [CrossRef]
- Tamakloe, R.; Das, S.; Nimako Aidoo, E.; Park, D. Factors affecting motorcycle crash casualty severity at signalized and non-signalized intersections in Ghana: Insights from a data mining and binary logit regression approach. Accid. Anal. Prev. 2022, 165, 106517. [Google Scholar] [CrossRef] [PubMed]
- Jamal, A.; Zahid, M.; Tauhidur Rahman, M.; Al-Ahmadi, H.M.; Almoshaogeh, M.; Farooq, D.; Ahmad, M. Injury severity prediction of traffic crashes with ensemble machine learning techniques: A comparative study. Int. J. Inj. Control Saf. Promot. 2021, 28, 408–427. [Google Scholar] [CrossRef] [PubMed]
- Wang, C.; Liu, L.; Xu, C.; Lv, W. Predicting Future Driving Risk of Crash-Involved Drivers Based on a Systematic Machine Learning Framework. Int. J. Environ. Res. Public Health 2019, 16, 334. [Google Scholar] [CrossRef]
- Kardar, A.; Davoodi, S.R. A generalized ordered probit model for analyzing driver injury severity of head-on crashes on two-lane rural highways in Malaysia. J. Transp. Saf. Secur. 2020, 12, 1067–1082. [Google Scholar] [CrossRef]
- Abdul Manan, M.M.; Várhelyi, A.; Çelik, A.K.; Hashim, H.H. Road characteristics and environment factors associated with motorcycle fatal crashes in Malaysia. IATSS Res. 2018, 42, 207–220. [Google Scholar] [CrossRef]
- Santos, K.; Firme, B.; Dias, J.P.; Amado, C. Analysis of Motorcycle Accident Injury Severity and Performance Comparison of Machine Learning Algorithms. Transp. Res. Rec. 2023, 2678, 736–748. [Google Scholar] [CrossRef]
- Adanu, E.K.; Agyemang, W.; Lidbe, A.; Adarkwa, O.; Jones, S. An in-depth analysis of head-on crash severity and fatalities in Ghana. Heliyon 2023, 9, e18937. [Google Scholar] [CrossRef] [PubMed]
- Jafari Anarkooli, A.; Hadji Hosseinlou, M. Analysis of the injury severity of crashes by considering different lighting conditions on two-lane rural roads. J. Saf. Res. 2016, 56, 57–65. [Google Scholar] [CrossRef]
- Se, C.; Champahom, T.; Jomnonkwao, S.; Kronprasert, N.; Ratanavaraha, V. The impact of weekday, weekend, and holiday crashes on motorcyclist injury severities: Accounting for temporal influence with unobserved effect and insights from out-of-sample prediction. Anal. Methods Accid. Res. 2022, 36, 100240. [Google Scholar] [CrossRef]
- Fountas, G.; Anastasopoulos, P.C. A random thresholds random parameters hierarchical ordered probit analysis of highway accident injury-severities. Anal. Methods Accid. Res. 2017, 15, 1–16. [Google Scholar] [CrossRef]
- Islam, M. An analysis of motorcyclists’ injury severities in work-zone crashes with unobserved heterogeneity. IATSS Res. 2022, 46, 281–289. [Google Scholar] [CrossRef]
- Gabauer, D.J.; Li, X. Influence of horizontally curved roadway section characteristics on motorcycle-to-barrier crash frequency. Accid. Anal. Prev. 2015, 77, 105–112. [Google Scholar] [CrossRef]
- Farid, A.; Ksaibati, K. Modeling severities of motorcycle crashes using random parameters. J. Traffic Transp. Eng. (Engl. Ed.) 2021, 8, 225–236. [Google Scholar] [CrossRef]
- Kanitpong, K.; Jensupakarn, A.; Dabsomsri, P.; Issalakul, K. Characteristics of motorcycle crashes in Thailand and factors affecting crash severity: Evidence from in-depth crash investigation. Transp. Eng. 2024, 16, 100227. [Google Scholar] [CrossRef]
- Naqvi, H.M.; Tiwari, G. Factors Contributing to Motorcycle Fatal Crashes on National Highways in India. Transp. Res. Procedia 2017, 25, 2084–2097. [Google Scholar] [CrossRef]
- Rifaat, S.M.; Tay, R.; de Barros, A. Severity of motorcycle crashes in Calgary. Accid. Anal. Prev. 2012, 49, 44–49. [Google Scholar] [CrossRef] [PubMed]
- Se, C.; Champahom, T.; Jomnonkwao, S.; Chaimuang, P.; Ratanavaraha, V. Empirical comparison of the effects of urban and rural crashes on motorcyclist injury severities: A correlated random parameters ordered probit approach with heterogeneity in means. Accid. Anal. Prev. 2021, 161, 106352. [Google Scholar] [CrossRef]
- Waseem, M.; Ahmed, A.; Saeed, T.U. Factors affecting motorcyclists’ injury severities: An empirical assessment using random parameters logit model with heterogeneity in means and variances. Accid. Anal. Prev. 2019, 123, 12–19. [Google Scholar] [CrossRef] [PubMed]
- Se, C.; Champahom, T.; Wisutwattanasak, P.; Jomnonkwao, S.; Chanpariyavatevong, K.; Ratanavaraha, V. Modeling of motorcyclist injury severities: A comparison between crashes on main-, frontage-, and standard-lane of roadway. IATSS Res. 2024, 48, 288–298. [Google Scholar] [CrossRef]
- Xin, C.; Wang, Z.; Lee, C.; Lin, P.-S. Modeling Safety Effects of Horizontal Curve Design on Injury Severity of Single-Motorcycle Crashes with Mixed-Effects Logistic Model. Transp. Res. Rec. 2017, 2637, 38–46. [Google Scholar] [CrossRef]
- Alonso, F.; Useche, S.A.; Valle, E.; Esteban, C.; Gene-Morales, J. Could Road Safety Education (RSE) Help Parents Protect Children? Examining Their Driving Crashes with Children on Board. Int. J. Environ. Res. Public Health 2021, 18, 3611. [Google Scholar] [CrossRef] [PubMed]
- Radin Sohadi, R.U.; Mackay, M.; Hills, B. Multivariate Analysis of Motorcycle Accidents and the Effects of Exclusive Motorcycle Lanes in Malaysia. J. Crash Prev. Inj. Control 2000, 2, 11–17. [Google Scholar] [CrossRef]
- Davoodi, S.R.; Hamid, H.; Pazhouhanfar, M.; Muttart, J.W. Motorcyclist perception response time in stopping sight distance situations. Saf. Sci. 2012, 50, 371–377. [Google Scholar] [CrossRef]
- Saini, H.K.; Chouhan, S.S.; Kathuria, A. Exclusive motorcycle lanes: A systematic review. IATSS Res. 2022, 46, 411–426. [Google Scholar] [CrossRef]
- Yu, M.; Ma, C.; Shen, J. Temporal stability of driver injury severity in single-vehicle roadway departure crashes: A random thresholds random parameters hierarchical ordered probit approach. Anal. Methods Accid. Res. 2021, 29, 100144. [Google Scholar] [CrossRef]
- Abrari Vajari, M.; Aghabayk, K.; Sadeghian, M.; Shiwakoti, N. A multinomial logit model of motorcycle crash severity at Australian intersections. J. Saf. Res. 2020, 73, 17–24. [Google Scholar] [CrossRef] [PubMed]
- Wen, X.; Xie, Y.; Jiang, L.; Pu, Z.; Ge, T. Applications of machine learning methods in traffic crash severity modelling: Current status and future directions. Transp. Rev. 2021, 41, 855–879. [Google Scholar] [CrossRef]


| Variable | Multivehicle Motorcycle Crashes | Single Motorcycle Crashes | ||||||
|---|---|---|---|---|---|---|---|---|
| Daytime | Nighttime | Daytime | Nighttime | |||||
| Mean | SD | Mean | SD | Mean | SD | Mean | SD | |
| New_Year (1 if incident occurred during New Year, 0 otherwise) | 0.105 | 0.306 | 0.104 | 0.306 | 0.196 | 0.397 | 0.200 | 0.400 |
| SongKran (1 if incident occurred during SongKran, 0 otherwise) | 0.090 | 0.286 | 0.097 | 0.296 | 0.202 | 0.401 | 0.156 | 0.363 |
| Evening_peak (1 if incident occurred during evening peak hours, 0 otherwise) | 0.222 | 0.416 | 0.241 | 0.428 | 0.238 | 0.426 | 0.138 | 0.344 |
| Morning_peak (1 if incident occurred during morning peak hours, 0 otherwise) | 0.199 | 0.399 | − | − | 0.189 | 0.391 | − | − |
| Early_morning (1 if incident occurred during early morning, 0 otherwise) | − | − | 0.198 | 0.398 | − | − | 0.389 | 0.488 |
| Driving_closely_behind (1 if rider was driving closely behind another vehicle, 0 otherwise) | 0.006 | 0.079 | 0.004 | 0.063 | 0.007 | 0.085 | 0.002 | 0.047 |
| Driving_against_traffic (1 if rider was driving against traffic, 0 otherwise) | 0.015 | 0.121 | 0.024 | 0.153 | 0.002 | 0.039 | 0.004 | 0.065 |
| Exceed_speed (1 if rider exceeded the speed limit, 0 otherwise) | 0.563 | 0.496 | 0.654 | 0.476 | 0.692 | 0.462 | 0.716 | 0.451 |
| Immediately_pass_in_front (1 if rider immediately passed in front of another vehicle, 0 otherwise) | 0.314 | 0.464 | 0.181 | 0.385 | 0.066 | 0.247 | 0.030 | 0.170 |
| Distracting_phone (1 if rider was distracted by a phone, 0 otherwise) | 0.001 | 0.028 | − | − | 0.002 | 0.045 | 0.001 | 0.036 |
| Illegal_overtaking (1 if rider was involved in illegal overtaking, 0 otherwise) | 0.013 | 0.111 | 0.009 | 0.096 | 0.004 | 0.060 | 0.001 | 0.036 |
| Slipping (1 if vehicle slipped, 0 otherwise) | 0.001 | 0.036 | 0.002 | 0.040 | 0.006 | 0.075 | 0.005 | 0.069 |
| Sudden_lane_change (1 if sudden lane change occurred, 0 otherwise) | 0.006 | 0.074 | 0.004 | 0.065 | 0.011 | 0.106 | 0.004 | 0.059 |
| Violating_signals_signs (1 if traffic signals/signs were violated, 0 otherwise) | 0.025 | 0.156 | 0.041 | 0.197 | 0.005 | 0.071 | 0.006 | 0.075 |
| Alcohol (1 if alcohol was involved, 0 otherwise) | 0.009 | 0.092 | 0.028 | 0.164 | 0.088 | 0.283 | 0.141 | 0.348 |
| Unfamiliar (1 if rider was unfamiliar with the area, 0 otherwise) | 0.007 | 0.082 | 0.004 | 0.065 | 0.014 | 0.119 | 0.014 | 0.119 |
| No_turn_signal (1 if no turn signal was used, 0 otherwise) | 0.008 | 0.090 | 0.004 | 0.059 | 0.002 | 0.039 | − | − |
| Tire_deterioration_Flat (1 if tire deterioration or flat tire occurred, 0 otherwise) | 0.001 | 0.030 | 0.002 | 0.044 | 0.003 | 0.051 | 0.001 | 0.030 |
| Brake_system (1 if brake system was faulty, 0 otherwise) | 0.001 | 0.035 | 0.001 | 0.022 | 0.002 | 0.039 | 0.003 | 0.051 |
| Disease (1 if rider was affected by a disease, 0 otherwise) | 0.001 | 0.028 | 0.001 | 0.026 | 0.005 | 0.071 | 0.003 | 0.051 |
| Loss_of_control (1 if there was a loss of control, 0 otherwise) | 0.003 | 0.056 | 0.003 | 0.053 | 0.007 | 0.082 | 0.005 | 0.069 |
| Insufficient_lighting (1 if lighting was insufficient, 0 otherwise) | − | − | 0.008 | 0.089 | − | − | 0.007 | 0.083 |
| Fall_asleep (1 if rider fell asleep, 0 otherwise) | 0.008 | 0.087 | 0.007 | 0.085 | 0.039 | 0.193 | 0.024 | 0.152 |
| Device_defect (1 if there was a device defect, 0 otherwise) | 0.002 | 0.046 | 0.004 | 0.059 | 0.009 | 0.093 | 0.006 | 0.075 |
| Pedestrian (1 if a pedestrian was involved, 0 otherwise) | 0.001 | 0.036 | 0.002 | 0.044 | 0.032 | 0.177 | 0.030 | 0.170 |
| Side_swipe (1 if side swipe occurred, 0 otherwise) | 0.005 | 0.071 | 0.003 | 0.053 | − | − | − | − |
| Rear_end (1 if rear-end collision occurred, 0 otherwise) | 0.685 | 0.464 | 0.645 | 0.478 | − | − | − | − |
| Head_on (1 if head-on collision occurred, 0 otherwise) | 0.108 | 0.310 | 0.112 | 0.315 | − | − | − | − |
| Crossing (1 if crossing was involved, 0 otherwise) | 0.025 | 0.157 | 0.019 | 0.136 | − | − | − | − |
| Obstacle (1 if an obstacle was involved, 0 otherwise) | 0.054 | 0.226 | 0.090 | 0.287 | 0.035 | 0.183 | 0.044 | 0.204 |
| Off_road_STR (1 if off-road straight occurred, 0 otherwise) | 0.005 | 0.071 | 0.006 | 0.077 | 0.431 | 0.495 | 0.523 | 0.499 |
| Off_road_Curve (1 if off-road curve occurred, 0 otherwise) | 0.001 | 0.030 | 0.001 | 0.022 | 0.108 | 0.310 | 0.094 | 0.292 |
| Curve (1 if curve was involved, 0 otherwise) | 0.062 | 0.242 | 0.060 | 0.238 | 0.188 | 0.390 | 0.169 | 0.375 |
| Sharp_curve (1 if sharp curve was involved, 0 otherwise) | 0.003 | 0.050 | 0.002 | 0.049 | 0.015 | 0.121 | 0.006 | 0.078 |
| Private_area_access (1 if private area access was involved, 0 otherwise) | 0.021 | 0.143 | 0.013 | 0.111 | − | − | − | − |
| Public_area_access (1 if public area access was involved, 0 otherwise) | 0.040 | 0.195 | 0.023 | 0.149 | 0.001 | 0.032 | 0.002 | 0.041 |
| Straight (1 if straight road was involved, 0 otherwise) | 0.685 | 0.465 | 0.741 | 0.438 | 0.661 | 0.473 | 0.695 | 0.460 |
| Slope (1 if slope was involved, 0 otherwise) | 0.020 | 0.139 | 0.030 | 0.169 | 0.043 | 0.202 | 0.033 | 0.178 |
| 4_legs_intersection (1 if 4-leg intersection was involved, 0 otherwise) | 0.009 | 0.094 | 0.005 | 0.070 | 0.014 | 0.119 | 0.007 | 0.080 |
| T_Intersection (1 if T-intersection was involved, 0 otherwise) | 0.010 | 0.099 | 0.008 | 0.088 | 0.033 | 0.178 | 0.011 | 0.106 |
| Y_Intersection (1 if Y-intersection was involved, 0 otherwise) | 0.003 | 0.054 | 0.003 | 0.053 | 0.011 | 0.103 | 0.014 | 0.119 |
| Clear (1 if weather was clear, 0 otherwise) | 0.963 | 0.190 | 0.900 | 0.301 | 0.960 | 0.196 | 0.888 | 0.316 |
| Rain (1 if rain was involved, 0 otherwise) | 0.033 | 0.178 | 0.057 | 0.233 | 0.031 | 0.173 | 0.047 | 0.211 |
| Fog_smoke_dust (1 if fog, smoke, or dust was involved, 0 otherwise) | 0.001 | 0.037 | 0.010 | 0.099 | 0.002 | 0.039 | 0.015 | 0.122 |
| Cloudy (1 if cloudy conditions were involved, 0 otherwise) | 0.000 | 0.020 | 0.012 | 0.107 | 0.005 | 0.071 | 0.027 | 0.163 |
| Other_Motorcycle (1 if another motorcycle was involved, 0 otherwise) | 0.143 | 0.350 | 0.152 | 0.359 | − | − | − | − |
| 3_Wheeler (1 if a 3-wheeler was involved, 0 otherwise) | 0.010 | 0.100 | 0.011 | 0.103 | − | − | − | − |
| Passenger_car (1 if a passenger car was involved, 0 otherwise) | 0.369 | 0.483 | 0.328 | 0.469 | − | − | − | − |
| Van (1 if a van was involved, 0 otherwise) | 0.015 | 0.121 | 0.017 | 0.130 | − | − | − | − |
| Pick_up_car (1 if a pickup car was involved, 0 otherwise) | 0.009 | 0.092 | 0.013 | 0.113 | − | − | − | − |
| Pick_up_truck (1 if a pickup truck was involved, 0 otherwise) | 0.369 | 0.482 | 0.337 | 0.473 | − | − | − | − |
| 6_wheels_truck (1 if a 6-wheels truck was involved, 0 otherwise) | 0.044 | 0.206 | 0.031 | 0.173 | − | − | − | − |
| 10_wheels_truck (1 if a 10-wheels truck was involved, 0 otherwise) | 0.023 | 0.149 | 0.038 | 0.191 | − | − | − | − |
| 10up_wheels_trailer (1 if a 10-up wheels trailer was involved, 0 otherwise) | 0.058 | 0.234 | 0.084 | 0.277 | − | − | − | − |
| Pedestrian (1 if a pedestrian was involved, 0 otherwise) | 0.001 | 0.036 | 0.003 | 0.056 | − | − | − | − |
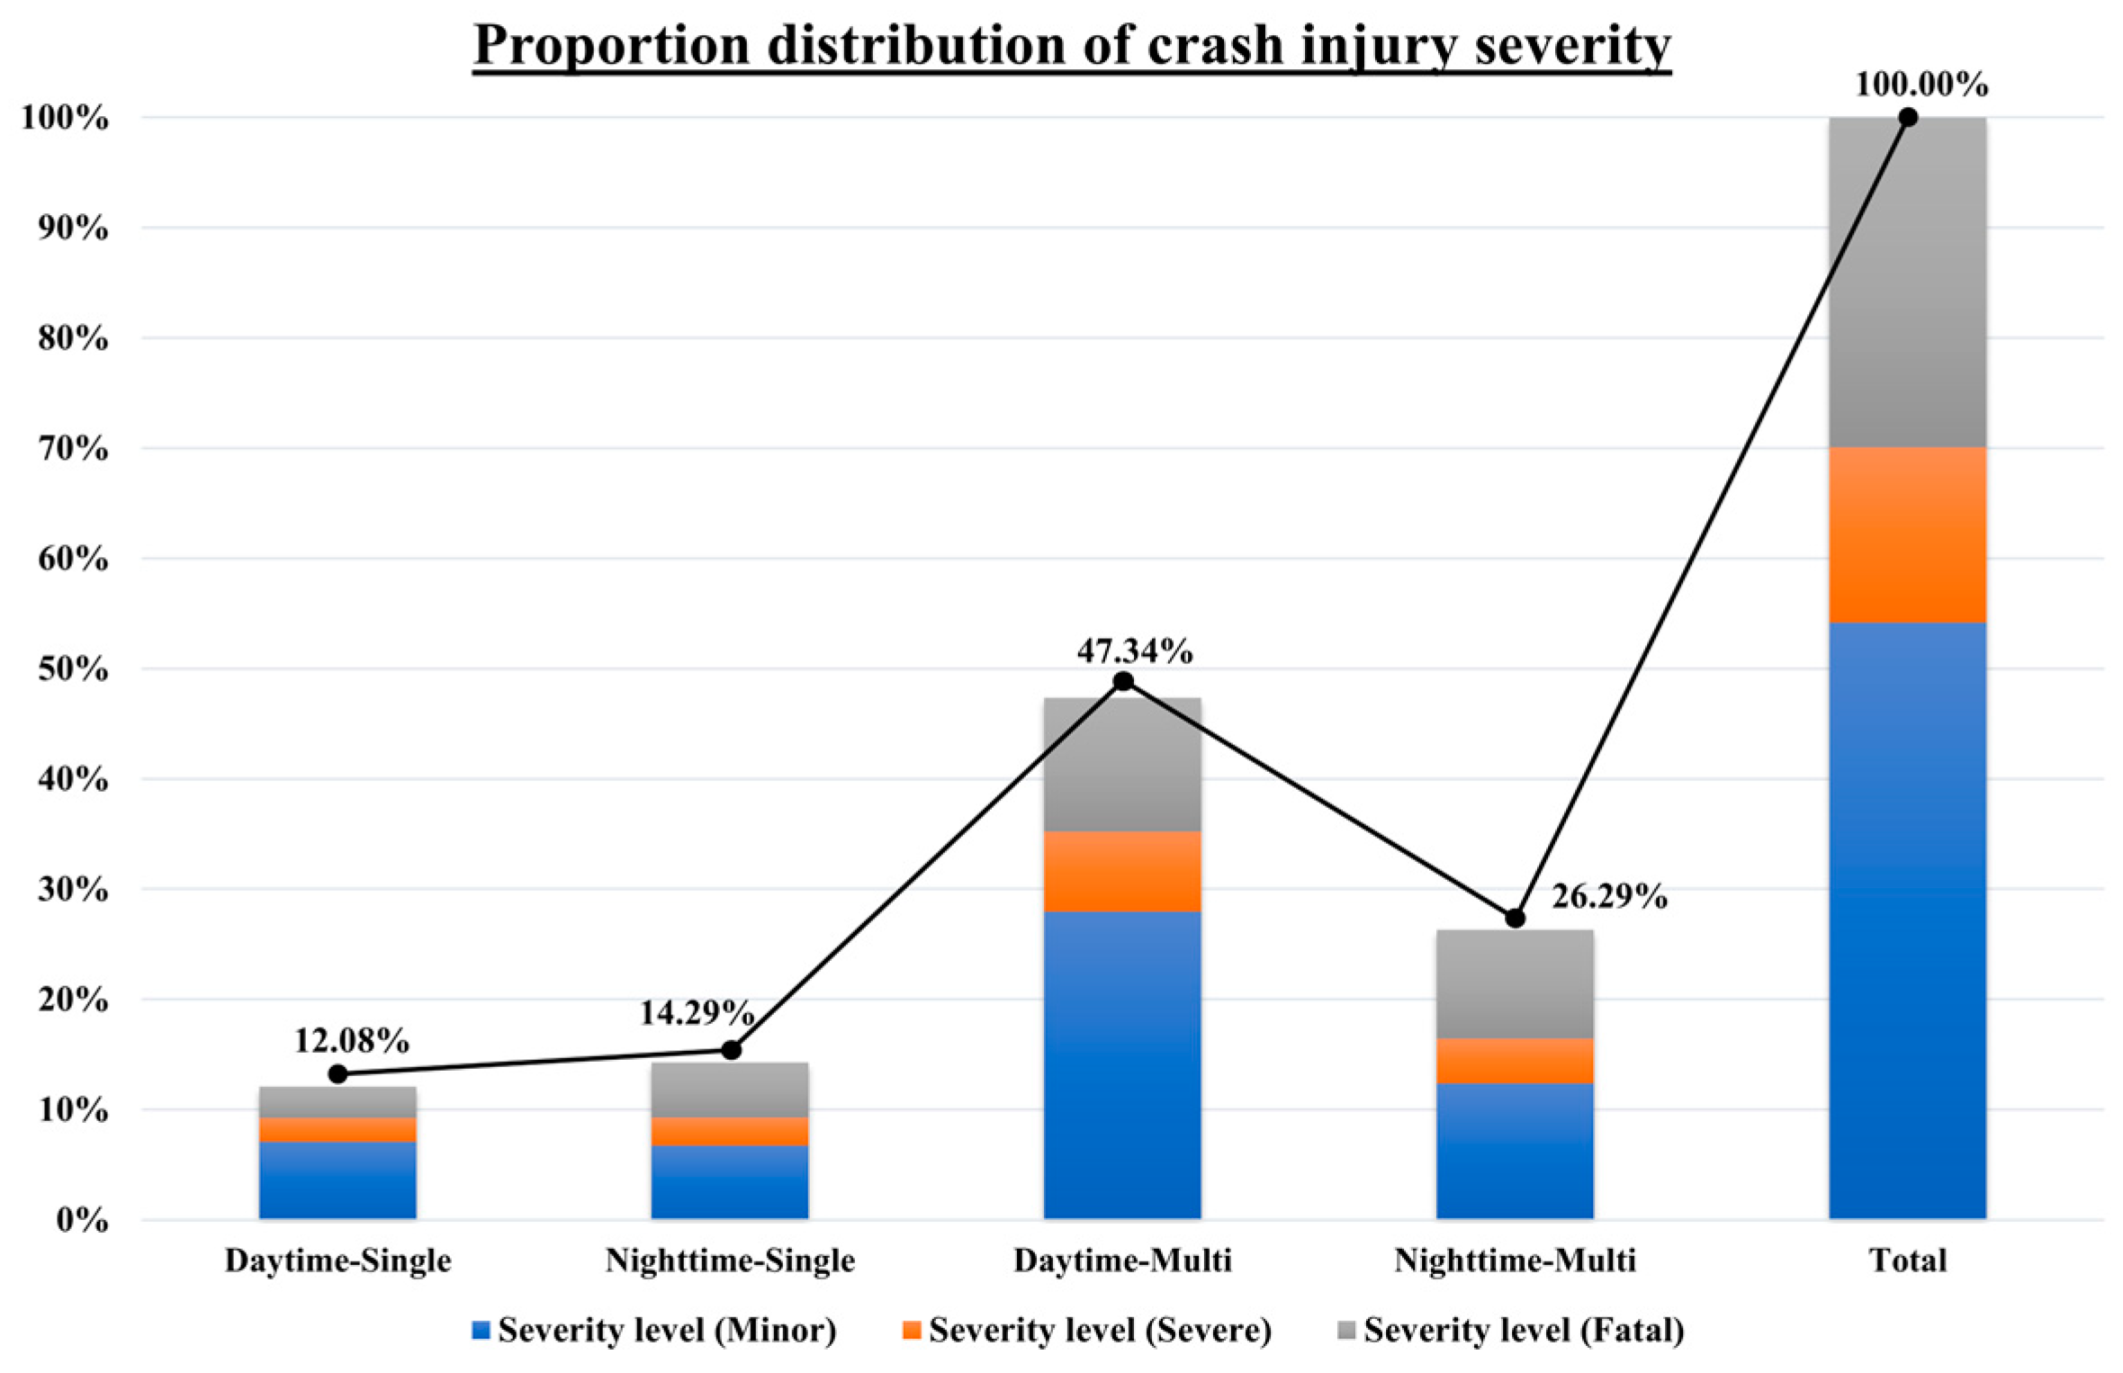
| Sub-Model | Severity Level | Total (%) | ||
|---|---|---|---|---|
| Minor (%) | Severe (%) | Fatal (%) | ||
| a Daytime–Single | 1147 (7.09) | 346 (2.14) | 462 (2.85) | 1955 (12.08) |
| b Nighttime–Single | 1090 (6.74) | 408 (2.52) | 813 (5.03) | 2311 (14.29) |
| c Daytime–Multi | 4521 (27.95) | 1168 (7.22) | 1968 (12.17) | 7657 (47.34) |
| d Nighttime–Multi | 2000 (12.36) | 655 (4.05) | 1597 (9.87) | 4252 (26.29) |
| Total | 8758 (54.15) | 2577 (15.93) | 4840 (29.92) | 16,175 (100.00) |
| Model | XGBoost | RF | SVM |
|---|---|---|---|
| Nighttime Multi | α = 0.8 | max_depth = 6 | C = 5 |
| colsample_bytree = 0.75 | max_features = 1.0 | Degree = 1 | |
| γ = 0.6 | min_samples_leaf = 1 | gamma = 0.005 | |
| reg_lambda = 9 | min_samples_split = 2 | kernel = ‘rbf’ | |
| reg_lambda = 9 | n_estimators = 50 | ||
| Daytime Multi | α = 0.8 | max_depth = 11 | C = 5 |
| colsample_bytree = 0.75 | max_features = 0.65 | Degree = 5 | |
| γ = 0.6 | min_samples_leaf = 10 | gamma = 0.004 | |
| reg_lambda = 9 | min_samples_split = 10 | kernel = ‘rbf’ | |
| max_depth = 4 | n_estimators 76 | ||
| Nighttime Single | α = 0.4 | max_depth = 15 | C = 1 |
| colsample_bytree = 0.75 | max_features = 0.51 | Degree = 5 | |
| γ = 0.6 | min_samples_leaf = 10 | gamma = 0.0175 | |
| reg_lambda = 8 | min_samples_split = 7 | kernel = ‘rbf’ | |
| max_depth = 10 | n_estimators = 344 | ||
| Daytime Single | α = 0.5 | max_depth = 4 | C = 15 |
| colsample_bytree = 0.75 | max_features = 1.0 | Degree = 5 | |
| γ = 0.1 | min_samples_leaf = 10 | gamma = 0.005 | |
| reg_lambda = 3 | min_samples_split = 7 | kernel = ‘rbf’ | |
| max_depth = 6 | n_estimators = 460 |
| Method | Model | Training | Test | ||||||
|---|---|---|---|---|---|---|---|---|---|
| Accuracy | Precision | Recall | F1-Score | Accuracy | Precision | Recall | F1-Score | ||
| XGBoost | Nighttime Multi | 0.65 | 0.65 | 0.65 | 0.65 | 0.67 | 0.67 | 0.66 | 0.66 |
| Daytime Multi | 0.66 | 0.66 | 0.63 | 0.63 | 0.66 | 0.65 | 0.63 | 0.63 | |
| Nighttime Single | 0.64 | 0.64 | 0.63 | 0.63 | 0.61 | 0.61 | 0.60 | 0.60 | |
| Daytime Single | 0.64 | 0.65 | 0.59 | 0.56 | 0.62 | 0.60 | 0.56 | 0.53 | |
| LR Model | Nighttime Multi | 0.65 | 0.65 | 0.64 | 0.64 | 0.65 | 0.65 | 0.64 | 0.64 |
| Daytime Multi | 0.66 | 0.65 | 0.62 | 0.62 | 0.66 | 0.65 | 0.62 | 0.62 | |
| Nighttime Single | 0.61 | 0.62 | 0.61 | 0.60 | 0.60 | 0.60 | 0.60 | 0.59 | |
| Daytime Single | 0.61 | 0.61 | 0.56 | 0.53 | 0.61 | 0.59 | 0.54 | 0.50 | |
| RF Model | Nighttime Multi | 0.68 | 0.68 | 0.68 | 0.68 | 0.65 | 0.64 | 0.64 | 0.64 |
| Daytime Multi | 0.69 | 0.68 | 0.65 | 0.65 | 0.64 | 0.63 | 0.61 | 0.62 | |
| Nighttime Single | 0.63 | 0.63 | 0.63 | 0.63 | 0.61 | 0.60 | 0.60 | 0.60 | |
| Daytime Single | 0.64 | 0.67 | 0.55 | 0.49 | 0.61 | 0.65 | 0.54 | 0.46 | |
| SVM Model | Nighttime Multi | 0.69 | 0.69 | 0.69 | 0.69 | 0.64 | 0.64 | 0.64 | 0.64 |
| Daytime Multi | 0.69 | 0.69 | 0.65 | 0.66 | 0.65 | 0.64 | 0.62 | 0.62 | |
| Nighttime Single | 0.63 | 0.64 | 0.62 | 0.62 | 0.61 | 0.60 | 0.59 | 0.59 | |
| Daytime Single | 0.64 | 0.69 | 0.58 | 0.55 | 0.63 | 0.63 | 0.55 | 0.51 | |
Disclaimer/Publisher’s Note: The statements, opinions and data contained in all publications are solely those of the individual author(s) and contributor(s) and not of MDPI and/or the editor(s). MDPI and/or the editor(s) disclaim responsibility for any injury to people or property resulting from any ideas, methods, instructions or products referred to in the content. |
© 2024 by the authors. Licensee MDPI, Basel, Switzerland. This article is an open access article distributed under the terms and conditions of the Creative Commons Attribution (CC BY) license (https://creativecommons.org/licenses/by/4.0/).
Share and Cite
Wisutwattanasak, P.; Se, C.; Champahom, T.; Kasemsri, R.; Jomnonkwao, S.; Ratanavaraha, V. Factors Affecting Single and Multivehicle Motorcycle Crashes: Insights from Day and Night Analysis Using XGBoost-SHAP Algorithm. Big Data Cogn. Comput. 2024, 8, 128. https://doi.org/10.3390/bdcc8100128
Wisutwattanasak P, Se C, Champahom T, Kasemsri R, Jomnonkwao S, Ratanavaraha V. Factors Affecting Single and Multivehicle Motorcycle Crashes: Insights from Day and Night Analysis Using XGBoost-SHAP Algorithm. Big Data and Cognitive Computing. 2024; 8(10):128. https://doi.org/10.3390/bdcc8100128
Chicago/Turabian StyleWisutwattanasak, Panuwat, Chamroeun Se, Thanapong Champahom, Rattanaporn Kasemsri, Sajjakaj Jomnonkwao, and Vatanavongs Ratanavaraha. 2024. "Factors Affecting Single and Multivehicle Motorcycle Crashes: Insights from Day and Night Analysis Using XGBoost-SHAP Algorithm" Big Data and Cognitive Computing 8, no. 10: 128. https://doi.org/10.3390/bdcc8100128
APA StyleWisutwattanasak, P., Se, C., Champahom, T., Kasemsri, R., Jomnonkwao, S., & Ratanavaraha, V. (2024). Factors Affecting Single and Multivehicle Motorcycle Crashes: Insights from Day and Night Analysis Using XGBoost-SHAP Algorithm. Big Data and Cognitive Computing, 8(10), 128. https://doi.org/10.3390/bdcc8100128