Abstract
When exposed to sulfuric acid environments, the service life of concrete structures would be reduced due to the high alkalinity of concrete. The influence of three factors including water/cement ratio, the pH value of the solution, and the chemical composition of the aggregate on the resistance of concrete subjected to sulfuric acid has been widely investigated by previous researchers. This paper aims to investigate the influence of these three factors on the durability evaluation indicators including mass loss and surface fractal dimension through orthogonal experiments, which has been reported rarely in previous research. Four combinations of coarse and fine aggregate including gravel and river sand, gravel and crushed marble sand, crushed marble stone and river sand, and crushed marble stone and marble sand were adopted, and three water/cement ratios including 0.35, 0.45, and 0.55 were selected, and the sulfuric acid solution pH values 0.95, 2, and 4 were chosen in this paper. The results showed that the larger the water/cement ratio, the smaller the mass loss and the surface fractal dimension of the specimens, and with the decrease of the pH value of the sulfuric acid solution, the mass loss and the surface fractal dimension of the specimens would be increased. The concrete specimen containing gravel and river sand had the greatest surface fractal dimension and greatest mass loss, while the concrete specimen containing crushed marble sand had a smaller surface fractal dimension and a smaller mass loss. The dominant and secondary order of three factors on mass loss and surface fractal dimension of concrete subjected to sulfuric acid was the pH value of the solution > the chemical composition of the aggregate > the water/cement ratio.
1. Introduction
Concrete has become the most widely used material in the world due to the wide availability of resources of concrete components, the low cost for construction, the convenience for molding, and if properly used, concrete structures are usually designed and built for a minimum period of 50 years [1,2,3,4,5,6,7,8]. Due to the high alkalinity of concrete, the service life of concrete structures would be reduced when exposed to acidic environments. Sometimes, the concrete structures were damaged only in a few years due to acid attacks. The effect of different acids on concrete corrosion depends on the solubility of calcium salts of some acid [9]. Sulfuric acid was the most aggressive mineral acid found in the natural environment [10], which mainly generated in the following three ways: (1) The sulfuric acid could be produced by the oxidation of pyrite, and pyrite was the most abundant and widely distributed of the earth’s sulfide minerals [11]. (2) In concrete sewer pipes, sulfur-containing compounds could be decomposed under the action of bacterial activity that eventually produces sulfuric acid [10,12]. (3) Sulfuric acid, which could be formed by the oxidation of sulfur oxides produced by automobiles and industrial production activities, was a major component of acid rain in most parts of the world [12]. The deterioration of concrete subjected to sulfuric acid resulted in significant environmental problems and economic losses of billions of dollars annually. The cost of replacing and repairing corroded concrete sewer pipes each year in the UK and Germany was USD 130 million and USD 120 million, respectively [13]. Many irreplaceable structures (such as Emei Mountain–Leshan Grand Buddha and the Statue of Liberty in the United States) have been severely damaged by acid rain in the past decades, and the direct material loss caused by acid rain in China in 1999 alone was reported to be approximately three billion Chinese yuan [14,15]. Therefore, the sulfuric acid corrosion of concrete has attracted a great deal of attention from researchers all over the world. The factors affecting the sulfuric corrosion of concrete can be roughly divided into two categories: (1) internal factors such as cement type, supplementary cementitious materials, water/cement ratio, aggregate, and so on, and (2) external factors such as the pH value of the solution, temperature, the stress state of concrete, and so on. Among them, the factors including water/cement ratio, the pH value of the solution, and the chemical composition of the aggregate were investigated widely by researchers. It was generally believed in the literature that the water/cement ratio was the largest factor controlling the mechanical properties of concrete as well as its durability. Fattuhi N. I. [16] investigated the influence of the water/cement ratio of concrete cubes on the sulfuric acid resistance. The results showed that the loss in weight for cubes made from concrete with high water/cement ratios was lower than that for cubes made with lower water/cement ratios. Hewayde E. [17] immersed concrete specimens with three water/cement ratios of 0.25, 0.35, and 0.5 in sulfuric acid solutions with pH values of 0.3, 0.6, and 1.0 for 8 weeks. They found that the mass loss of concrete specimens decreased as the water/cement ratio increased. Kawai [18] found that the erosion depth of concrete with a high water/cement ratio, which had a higher capacity to absorb the expansion of the production reaction of gypsum, was larger than that with a low water/cement ratio. In terms of mix proportion of concrete, aggregate was the most primary constituent material of concrete. Among them, coarse aggregate accounts for about 50% of the total weight of concrete, and the fine material accounts for 25% of the total weight of concrete. Therefore, the effect of aggregate chemical composition on concrete sulfuric acid resistance was considered by some researchers. The aggregate could be divided into calcareous aggregate and siliceous aggregate, according to their chemical composition. The calcareous aggregate was mainly composed of calcium carbonate, which was more vulnerable to acid attack. However, the siliceous aggregate was mainly composed of silicon dioxide, which was more resistant to acid attack. It was reported that the service life of sewer pipes containing limestone aggregates was longer than that containing siliceous aggregates by 3–5 times in South Africa [19]. Hughes [20] found that the surface appearance and weight loss of concrete with limestone aggregate and siliceous aggregate were different. However, just three types of concrete cubes with different combinations of coarse and fine aggregates were compared without the concrete cubes with siliceous coarse aggregate and limestone fine aggregate. Belie [21] studied the influence of aggregate type, production method, and cement type on the corrosion of different types of concrete sewer pipes and they found that the aggregate type had the largest effect on degradation in both chemical and microbiological experiments. Sulfuric acid was a strong mineral acid, and the pH value could reflect the actual concentration of its acidic solution. Allahverdi [22] proposed that except for the properties of the concrete, the concentration of the attacking acid also influenced the extent of the attack. Hewayde [17] found out that the concentration of sulfuric acid played the most important role in determining the degradation amount and rate of concrete under sulfuric acid exposure, and the mass loss of concrete specimens increased as the concentration of the sulfuric acid increased. Quantitative evaluation of the deterioration degree is a basic and vital challenge in concrete corrosion research. Taheri [10] adopted compressive strength, scanning electron microscopy, micro-X-ray fluorescence spectrometry, and the Vickers hardness test to characterize the physicochemical changes of mortar and concrete corroded by the sulfuric acid. Mass loss and surface fractal dimension were considered to be good indicators due to simple, quick, and non-destructive characteristics [23,24,25,26,27]. Changes in concrete surface roughness caused by sulfuric acid can cause some effects to concrete components. In sewer pipe systems, a rough surface is more conducive to the host of sulfide oxidizing bacteria, which convert more sulfur-containing compounds into sulfuric acid, leading to severe acid corrosion. Compared with the traditional roughness evaluation parameters, the fractal dimension, which is invariant in length scales, was an intrinsic property and could be a better choice for surface characterization [28]. In this paper, the influence degree order of three factors including water/cement ratio, coarse and fine aggregate combination, and the pH value of the solution on the durability evaluation indicators including mass loss and surface fractal dimension were investigated by a dummy factor orthogonal test method, which has been reported rarely in previous research.
2. Experimental Methods
2.1. Materials
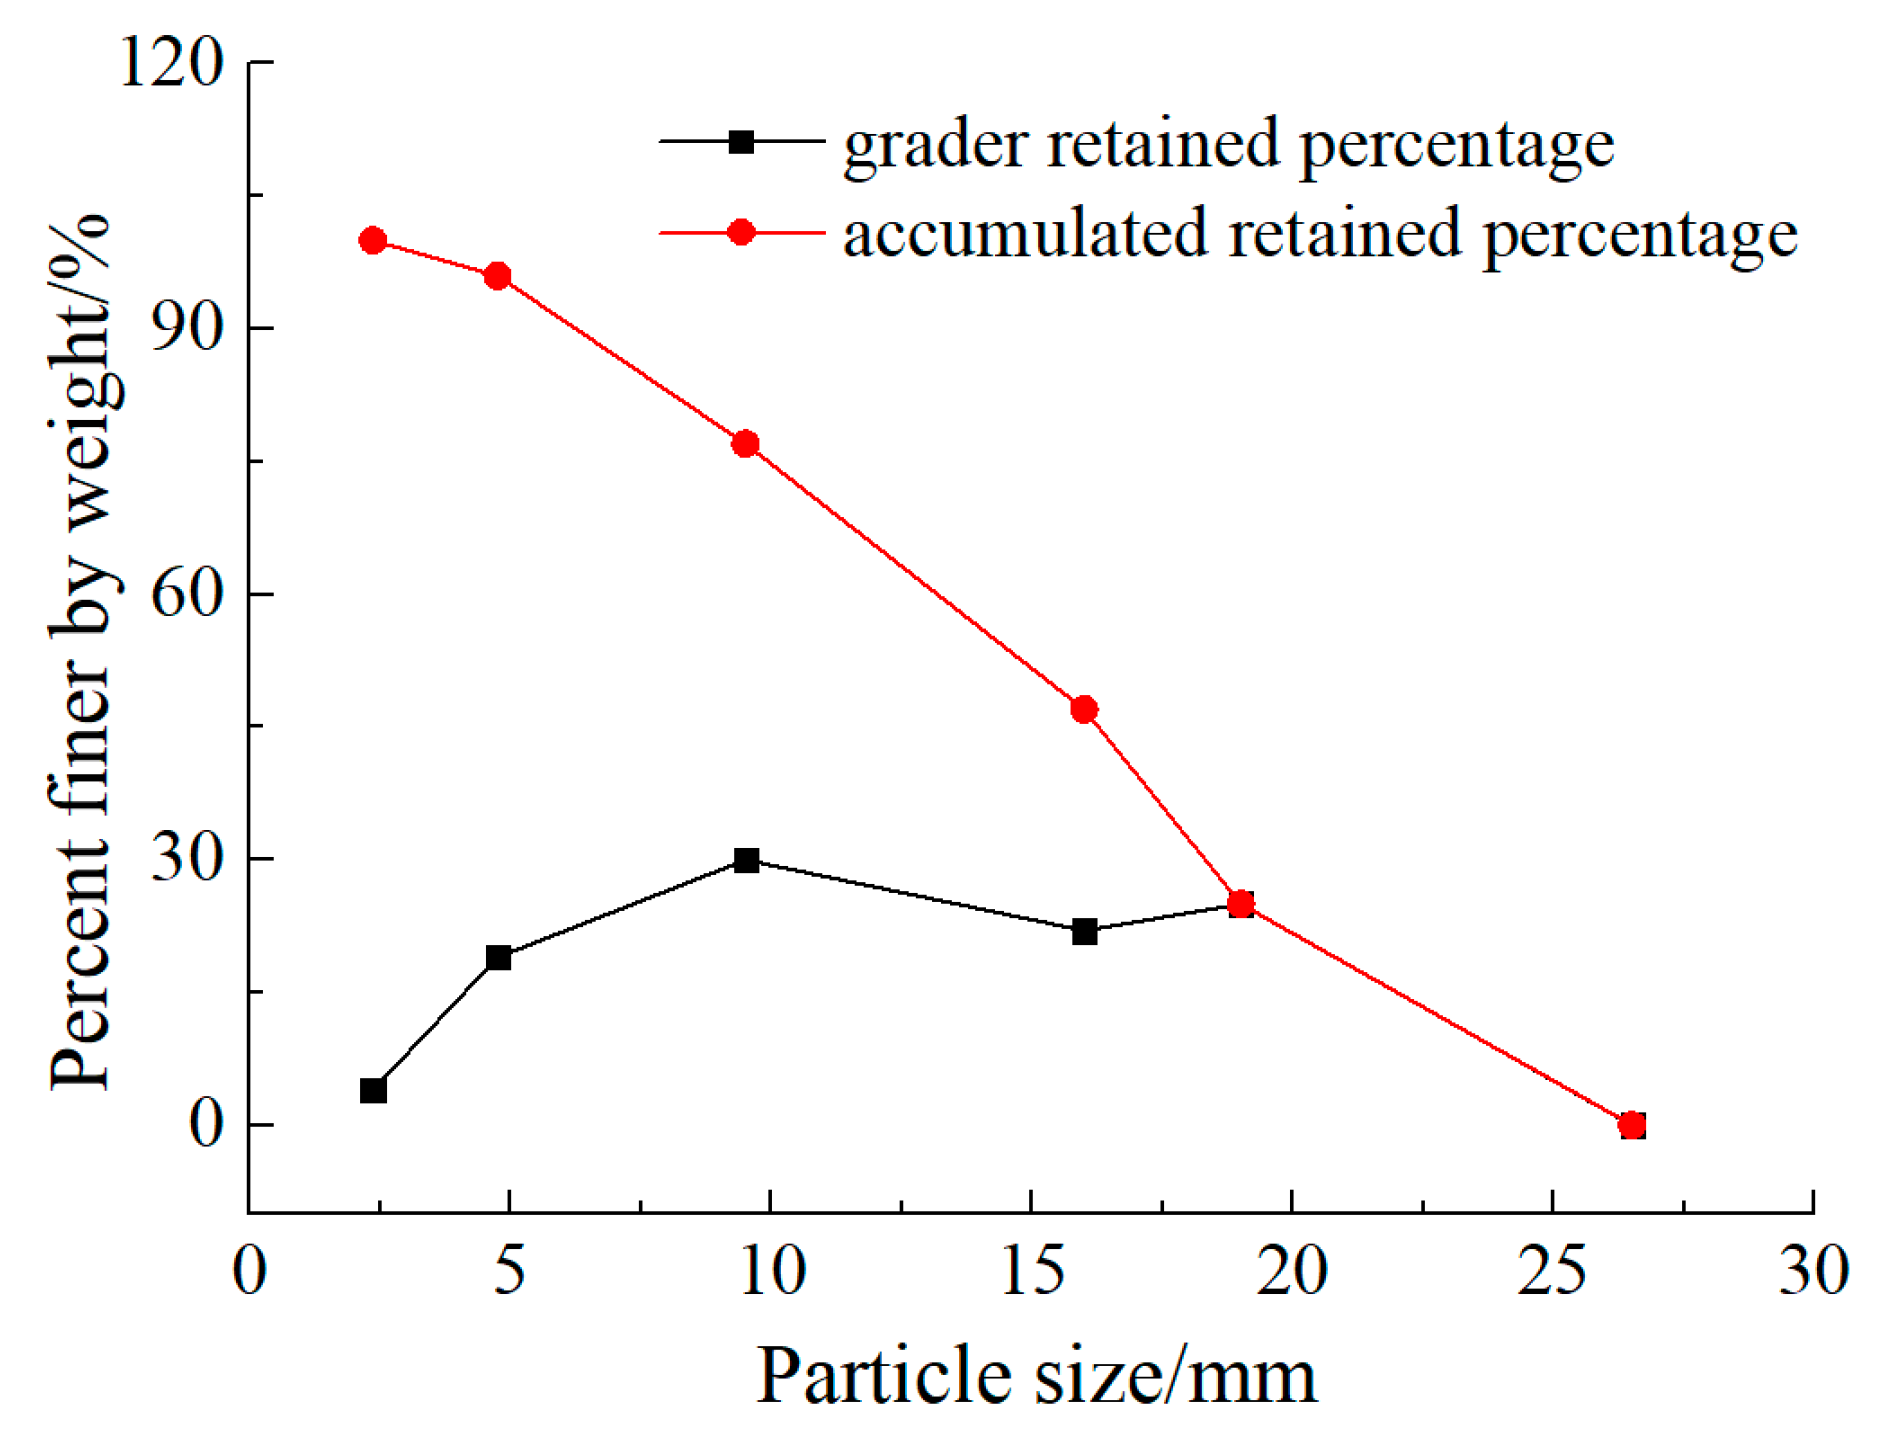
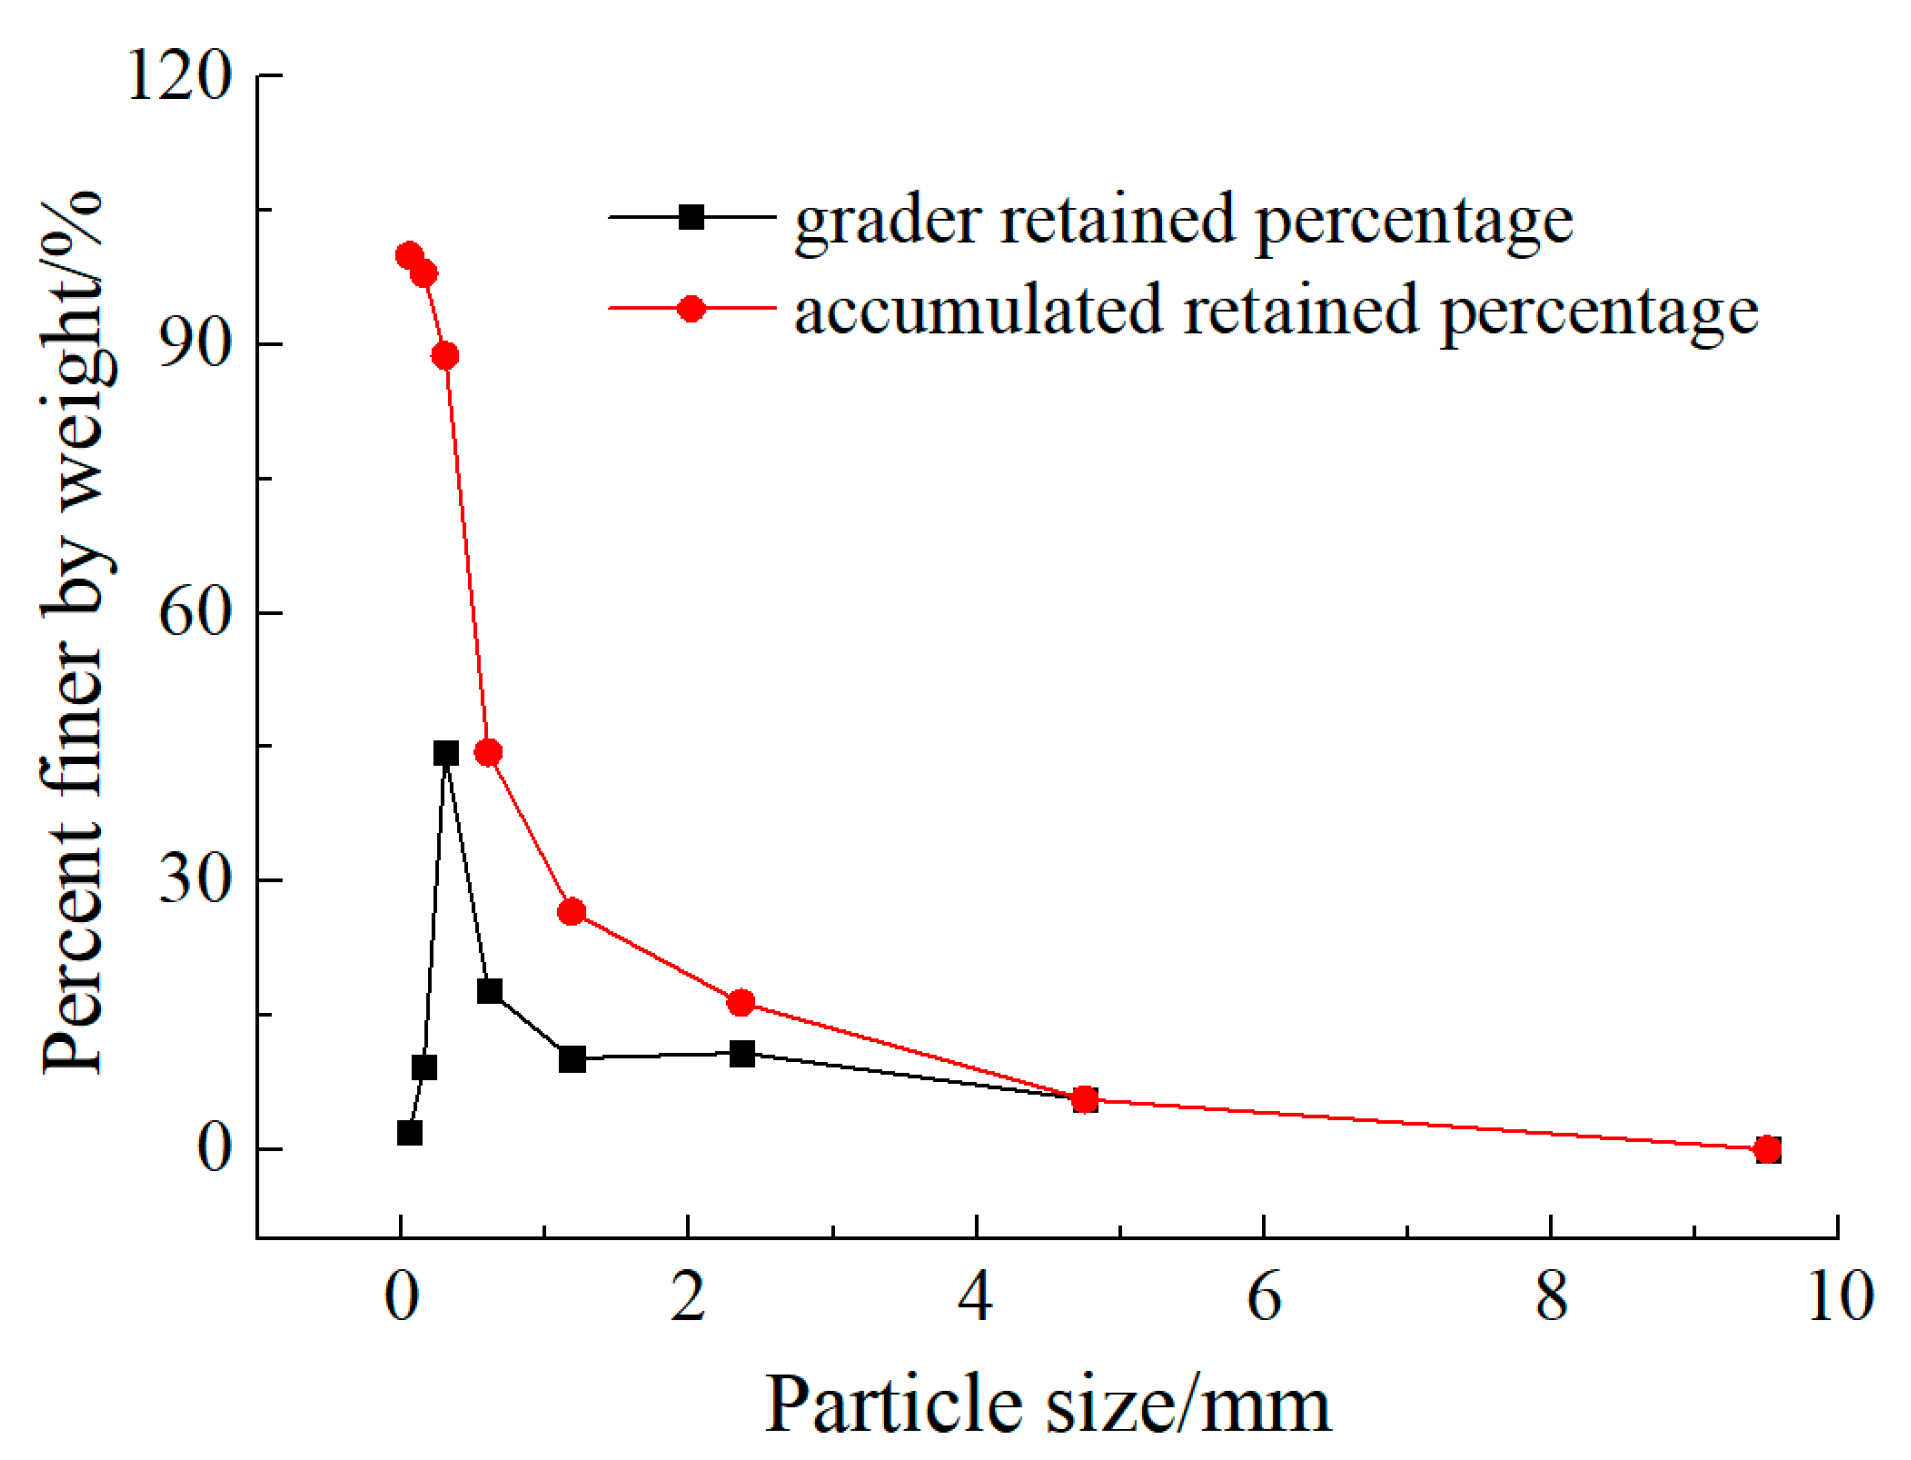
Normal Portland cement (P·II 52.5 R) with a compressive strength of 55.3 MPa at 28 days of curing was used. The crushed gravel had sizes of 5–25 mm and an apparent density of 2644 kg/m3. The ordinary river sand had a fineness modulus of 2.61 and an apparent density of 2540 kg/m3. The particle size distribution of the crushed gravel and the river sand is shown in Figure 1 and Figure 2, respectively. The river sand was mainly composed of silicon dioxide (88.54% in Limbachiya M.’s paper [29] and 78.56% in Ning Y.’s paper [30]). The chemical composition of the gravel was detected by an X-ray fluorescence (XRF) test, as shown in Table 1. It can be seen that the gravel mainly contains silicon dioxide. Thus, the gravel and river sand were used as fine and coarse siliceous aggregates. The cement, ordinary river sand, and crushed gravel were obtained from a local pipe pile corporation at Suzhou in China.
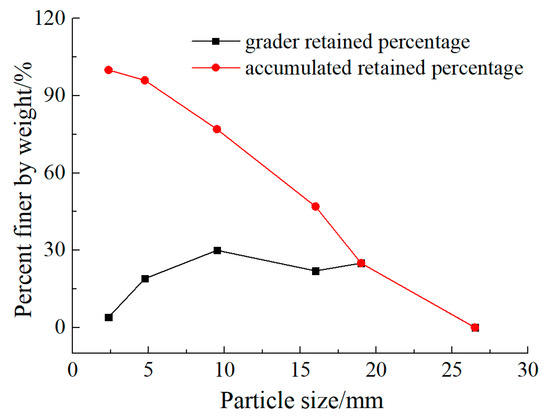
Figure 1.
The grader retained percentage and accumulated retained percentage of crushed gravel.
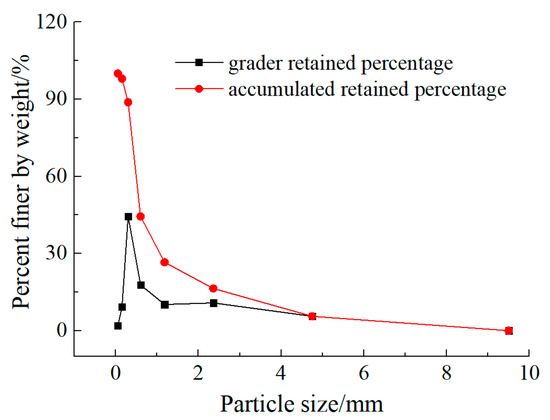
Figure 2.
The grader retained percentage and accumulated retained percentage of river sand.

Table 1.
Chemical composition of two types of aggregate (% by mass).
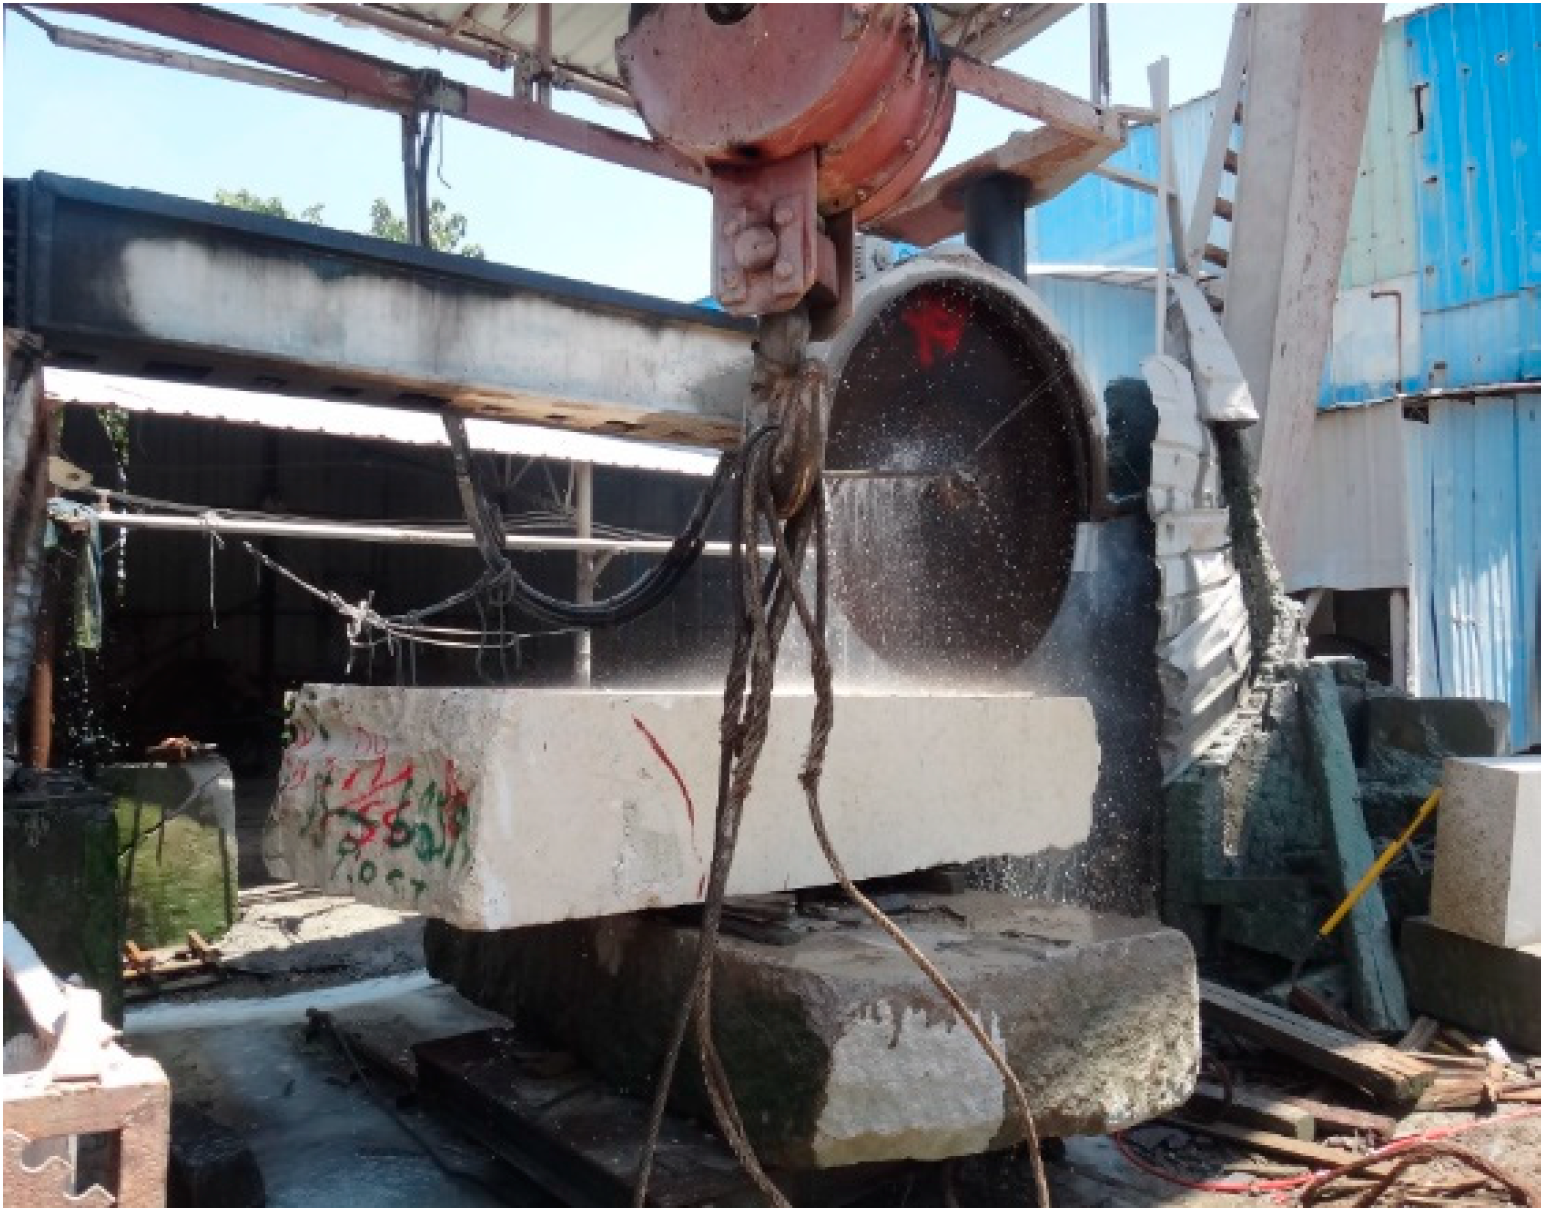
A block of natural marble rock about 1 m3 (as shown in Figure 3) was cut into 5 pieces by a special saw (as shown in Figure 4) and then these pieces were knocked into fist-sized stone by manual hammer and then these stones were crushed into marble particles by a crusher. These particles were divided into 9 groups using a sieve shaker sized 0.15–0.3 mm, 0.3–0.6 mm, 0.6–1.18 mm, 1.18–2.36 mm, 2.36–4.75 mm, 4.75–9.5 mm, 9.5–16 mm, 16–19 mm, 19–26.5 mm (as shown in Figure 5). The marble stone and marble sand were used as fine and coarse calcareous aggregates because the main composition of the marble was calcium oxide, as shown in Table 1. With the intention of making the particle size distribution of marble stone and gravel the same, the marble stone mass percentage of 2.36–4.75 mm, 4.75–9.5 mm, 9.5–16 mm, 16–19 mm, 19–26.5 mm was 4%, 19%, 30%, 22%, 25%, respectively (data from Figure 1). In order to make the particle size distribution of marble sand and river sand the same, the marble sand mass percentage of 0.15–0.3 mm, 0.3–0.6 mm, 0.6–1.18 mm, 1.18–2.36mm, 2.36–4.75mm, 4.75–9.5 mm was 9.2%, 44.4%, 17.8%, 10.2%, 10.8%, 5.6%, respectively (data from Figure 2).
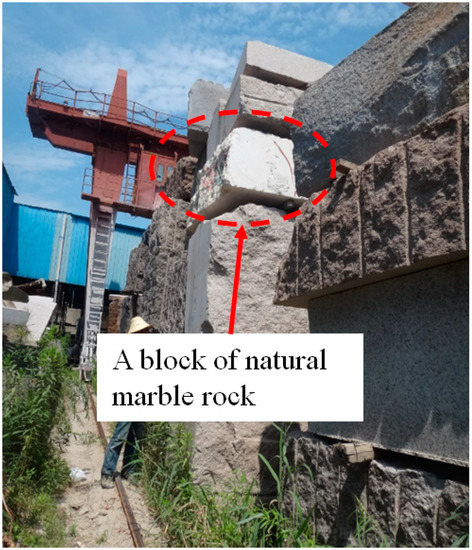
Figure 3.
The block of natural marble rock about 1 m3.

Figure 4.
The block of natural marble rock was cut by a special saw.
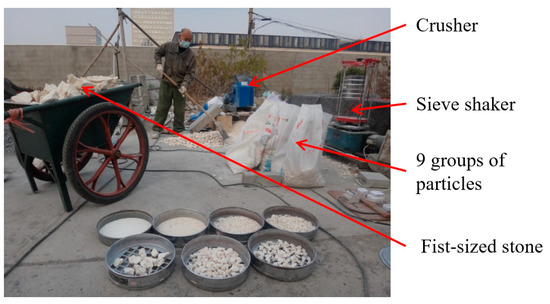
Figure 5.
The process of marble particles being divided into 9 groups.
2.2. Mix Proportion Design
In this paper, four combinations of coarse and fine aggregate including gravel and river sand, gravel and crushed marble sand, crushed marble stone and river sand, and crushed marble stone and marble sand were adopted, and these four combinations of coarse and fine aggregate were, respectively, denoted by the symbols C1F1, C1F2, C2F1, and C2F2. At the same time, three water/cement ratios including 0.35, 0.45, and 0.55 were adopted and these three water/cement ratios were, respectively, denoted with the symbols W3, W4, and W5. For example, the symbol C2F1W5 denoted that the coarse and fine aggregate of the specimens were crushed marble stone and river sand, respectively, and the water/cement ratio was 0.55. Thus, there were twelve types of specimens cast in this paper and the mix proportions of them are shown in Table 2.
Table 2.
Mix proportions for concrete specimens (kg/m3).
2.3. Orthogonal Test Design
The orthogonal test, which is based on the statistics and orthogonal theory principle, is usually used to carry out multi-factor tests. Typical and representative sample tests were selected from the complete sample tests to analyze the relationship among the factors and the experimental results [31]. The design of the orthogonal test was based on the orthogonal table. The orthogonal table was usually expressed with Ln(rm), in which the letter L represented the orthogonal table, and n represented the number of rows which stood for the number of tests needed to be undertaken, and m represented the number of columns which stood for the maximum number of factors to be considered, and r represented the number of factor level, which stood for the value of each factor. In this paper, experimental factors to be considered were water/cement ratio, coarse and fine aggregate combination, and the pH value of the solution. Four combinations of coarse and fine aggregate, three water/cement ratios, and three pH values of the solution were adopted in this experiment. It meant that in this experiment case, one factor was varied at four levels and two other factors were varied at three levels. With the intention of accommodating both four-level and three-level factors in an orthogonal design, a special design technique called “dummy treatment” of factors was used [32]. Dummy treatment accommodated two three-level factors in a basic four-level orthogonal array by using only three of the possible levels for the factor and simplified repeating one level from the previous three levels for the indicated fourth level. Any one of the three levels for the factor could be repeated, so whichever was easiest, cheapest, or made more sense should be repeated. A four-level array L16 was modified to include two three-level factors using dummy treatment as shown in Table 3. According to the orthogonal tables, the L16(45) orthogonal table was applied in this paper as shown in Table 4. Three repetitions were used for each row.
Table 3.
Factors and levels table of the orthogonal experiment design.
Table 4.
L16 dummy level orthogonal experimental design.
2.4. Specimens Preparation and Sulfuric Acid Immersion Arrangement
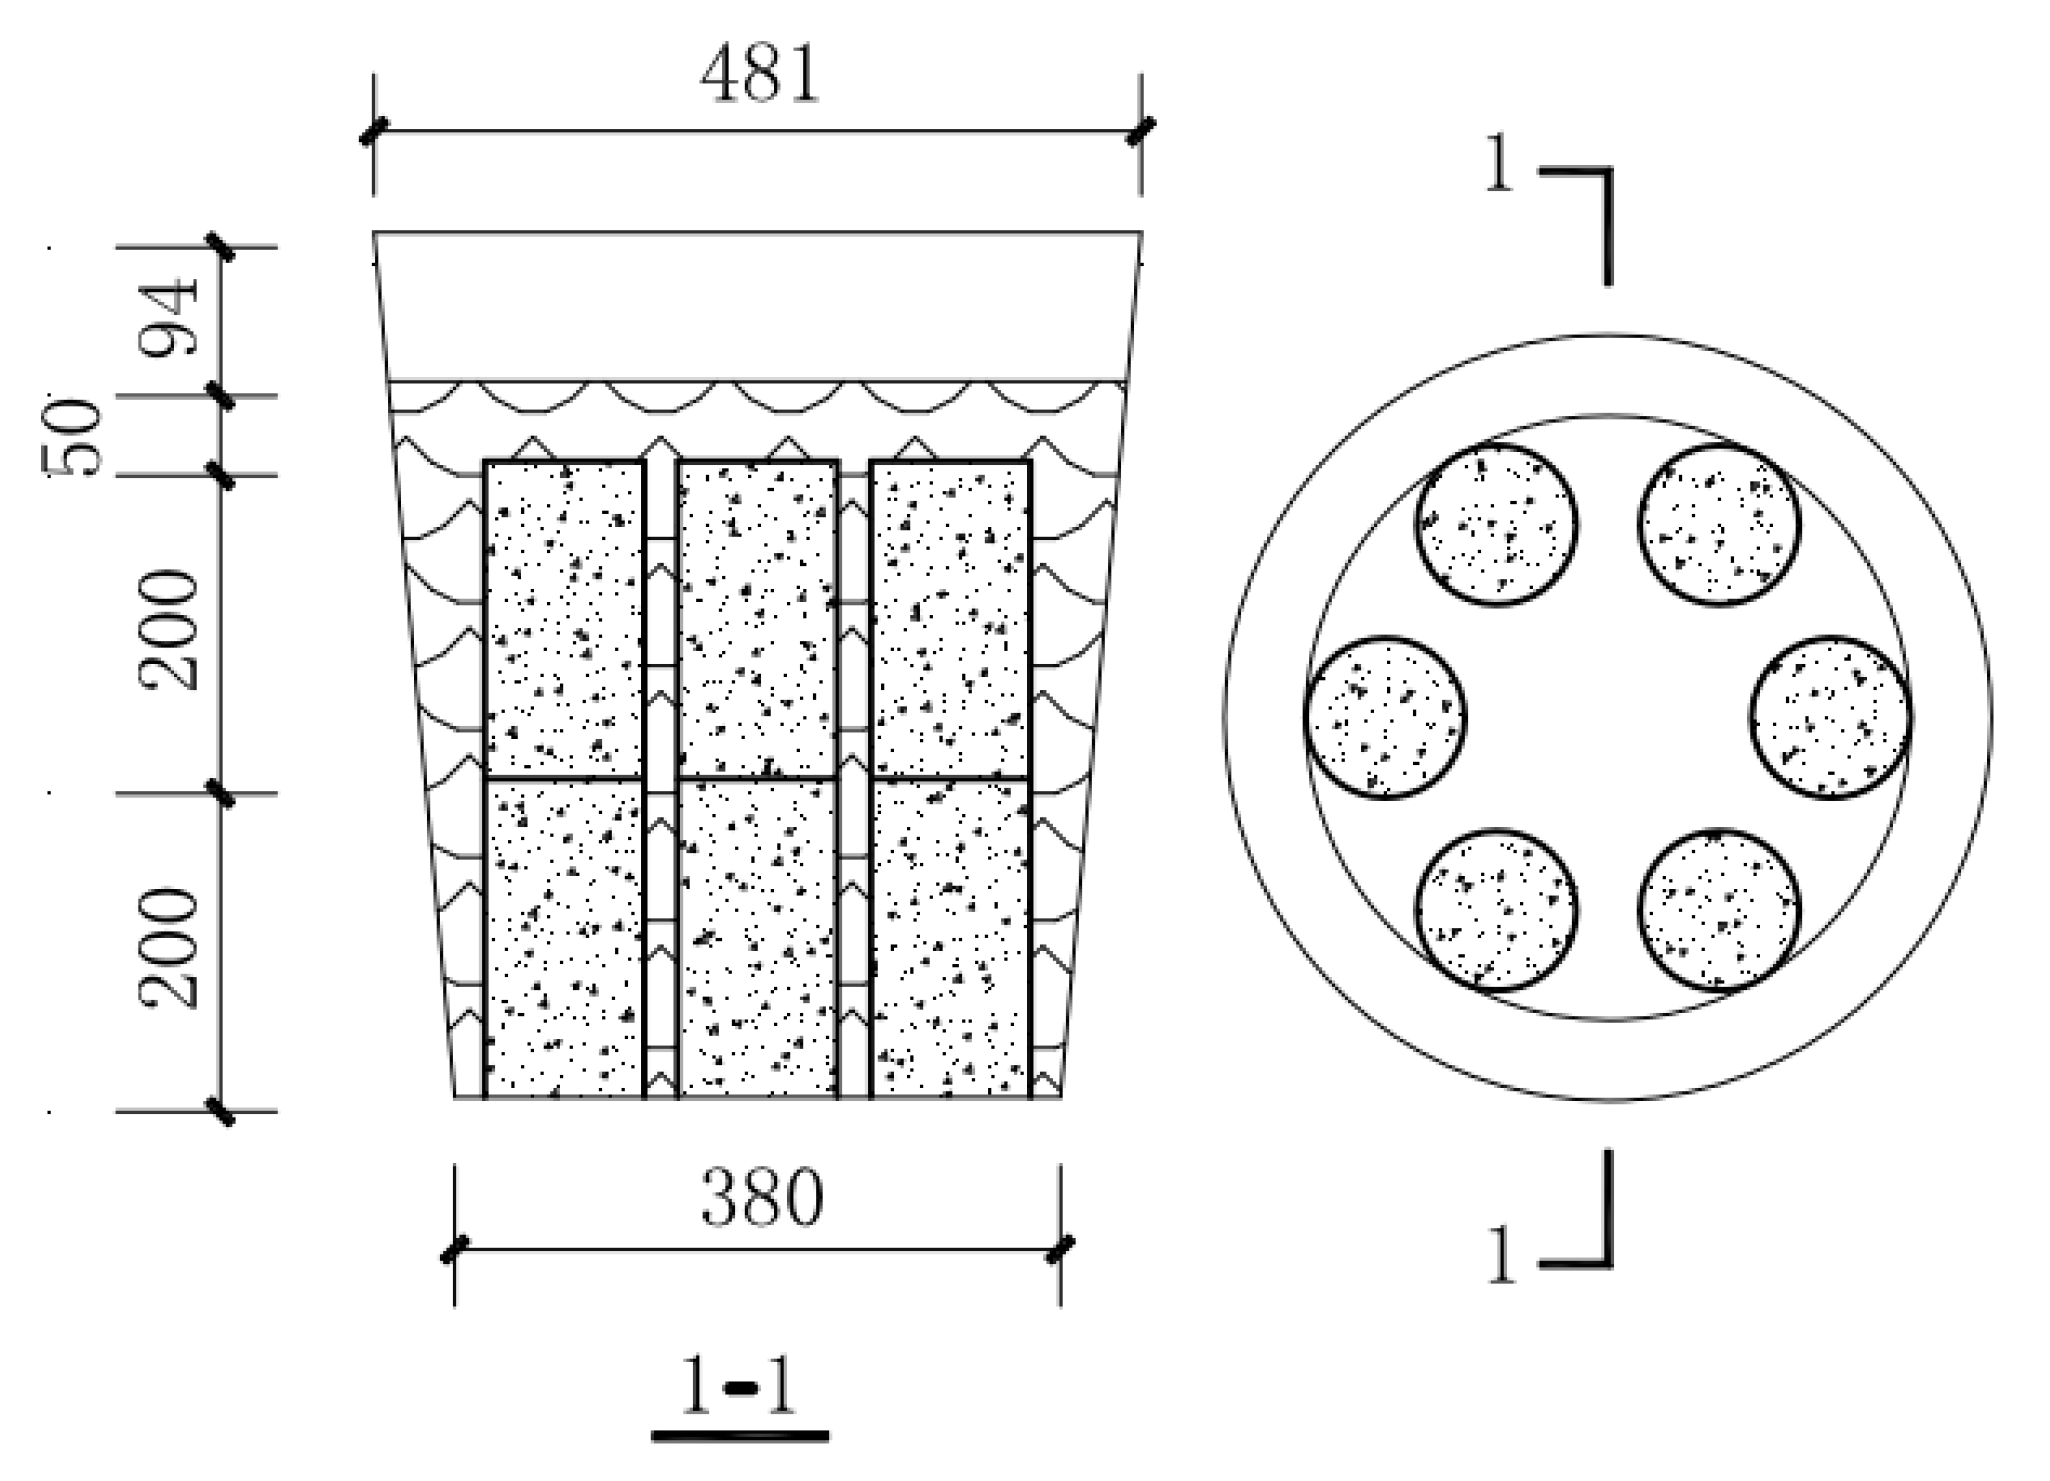
The concrete specimens were cast with cylinder steel molds of 100 mm in diameter and 200 mm in height, and the reason why the concrete was cast into such a size cylinder can be seen in the literature [12]. The methods of mixing, pouring, and curing were also the same as those in the literature [12]. Each group consisted of three specimens. A total of 84 concrete specimens were cast in this experiment, of which 48 concrete specimens were corroded in the sulfuric acid solution for 93 d, as shown in Table 5. The remaining 36 concrete specimens were not being corroded. According to the arrangement in Table 4, 48 concrete specimens were fully immersed in 4 plastic vessels containing aggressive sulfuric acid solution after 28 d of curing and 12 specimens were placed in each plastic vessel as shown in Figure 6. The sulfuric acid solution pH value in the two plastic vessels was 0.95, and the sulfuric acid solution pH values in the other two plastic vessels were 2 and 4, respectively. Concentrated sulfuric acid (98% by weight) was added every day to maintain the pH value fluctuating within the set value (0.95, 2, 4).
Table 5.
The mix proportion information of the total 84 concrete specimens.

Figure 6.
Specimen arrangement in each plastic vessel (mm).
2.5. The Calculation Method of Surface Fractal Dimensions
In recent years, the fractal theory has been widely used in the study of cementitious materials [33,34,35,36,37]. The steps to obtain the surface fractal dimension of cylinder concrete specimens subjected to sulfuric acid were the same as in [28], from which the detailed procedures could be obtained. The steps to obtain the fractal dimension were briefly described below. As shown in Figure 7, there were four steps. Step 1: Obtain the 3D coordinates of each point (i.e., point cloud) on the surface of the uncorroded and corroded concrete with a portable 3D laser scanner (T-SCAN CS manufactured by Steinbichler, Munich, Germany). Step 2: In MATLAB software (Matlab 2013b), delete the points on the two end surfaces and the 5 mm length lateral surface near the ends of each cylinder due to the protection by paraffin wax and unfold the sides of the cylinder into a rectangle. Step 3: Display the expanded rectangle in MATLAB software. Step 4: Adopt the cubic covering method proposed by Zhou and Xie [38] to calculate the uncorroded and corroded surface fractal dimension. In this paper, the T-SCAN hand-held laser scanner technical data are listed in Table 1 and this commercial laser scanner, after verification by using a precision sphere (Φ = 50mm) at 2.5, 4.0, and 5.5 m distance, exhibited maximum deviation of 40 μm.
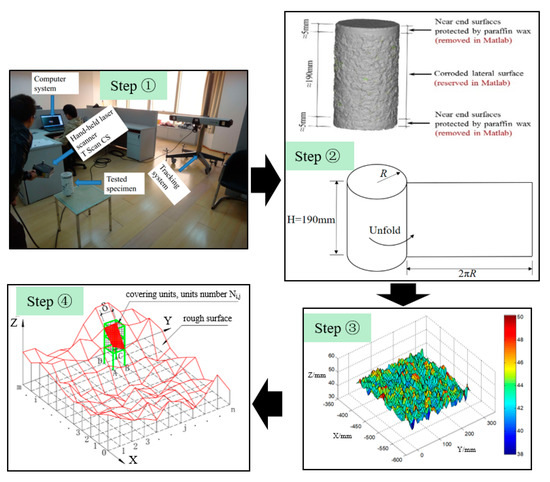
Figure 7.
Four steps to obtain the fractal dimension of cylinder concrete specimens.
2.6. The Calculation Method of Mass Loss
A digital balance (0–30 kg range and 1 g precision) was adopted to measure the mass of concrete specimens. The mass loss ω for specimens could be expressed as follows:
where was the mass loss at day i. The was the initial mass before sulfuric acid corrosion. The was the mass after day i exposure to sulfuric acid.
3. Experimental Results
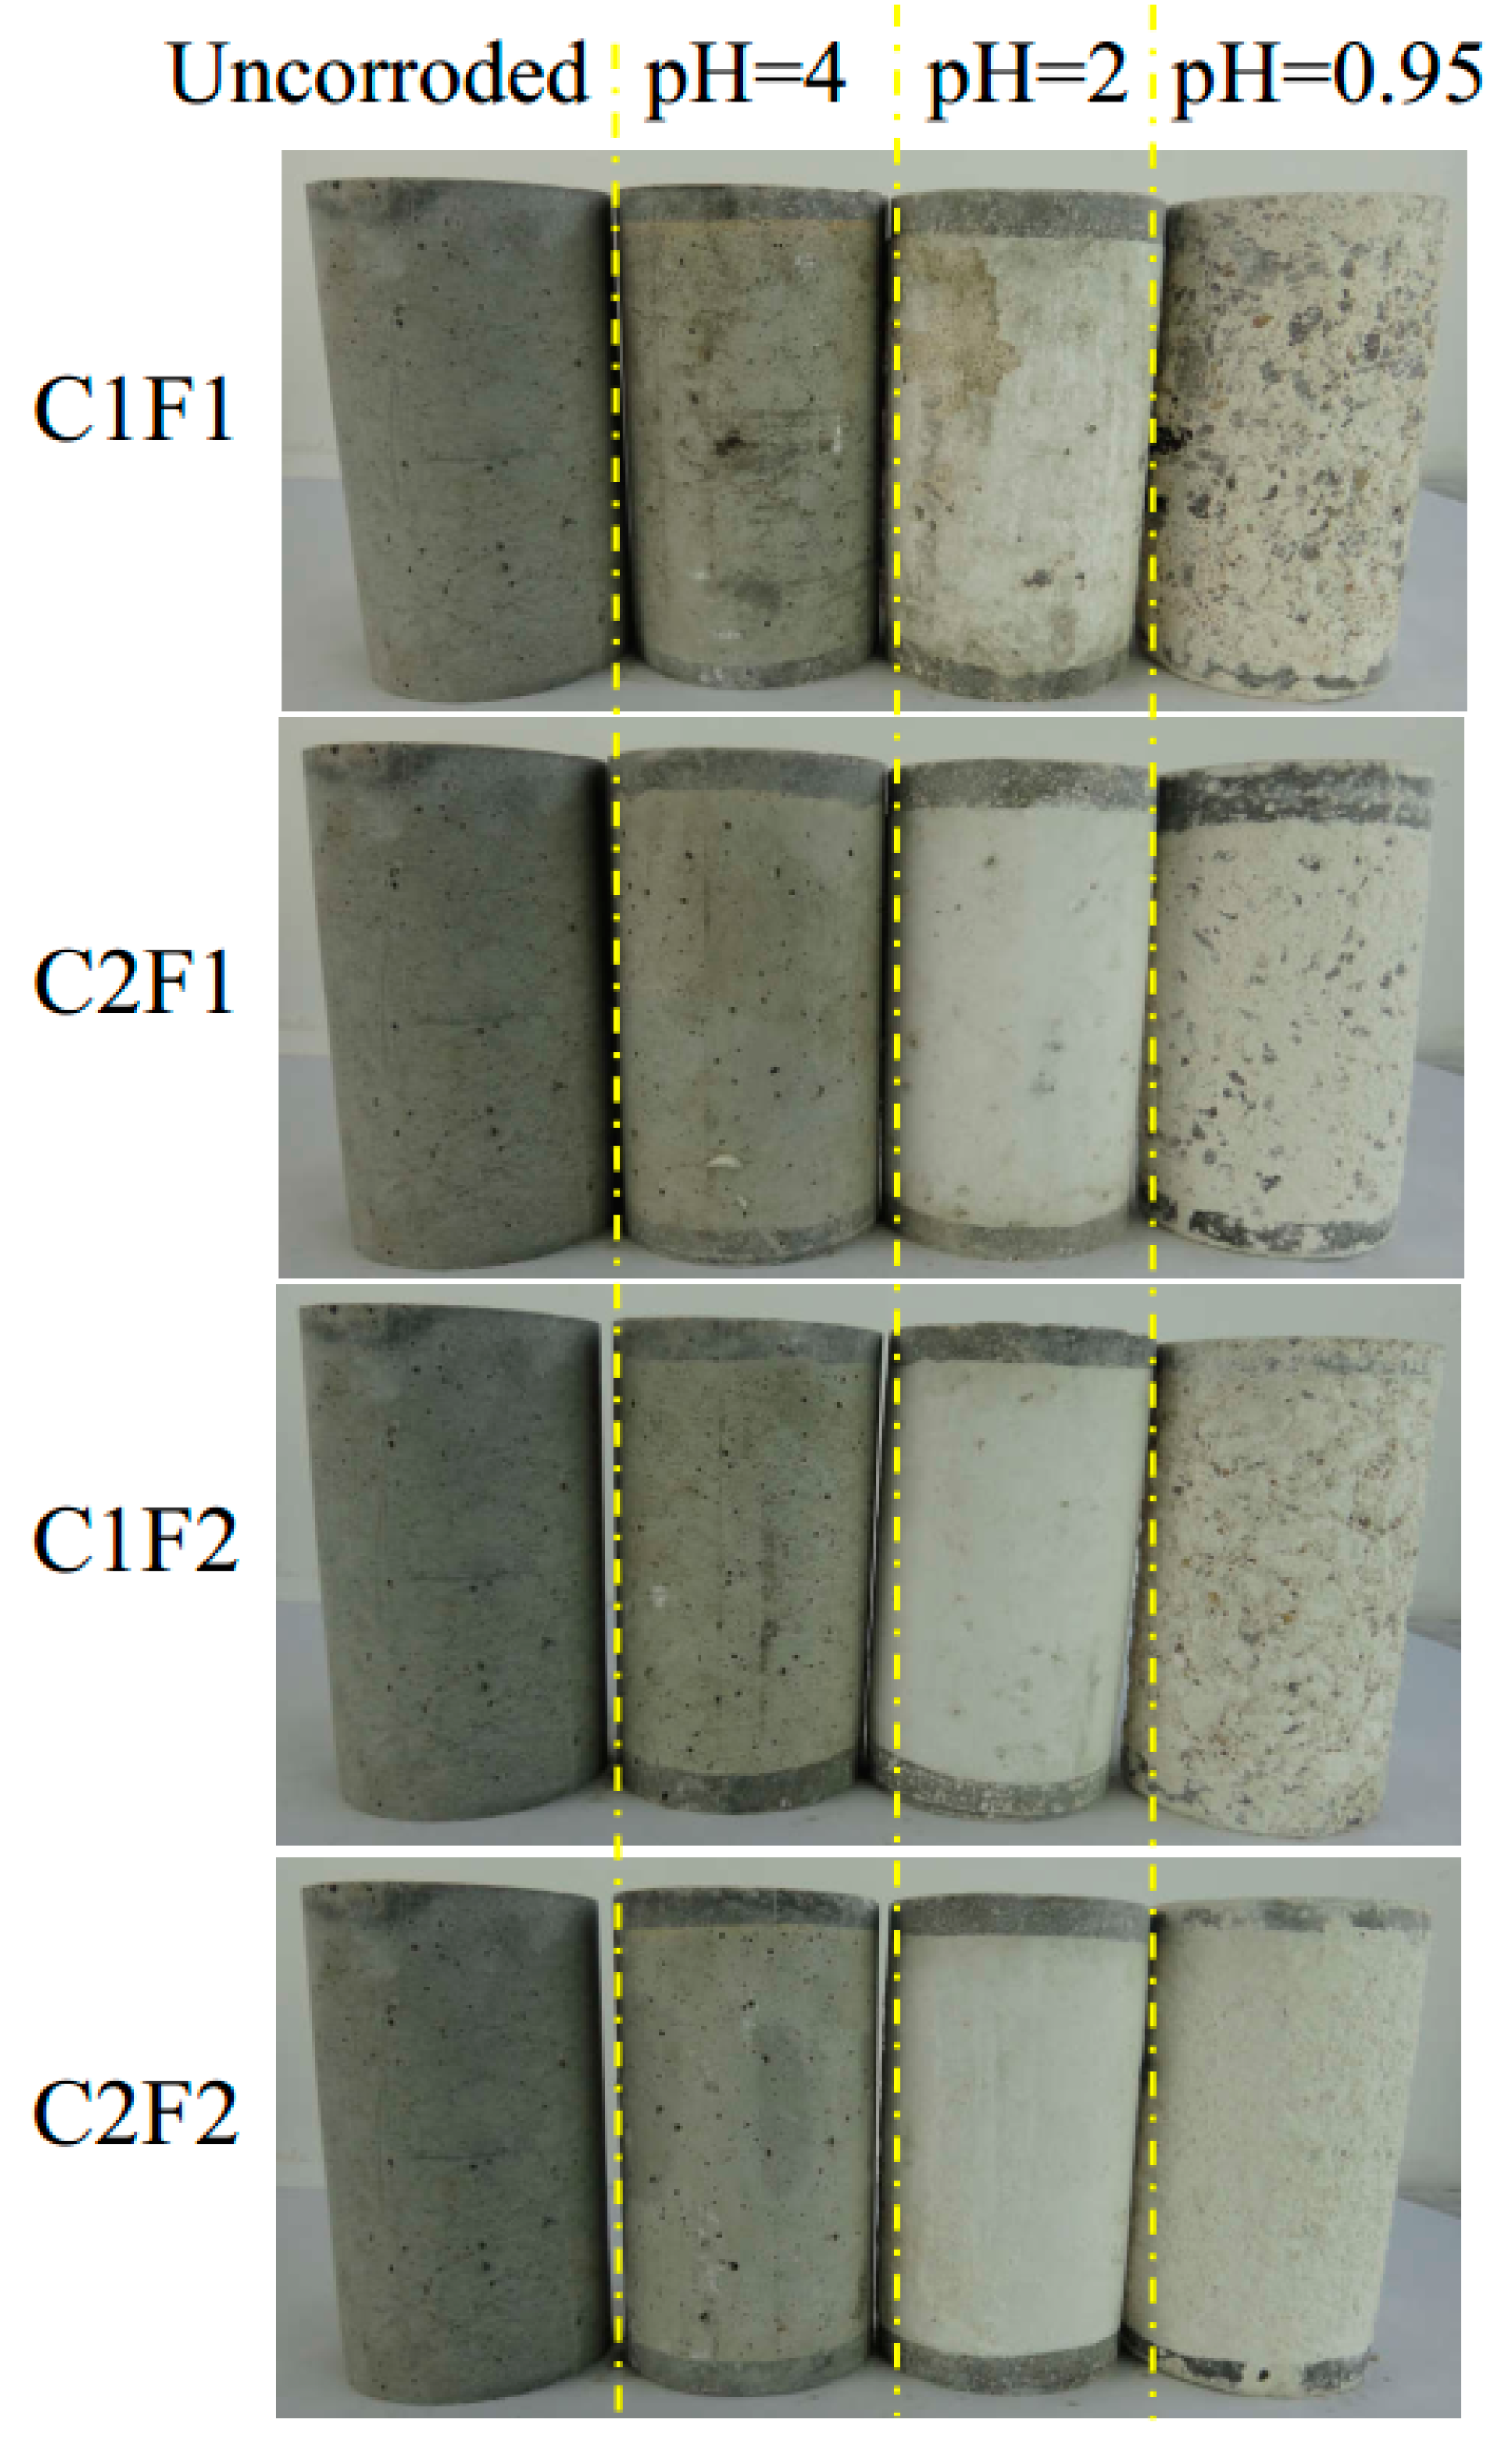
The appearances of the uncorroded specimens and that of the specimens by sulfuric acid solution with different pH values for 93 d are shown in Figure 8.
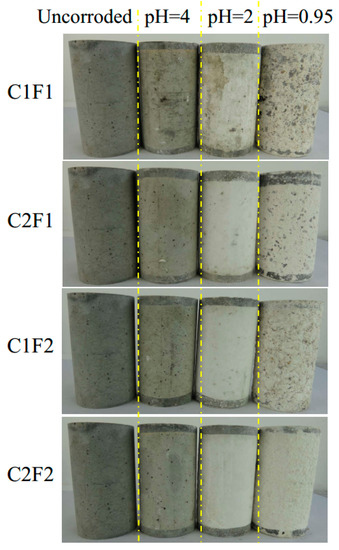
Figure 8.
Appearances of uncorroded and corroded specimens by sulfuric acid solution.
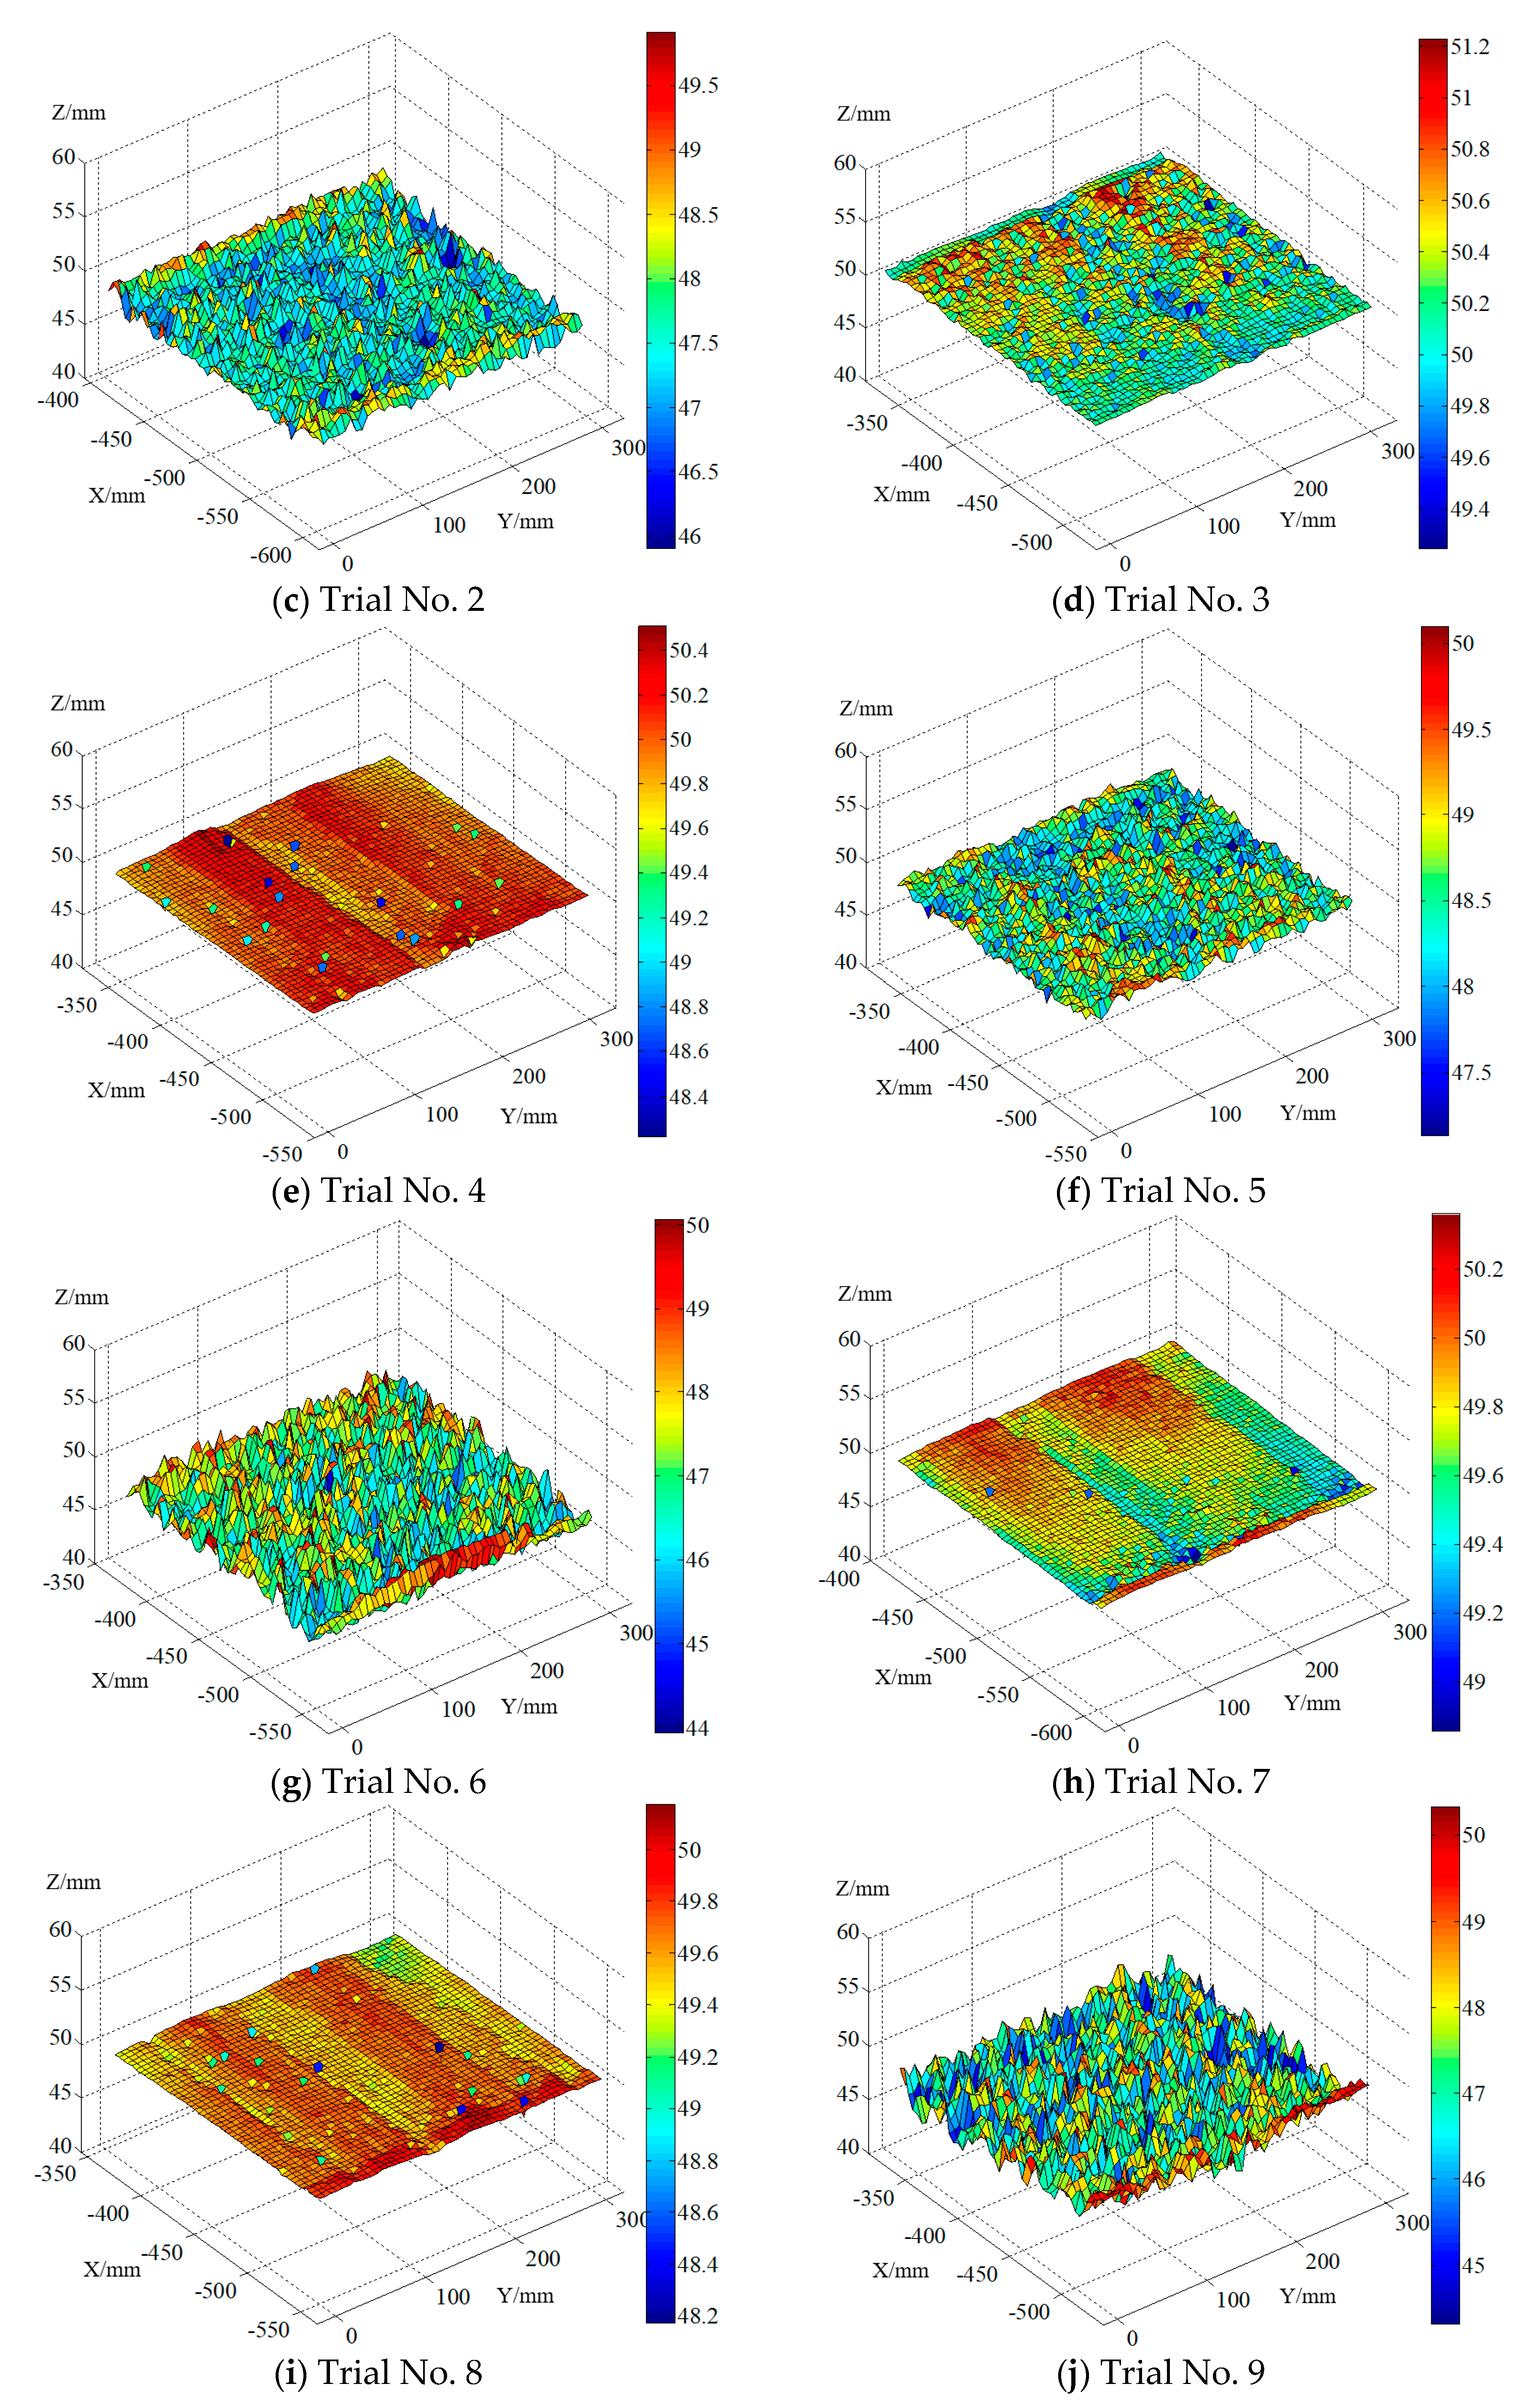
It can be seen in Figure 8 that the surface of the uncorroded specimens was flat and smooth, and the color of the surface of the specimens subjected to pH = 4 sulfuric acid solution was light brown, and the surface of the specimens subjected to pH = 2 sulfuric acid solution was coated with a thin layer of corrosion products, and the corrosion products on the surface of the specimens subjected to pH = 0.95 sulfuric acid solution became thick and fell off gradually. In MATLAB software, the expanded rectangle of the uncorroded specimen and the 16 test specimens listed in Table 4 are shown in Figure 9. The surface fractal dimensions of the uncorroded specimen and the 16 test specimens listed in Table 4 were calculated using the calculation method mentioned in Section 2.5.
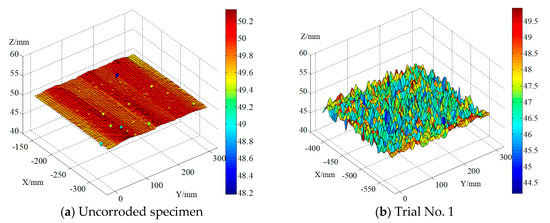
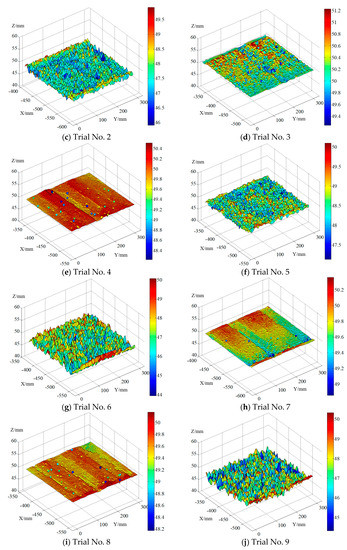
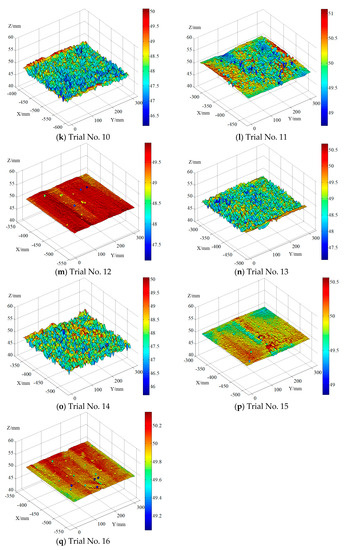
Figure 9.
The expanded rectangle of the specimens displayed in MATLAB software.
In this study, 16 sets of experiments were performed, with three repetitions for each test. The orthogonal experimental results of the mass loss and surface fractal dimension of the concrete specimens are listed in Table 6. It was obvious from Table 6 that the largest mass loss and surface fractal dimension of the corroded specimen was immersed in pH ≈ 0.95 sulfuric acid solution and was cast with gravel and river sand with a 0.35 water/cement ratio. The largest mass loss and surface fractal dimension of the corroded specimen was immersed in pH ≈ 0.95 sulfuric acid solution and was cast with gravel and river sand with a 0.35 water/cement ratio. The least corroded specimen was immersed in pH ≈ 4 sulfuric acid solution and was cast with gravel and river sand with a 0.55 water/cement ratio
Table 6.
Results of the mass loss and surface fractal dimension of the concrete specimens.
Range analysis was often utilized to study the results of orthogonal experiments. Range analysis is a statistical method to determine the primary and secondary effects of all factors on the evaluation indicators. Range was usually denoted by R and was defined as the difference between the extreme value of the data. If the R value was larger, it indicated that the influence degree of the corresponding factor was greater to the evaluation indicator. Range analysis could be carried out with the equations listed below.
where and , respectively, represented the total value and the average value of the experimental results which contain the factor with m level. The range analysis results of mass loss and surface fractal dimension of the concrete specimens are shown in Table 7. If the R value was larger, it indicated that the influence degree of the corresponding factor was greater to the evaluation indicator. Based on the R value in Table 7, the degree of effect of the pH value of the solution (factor B) on mass loss was the largest, while the water/cement ratio (factor A) had the least impact on mass loss. The degree of effect of the pH value of the solution (factor B) on surface fractal dimension was the largest, while the water/cement ratio (factor A) had the least impact on surface fractal dimension.
Table 7.
The range analysis on mass loss and surface fractal dimension of the concrete specimens.
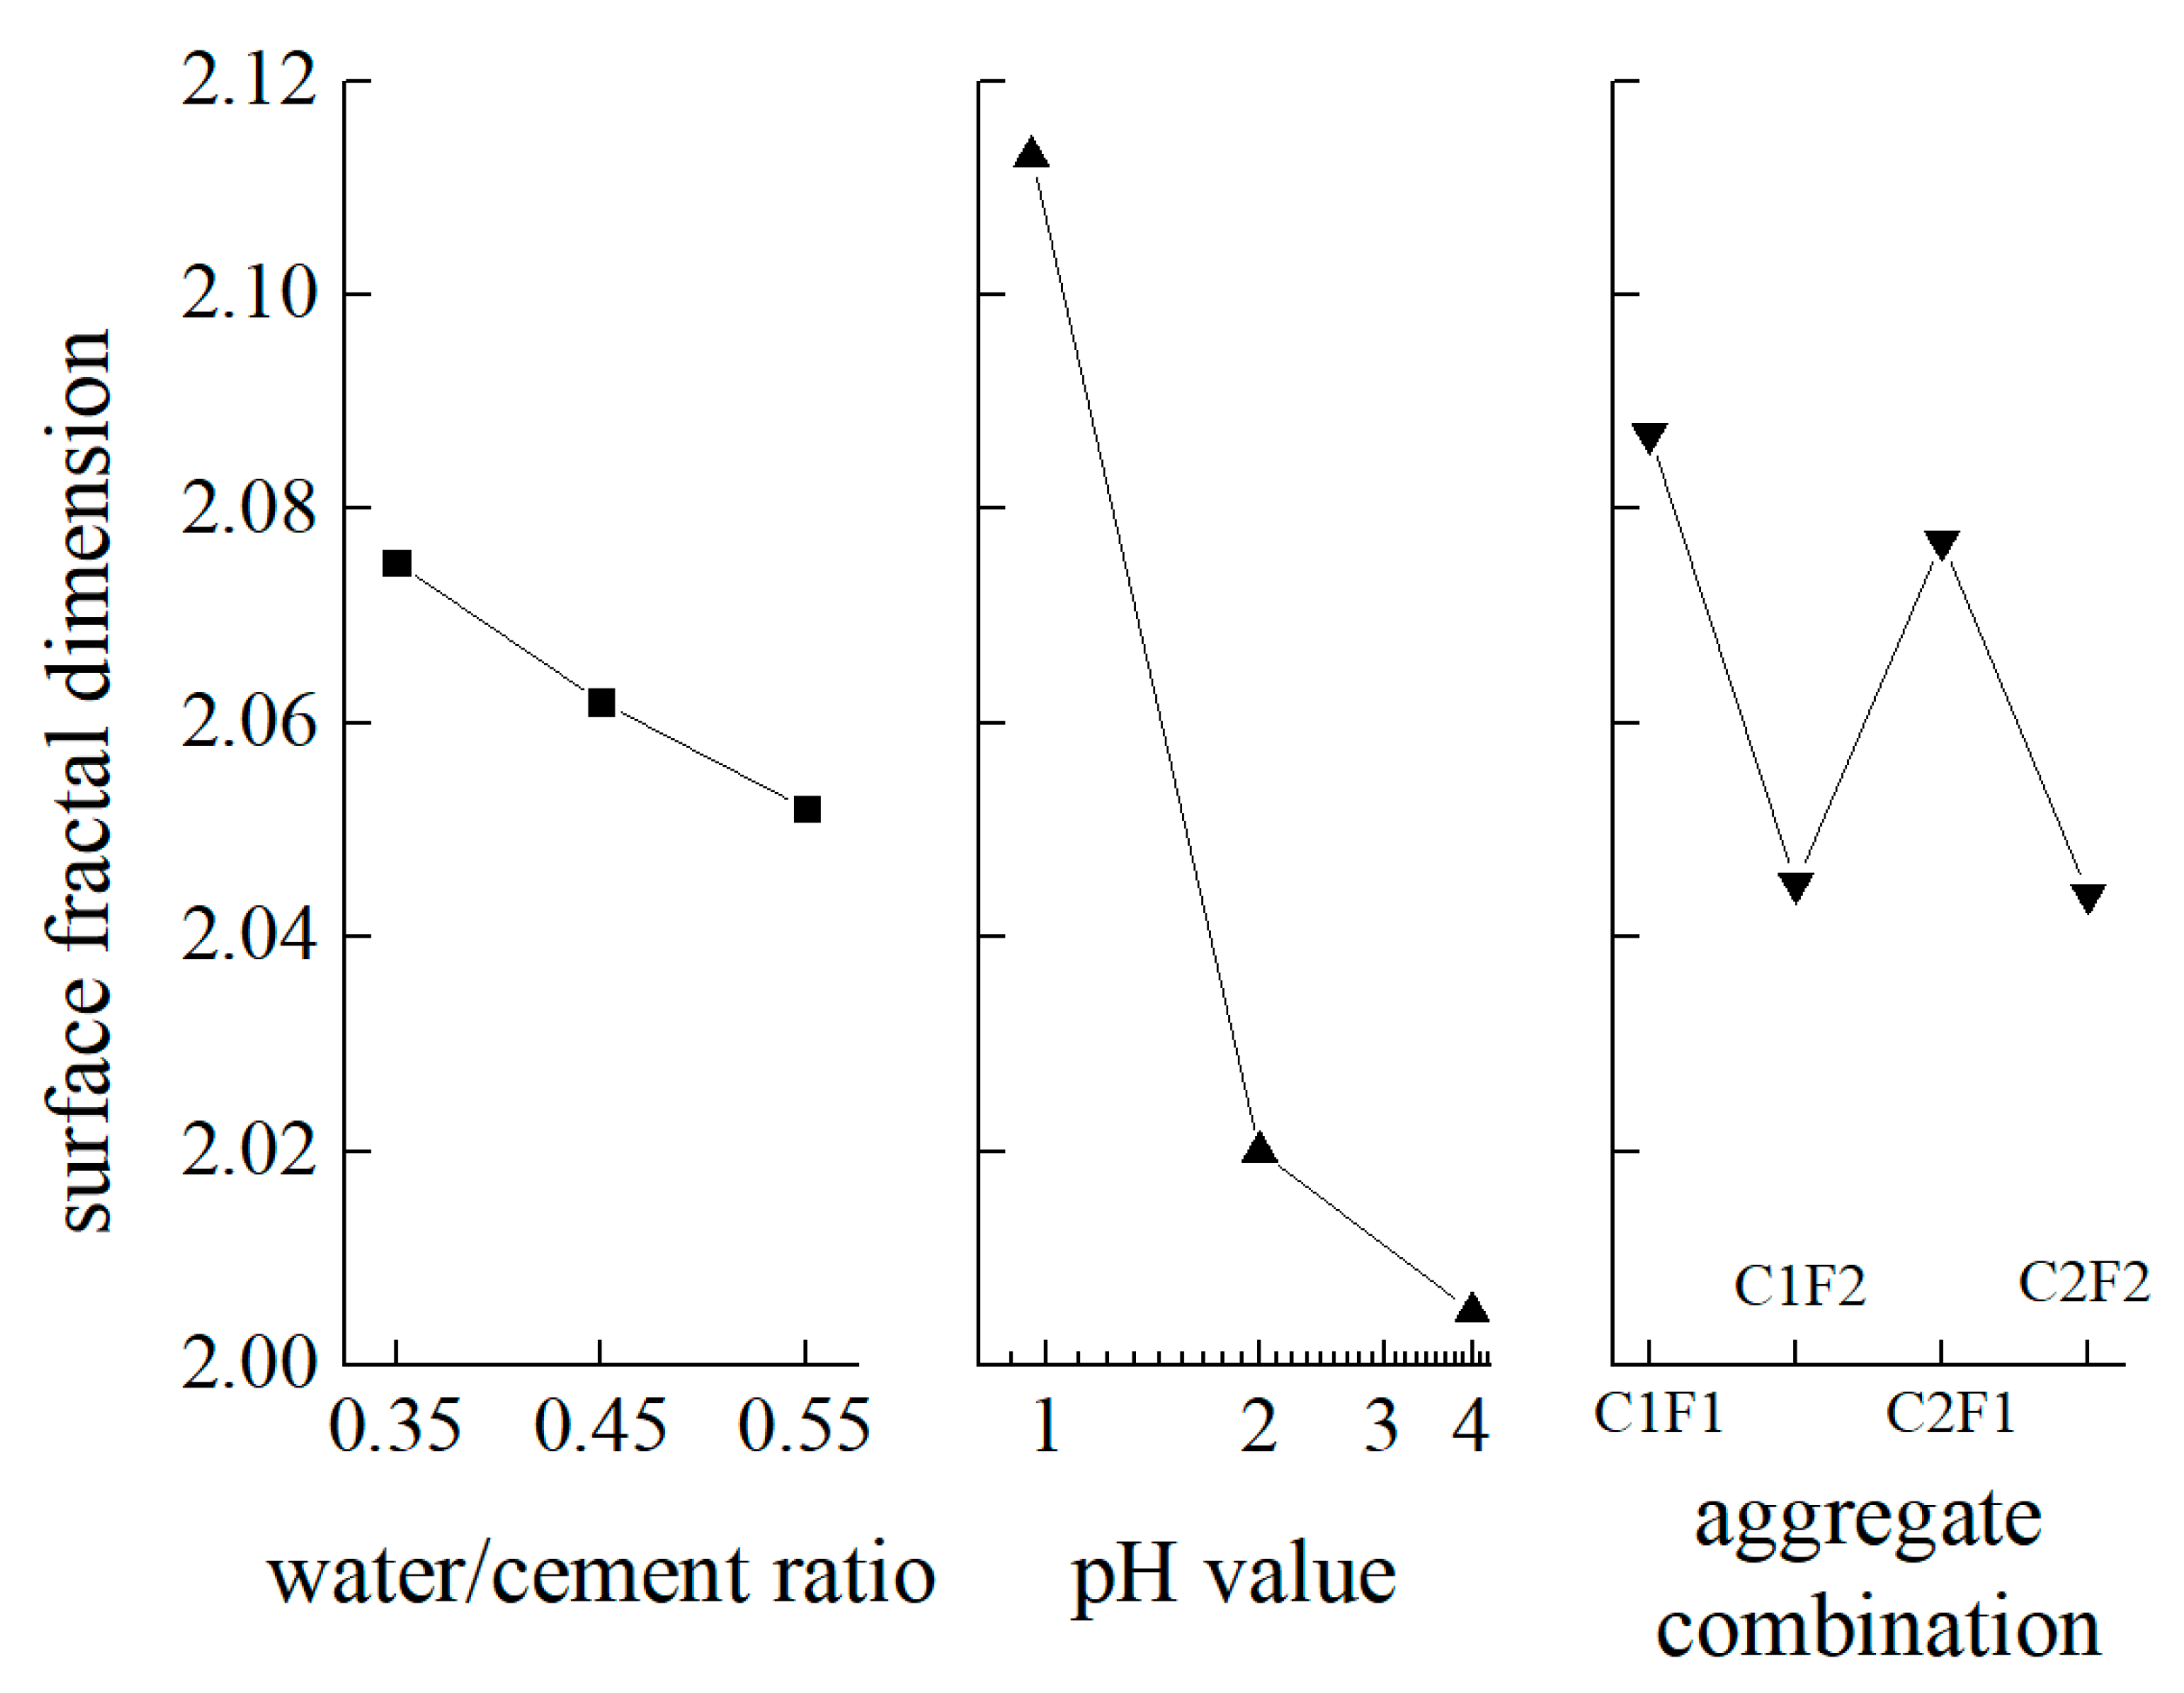
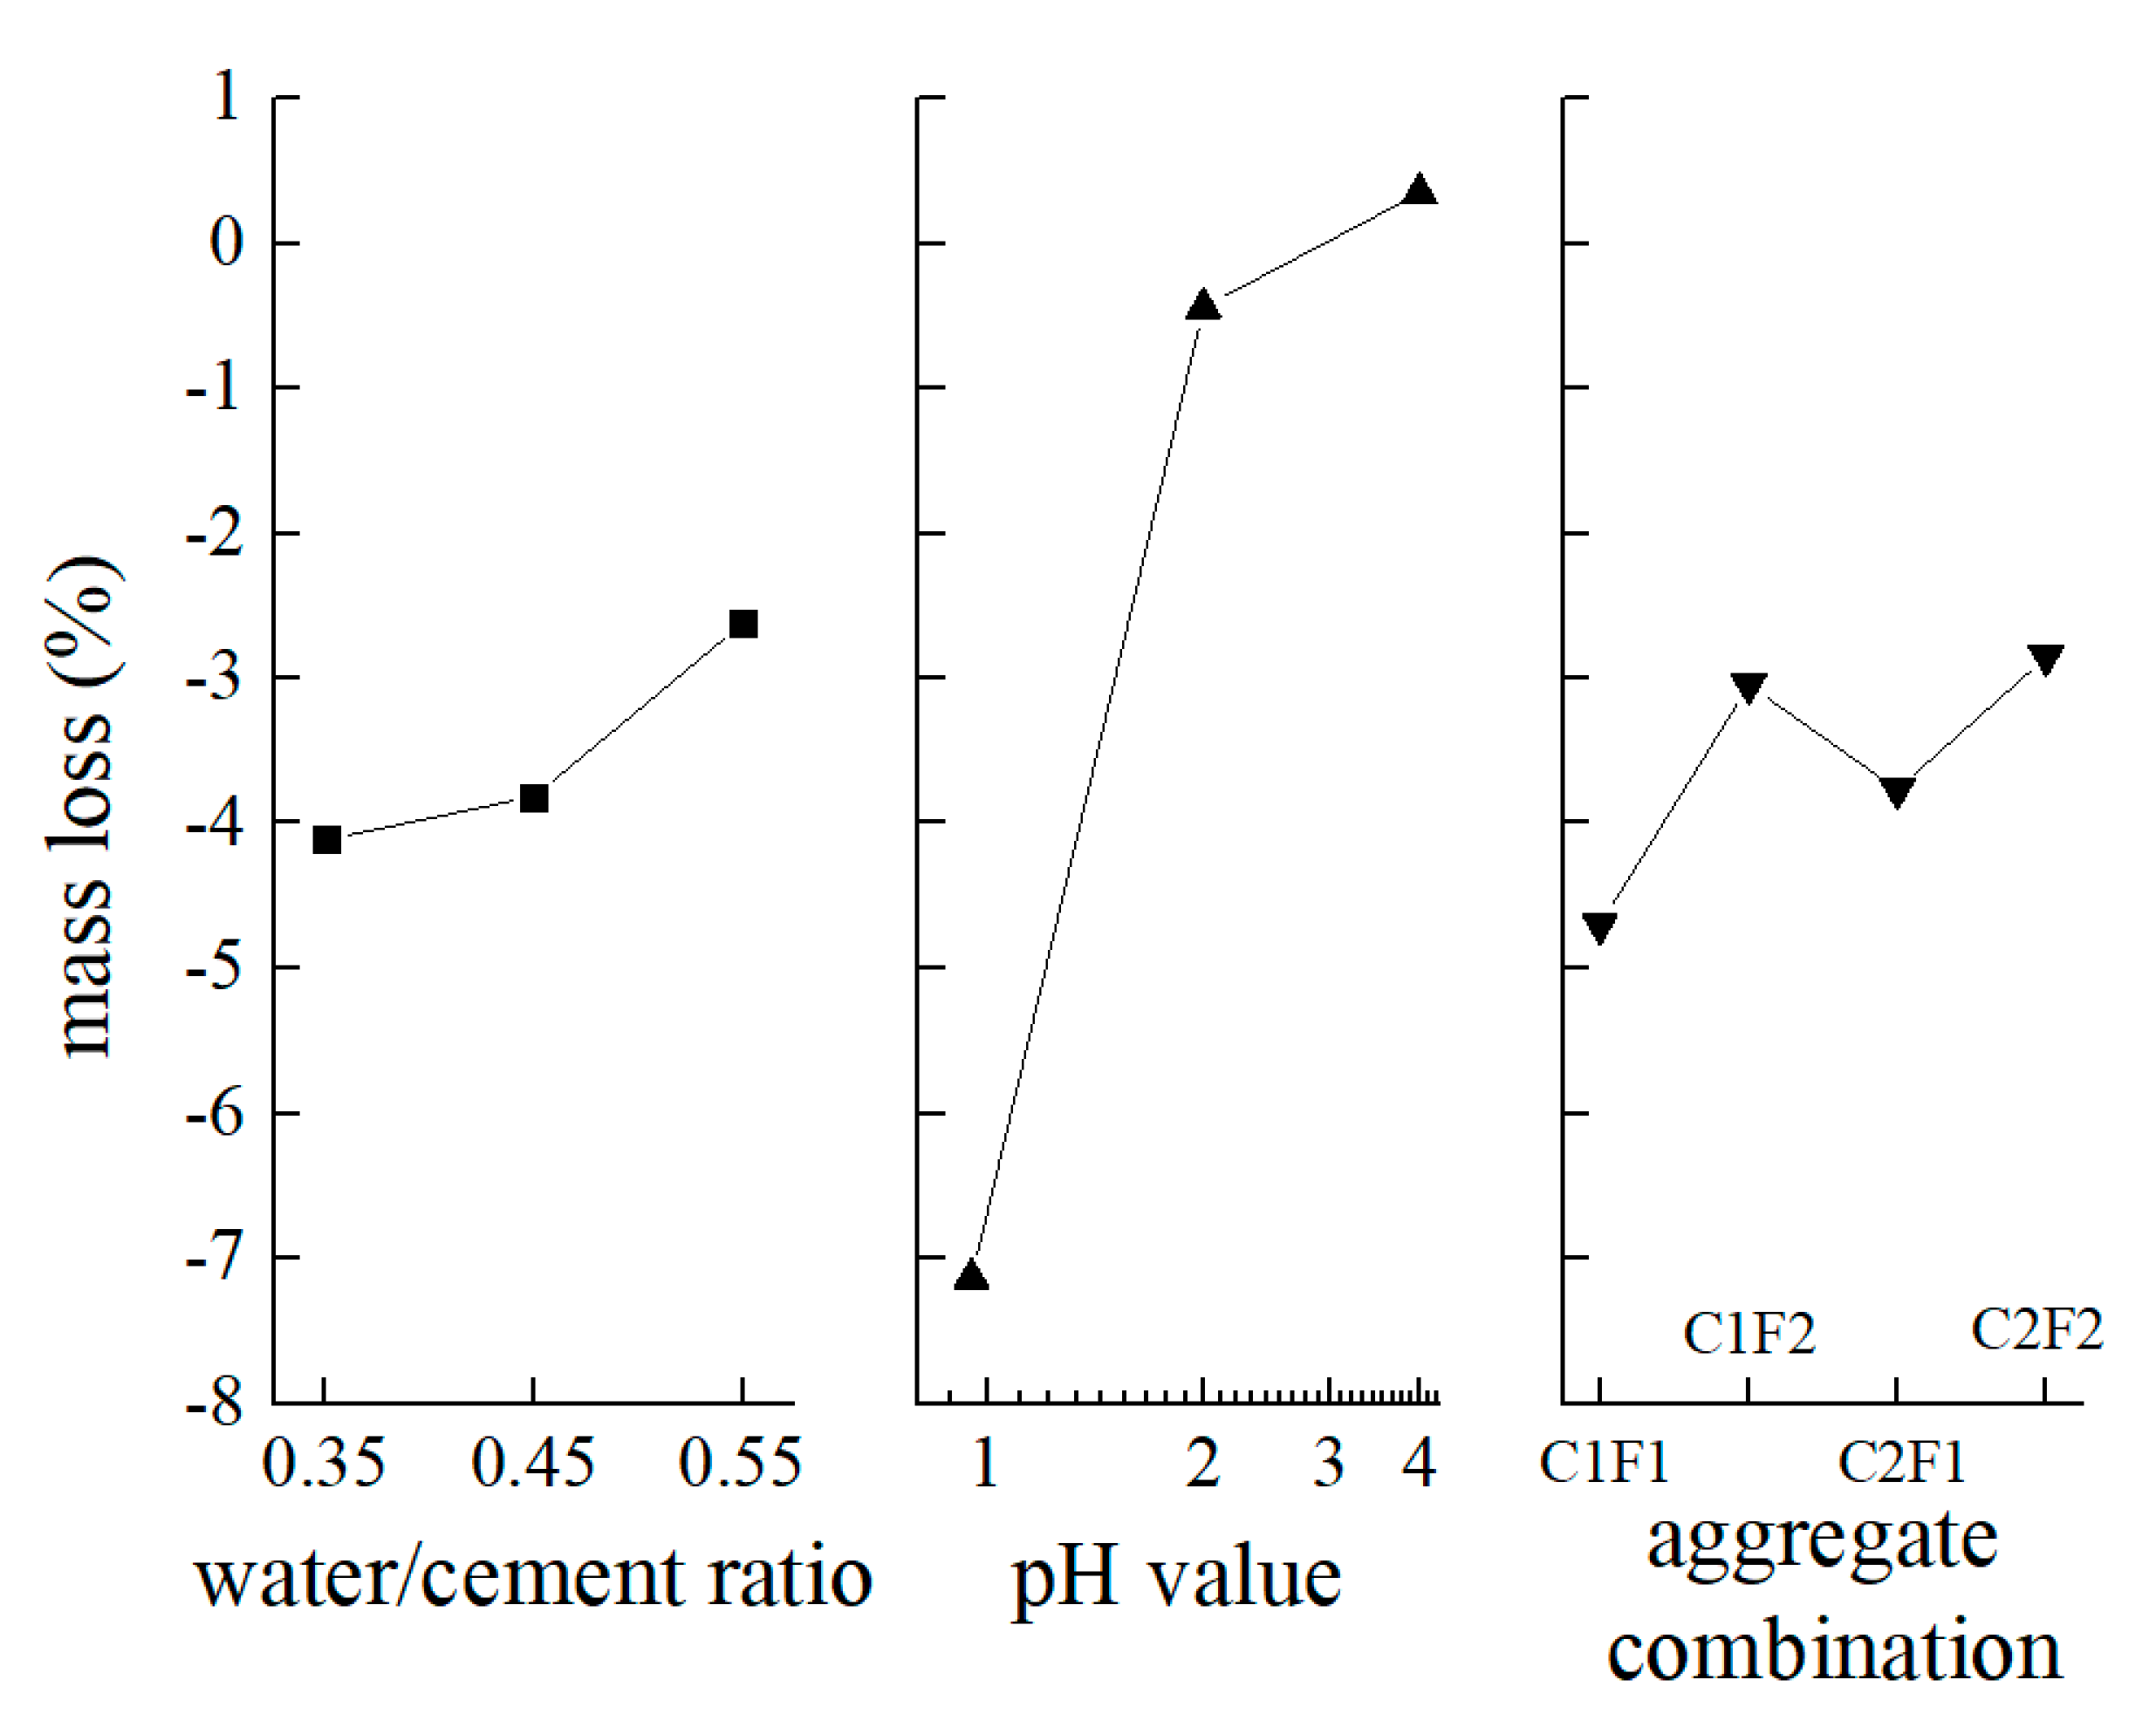
Trend charts of each factor for the mass loss and surface fractal dimension were, respectively, shown in Figure 10 and Figure 11 according to the principle of range analysis. It can be seen in Figure 10 that increasing the water/cement ratio could decrease the mass loss of the specimens, and with the decrease of the pH value of the sulfuric acid solution, the mass loss of the specimens would increase. The concrete specimen containing gravel and river sand (C1F1) had suffered the greatest mass loss, while the concrete specimen containing crushed marble sand had suffered less mass loss. As shown in Figure 11, the larger the water/cement ratio, the smaller the surface fractal dimension, and with the decrease of the pH value of the sulfuric acid solution, the surface fractal dimension of the specimens would increase. The concrete specimen containing gravel and river sand (C1F1) had the greatest surface fractal dimension, while the concrete specimen containing crushed marble sand had a smaller surface fractal dimension. This may be attributed to the higher water/cement ratio having a more open pore structure, which creates more places for a greater quantity of corrosion products to be formed and leads to an increase in mass and a decrease in surface fractal dimension. The lower the pH of the sulfuric acid solution, the larger the concentration of the aggressive ions, the faster the chemical reaction rate, the more dissolved cement slurries, the greater the mass loss. Because concrete specimens contain siliceous aggregates (gravel and river sand), only cement hydration products react with acid and the effect of the ability of neutralization during the acid attack would be very limited. Meanwhile, crushed marble stone and crushed marble sand are generally composed of calcium carbonate, which would react with acid. Therefore, the concrete specimens containing the marble stone and marble sand would have a greater ability to neutralize acid and lower the acid corrosion rate.
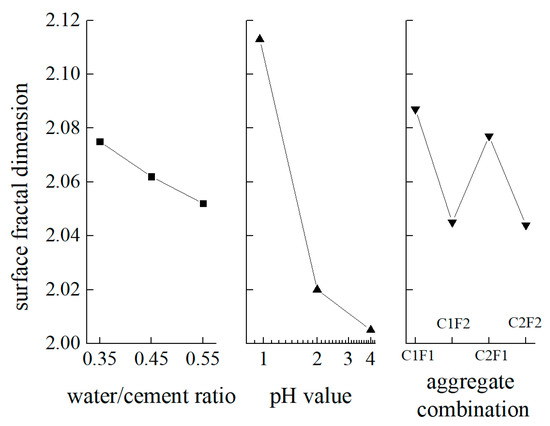
Figure 10.
Trend chart of each factor for the mass loss.
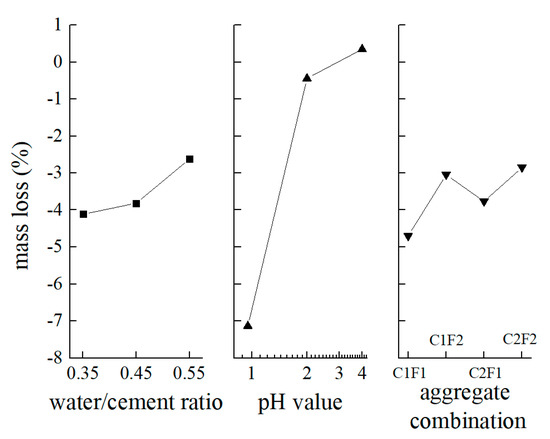
Figure 11.
Trend chart of each factor for surface fractal dimension.
4. Conclusions
In this paper, experimental results for the influence of these three factors on the durability evaluation indicators including mass loss and surface fractal dimension through orthogonal experiments were presented and discussed. From this investigation, the following conclusions can be drawn:
The pH value of the solution (factor B) had the greatest influence on the mass loss and the surface fractal dimension, while the water/cement ratio (factor A) had the least impact on mass loss and the surface fractal dimension. The dominant and secondary order of three factors on mass loss and surface fractal dimension of concrete subjected to sulfuric acid was the pH value of the solution > the chemical composition of the aggregate > the water/cement ratio.
An increase of the water/cement ratio could decrease the mass loss and the surface fractal dimension of the specimens, and with the decrease of the pH value of the sulfuric acid solution, the mass loss and the surface fractal dimension of the specimens would increase. The concrete specimen containing gravel and river sand (C1F1) suffered the greatest mass loss and the greatest surface fractal dimension, while the concrete specimen containing crushed marble sand suffered less mass loss and a smaller surface fractal dimension.
Author Contributions
J.X., H.J. and W.Q. mostly contributed to the design of the manuscript. X.L. and L.L. carried out data collection and processing. X.L. and Y.Z. were involved in immersing the specimens. J.X. revised the paper. All authors have read and agreed to the published version of the manuscript.
Funding
The authors appreciate the financial support provided by the National Natural Science Foundation of China with No. 51808133, and the National Natural Science Foundation of China with Grant No. 51778150, and the National Natural Science Foundation of China with Grant No. 51678430.
Institutional Review Board Statement
Studies not involving humans.
Informed Consent Statement
Studies not involving humans.
Data Availability Statement
The data that support the findings of this study are available from the corresponding author upon reasonable request.
Acknowledgments
The authors would like to thank all the three anonymous referees for their constructive comments and suggestions.
Conflicts of Interest
The authors declare no conflict of interest.
References
- Fu, C.; Fang, D.; Ye, H.; Huang, L.; Wang, J. Bond degradation of non-uniformly corroded steel rebars in concrete. Eng. Struct. 2021, 226, 111392. [Google Scholar] [CrossRef]
- Zhang, J.; Huang, J.; Fu, C.; Huang, L.; Ye, H. Characterization of steel reinforcement corrosion in concrete using 3D laser scanning techniques. Constr. Build. Mater. 2021, 270, 121402. [Google Scholar] [CrossRef]
- Lam, L.; Huang, L.; Xie, J.-H.; Chen, J.-F. Compressive behavior of ultra-high performance concrete confined with FRP. Compos. Struct. 2021, 274, 114321. [Google Scholar] [CrossRef]
- Wang, L.; He, T.; Zhou, Y.; Tang, S.; Tan, J.; Liu, Z.; Su, J. The influence of fiber type and length on the cracking resistance, durability and pore structure of face slab concrete. Constr. Build. Mater. 2021, 282, 122706. [Google Scholar] [CrossRef]
- Luo, Z.; Li, W.; Wang, K.; Castel, A.; Shah, S.P. Comparison on the properties of ITZs in fly ash-based geopolymer and Portland cement concretes with equivalent flowability. Cem. Concr. Res. 2021, 143, 106392. [Google Scholar] [CrossRef]
- Qu, F.; Li, W.; Dong, W.; Tam, V.W.; Yu, T. Durability deterioration of concrete under marine environment from material to structure: A critical review. J. Build. Eng. 2021, 35, 102074. [Google Scholar] [CrossRef]
- Wang, L.; Guo, F.; Lin, Y.; Yang, H.; Tang, S. Comparison between the effects of phosphorous slag and fly ash on the C-S-H structure, long-term hydration heat and volume deformation of cement-based materials. Constr. Build. Mater. 2020, 250, 118807. [Google Scholar] [CrossRef]
- Wang, L.; Jin, M.; Zhou, S.; Tang, S.; Lu, X. Investigation of microstructure of C-S-H and micro-mechanics of cement pastes under NH4NO3 dissolution by 29Si MAS NMR and microhardness. Measurement 2021, 185, 110019. [Google Scholar] [CrossRef]
- Zivica, V.; Bajza, A. Acidic attack of cement based materials—A review. Part 1. Principle of acidic attack. Constr. Build. Mater. 2001, 15, 331–340. [Google Scholar] [CrossRef]
- Taheri, S.; Delgado, G.P.; Agbaje, O.B.A.; Giri, P.; Clark, S.M. Corrosion Inhibitory Effects of Mullite in Concrete Exposed to Sulfuric Acid Attack. Corros. Mater. Degrad. 2020, 1, 14. [Google Scholar] [CrossRef]
- Mahdikhani, M.; Bamshad, O.; Shirvani, M.F. Mechanical properties and durability of concrete specimens containing nano silica in sulfuric acid rain condition. Constr. Build. Mater. 2018, 167, 929–935. [Google Scholar] [CrossRef]
- Li, X.; Lin, X.; Lin, K.; Ji, T. Study on the degradation mechanism of sulphoaluminate cement sea sand concrete eroded by biological sulfuric acid. Constr. Build. Mater. 2017, 157, 331–336. [Google Scholar] [CrossRef]
- Mahmoodian, M.; Alani, A.M. Effect of Temperature and Acidity of Sulfuric Acid on Concrete Properties. J. Mater. Civ. Eng. 2017, 29, 04017154. [Google Scholar] [CrossRef] [Green Version]
- Fan, Y.; Zhang, S.; Wang, Q.; Shah, S.P. The effects of nano-calcined kaolinite clay on cement mortar exposed to acid deposits. Constr. Build. Mater. 2016, 102, 486–495. [Google Scholar] [CrossRef]
- Fan, Y.; Hu, Z.; Zhang, Y.; Liu, J. Deterioration of compressive property of concrete under simulated acid rain environment. Constr. Build. Mater. 2010, 24, 1975–1983. [Google Scholar] [CrossRef]
- Fattuhi, N.; Hughes, B. The performance of cement paste and concrete subjected to sulphuric acid attack. Cem. Concr. Res. 1988, 18, 545–553. [Google Scholar] [CrossRef]
- Tang, S.; Yao, Y.; Andrade, C.; Li, Z. Recent durability studies on concrete structure. Cem. Concr. Res. 2015, 78, 143–154. [Google Scholar] [CrossRef]
- Kawai, K.; Yamaji, S.; Shinmi, T. Concrete deterioration caused by sulfuric acid attack. In Proceedings of the 10th DBMC International Conference On Durability of Building Materials and Component, Lyon, France, 17–20 April 2005. [Google Scholar]
- Chang, Z.-T.; Song, X.-J.; Munn, R.; Marosszeky, M. Using limestone aggregates and different cements for enhancing resistance of concrete to sulphuric acid attack. Cem. Concr. Res. 2005, 35, 1486–1494. [Google Scholar] [CrossRef]
- Hughes, B.P.; Guest, J.E. Limestone and siliceous aggregate concretes subjected to sulphuric acid attack. Mag. Concr. Res. 1978, 30, 11–18. [Google Scholar] [CrossRef]
- De Belie, N.; Monteny, J.; Beeldens, A.; Vincke, E.; Van Gemert, D.; Verstraete, W. Experimental research and prediction of the effect of chemical and biogenic sulfuric acid on different types of commercially produced concrete sewer pipes. Cem. Concr. Res. 2004, 34, 2223–2236. [Google Scholar] [CrossRef]
- Gutierrez-Padilla, M.D.; Bielefeldt, A.; Ovtchinnikov, S.; Pellegrino, J.; Silverstein, J. Simple scanner-based image analysis for corrosion testing: Concrete application. J. Mater. Process. Technol. 2009, 209, 51–57. [Google Scholar] [CrossRef]
- Bassuoni, M.T.; Nehdi, M.L. Resistance of self-consolidating concrete to sulfuric acid attack with consecutive pH reduction. Cem. Concr. Res. 2007, 37, 1070–1084. [Google Scholar] [CrossRef]
- Hasan, S.; Setunge, S.; Law, D.W.; Molyneaux, T.C.K. Predicting life expectancy of concrete septic tanks exposed to sulfuric acid attack. Mag. Concr. Res. 2013, 65, 793–801. [Google Scholar] [CrossRef]
- Bertron, A.; Duchesne, J.; Escadeillas, G. Accelerated tests of hardened cement pastes alteration by organic acids: Analysis of the pH effect. Cem. Concr. Res. 2005, 35, 155–166. [Google Scholar] [CrossRef]
- De Belie, N.; Verschoore, R.; Van Nieuwenburg, D. Resistance of concrete with limestone sand or polymer additions to feed acids. Trans. ASAE 1998, 41, 227–233. [Google Scholar] [CrossRef]
- Gruyaert, E.; Heede, P.V.D.; Maes, M.; De Belie, N. Investigation of the influence of blast-furnace slag on the resistance of concrete against organic acid or sulphate attack by means of accelerated degradation tests. Cem. Concr. Res. 2012, 42, 173–185. [Google Scholar] [CrossRef]
- Xiao, J.; Qu, W.; Jiang, H.; Dong, W. Three-Dimensional Fractal Characterization of Concrete Surface Subjected to Sulfuric Acid Attacks. J. Nondestruct. Eval. 2020, 39, 57. [Google Scholar] [CrossRef]
- Limbachiya, M.C.; Marrocchino, E.; Koulouris, A. Chemical–mineralogical characterisation of coarse recycled concrete aggregate. Waste Manag. 2007, 27, 201–208. [Google Scholar] [CrossRef]
- Ning, Y. Research on Application of Diabase-Fine-Sand Concrete in Expressway Engineering. Master’s Thesis, Wuhan University of Technology, Wuhan, China, 2003. [Google Scholar]
- Li, X.; Hao, J. Orthogonal test design for optimization of synthesis of super early strength anchoring material. Constr. Build. Mater. 2018, 181, 42–48. [Google Scholar] [CrossRef]
- Liang, C.; Zhang, W. Fractal characteristic of pits distribution on 304 stainless steel corroded surface and its application in corrosion diagnosis. J. Wuhan Univ. Technol. Sci. Ed. 2007, 22, 389–393. [Google Scholar] [CrossRef]
- Wang, L.; Luo, R.Y.; Zhang, W.; Jin, M.M.; Tang, S.W. Effects of Fineness and Content of Phosphorus Slag on Cement Hydration, Permeability, Pore Structure and Fractal Dimension of Concrete. Fractals 2021, 29, 2140004. [Google Scholar] [CrossRef]
- Wang, L.; Guo, F.X.; Yang, H.M.; Wang, Y.; Tang, S.W. Comparison of FLY ASH, PVA Fiber, MgO and Shrinkage-reducing Admixture on the Frost Resistance of Face Slab Concrete via Pore Structural and Fractal Analysis. Fractals 2021, 29, 2140002. [Google Scholar] [CrossRef]
- Wang, L.; Jin, M.M.; Guo, F.X.; Wang, Y.; Tang, S.W. Pore Structural and Fractal Analysis of the Influence of FLY ASH and Silica Fume on the Mechanical Property and Abrasion Resistance of Concrete. Fractals 2021, 29, 2140003. [Google Scholar] [CrossRef]
- Wang, L.; Jin, M.; Wu, Y.; Zhou, Y.; Tang, S. Hydration, shrinkage, pore structure and fractal dimension of silica fume modified low heat Portland cement-based materials. Constr. Build. Mater. 2021, 272, 121952. [Google Scholar] [CrossRef]
- Tang, S.; Wang, Y.; Geng, Z.; Xu, X.; Yu, W.; Chen, J. Structure, Fractality, Mechanics and Durability of Calcium Silicate Hydrates. Fractal Fract. 2021, 5, 47. [Google Scholar] [CrossRef]
- Zhou, H.; Xie, H. Direct Estimation of the Fractal Dimensions of a Fracture Surface of Rock. Surf. Rev. Lett. 2003, 10, 751–762. [Google Scholar] [CrossRef]


Publisher’s Note: MDPI stays neutral with regard to jurisdictional claims in published maps and institutional affiliations. |
© 2021 by the authors. Licensee MDPI, Basel, Switzerland. This article is an open access article distributed under the terms and conditions of the Creative Commons Attribution (CC BY) license (https://creativecommons.org/licenses/by/4.0/).