


Analysis of the Charge Density Variation Caused by the Physical Properties of the Electrodes of Lithium-Ion Batteries


Abstract
:1. Introduction
- The monitoring method for the charge density is a non-destructive testing method. The amount of data collected during the instantaneous discharge is small, and the battery does not need to be fully discharged. The proposed method is a fast and effective monitoring method, which is of great significance for battery performance detection in actual operation.
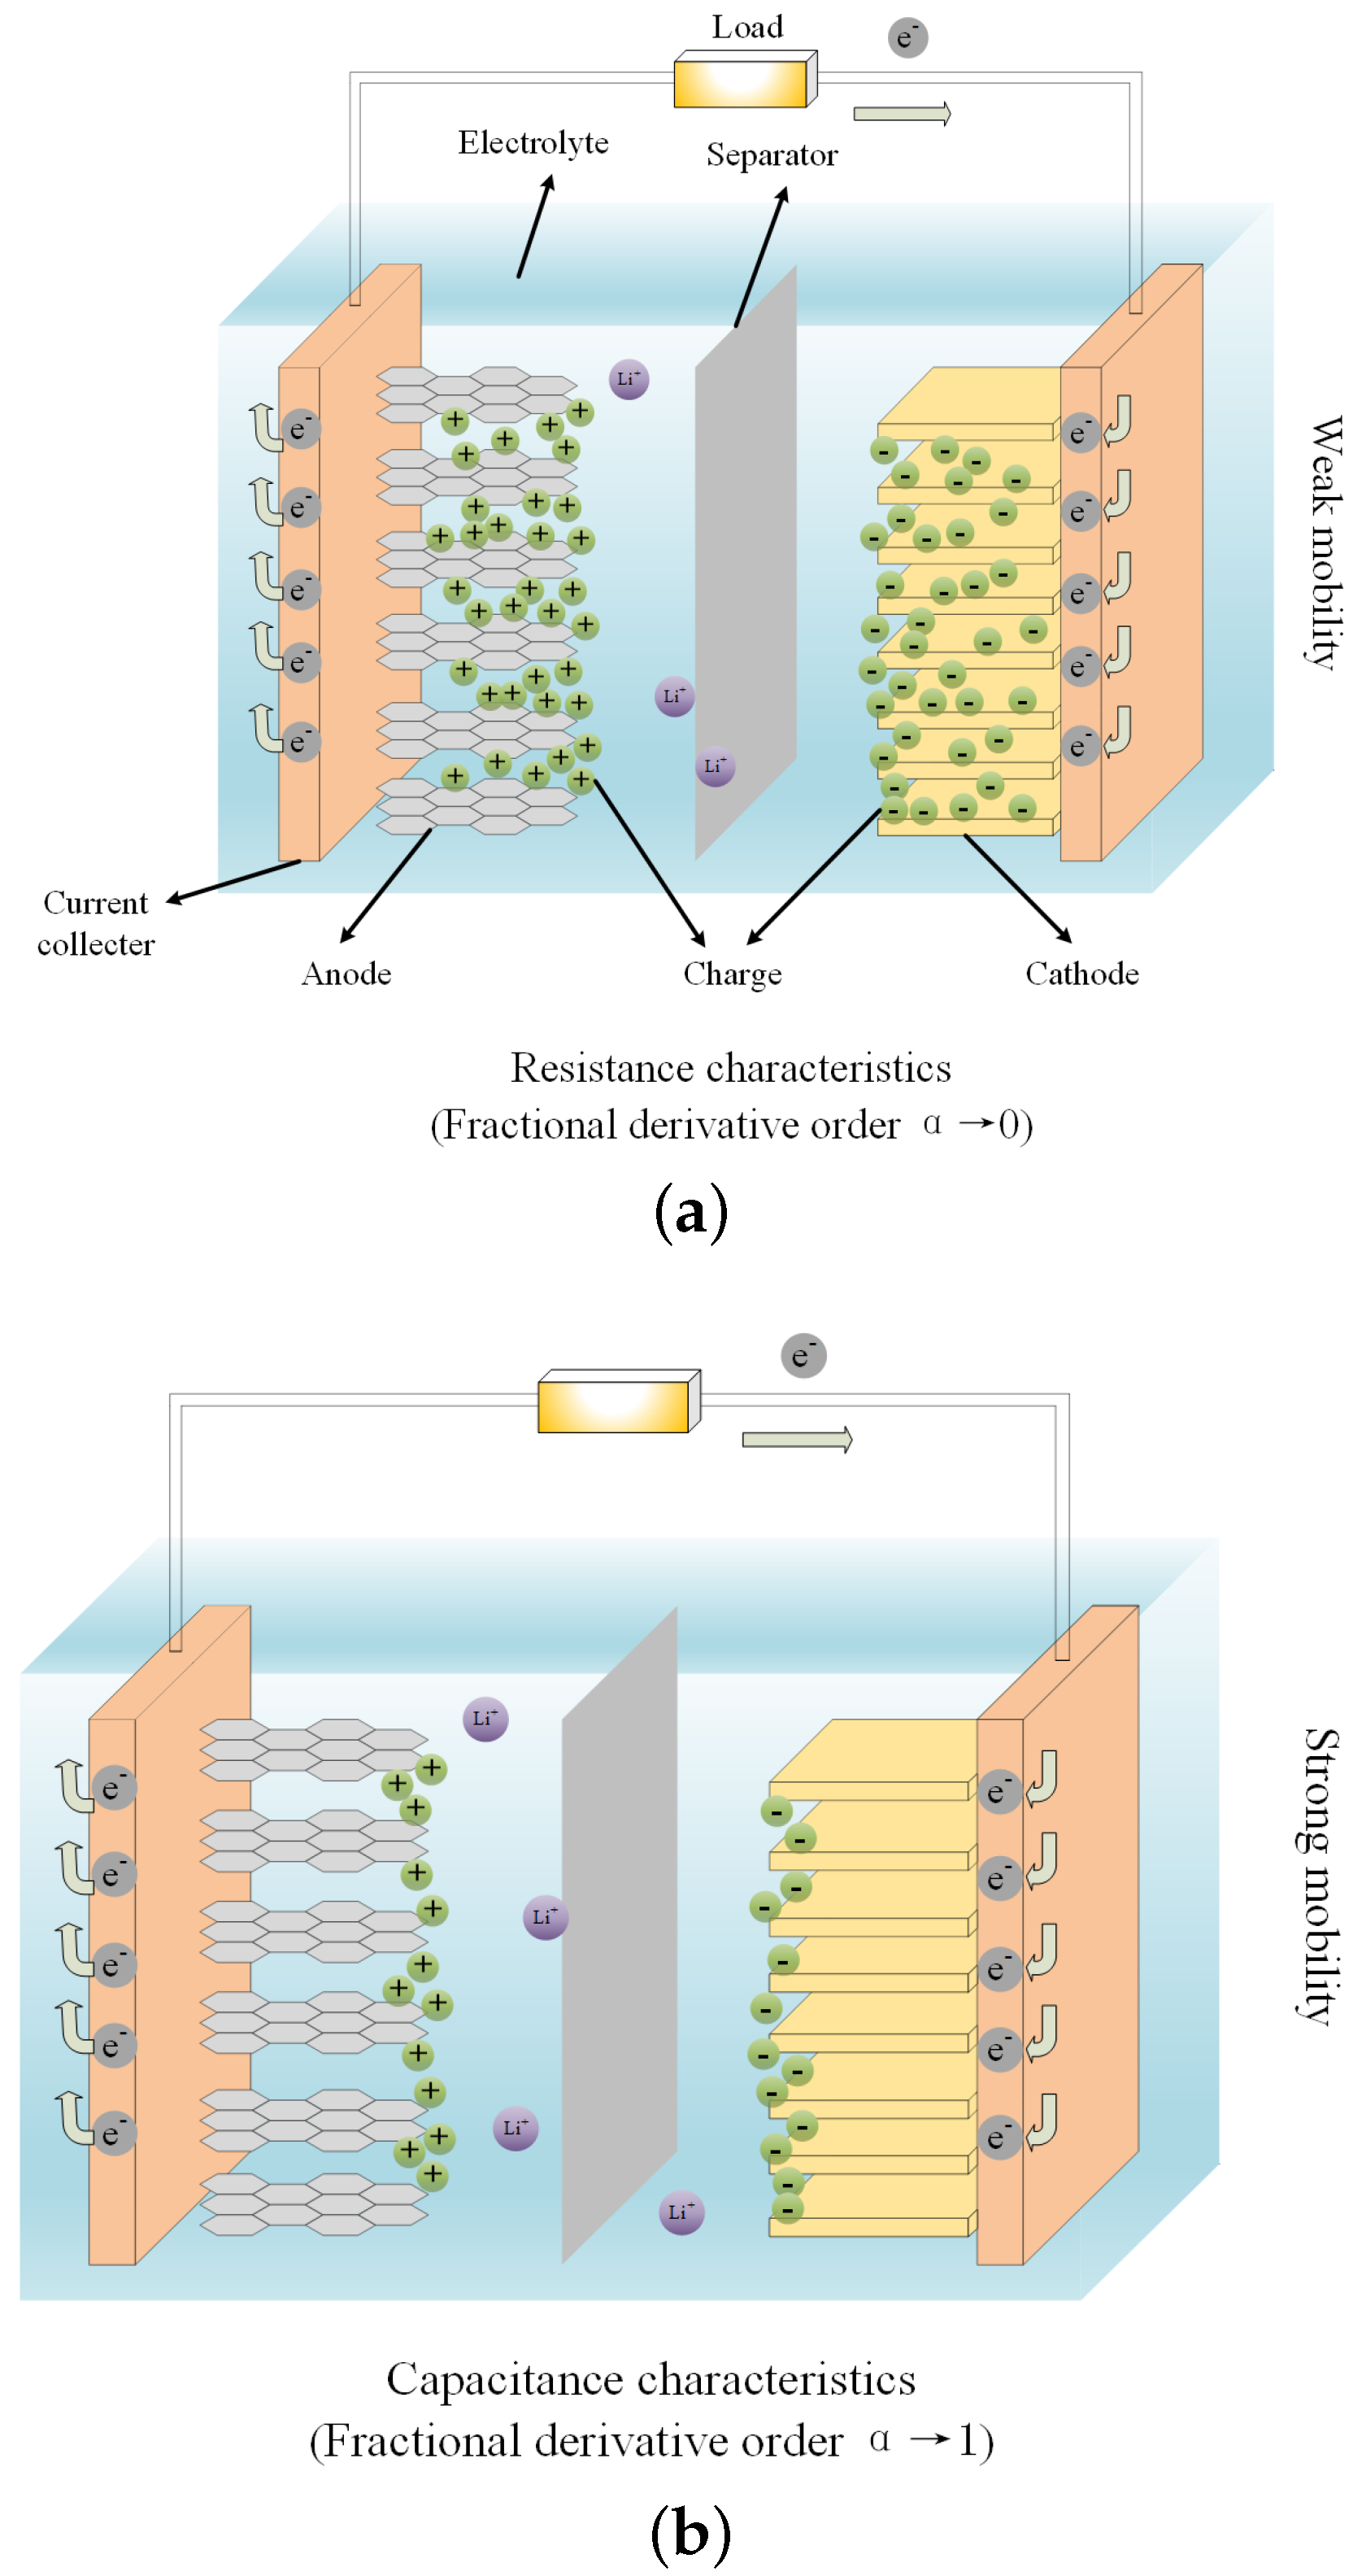
- The fractional derivative model is used to characterize the fractal distribution of the charges, and the FDO is used to reveal changes in the charge density.
- This paper explains the capacity recovery phenomenon from the perspective of the physical properties of electrodes.
- The study on the charge density variation of the electrode provides guidance for the detection of electrode performance and the design of electrode microstructure.
2. Charge Distribution on the Porous Electrodes
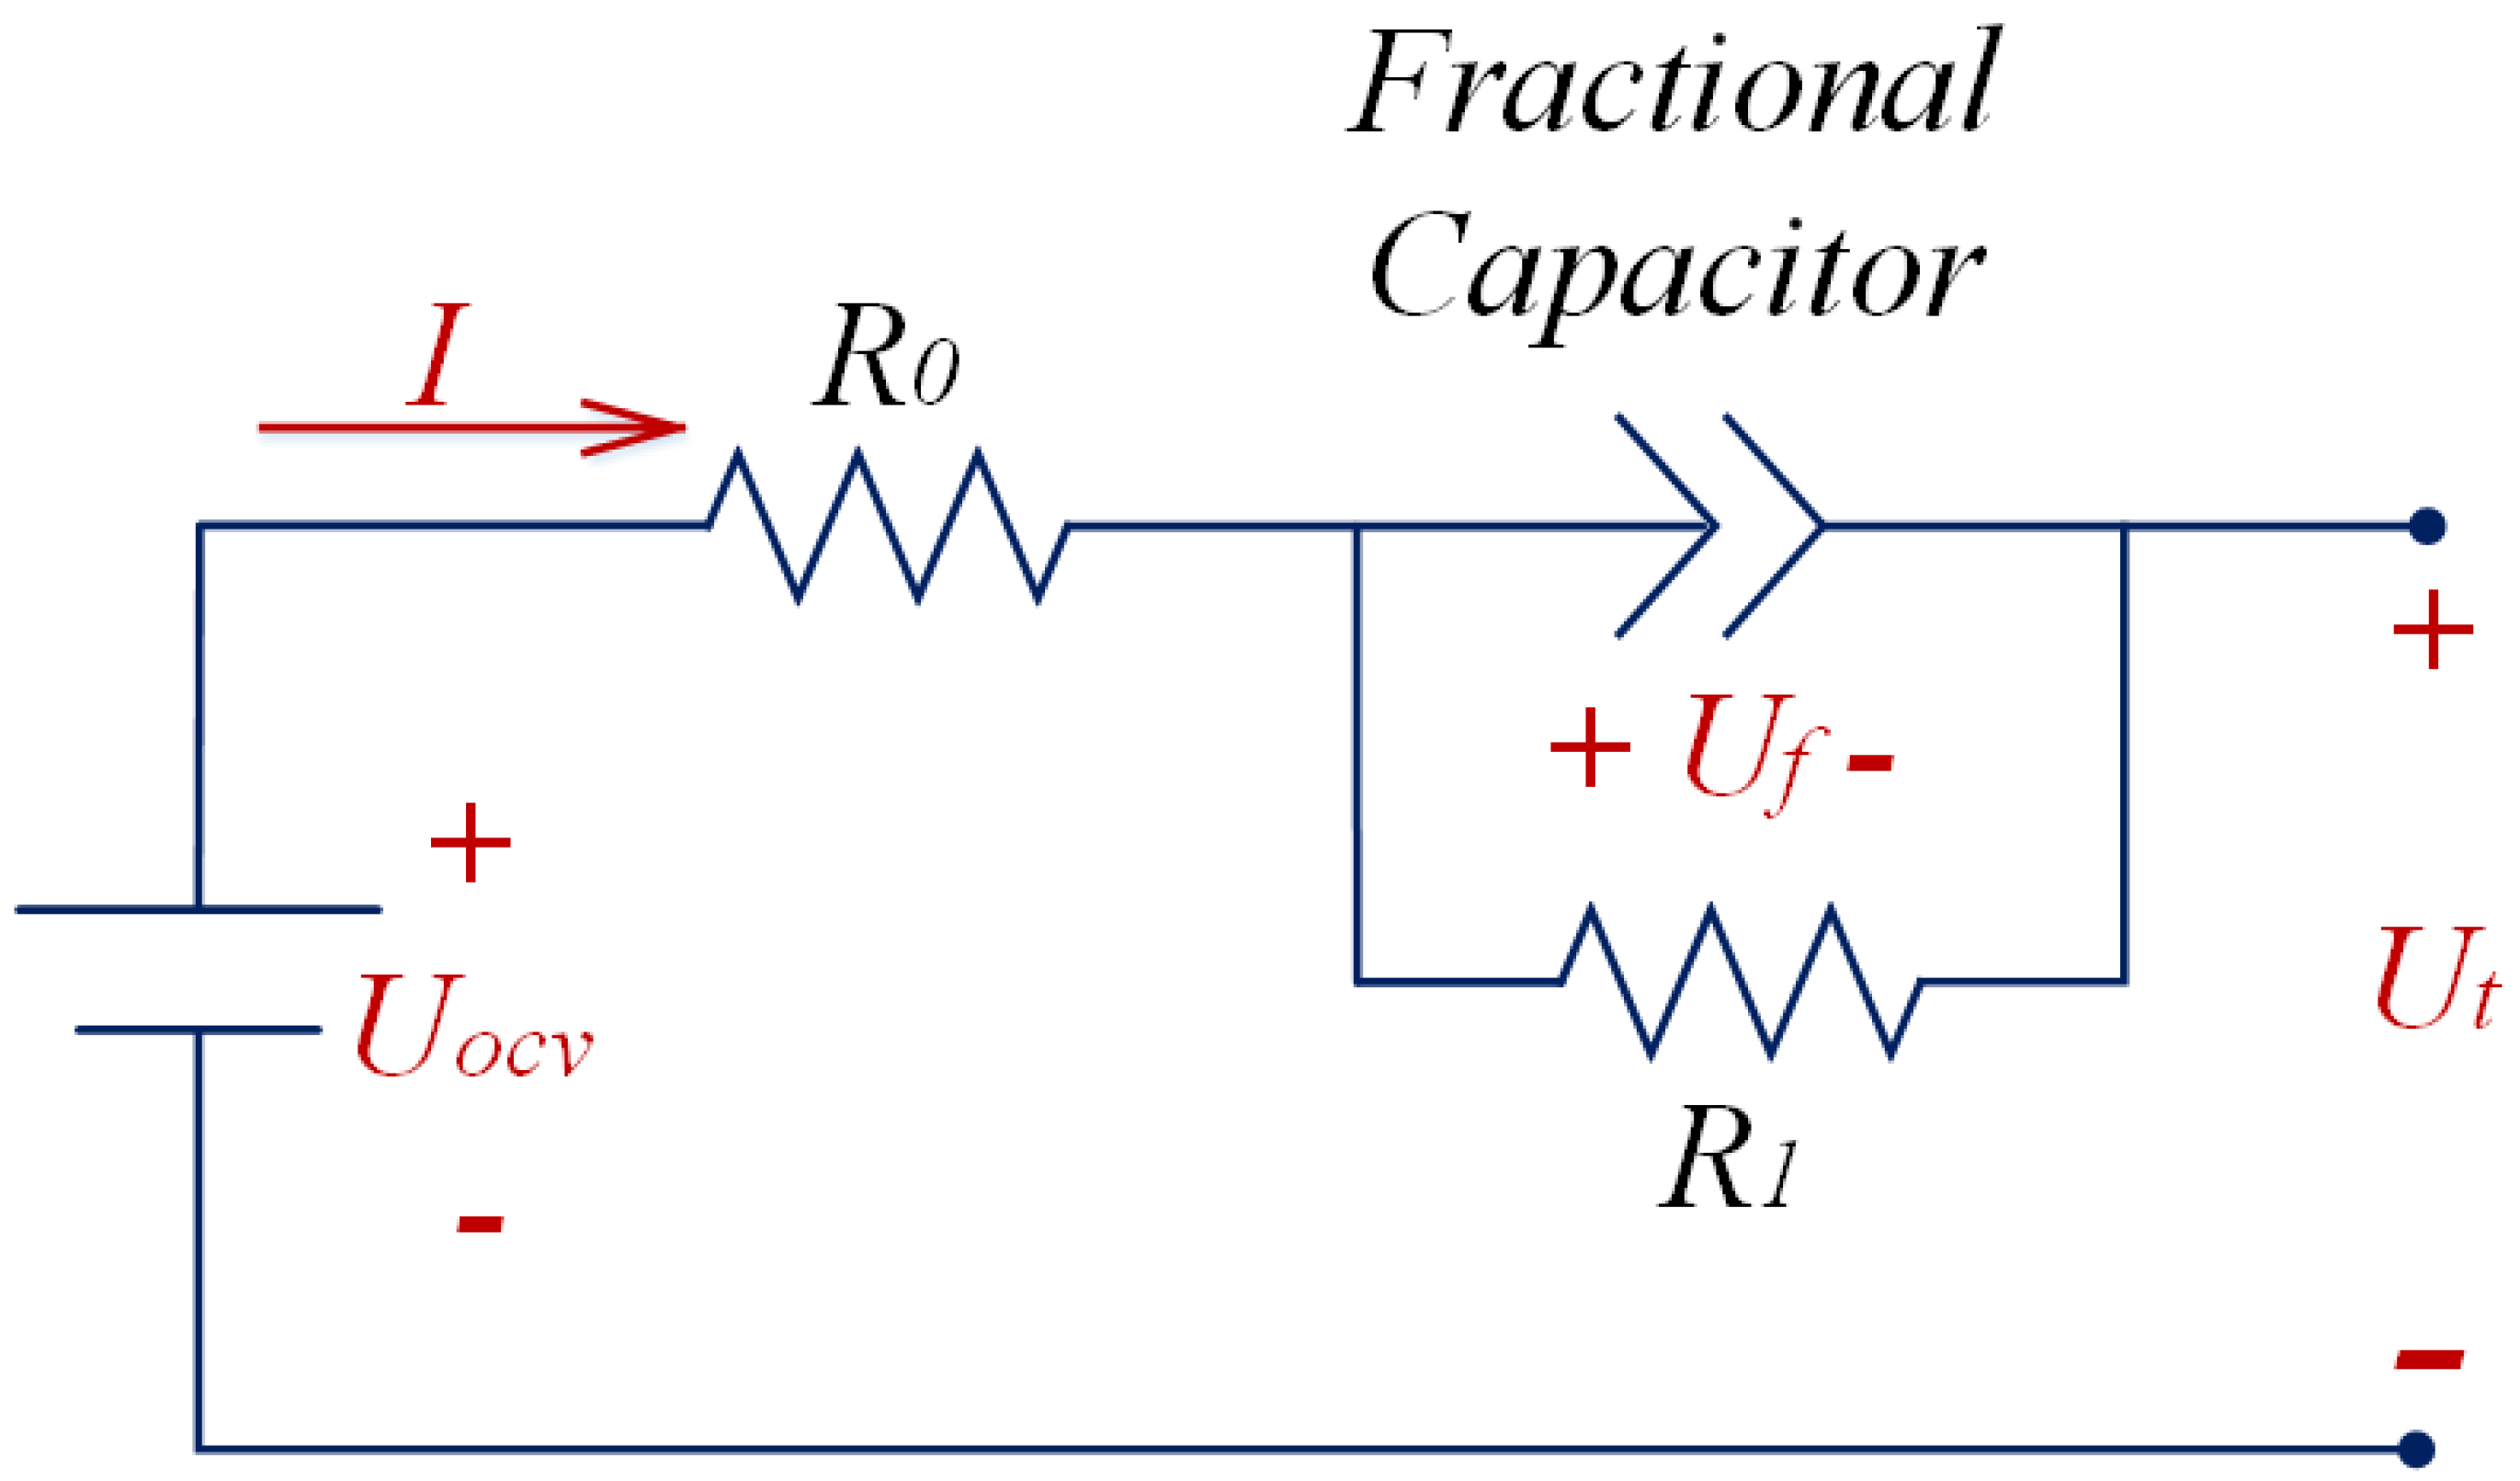
3. Battery Modeling
4. Experiment
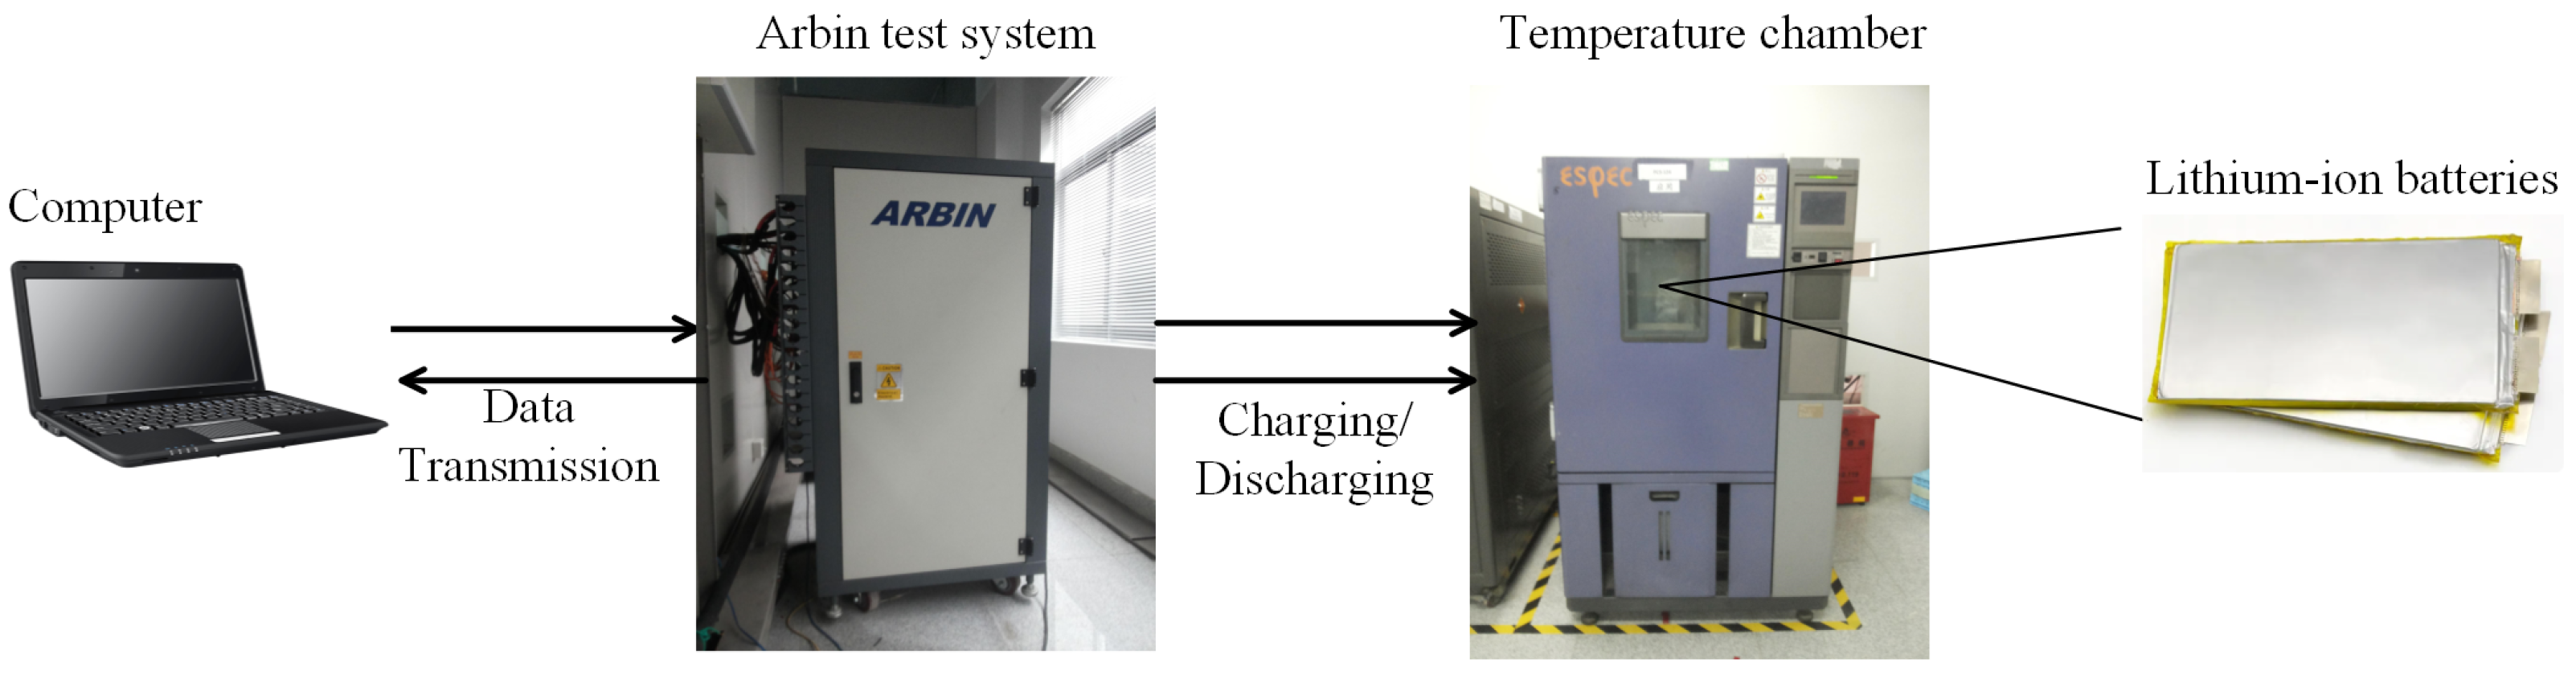
4.1. Test Platform
4.2. Battery SOC Test
- 1.
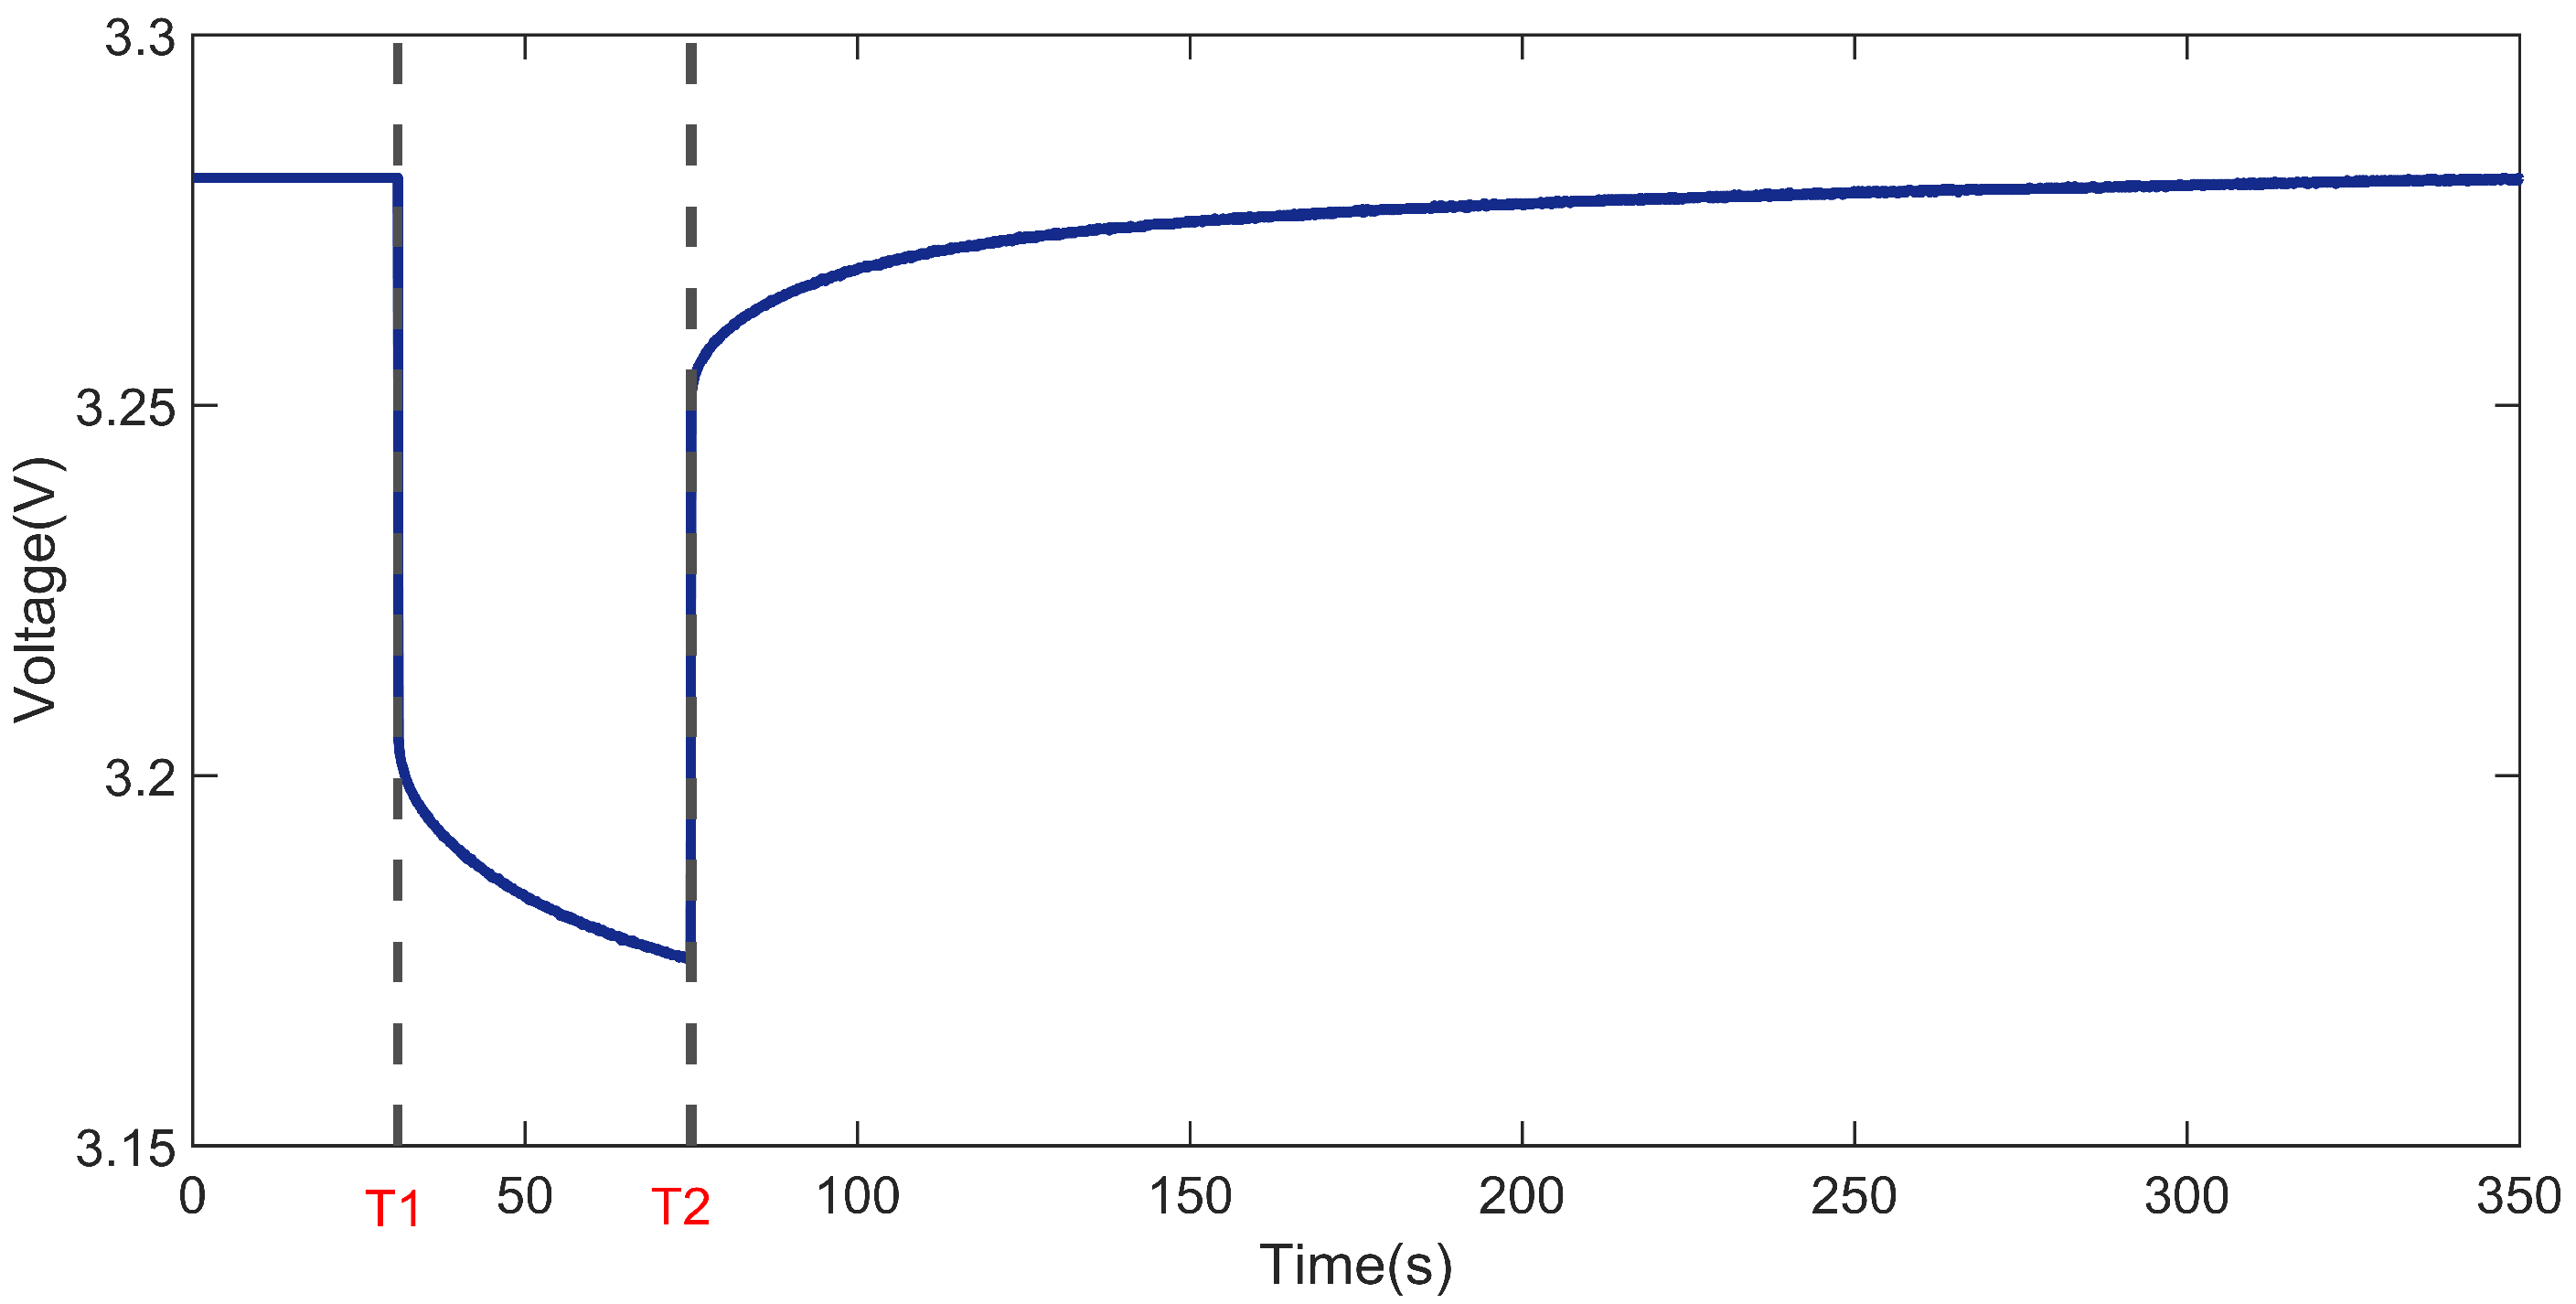
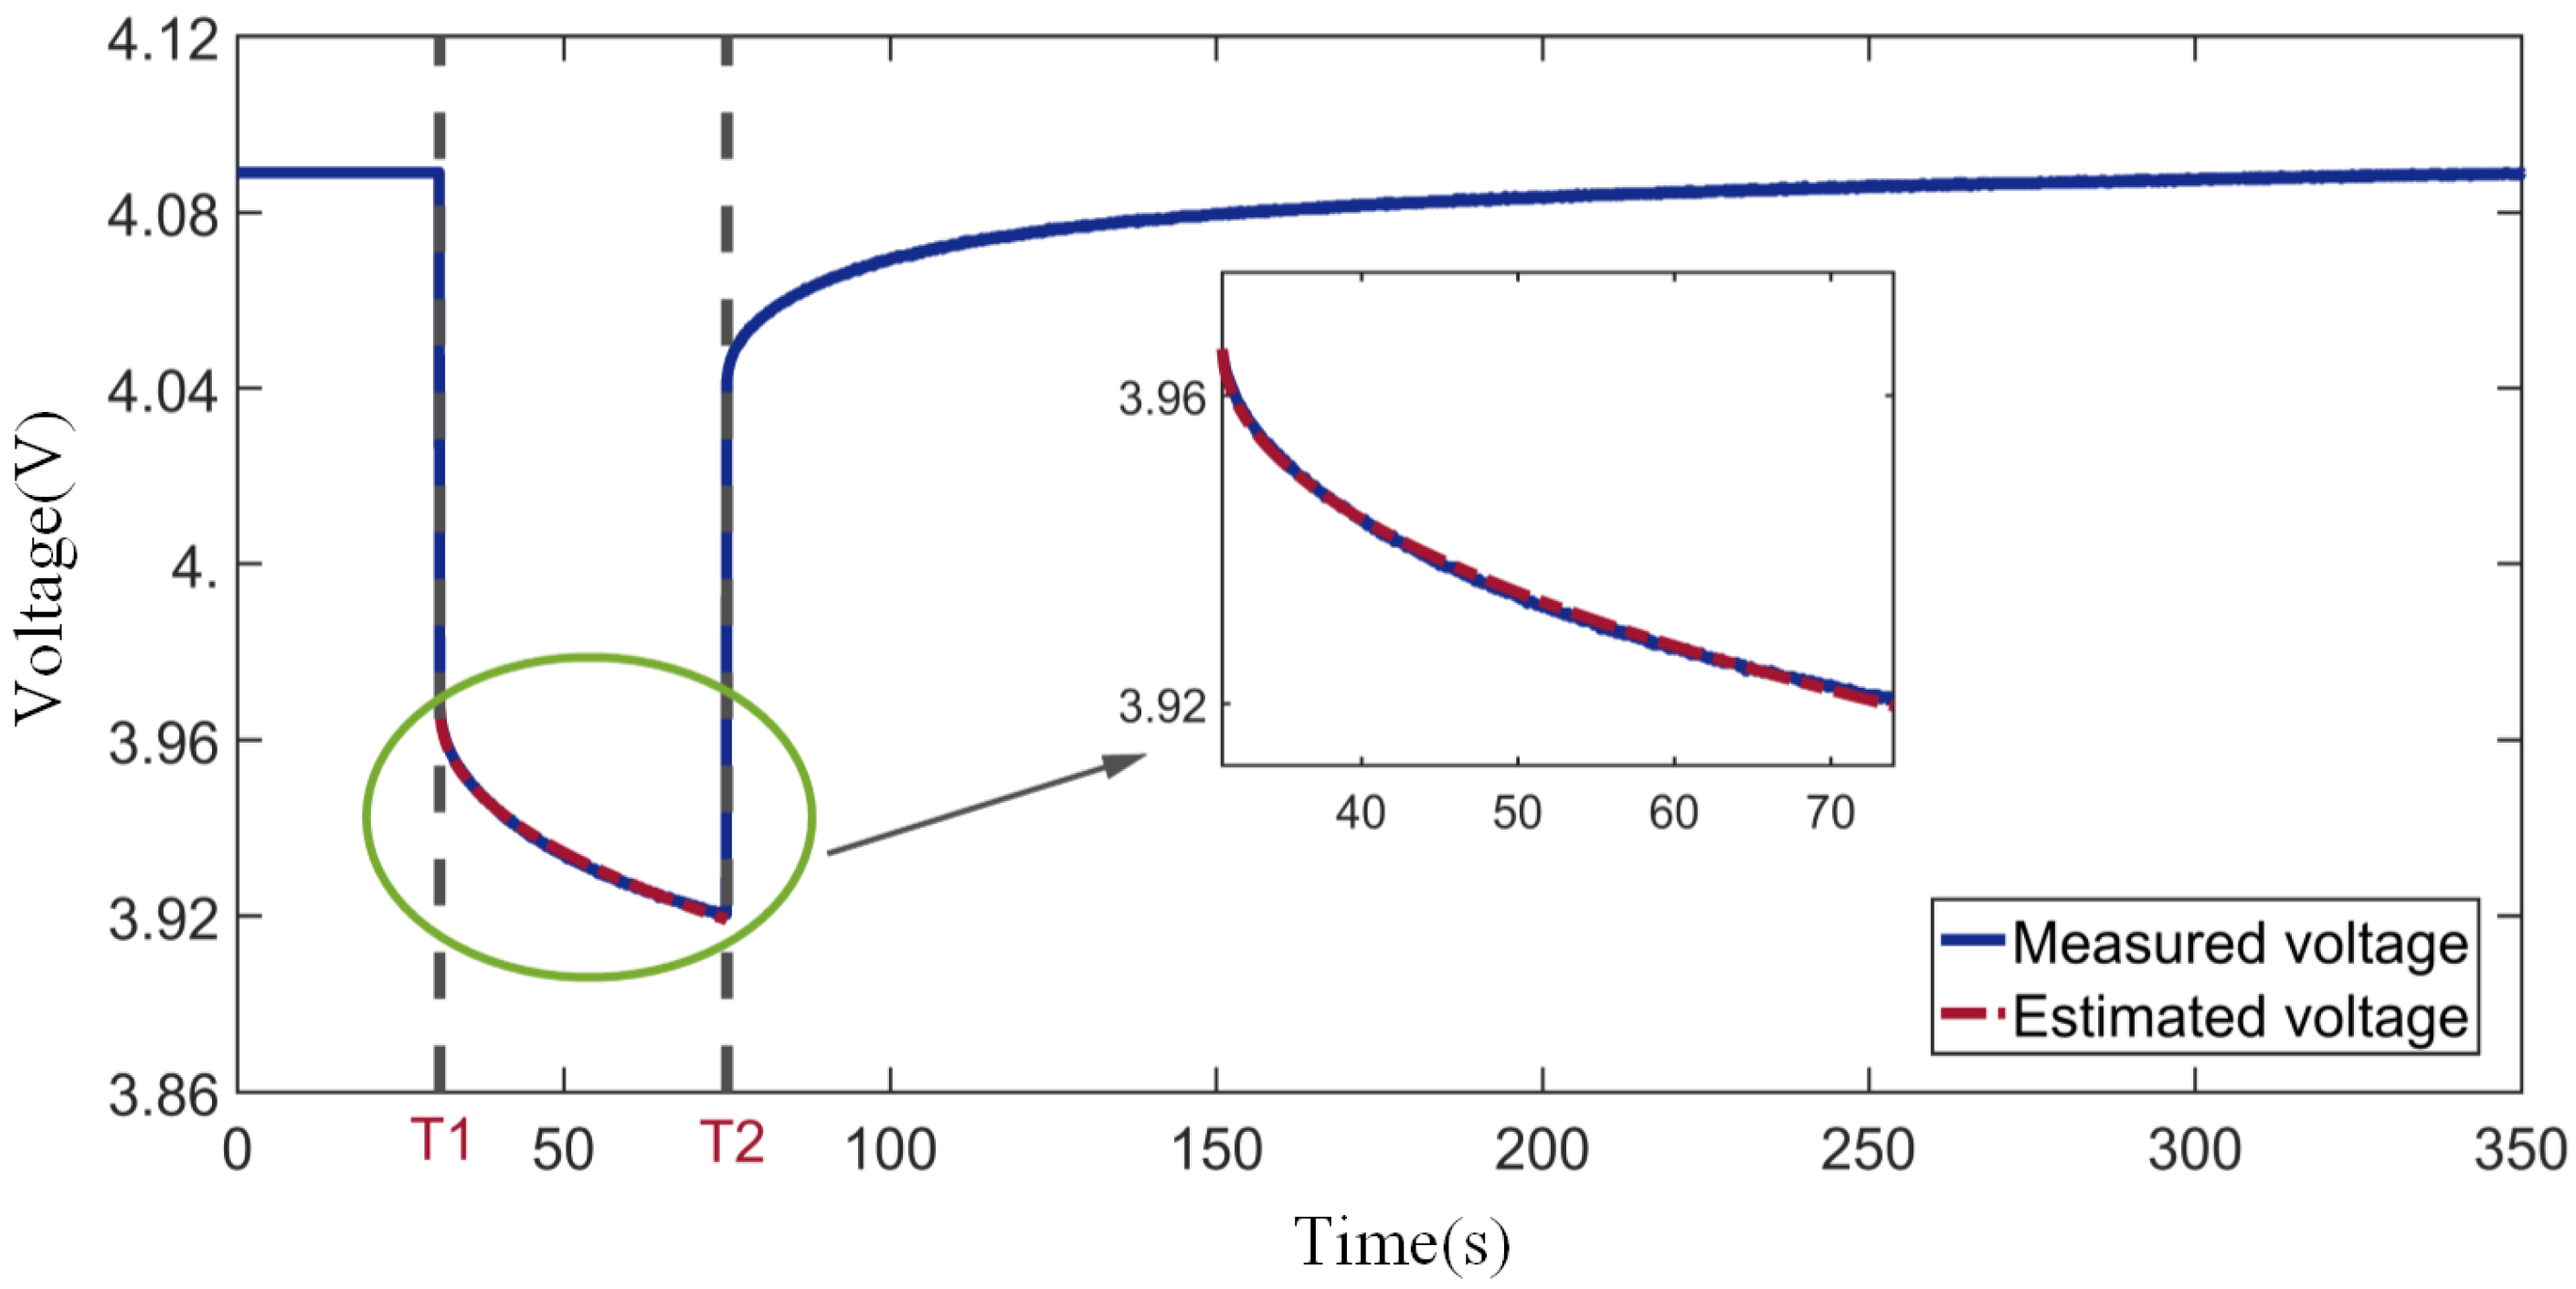
- The batteries are discharged with an initial instantaneous load current of 1 C for a duration of 45 s. The current is loaded from time T1 (31st s) to time T2 (75th s).
- 2.
- The applied load is cut off, and the batteries are left to stand for 5 min.
- 3.
- The batteries are discharged by a constant current of 0.5 C until the battery SOC drops by 5%.
- 4.
- The applied load is cut off, and the batteries are left to stand for 35 min.
- 5.
- Repeat steps 1, 2, 3, and 4 until the battery SOC is 0%, at which point the SOC test of the batteries is ended.
4.3. Aging Test
- 1.
- The batteries are charged at a constant current of 0.5 C until the voltage reaches the charge cut-off voltage. Then, the batteries are continuously charged in CV mode until the charging current drops to 0.5 A. Subsequently, the batteries are allowed to stand for 1 h. The charging capacity of the battery is recorded.
- 2.
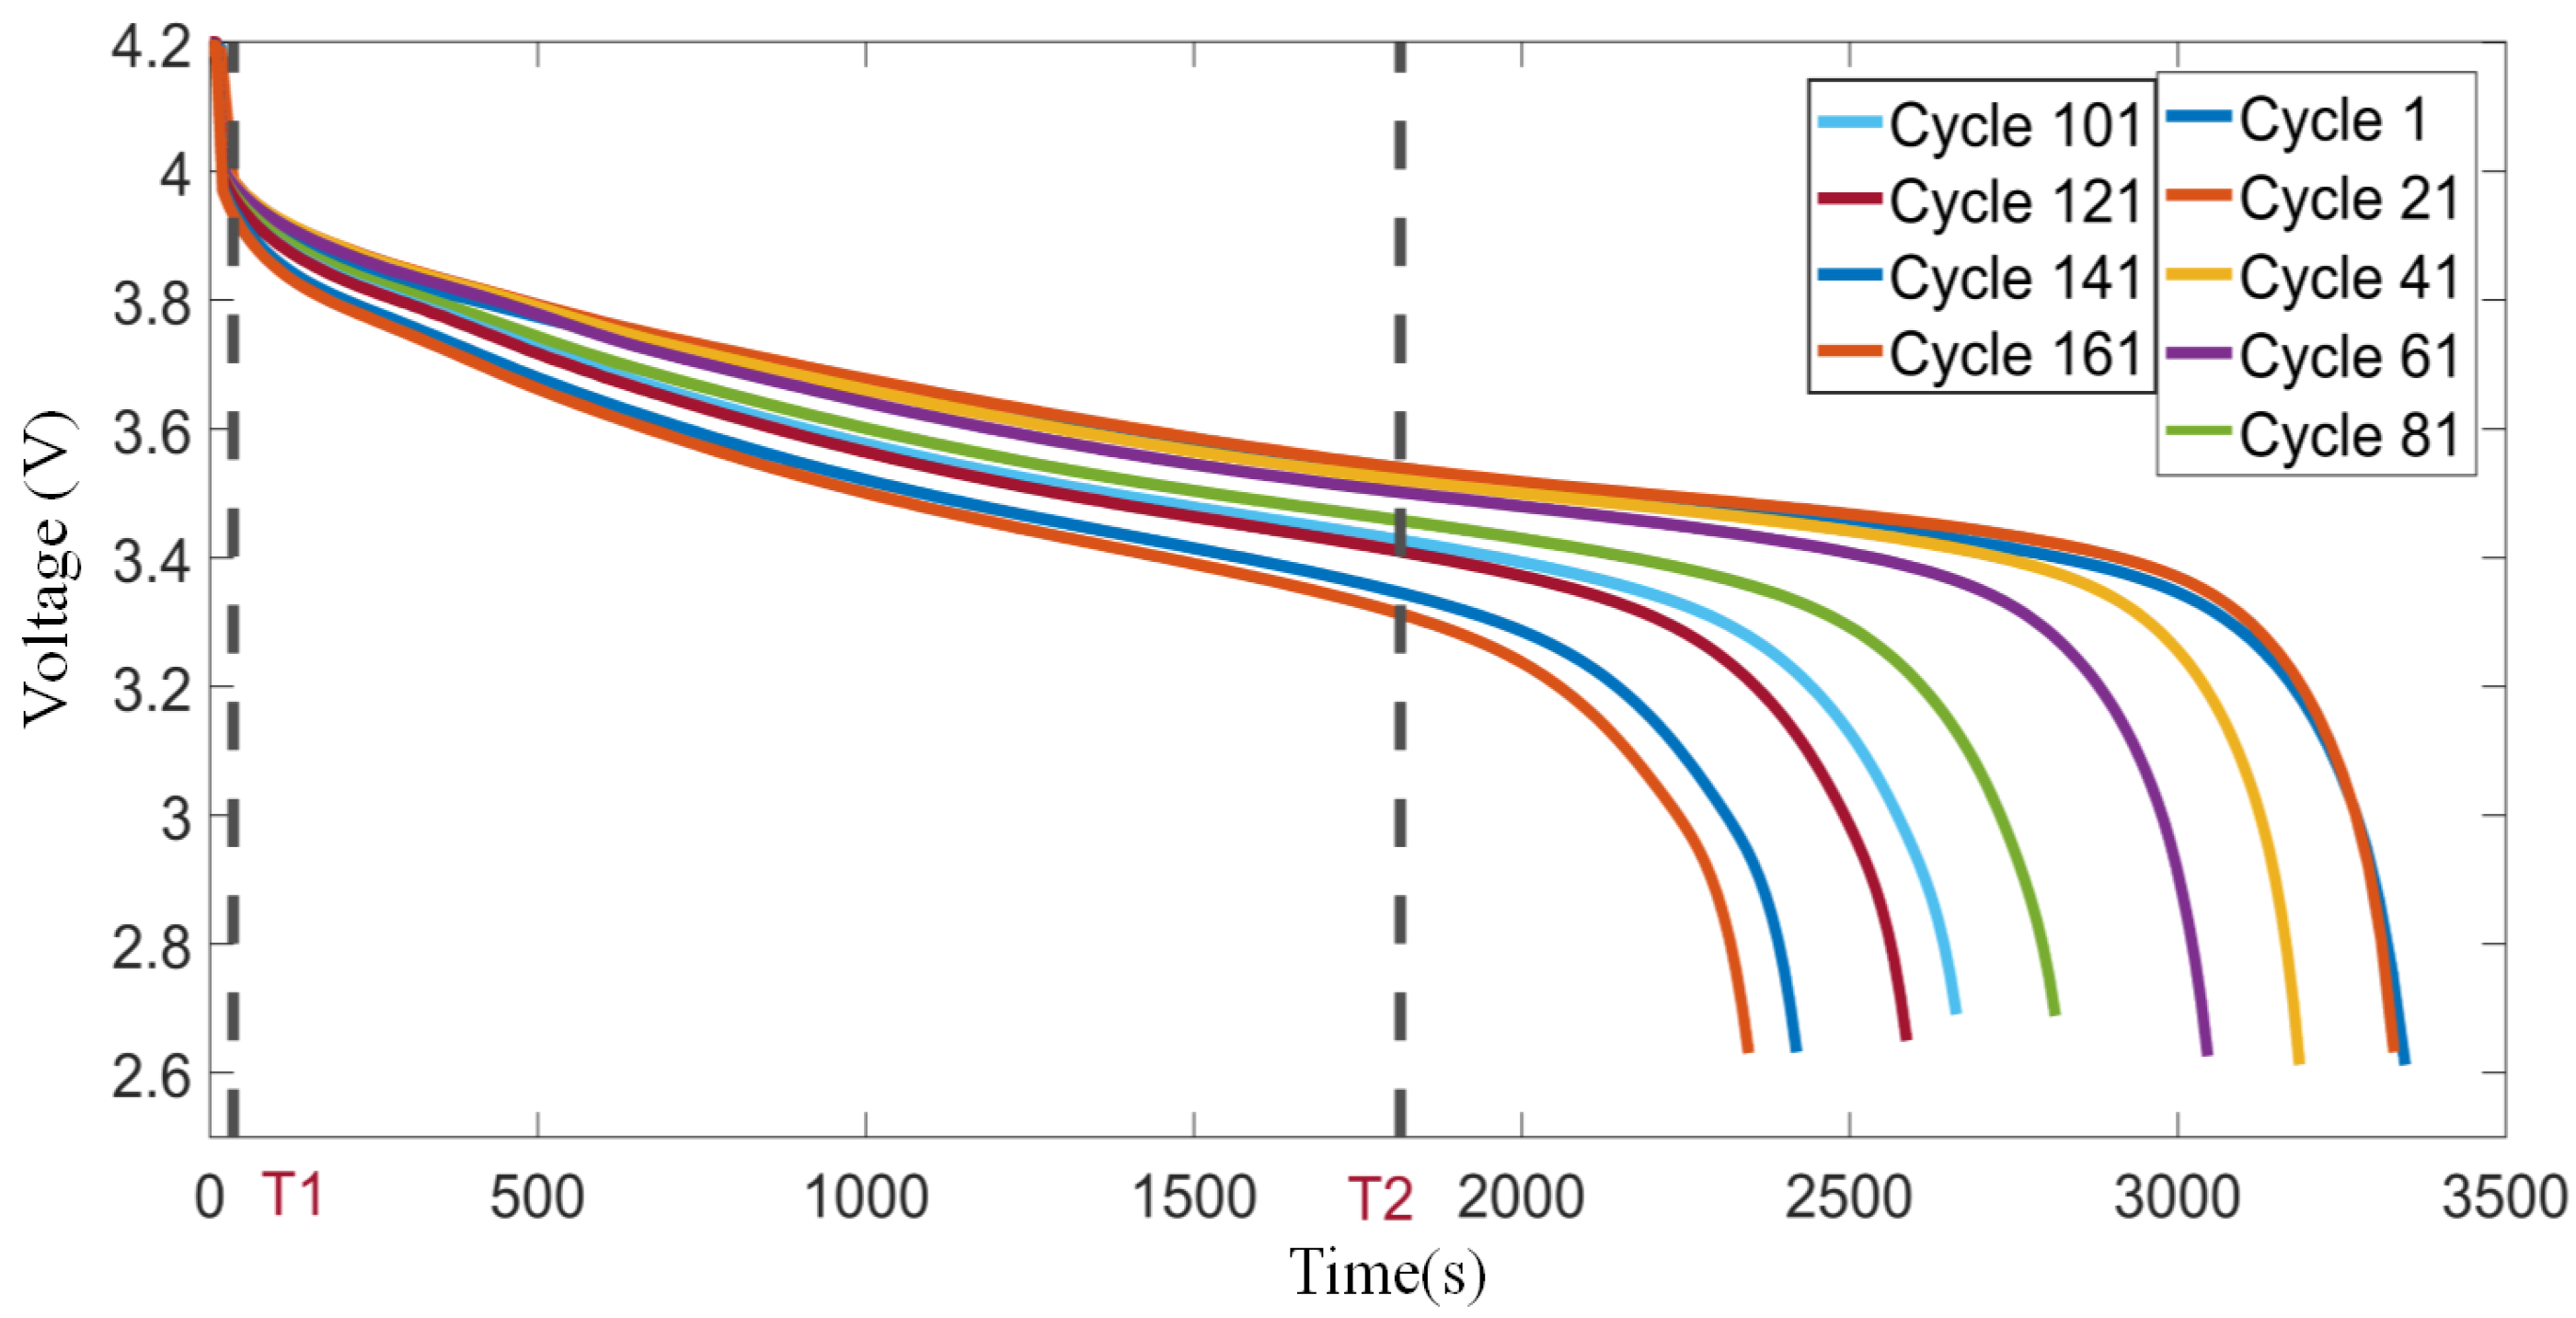
- The batteries are discharged with an initial instantaneous current of 1 C for a duration of 45 s. The current is loaded from time T1 (31st s) to time T2 (75th s).
- 3.
- The applied load is cut off, and the batteries are left to stand for 5 min.
- 4.
- The batteries are discharged with a constant current of 0.5 C until the SOC drops to 0%.
- 5.
- The applied load is cut off, and the batteries are left to stand for 35 min.
- 6.
- Fifty charge/discharge cycles of batteries are performed in the constant current–constant voltage (CC-CV) mode. The batteries are first charged to the charge cut-off voltage by the CC-CV mode. Then, the batteries are discharged to the discharge cut-off voltage by the CC mode of 0.5 C and continue to be discharged by the CV mode until the current is less than 0.5 A.
- 7.
- Repeat all the above steps until the capacity drops by 30%, at which point the aging test is ended.
5. Identification of the FDO
5.1. Identification Method
- The boundary values of the FDO and resistance are set, and a series of random FDOs and resistances are generated from the uniform distribution. The initial values of and are selected at 0.5.
- The values of the coefficient and the ohmic resistance are set.
- The current series () of the instantaneous discharge collected by the experimental platform are substituted into the fractional-order differential equation to calculate the estimated voltage ().
- The measured voltage () and estimated voltage between time T1 and time T2 are fitted by the optimization algorithm.
- The objective function is calculated according to the error between the measured voltage and the estimated voltage.
- The objective function is optimized iteratively to determine the optimal FDO and resistance so that the fitting error reaches the minimum value.
5.2. Identification Results
6. Mutation of the Charge Density on the Electrodes
7. Conclusions
Author Contributions
Funding
Data Availability Statement
Conflicts of Interest
References
- Vykhodtsev, A.V.; Jang, D.; Wang, Q.; Rosehart, W.; Zareipour, H. A review of modelling approaches to characterize lithium-ion battery energy storage systems in techno-economic analyses of power systems. Renew. Sustain. Energy Rev. 2022, 166, 112584. [Google Scholar] [CrossRef]
- Ali, H.; Khan, H.A.; Pecht, M. Preprocessing of spent lithium-ion batteries for recycling: Need, methods, and trends. Renew. Sustain. Energy Rev. 2022, 168, 112809. [Google Scholar] [CrossRef]
- Tahir, M.W.; Merten, C. Multi-scale thermal modeling, experimental validation, and thermal characterization of a high-power lithium-ion cell for automobile application. Energy Convers. Manag. 2022, 258, 115490. [Google Scholar] [CrossRef]
- Nguyen, B.; Chazelle, S.; Cerbelaud, M.; Porcher, W.; Lestriez, B. Manufacturing of industry-relevant silicon negative composite electrodes for lithium ion-cells. J. Power Sources 2014, 262, 112. [Google Scholar] [CrossRef]
- Wen, J.; Zhao, D.; Zhang, C. An overview of electricity powered vehicles: Lithium-ion battery energy storage density and energy conversion efficiency. Renew. Energy 2020, 162, 1629–1648. [Google Scholar] [CrossRef]
- Gozdur, R.; Guzowski, B.; Dimitrova, Z.; Noury, A.; Mitukiewicz, G.; Batory, D. An energy balance evaluation in lithium-ion battery module under high temperature operation. Energy Convers. Manag. 2021, 227, 113565. [Google Scholar] [CrossRef]
- Lu, L.; Han, X.; Li, J.; Hua, J.; Ouyang, M. A review on the key issues for lithium-ion battery management in electric vehicles. J. Power Sources 2013, 226, 272–288. [Google Scholar] [CrossRef]
- Monaco, S.; Giorgio, F.D.; Col, L.D.; Riché, M.; Arbizzani, C.; Mastragostino, M. Electrochemical performance of LiNi0.5Mn1.5O4 composite electrodes featuring carbons and reduced graphene oxide. J. Power Sources 2015, 278, 733–740. [Google Scholar] [CrossRef]
- Scrosati, B.; Garche, J. Lithium batteries: Status, prospects and future. J. Power Sources 2010, 195, 2419–2430. [Google Scholar] [CrossRef]
- Jiang, B.; Zhu, J.; Wang, X.; Wei, X.; Shang, W.; Dai, H. A comparative study of different features extracted from electrochemical impedance spectroscopy in state of health estimation for lithium-ion batteries. Appl. Energy 2022, 322, 119502. [Google Scholar] [CrossRef]
- Orazem, M.E.; Tribollet, B. An integrated approach to electrochemical impedance spectroscopy. Electrochim. Acta 2008, 53, 7360–7366. [Google Scholar] [CrossRef]
- Zhang, G.; Wei, X.; Zhu, J.; Chen, S.; Han, G.; Dai, H. Revealing the failure mechanisms of lithium-ion batteries during dynamic overcharge. J. Power Sources 2022, 543, 231867. [Google Scholar] [CrossRef]
- Su, X.; Sun, B.; Wang, J.; Zhang, W.; Ma, S.; He, X.; Ruan, H. Fast capacity estimation for lithium-ion battery based on online identification of low-frequency electrochemical impedance spectroscopy and Gaussian process regression. Appl. Energy 2022, 322, 119516. [Google Scholar] [CrossRef]
- Schmidt, J.P.; Chrobak, T.; Ender, M.; Illig, J.; Klotz, D.; Ivers-Tiffée, E. Studies on LiFePO4 as cathode material using impedance spectroscopy. J. Power Sources 2011, 196, 5342–5348. [Google Scholar] [CrossRef]
- Kurzweil, P.; Fischle, H.J. A new monitoring method for electrochemical aggregates by impedance spectroscopy. J. Power Sources 2004, 127, 331–340. [Google Scholar] [CrossRef]
- Kim, S.; Choi, Y.Y.; Choi, J.I. Impedance-based capacity estimation for lithium-ion batteries using generative adversarial network. Appl. Energy 2022, 308, 118317. [Google Scholar] [CrossRef]
- Tezyk, V.; Rossignol, C.; Sergent, N.; Djurado, E.; Laurencin, J.; Siebert, E. Cyclic voltammetry and high-frequency series resistance of La0.6Sr0.4Co0.2Fe0.8O3−δ electrode deposited on GDC: Effect of the electrode microstructure and the oxygen partial pressure. Electrochim. Acta 2019, 304, 312–322. [Google Scholar] [CrossRef]
- Pell, W.G.; Conway, B.E. Analysis of power limitations at porous supercapacitor electrodes under cyclic voltammetry modulation and dc charge. J. Power Sources 2001, 96, 57–67. [Google Scholar] [CrossRef]
- Zhu, X.; Hallemans, N.; Wouters, B.; Claessens, R.; Lataire, J.; Hubin, A. Operando odd random phase electrochemical impedance spectroscopy as a promising tool for monitoring lithium-ion batteries during fast charging. J. Power Sources 2022, 544, 231852. [Google Scholar] [CrossRef]
- Mao, Z.; Farkhondeh, M.; Pritzker, M.; Fowler, M.; Chen, Z. Dynamics of a Blended Lithium-Ion Battery Electrode during Galvanostatic Intermittent Titration Technique. Electrochim. Acta 2016, 222, 1741–1750. [Google Scholar] [CrossRef]
- Chen, Y.; Wang, L.; Anwar, T.; Zhao, Y.; Piao, N.; He, X.; Zhu, Q. Application of Galvanostatic Intermittent Titration Technique to Investigate Phase Transformation of LiFePO4 Nanoparticles. Electrochim. Acta 2017, 241, 132–140. [Google Scholar] [CrossRef]
- Li, J.; Yang, F.; Xiao, X.; Verbrugge, M.W.; Cheng, Y.T. Potentiostatic intermittent titration technique (PITT) for spherical particles with finite interfacial kinetics. Electrochim. Acta 2012, 75, 56–61. [Google Scholar] [CrossRef]
- Churikov, A.; Ivanishchev, A.; Ivanishcheva, I.; Sycheva, V.; Khasanova, N.; Antipov, E. Determination of lithium diffusion coefficient in LiFePO4 electrode by galvanostatic and potentiostatic intermittent titration techniques. Electrochim. Acta 2010, 55, 2939–2950. [Google Scholar] [CrossRef]
- Dees, D.W.; Kawauchi, S.; Abraham, D.P.; Prakash, J. Analysis of the Galvanostatic Intermittent Titration Technique (GITT) as applied to a lithium-ion porous electrode. J. Power Sources 2009, 189, 263–268. [Google Scholar] [CrossRef]
- Tang, X.C.; Song, X.W.; Shen, P.Z.; Jia, D.Z. Capacity intermittent titration technique (CITT): A novel technique for determination of Li+ solid diffusion coefficient of LiMn3O4. Electrochim. Acta 2005, 50, 5581–5587. [Google Scholar] [CrossRef]
- Kasper, M.; Leike, A.; Thielmann, J.; Winkler, C.; Al-Zubaidi R-Smith, N.; Kienberger, F. Electrochemical impedance spectroscopy error analysis and round robin on dummy cells and lithium-ion-batteries. J. Power Sources 2022, 536, 231407. [Google Scholar] [CrossRef]
- Qu, D.; Malik, A.; Yu, H.C. Physics-based simulation of electrochemical impedance spectroscopy of complex electrode microstructures using smoothed boundary method. Electrochim. Acta 2022, 432, 141141. [Google Scholar] [CrossRef]
- Nara, H.; Mukoyama, D.; Shimizu, R.; Momma, T.; Osaka, T. Systematic analysis of interfacial resistance between the cathode layer and the current collector in lithium-ion batteries by electrochemical impedance spectroscopy. J. Power Sources 2019, 409, 139–147. [Google Scholar] [CrossRef]
- Gao, P.; Zhang, C.; Wen, G. Equivalent circuit model analysis on electrochemical impedance spectroscopy of lithium metal batteries. J. Power Sources 2015, 294, 67–74. [Google Scholar] [CrossRef]
- Huang, J.; Li, Z.; Liaw, B.Y.; Zhang, J. Graphical analysis of electrochemical impedance spectroscopy data in Bode and Nyquist representations. J. Power Sources 2016, 309, 82–98. [Google Scholar] [CrossRef]
- Wang, Y.; Gao, G.; Li, X.; Chen, Z. A fractional-order model-based state estimation approach for lithium-ion battery and ultra-capacitor hybrid power source system considering load trajectory. J. Power Sources 2020, 449, 227543. [Google Scholar] [CrossRef]
- Sun, Y.; Li, Y.; Yu, M.; Zhou, Z.; Zhang, Q.; Duan, B.; Shang, Y.; Zhang, C. Variable fractional order - A comprehensive evaluation indicator of lithium-ion batteries. J. Power Sources 2020, 448, 227411. [Google Scholar] [CrossRef]
- Zhu, G.; Kong, C.; Wang, J.V.; Kang, J.; Yang, G.; Wang, Q. A fractional-order model of lithium-ion battery considering polarization in electrolyte and thermal effect. Electrochim. Acta 2022, 141461. [Google Scholar] [CrossRef]
- Ruan, H.; Sun, B.; Jiang, J.; Zhang, W.; He, X.; Su, X.; Bian, J.; Gao, W. A modified-electrochemical impedance spectroscopy-based multi-time-scale fractional-order model for lithium-ion batteries. Electrochim. Acta 2021, 394, 139066. [Google Scholar] [CrossRef]
- Yu, M.; Li, Y.; Podlubny, I.; Gong, F.; Sun, Y.; Zhang, Q.; Shang, Y.; Duan, B.; Zhang, C. Fractional-order modeling of lithium-ion batteries using additive noise assisted modeling and correlative information criterion. J. Adv. Res. 2020, 25, 49–56. [Google Scholar] [CrossRef]
- Jia, Y.; Dong, L.; Yang, G.; Jin, F.; Lu, L.; Guo, D.; Ouyang, M. Parameter Identification Method for a Fractional-Order Model of Lithium-Ion Batteries Considering Electrolyte-Phase Diffusion. Batteries 2022, 8, 90. [Google Scholar] [CrossRef]
- Zhang, L.; Wang, X.; Chen, M.; Yu, F.; Li, M. A fractional-order model of lithium-ion batteries and multi-domain parameter identification method. J. Energy Storage 2022, 50, 104595. [Google Scholar] [CrossRef]
- Kumar, R.; Kant, R. Theory of quasi-reversible charge transfer admittance on finite self-affine fractal electrode. Electrochim. Acta 2011, 56, 7112–7123. [Google Scholar] [CrossRef]
- Hirayama, M.; Sonoyama, N.; Abe, T.; Minoura, M.; Ito, M.; Mori, D.; Yamada, A.; Kanno, R.; Terashima, T.; Takano, M.; et al. Characterization of electrode/electrolyte interface for lithium batteries using in situ synchrotron X-ray reflectometry—A new experimental technique for LiCoO2 model electrode. J. Power Sources 2007, 168, 493–500. [Google Scholar] [CrossRef]
- Wei, S.; Li, Z.; Kimura, K.; Inoue, S.; Pandini, L.; Lecce], D.D.; Tominaga, Y.; Hassoun, J. Glyme-based electrolytes for lithium metal batteries using insertion electrodes: An electrochemical study. Electrochim. Acta 2019, 306, 85–95. [Google Scholar] [CrossRef]
- Bai, L.; Xue, W.; Qin, H.; Li, Y.; Li, Y.; Sun, J. A novel dense LiCoO2 microcrystalline buffer layer on a cathode-electrolyte interface for all-solid-state lithium batteries prepared by the magnetron sputtering method. Electrochim. Acta 2019, 295, 677–683. [Google Scholar] [CrossRef]
- Lu, X.; Li, H.; Chen, N. An indicator for the electrode aging of lithium-ion batteries using a fractional variable order model. Electrochim. Acta 2019, 299, 378–387. [Google Scholar] [CrossRef]
- Yang, C.; Song, J.; Wang, Y.; Wan, C. Impedance spectroscopic study for the initiation of passive film on carbon electrodes in lithium ion batteries. J. Appl. Electrochem. 2000, 30, 29–34. [Google Scholar] [CrossRef]
- Davoodabadi, A.; Li, J.; Liang, Y.; Wood, D.L.; Singler, T.J.; Jin, C. Analysis of electrolyte imbibition through lithium-ion battery electrodes. J. Power Sources 2019, 424, 193–203. [Google Scholar] [CrossRef] [Green Version]
- Westerlund, S.; Ekstam, L. Capacitor theory. IEEE Trans. Dielectr. Electr. Insul. 1994, 1, 826–839. [Google Scholar] [CrossRef]
- Wang, B.; Li, S.E.; Peng, H.; Liu, Z. Fractional-order modeling and parameter identification for lithium-ion batteries. J. Power Sources 2015, 293, 151–161. [Google Scholar] [CrossRef]
- Li, X.; Fan, G.; Pan, K.; Wei, G.; Zhu, C.; Rizzoni, G.; Canova, M. A physics-based fractional order model and state of energy estimation for lithium ion batteries. Part I: Model development and observability analysis. J. Power Sources 2017, 367, 187–201. [Google Scholar] [CrossRef]
- Zou, C.; Zhang, L.; Hu, X.; Wang, Z.; Wik, T.; Pecht, M. A review of fractional-order techniques applied to lithium-ion batteries, lead-acid batteries, and supercapacitors. J. Power Sources 2018, 390, 286–296. [Google Scholar] [CrossRef] [Green Version]
- Mu, H.; Xiong, R.; Zheng, H.; Chang, Y.; Chen, Z. A novel fractional order model based state-of-charge estimation method for lithium-ion battery. Appl. Energy 2017, 207, 384–393. [Google Scholar] [CrossRef]
- Sabatier, J.; Merveillaut, M.; Francisco, J.M.; Guillemard, F.; Porcelatto, D. Lithium-ion batteries modeling involving fractional differentiation. J. Power Sources 2014, 262, 36–43. [Google Scholar] [CrossRef]
- Alavi, S.; Birkl, C.; Howey, D. Time-domain fitting of battery electrochemical impedance models. J. Power Sources 2015, 288, 345–352. [Google Scholar] [CrossRef]
- Unterrieder, C.; Zhang, C.; Lunglmayr, M.; Priewasser, R.; Marsili, S.; Huemer, M. Battery state-of-charge estimation using approximate least squares. J. Power Sources 2015, 278, 274–286. [Google Scholar] [CrossRef] [Green Version]
- Duong, V.H.; Bastawrous, H.A.; Lim, K.; See, K.W.; Zhang, P.; Dou, S.X. Online state of charge and model parameters estimation of the LiFePO4 battery in electric vehicles using multiple adaptive forgetting factors recursive least-squares. J. Power Sources 2015, 296, 215–224. [Google Scholar] [CrossRef]
- Plett, G.L. Recursive approximate weighted total least squares estimation of battery cell total capacity. J. Power Sources 2011, 196, 2319–2331. [Google Scholar] [CrossRef]
- Barré, A.; Deguilhem, B.; Grolleau, S.; Gérard, M.; Suard, F.; Riu, D. A review on lithium-ion battery ageing mechanisms and estimations for automotive applications. J. Power Sources 2013, 241, 680–689. [Google Scholar] [CrossRef] [Green Version]
- Gao, Y.; Jiang, J.; Zhang, C.; Zhang, W.; Ma, Z.; Jiang, Y. Lithium-ion battery aging mechanisms and life model under different charging stresses. J. Power Sources 2017, 356, 103–114. [Google Scholar] [CrossRef]
- Gao, Y.; Jiang, J.; Zhang, C.; Zhang, W.; Jiang, Y. Aging mechanisms under different state-of-charge ranges and the multi-indicators system of state-of-health for lithium-ion battery with Li(NiMnCo)O2 cathode. J. Power Sources 2018, 400, 641–651. [Google Scholar] [CrossRef]
- Lucu, M.; Martinez-Laserna, E.; Gandiaga, I.; Camblong, H. A critical review on self-adaptive Li-ion battery ageing models. J. Power Sources 2018, 401, 85–101. [Google Scholar] [CrossRef]
- Han, X.; Ouyang, M.; Lu, L.; Li, J.; Zheng, Y.; Li, Z. A comparative study of commercial lithium ion battery cycle life in electrical vehicle: Aging mechanism identification. J. Power Sources 2014, 251, 38–54. [Google Scholar] [CrossRef]
- Saha, B.; Goebel, K. Battery Data Set; NASA Ames Prognostics Data Repository, NASA Ames Research Center: Moffett Field, CA, USA, 2007.


| Battery | Nominal Capacity (Ah) | Discharge Cut-Off Voltage (V) | Charge Cut-Off Voltage (V) | Operating Temperature (°C) |
|---|---|---|---|---|
| LiNixMnyCozO2 | 10 | 2.2 | 4.2 | 25 |
| SOC/% | 10 | 20 | 30 | 40 | 50 | 60 | 70 | 80 | 90 | 100 |
|---|---|---|---|---|---|---|---|---|---|---|
| (mΩ) | 16.39 | 16.10 | 15.94 | 15.68 | 15.49 | 15.33 | 15.13 | 15.00 | 14.75 | 14.32 |
| (mΩ) | 1.38 | 1.37 | 1.37 | 1.37 | 1.35 | 1.35 | 1.34 | 1.32 | 1.32 | 1.31 |
| Cycle | 0 | 100 | 200 | 300 | 400 | 500 | 600 | 700 | 800 |
|---|---|---|---|---|---|---|---|---|---|
| (mΩ) | 14.68 | 14.87 | 14.94 | 15.26 | 15.39 | 15.59 | 15.84 | 16.04 | 16.27 |
| (mΩ) | 1.31 | 1.33 | 1.33 | 1.34 | 1.35 | 1.35 | 1.35 | 1.37 | 1.37 |
| 1500 | 1400 | 1300 | 1200 | 1100 | 1000 | 900 | 800 | 700 | 600 | 500 | 400 | |
|---|---|---|---|---|---|---|---|---|---|---|---|---|
| 0.555 | 0.535 | 0.514 | 0.493 | 0.470 | 0.456 | 0.431 | 0.414 | 0.394 | 0.372 | 0.356 | 0.333 | |
| 0.578 | 0.559 | 0.538 | 0.516 | 0.493 | 0.479 | 0.454 | 0.437 | 0.418 | 0.395 | 0.379 | 0.357 | |
| 0.598 | 0.579 | 0.555 | 0.532 | 0.518 | 0.492 | 0.475 | 0.456 | 0.435 | 0.410 | 0.391 | 0.375 | |
| 0.608 | 0.587 | 0.565 | 0.542 | 0.528 | 0.502 | 0.485 | 0.467 | 0.445 | 0.420 | 0.401 | 0.386 | |
| 0.625 | 0.604 | 0.582 | 0.569 | 0.545 | 0.520 | 0.503 | 0.484 | 0.462 | 0.447 | 0.428 | 0.403 | |
| 0.631 | 0.610 | 0.598 | 0.575 | 0.551 | 0.536 | 0.519 | 0.490 | 0.479 | 0.454 | 0.435 | 0.419 | |
| 0.650 | 0.639 | 0.617 | 0.594 | 0.570 | 0.555 | 0.538 | 0.519 | 0.497 | 0.473 | 0.453 | 0.438 | |
| 0.687 | 0.666 | 0.644 | 0.621 | 0.607 | 0.582 | 0.565 | 0.546 | 0.525 | 0.500 | 0.481 | 0.465 | |
| 0.702 | 0.681 | 0.669 | 0.646 | 0.622 | 0.607 | 0.580 | 0.561 | 0.549 | 0.525 | 0.501 | 0.480 | |
| 0.724 | 0.703 | 0.681 | 0.668 | 0.644 | 0.629 | 0.602 | 0.583 | 0.561 | 0.547 | 0.527 | 0.502 | |
| 0.731 | 0.710 | 0.698 | 0.675 | 0.651 | 0.636 | 0.619 | 0.590 | 0.579 | 0.554 | 0.535 | 0.519 | |
| 0.754 | 0.733 | 0.711 | 0.698 | 0.674 | 0.659 | 0.632 | 0.613 | 0.591 | 0.577 | 0.558 | 0.532 | |
| 0.775 | 0.753 | 0.731 | 0.718 | 0.694 | 0.679 | 0.652 | 0.633 | 0.612 | 0.597 | 0.578 | 0.552 | |
| 0.782 | 0.760 | 0.748 | 0.725 | 0.701 | 0.686 | 0.669 | 0.640 | 0.629 | 0.604 | 0.584 | 0.569 | |
| 0.817 | 0.792 | 0.776 | 0.754 | 0.732 | 0.718 | 0.692 | 0.675 | 0.656 | 0.634 | 0.617 | 0.595 | |
| 0.839 | 0.818 | 0.796 | 0.773 | 0.759 | 0.733 | 0.717 | 0.698 | 0.676 | 0.651 | 0.632 | 0.617 | |
| 0.847 | 0.824 | 0.806 | 0.785 | 0.762 | 0.748 | 0.723 | 0.706 | 0.686 | 0.664 | 0.648 | 0.625 | |
| 0.854 | 0.834 | 0.812 | 0.790 | 0.776 | 0.757 | 0.738 | 0.719 | 0.692 | 0.678 | 0.655 | 0.634 |
| Battery Number | Charge Current (A) | Discharge Current (A) | Temperature (°C) | Charge Cut-Off Voltage (V) | Discharge Cut-Off Voltage (V) |
|---|---|---|---|---|---|
| No. 0005 | 1.5 | 2.0 | 24 | 4.2 | 2.7 |
| No. 0006 | 1.5 | 2.0 | 24 | 4.2 | 2.5 |
| No. 0007 | 1.5 | 2.0 | 24 | 4.2 | 2.2 |
Publisher’s Note: MDPI stays neutral with regard to jurisdictional claims in published maps and institutional affiliations. |
© 2022 by the authors. Licensee MDPI, Basel, Switzerland. This article is an open access article distributed under the terms and conditions of the Creative Commons Attribution (CC BY) license (https://creativecommons.org/licenses/by/4.0/).
Share and Cite
Lu, X.; Chen, N. Analysis of the Charge Density Variation Caused by the Physical Properties of the Electrodes of Lithium-Ion Batteries. Fractal Fract. 2022, 6, 701. https://doi.org/10.3390/fractalfract6120701
Lu X, Chen N. Analysis of the Charge Density Variation Caused by the Physical Properties of the Electrodes of Lithium-Ion Batteries. Fractal and Fractional. 2022; 6(12):701. https://doi.org/10.3390/fractalfract6120701
Chicago/Turabian StyleLu, Xin, and Ning Chen. 2022. "Analysis of the Charge Density Variation Caused by the Physical Properties of the Electrodes of Lithium-Ion Batteries" Fractal and Fractional 6, no. 12: 701. https://doi.org/10.3390/fractalfract6120701
APA StyleLu, X., & Chen, N. (2022). Analysis of the Charge Density Variation Caused by the Physical Properties of the Electrodes of Lithium-Ion Batteries. Fractal and Fractional, 6(12), 701. https://doi.org/10.3390/fractalfract6120701