Abstract
Freezing action always results in great damage to the pore structure and fractal characteristics of freezing–thawing soft soil. Nuclear magnetic resonance (NMR) can help collect data to describe the microstructure of frozen–thawed soft soil. This paper conducted a series of nuclear magnetic resonance (NMR) tests to interpret the effect of freezing duration, freezing–thawing pressure and freezing temperature on soil’s micro-pore structure and fractal characteristics. The pore size distributions (PSDs) of the tested materials were obtained from the NMR T2 spectra, and fractal theory was introduced to describe the fractal properties of PSD. The results demonstrate that the soil assembly with a larger pore structure tends to be a skeleton pore structure with strong fractal characteristics; the shorter the freezing duration is, the less damage caused by the freezing action; a larger pressure during freezing and thawing results in a lower fractal dimension value for thawing soil’s structure, while a lower freezing temperature causes a larger fractal dimension of frozen-thawed soil.
1. Introduction
In recent years, with the expansion of cities, a large number of subway tunnels pass through soft soil areas. When constructing the connecting passages between two shield tunnels, due to the small working space and the difficulty in accessing the equipment, the freezing ground method is used in construction to enhance the strength of the soil [1,2,3]. However, the dynamic characteristics of soft soils are significantly weakened after freezing and thawing cycles [4,5]. The uneven settlement of the frozen areas caused by the difference in freezing conditions seriously threatens the safety of subway operations. The microstructure of soil has been extensively acknowledged as being related to mechanical properties [6,7,8,9,10,11,12]. The change in the soil microstructure caused by frost heave is the essential reason for the weakening of frozen–thawed soil mechanical performance [13]. Therefore, it is necessary to study the microstructure characteristics of frozen–thawed soft soil under different freezing conditions.
In 1975, fractal geometry theory was established by Mandelbrot to evaluate the irregularity of complex porous media and the self-similarity characteristics of graphs [14,15]. The pore structure and fractal characteristics of soil can directly reflect the looseness of the soil skeleton, which is beneficial for predicting the amount of soil volume change. At present, pore structure and fractal dimension are mainly obtained by scanning electron microscope (SEM) image analysis, mercury intrusion porosimetry (MIP), transmission electron microscopy (TEM), X-ray micro-tomography, nitrogen adsorption and nuclear magnetic resonance (NMR) for soil pore characterization [16,17,18,19,20,21,22,23,24,25]. Previous works reveal that fractal theory can be used to study the fractal characteristics of pores in soil [26,27,28,29,30]. It is beneficial to analyze the pore structure of materials by combining more than one method. Sun et al. [31] investigated the relationships between fractal dimensions of micro-pore structure and mineral compositions by SEM, X-ray diffraction observations and nuclear magnetic resonance (NMR). Yang et al. [32] used SEM, low pressure gas adsorption, helium pycnometry, X-ray diffraction and geochemical analyses to investigate the pore structure and fractal dimension of the pores in shale formation. According to fractal theory, Shao et al. [33] brought to light that the fractal dimension can reflect its physical properties in tight sandstone, which consists of quartz and clay minerals. Through a series of NMR tests, Li et al. [34] found that shale with a larger surface fractal dimension has a higher methane adsorption capacity. Furthermore, Liang et al. [35] reported that the lgSv-lgR curve of soil included two distinct parts and proposed that the PSD in soil showed multi-fractal characteristics. Technological advances provide new ideas for the study of the microstructure of frozen–thawed soft soils.
Due to the high water content, the freezing action results in irreversible damage to the soil’s structure. Water freezing causes expansion in saturated soft clay, which damages the soft clay structure [36]. Frozen soft clay has many surface fissures, and the number of fissures multiplies after thawing [13]. Ding et al. [37] studied the microstructure of frozen–thawed soil by SEM and proposed that after freezing and thawing, the soil’s microstructure appears flocculated, and the lower the freezing temperature, the more fragmented the microstructure. However, previous research does not provide a comprehensive guide for describing structural changes of frozen–thawed soil under various freezing conditions, and further research is needed. In actual construction, when moving away from the freezing pipe, the freezing temperature of the soil rises. Furthermore, the confining pressure near the freezing pipe is greater than that near the ground. Therefore, there are various combinations of freezing duration, temperatures and confining pressures in frozen areas, resulting in different soil damage over the range of the freezing ground. In soil samples, the relaxation time obtained by NMR is closely related to the properties of fluid, so accurate data on pore structure and fractal characteristics can be obtained [13].
In this work, a series of nuclear magnetic resonance (NMR) tests were conducted on soil samples frozen under controllable freezing duration, temperature and confining pressure. The characteristic curves of the pore size distribution and its change rule of the frozen-thawed soil at different stages were explored. Then, fractal theory was introduced to describe the fractal properties of frozen–thawed soil. The research results can be used as a reliable basis for predicting the degree of structural damage of frozen–thawed soil under construction conditions. A better interpretation could then be obtained from tests for uneven settlement of connecting passages in subway systems.
2. Materials and Methods
2.1. Soft Clay Samples
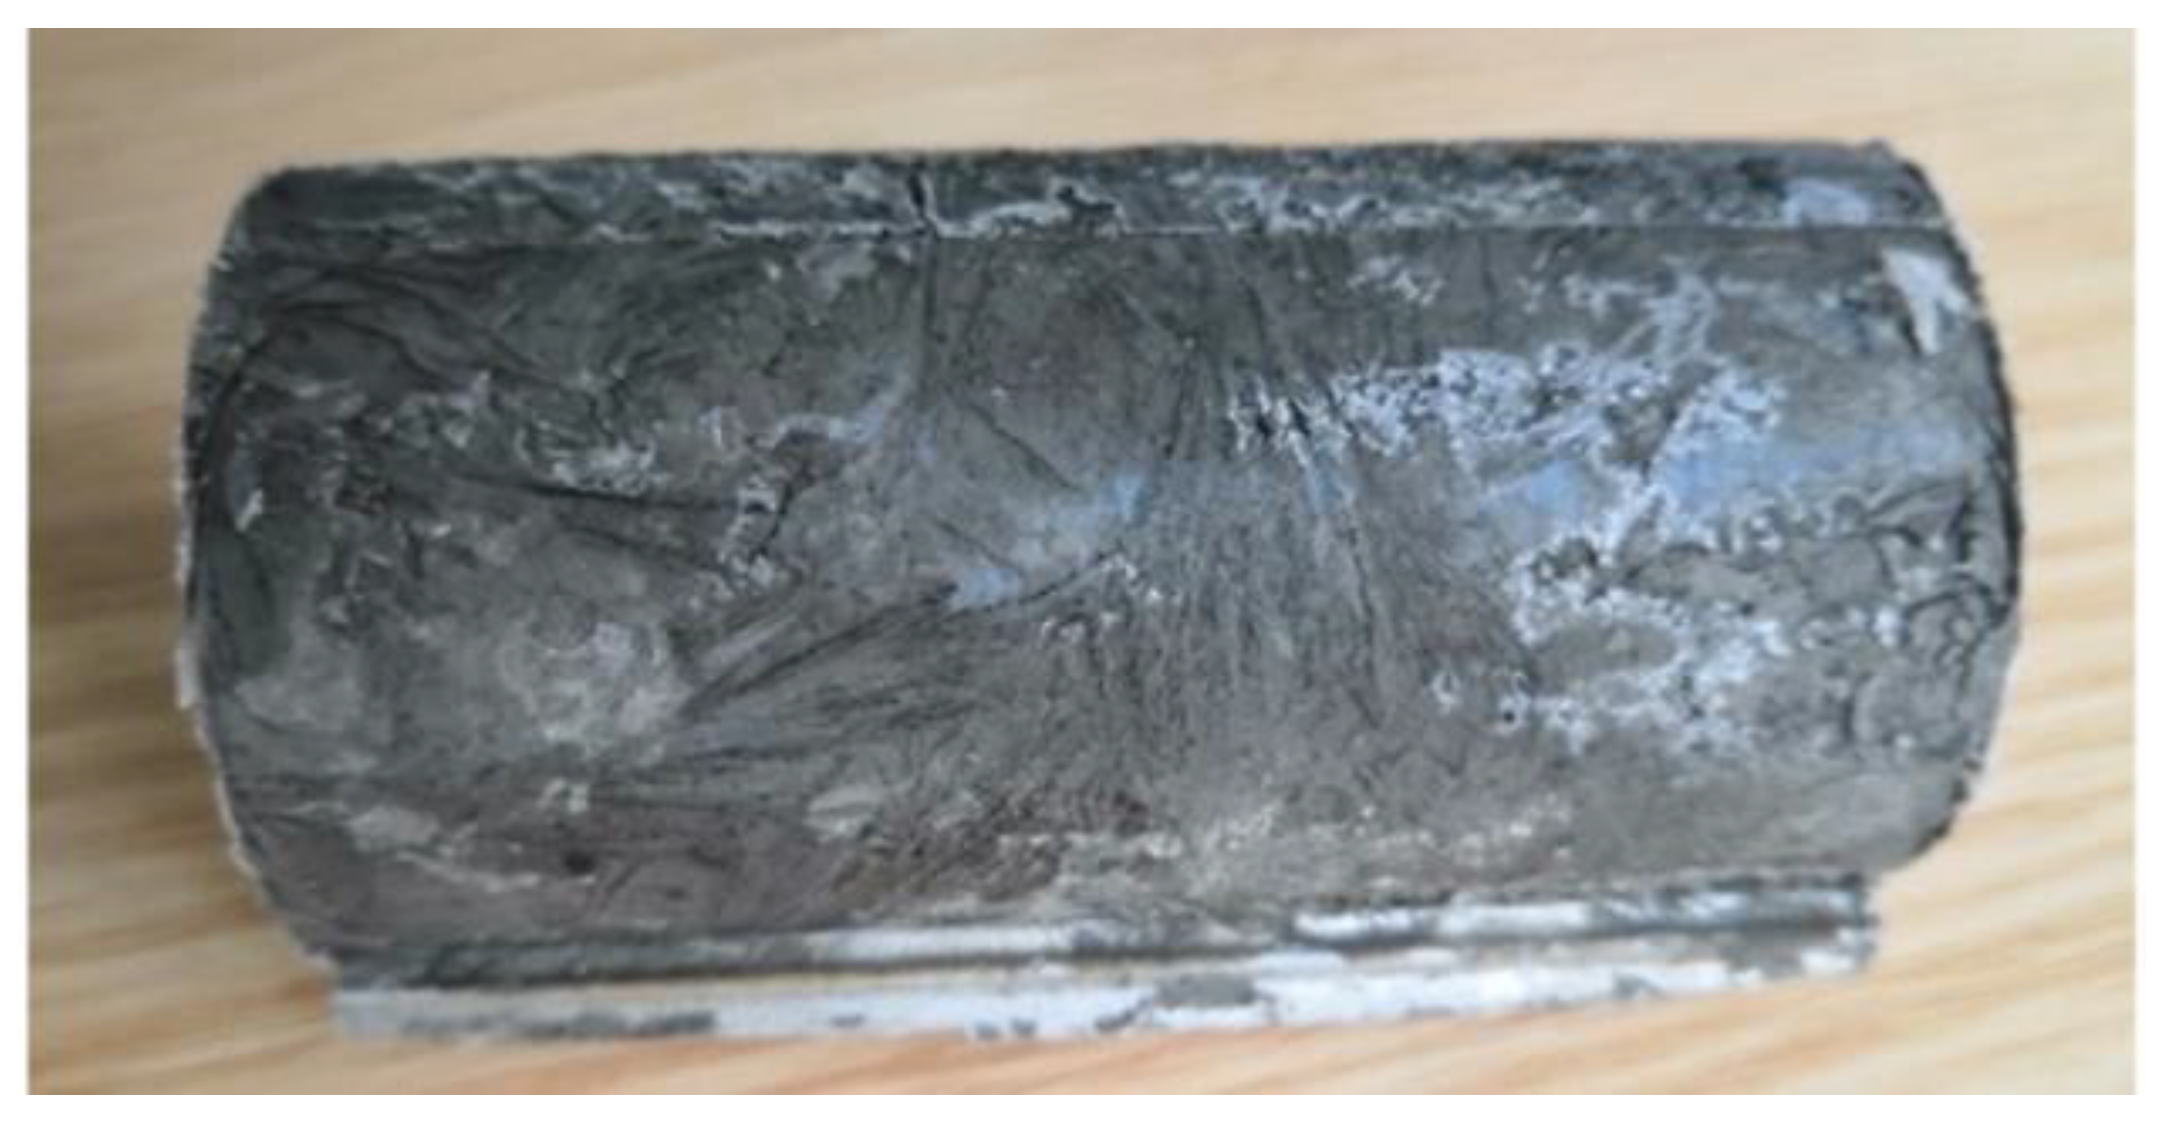
The soft clay was taken from 15~20 m below ground in Hangzhou. The soil samples were mainly composed of illite and illite-montmorillonite minerals. The physical and mechanical properties of the soil sample were characterized by low strength, low permeability, high compressibility and high sensitivity. For the saturated soft clay, its natural weight is 17.7 kN/m3, density ρ = 1.82 g/cm2, relative density Gs = 2.75, water content ω = 45%, plastic limit ωP = 33.4%, liquid limit ωL = 51.6%, plasticity index Ip = 18.2 and reference thermal conductivity 0.8−1 W·m−1·K−1. The freezing soil sample is shown in Figure 1.

Figure 1.
Photograph of the freezing specimen.
The remolded soft clay was prepared in a cylinder 38 mm in diameter and 76 mm in height. Then, the cylinder was placed in a vacuum saturation barrel at −100 kPa for 3 h. Finally, the soft clay was soaked in the cylinder at atmospheric pressure for 12 h to obtain saturated soft clay samples, which were full of water. In order to avoid error caused by the poor uniformity of undisturbed soil, the undisturbed soil was remolded by the vacuum preloading method, and remolded soil samples with good uniformity were obtained [23].
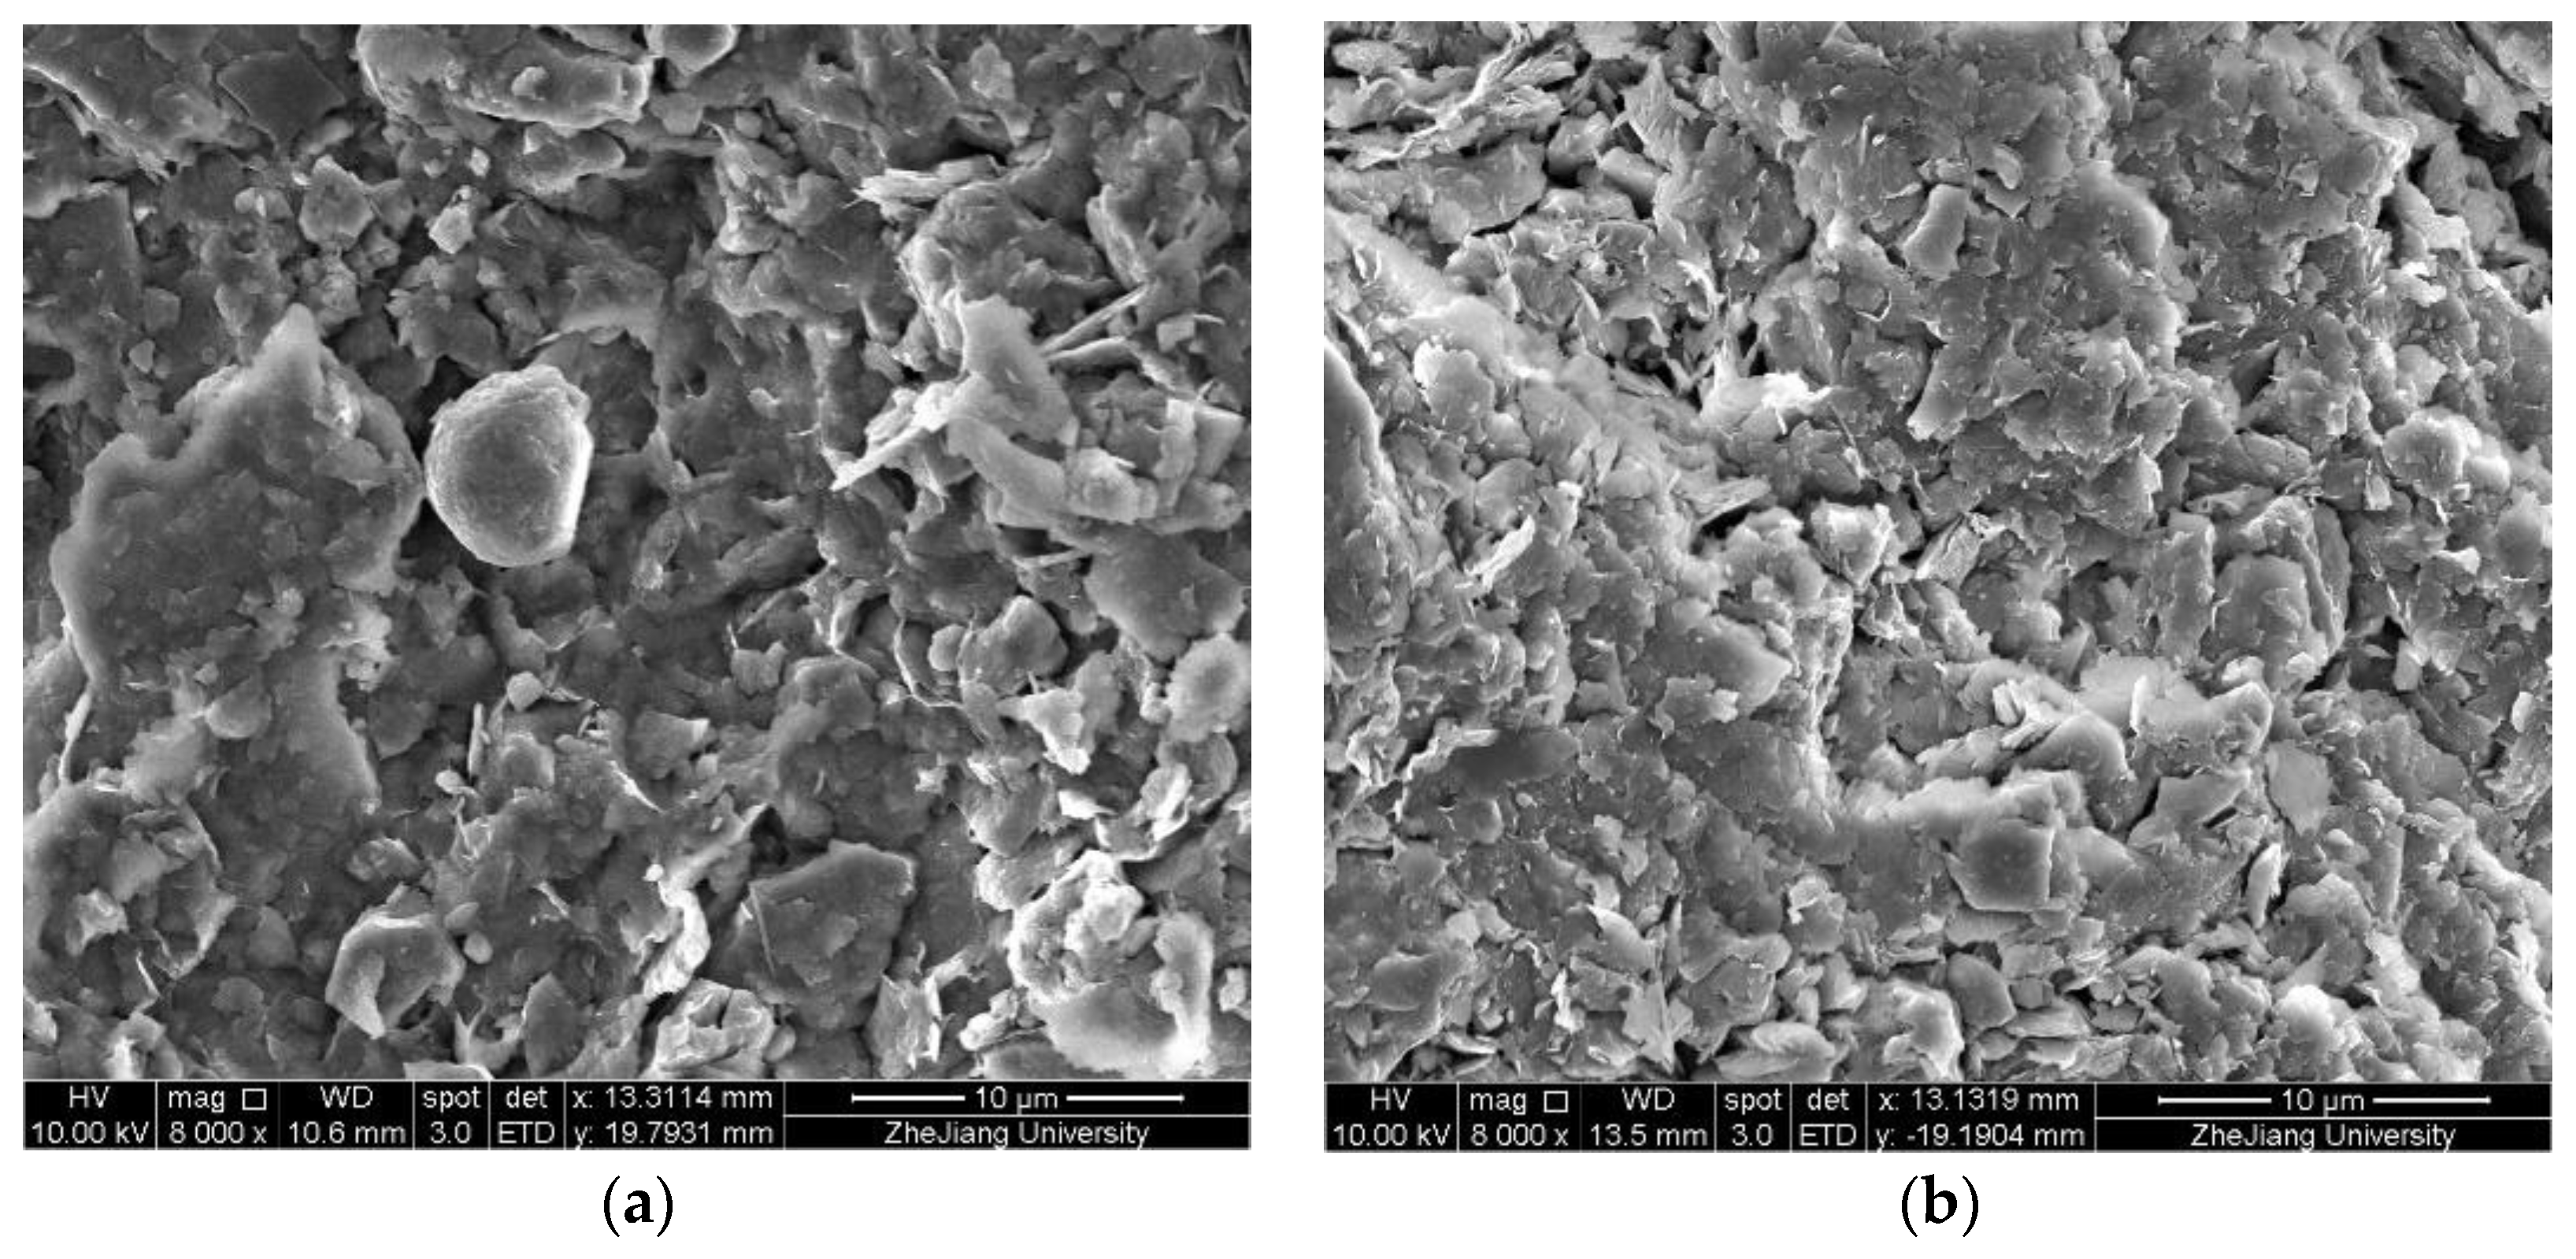
Figure 2 shows representative SEM images of soil microstructure before and after freezing and thawing at −20 °C. From Figure 2a, it can be observed that the micro-structural characteristics of the remodeled soil before freezing mostly are in the form of edge–edge and edge-surface contact between the structures. The clumps are inlaid with each other in outline. There are obvious fissures between the clumps, and the fissures are filled with agglomerated fragments of sheet-like soil particles. After freezing, it can be clearly observed that the soil structure became looser; a honeycomb flocculation structure and feather-like flake structure appears around the soil particle aggregates, as shown in Figure 3b. It also can be seen that the agglomeration structure between soil particles was destroyed, which increased the complexity level of the pore morphology.

Figure 2.
Scanning electron microscope (SEM) images of soft clay: (a) unfrozen soil; (b) frozen-thawed soil.

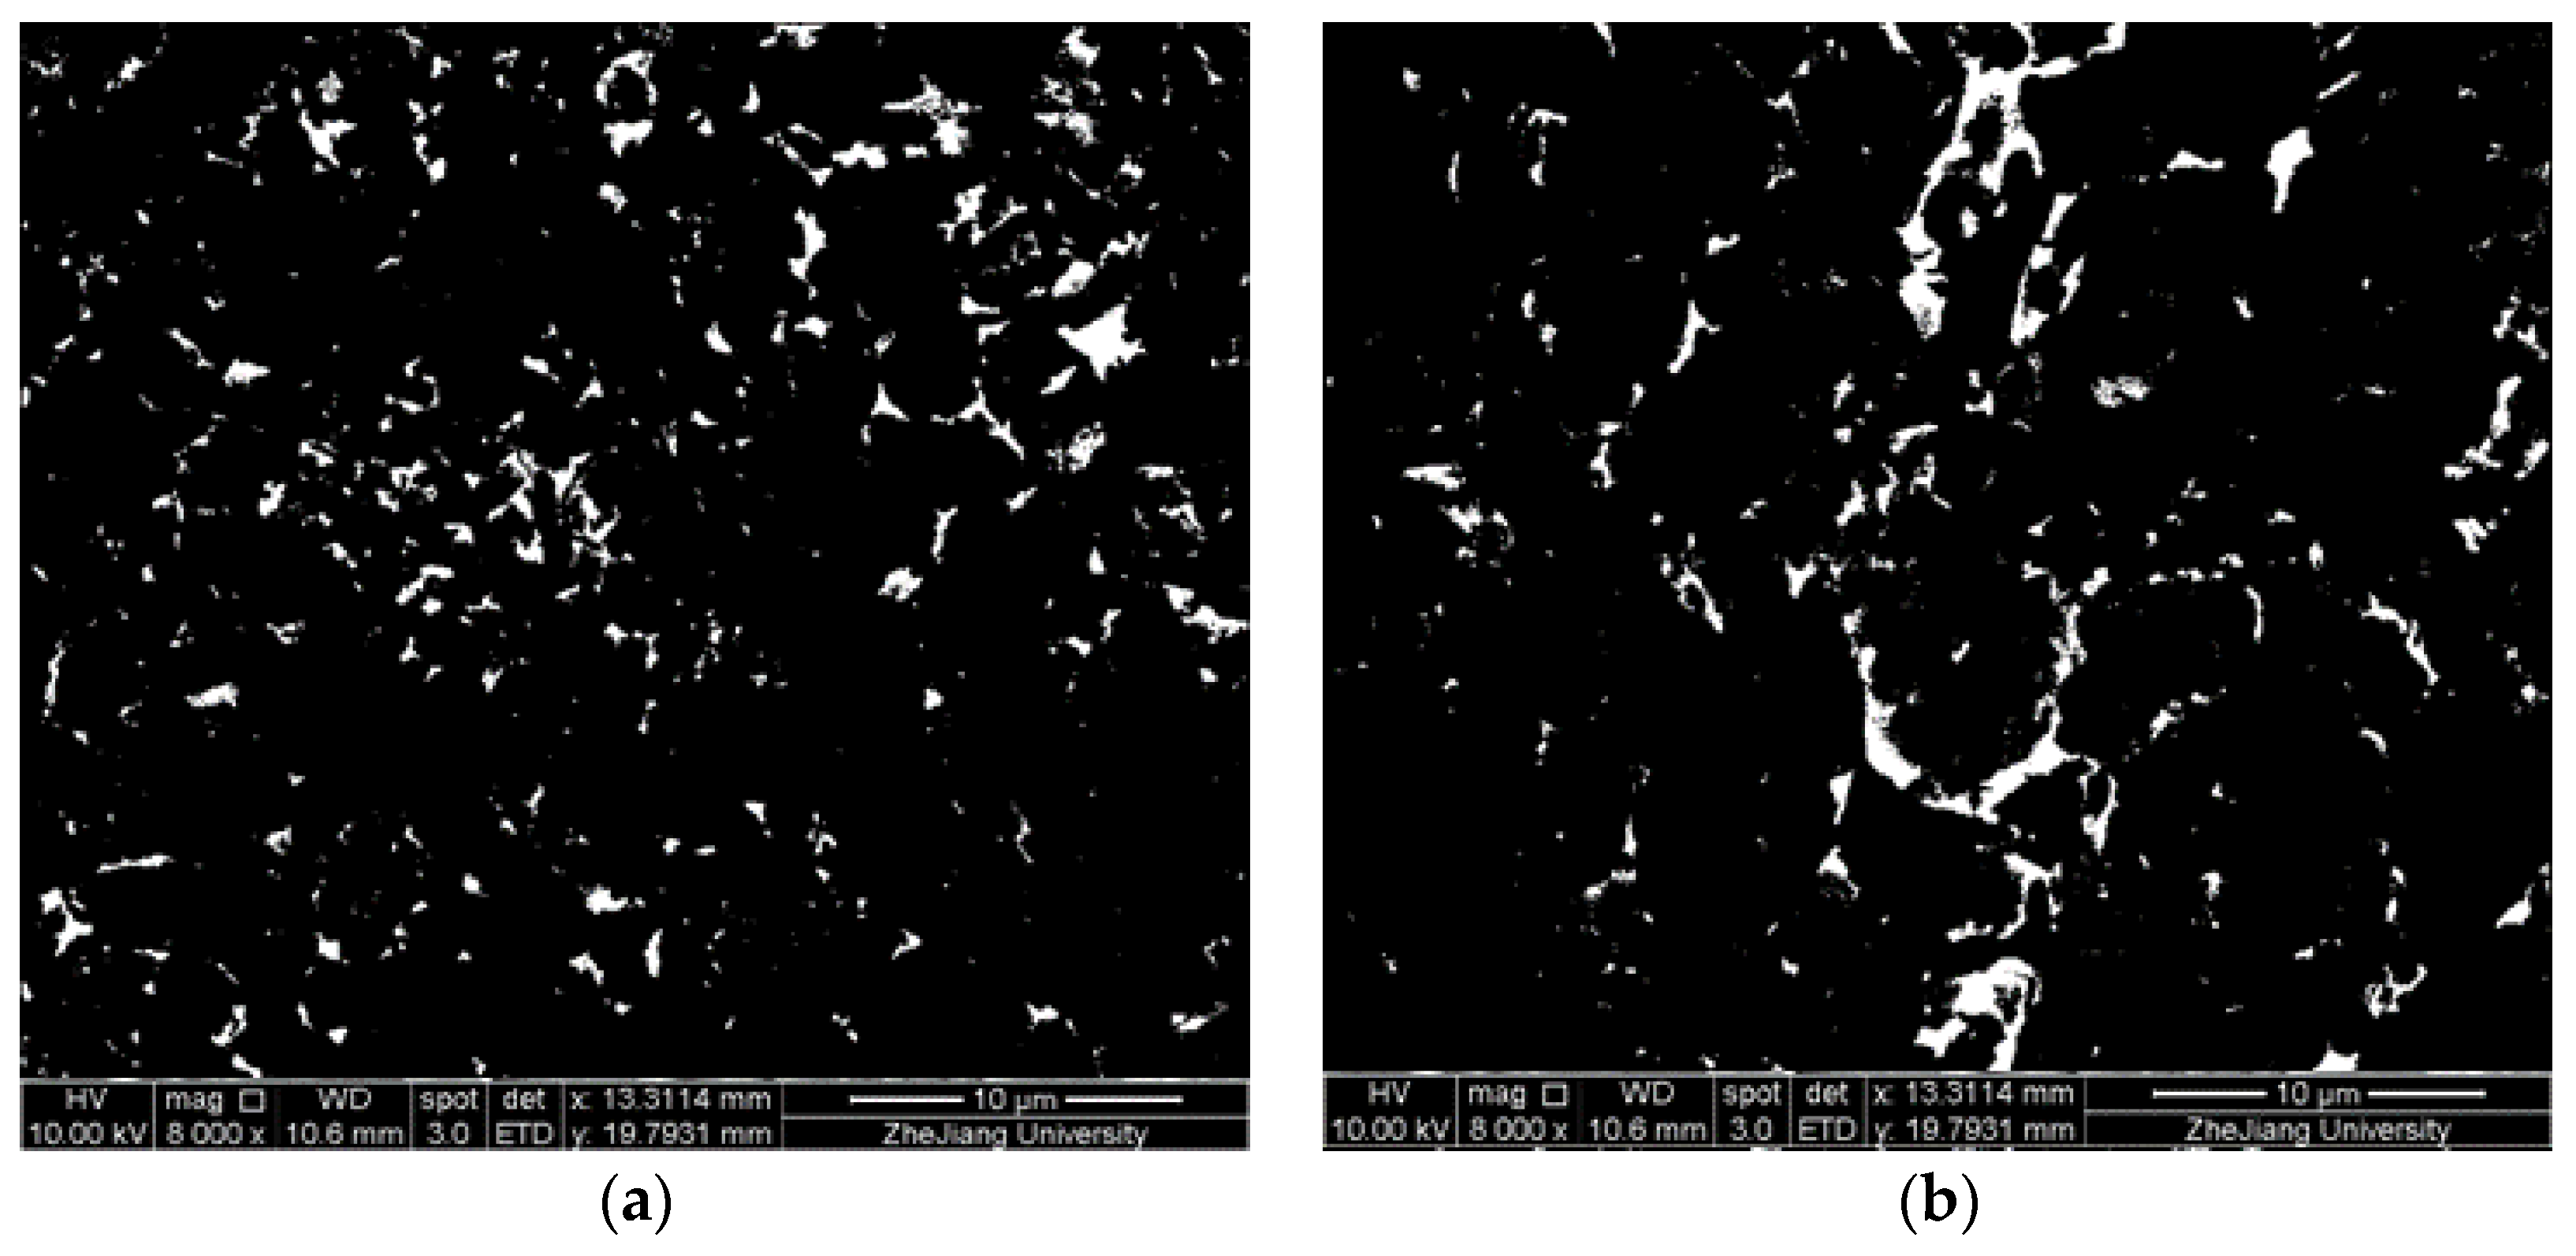
Figure 3.
Pore morphology of soft clay: (a) unfrozen soil; (b) frozen-thawed soil.
2.2. Freezing Plan for Soft Clay
Water freezing causes expansion in saturated soft clay, which damages the soft clay structure. Variable settings were in this paper based on different construction situations, including different freezing durations, freezing pressures and freezing temperatures. Variables were set based on the above conditions. All the prepared samples were frozen under specific temperatures, pressures and durations following the experimental program described in Table 1.

Table 1.
Experimental program.
Three groups of variables were set to analyze pore structure and fractal characteristic change under different freezing conditions. The A1–A7 samples were frozen under freezing durations from 1 to 24 h at −20 °C. The second set of frozen soft clay samples, with freezing–thawing pressure from 50 to 400 kPa, were labelled as B1–B4. Three different thawing temperatures, from −3 °C to −20 °C, were used frozen soft clay samples, set as C1–C3. The testers tried to avoid any possible accidents to obtain highly reproducible and accurate results. For every serial number in Table 1, there were two samples for parallel trials; the average of the two experiments were taken into account if the trends were consistent. The test was repeated if the parallel trials differed widely, to make sure the test results were reliable.
2.3. Calculation Method
2.3.1. Principle of NMR Spectrometry
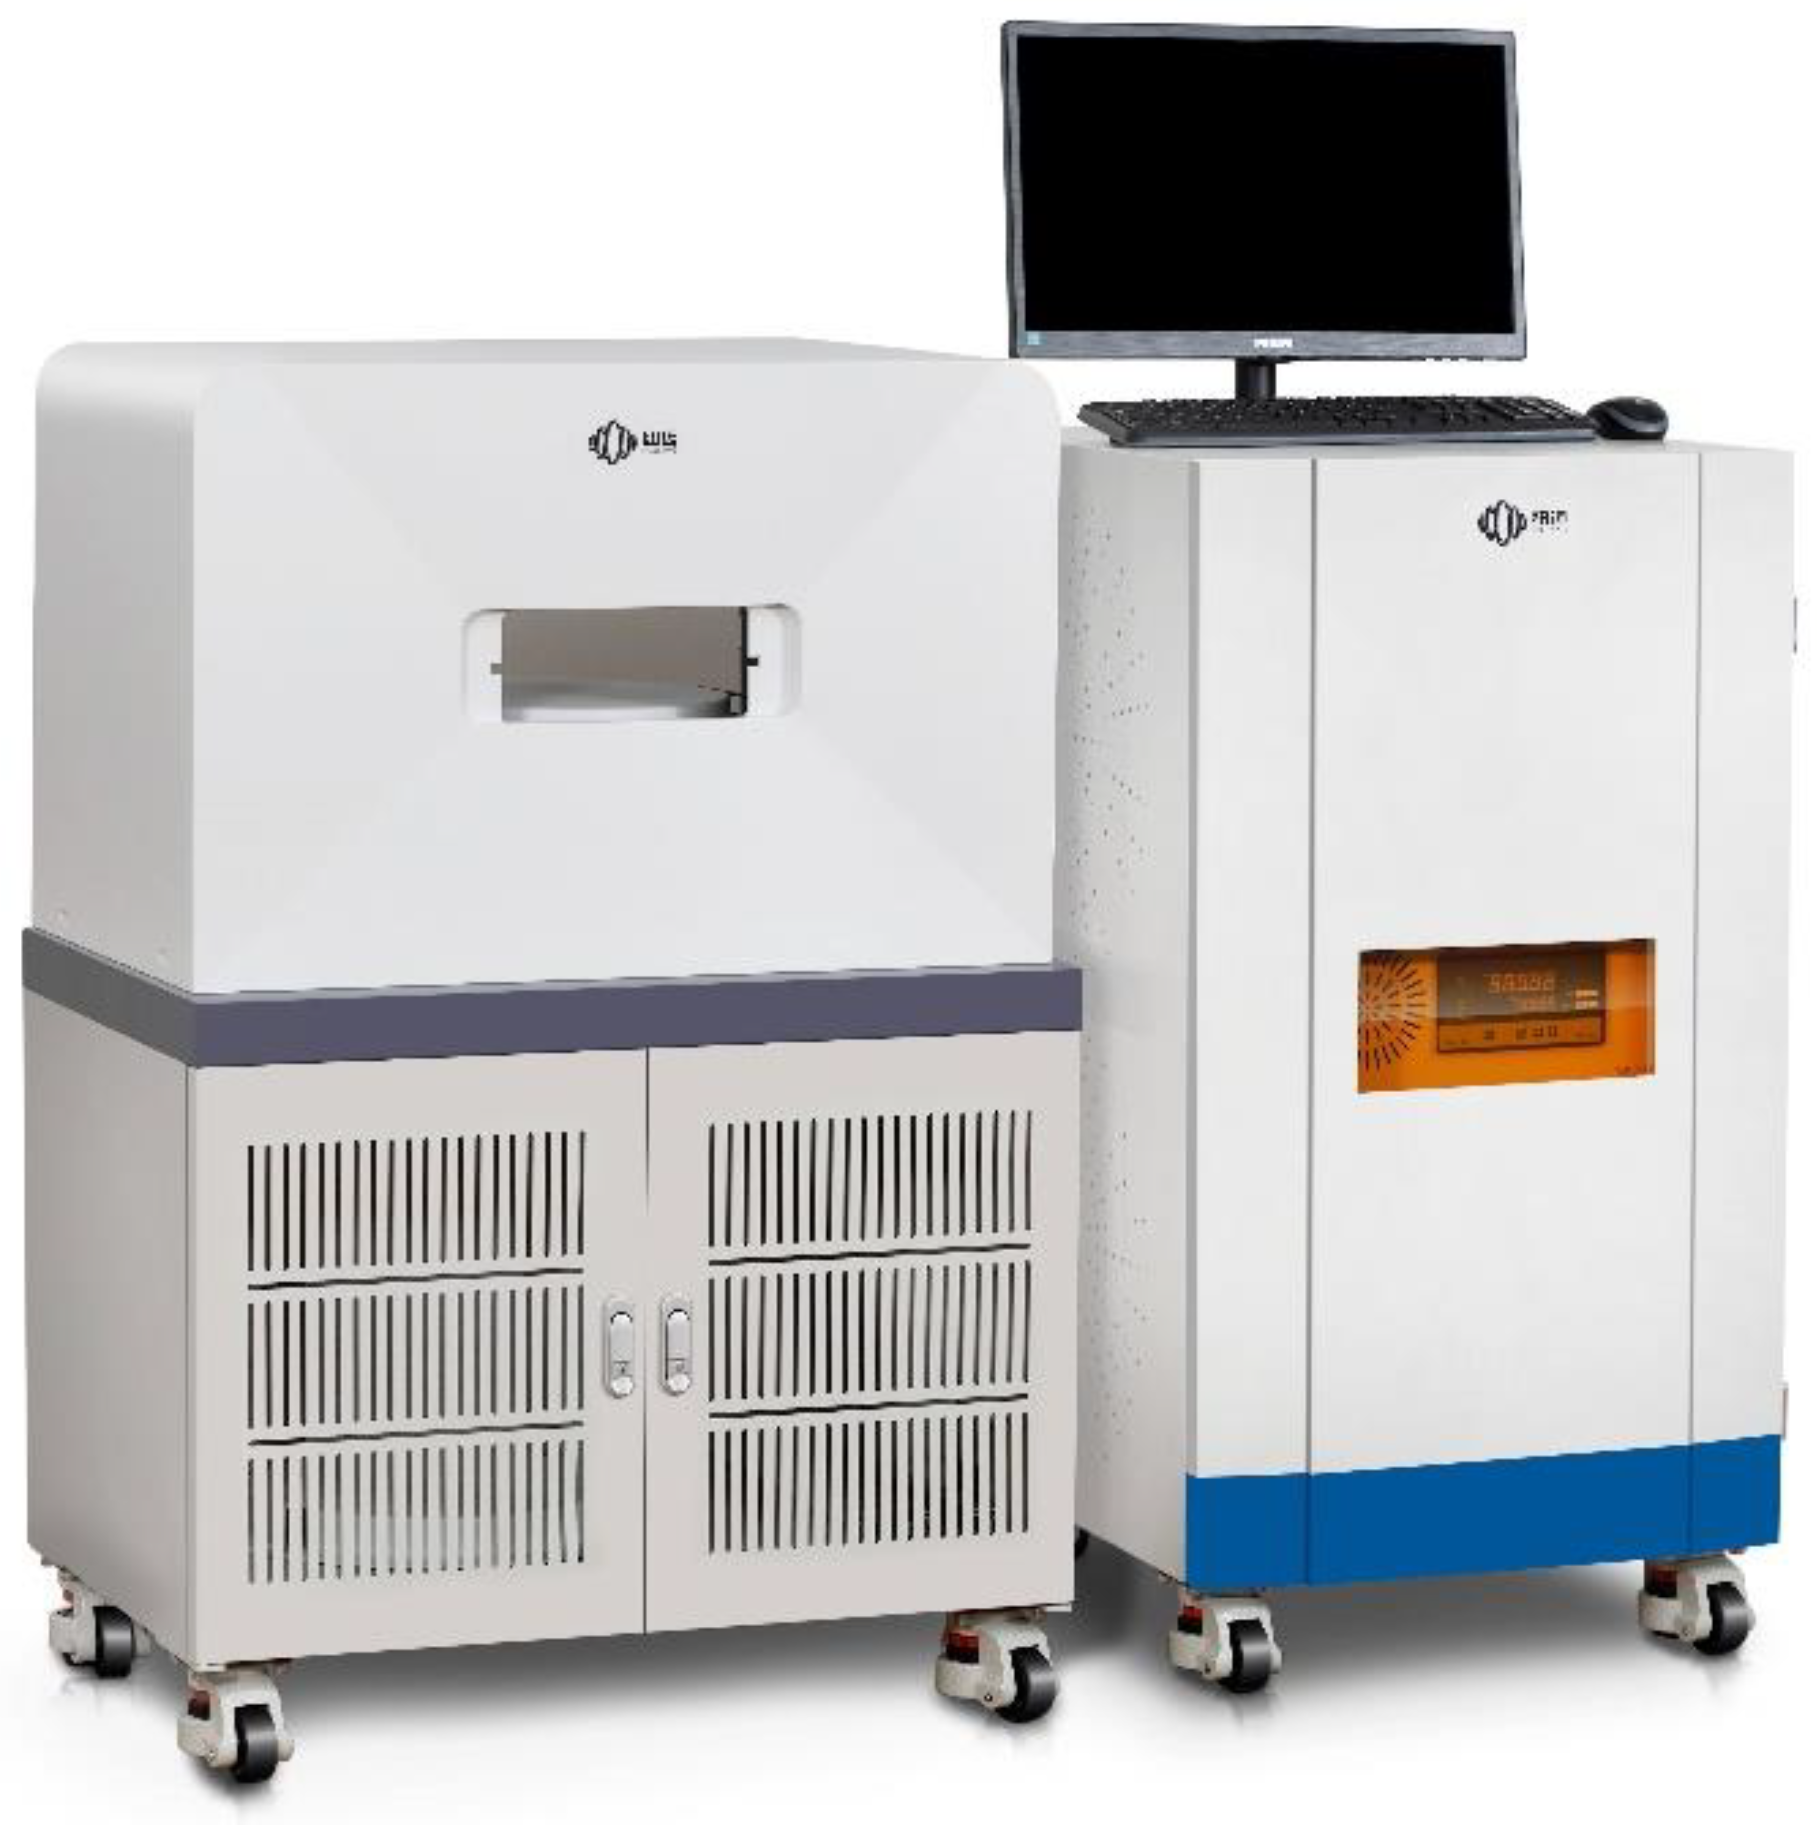
The MesoMR23-060H-I low-field NMR (Suzhou Niumag Analytical Instrument Corporation, Suzhou, China) equipment used is depicted in Figure 4. With the help of this equipment, the pore structure and fractal characteristics could be studied. The central principle of NMR is that a nucleus always spins around its own axis at a constant frequency, generating a magnetic field when the number of protons is odd and the number of neutrons is even. Because the H element in water follows this law, it can be used to calculate water content. Furthermore, the bound water and flow water can be distinguished by NMR spectra [38].
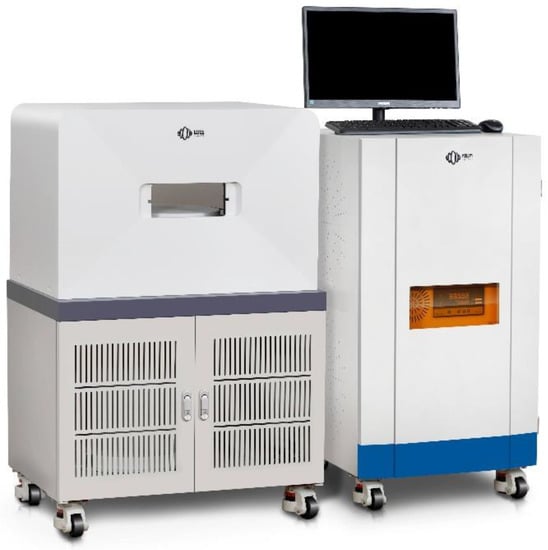
Figure 4.
Nuclear magnetic resonance (NMR) equipment.
The parameter T2, which is called transverse relaxation time, obtained from the NMR signal, was introduced to represent the time required for the transverse magnetization vector decaying to 37% of its maximum value. The T2 value conforms to the following formula [22]:
NMR operates on the principle of nuclear spin in a magnetic field. Hydrogen, which has an odd number of protons and an even number of neutrons, can be used to calculate pore water distribution. The relationship of pore radius R and T2 is given by Equation (2), in which ρ2 is the surface relativity, S represents the surface area of the pore, and V represents the volume of the water. Then, the size of the pores in the soil can be obtained by the T2 spectra [23]:
2.3.2. Principle of Fractal Dimension
Fractal dimension reflects the validity of space occupied by complex shapes, and it is a measure of the irregularity of complex shapes. Current studies show that the more complex the pore structure is, the stronger the heterogeneity and the higher the fractal dimension [36,37,38]. NMR tests can measure pore size distribution characteristics and characterize the heterogeneity of soil samples.
According to previous works, the pore structures of porous media show fractal characteristics and can be studied by fractal theory [39]. At present, fractal theory has been widely used in quantitatively describing and studying the geometric characteristics of the PSD [40]. The pore size distribution in a finer percentage by weight is as follows:
where R is the pore size and Rmax is the pore size accounting for the maximum percentage; M is the mass of pores whose size R is greater than the specific measurement scale Ra; Cm are constants related to pore shape and size; and is the pore density under the assumed conditions. For the fractal nature of soil pore size distribution, the fractal dimension D is strictly limited to the range of 0 < D < 3 [35].
The fractal dimension D can be obtained when the percentage of cumulative pore volume less than a certain value is known. Because the T2 value has a linear relationship with the pore size R, based on the equation to calculate moveable fluid space fractal dimension established by Zhou et al. [39], the fractal geometric approximation equation corresponding to pore size R can be expressed as
where SV (%) is the percentage of the pore volume, which is calculated by the pore size smaller than the specific pore diameter R to the total pore volume; D is the fractal dimension; and Rmax is the maximum pore size. After taking the logarithms, the model of fractal dimension D in PSD corresponding to the pore size R obtained by NMR is as follows:
3. Results and Discussion
3.1. Effect of Freezing Duration on the Pore Size Distribution
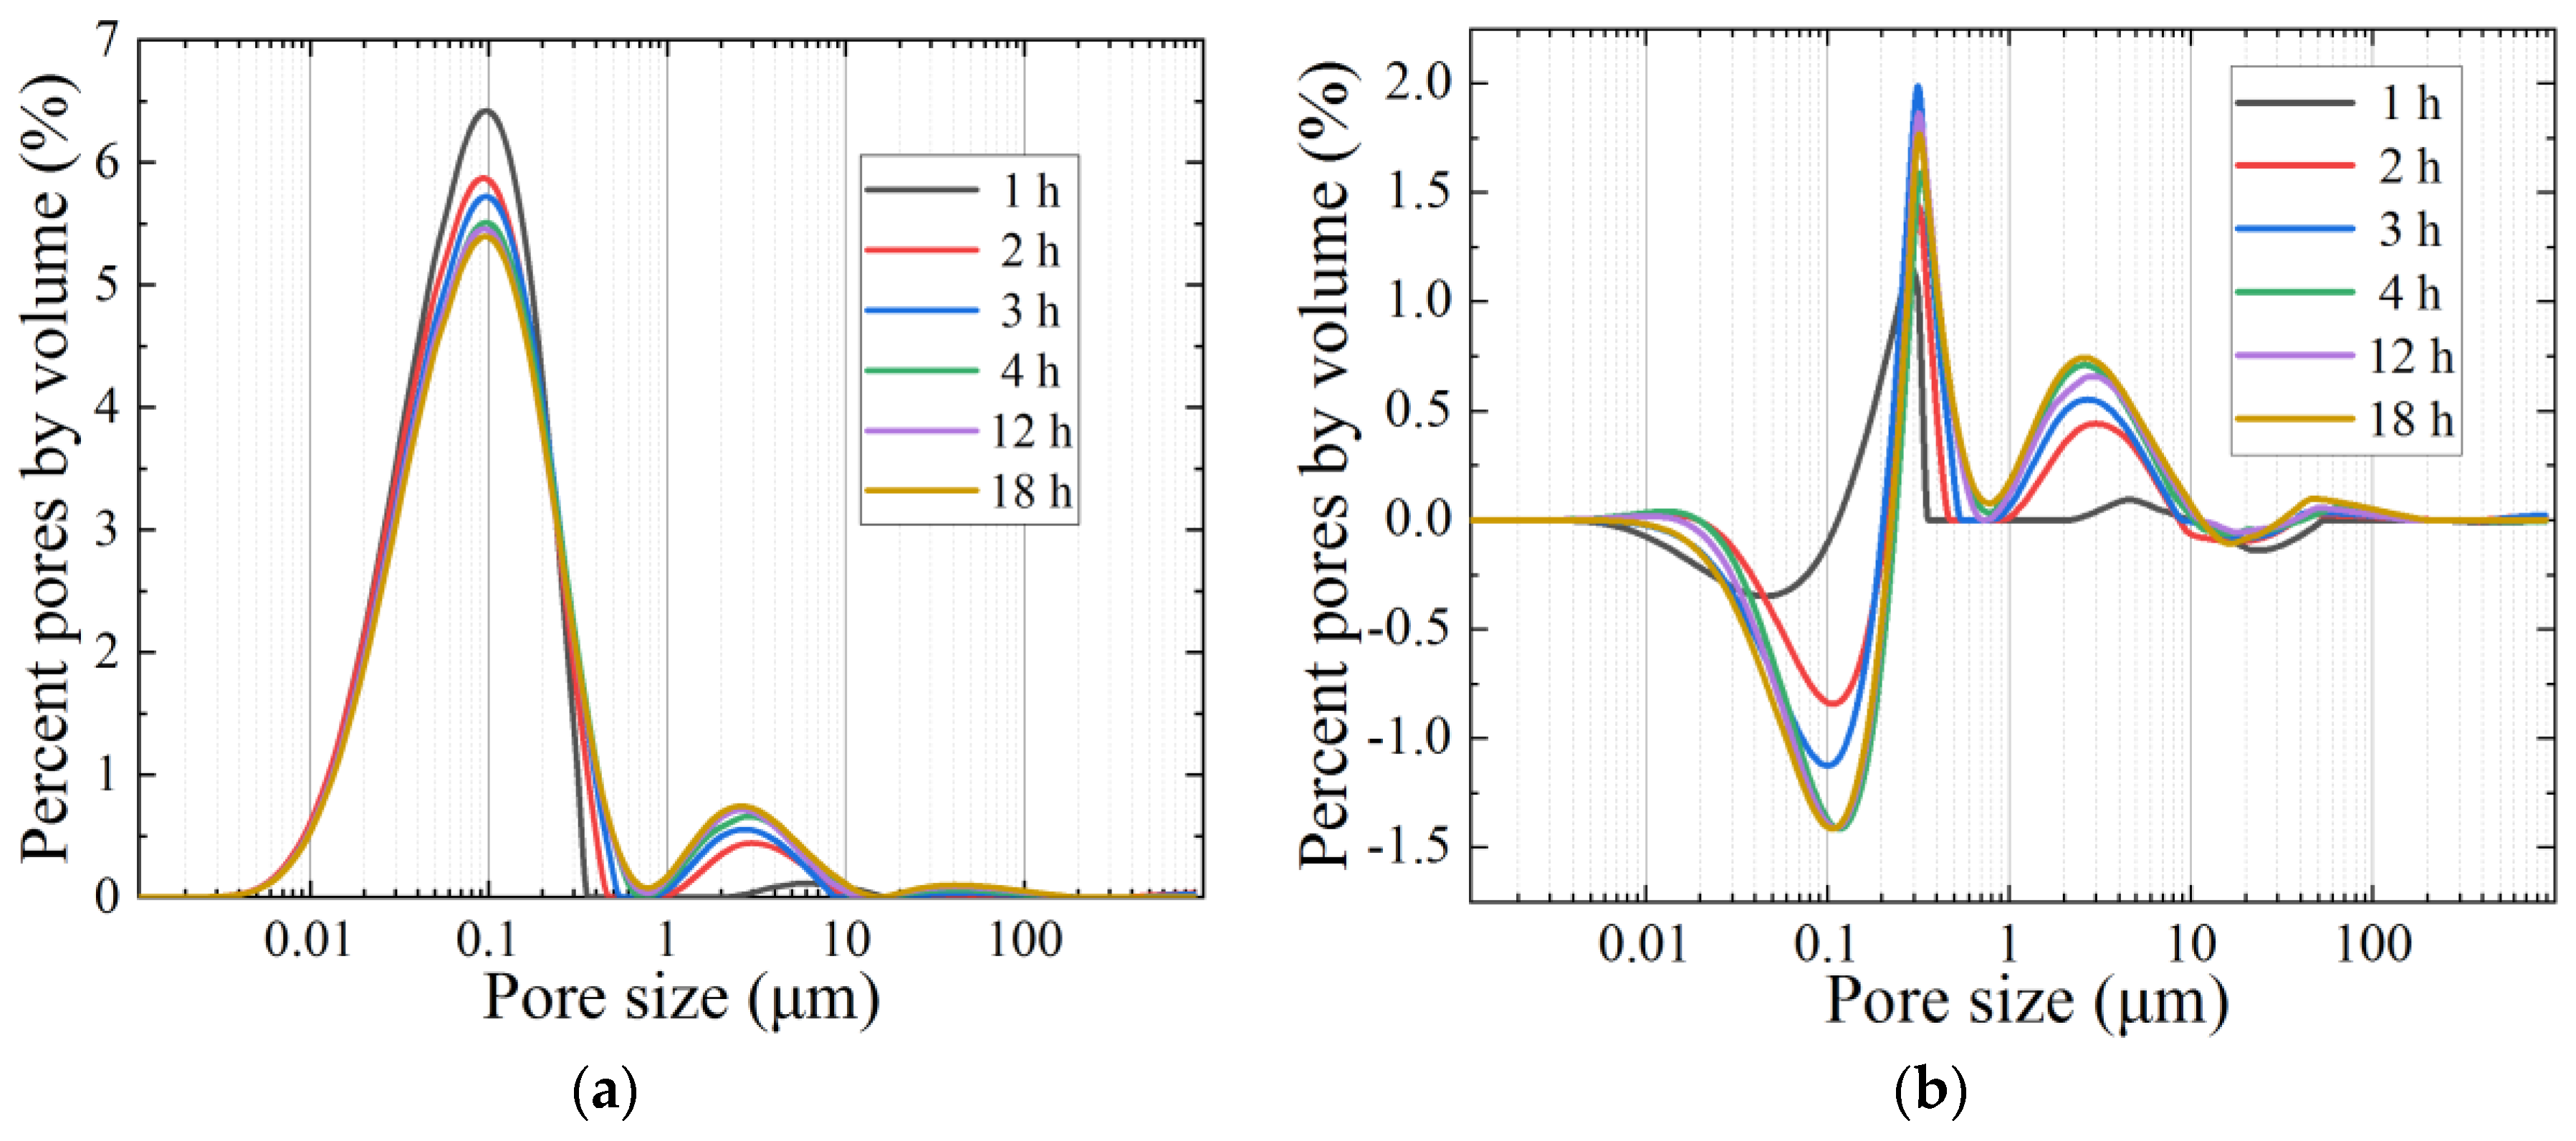
Figure 5a shows the pore distribution of frozen soil after thawing for 24 h at different freezing times. At this time, all the ice in the soil melts into water, and all signals can be detected. Between 1 h of freezing and 2 h of freezing, the pore distribution in the soil changed greatly. After 2 h of freezing, the peak proportion of small pores decreased by nearly 0.5%, and the peak proportion of mesopores increased by nearly 0.5%. The changes in soil pores within 2–18 h of freezing are the same as those in the two hours before freezing. This indicates that during the whole freezing process, the freezing speed of water decreased sharply with a time increase.
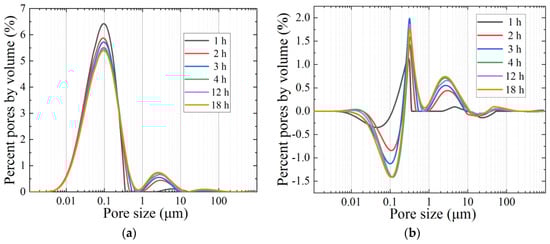
Figure 5.
Effect of freezing duration: (a) pore size distribution; (b) differences in the pore size distribution.
It is known that unfrozen water is a key part in determining the physical properties of frozen soils [41]; however, for frozen–thawed soil, the water in the frozen part is the key cause of soil microstructure damage. In order to better explain the principle of freezing failure, Figure 5b plots the change in porosity proportion under different freezing durations. There is little difference in pore changes between freezing for 6 h and freezing for 18 h, indicating that for the sample size selected in this paper at −20 °C, the freezing process is mostly completed after freezing for 6 h, and the freezing process is basically completed after freezing for 18 h. After six hours of freezing, the freezing time was no longer the main cause of soil microstructure damage [13].
3.2. Effect of Freezing Pressure on the Pore Size Distribution
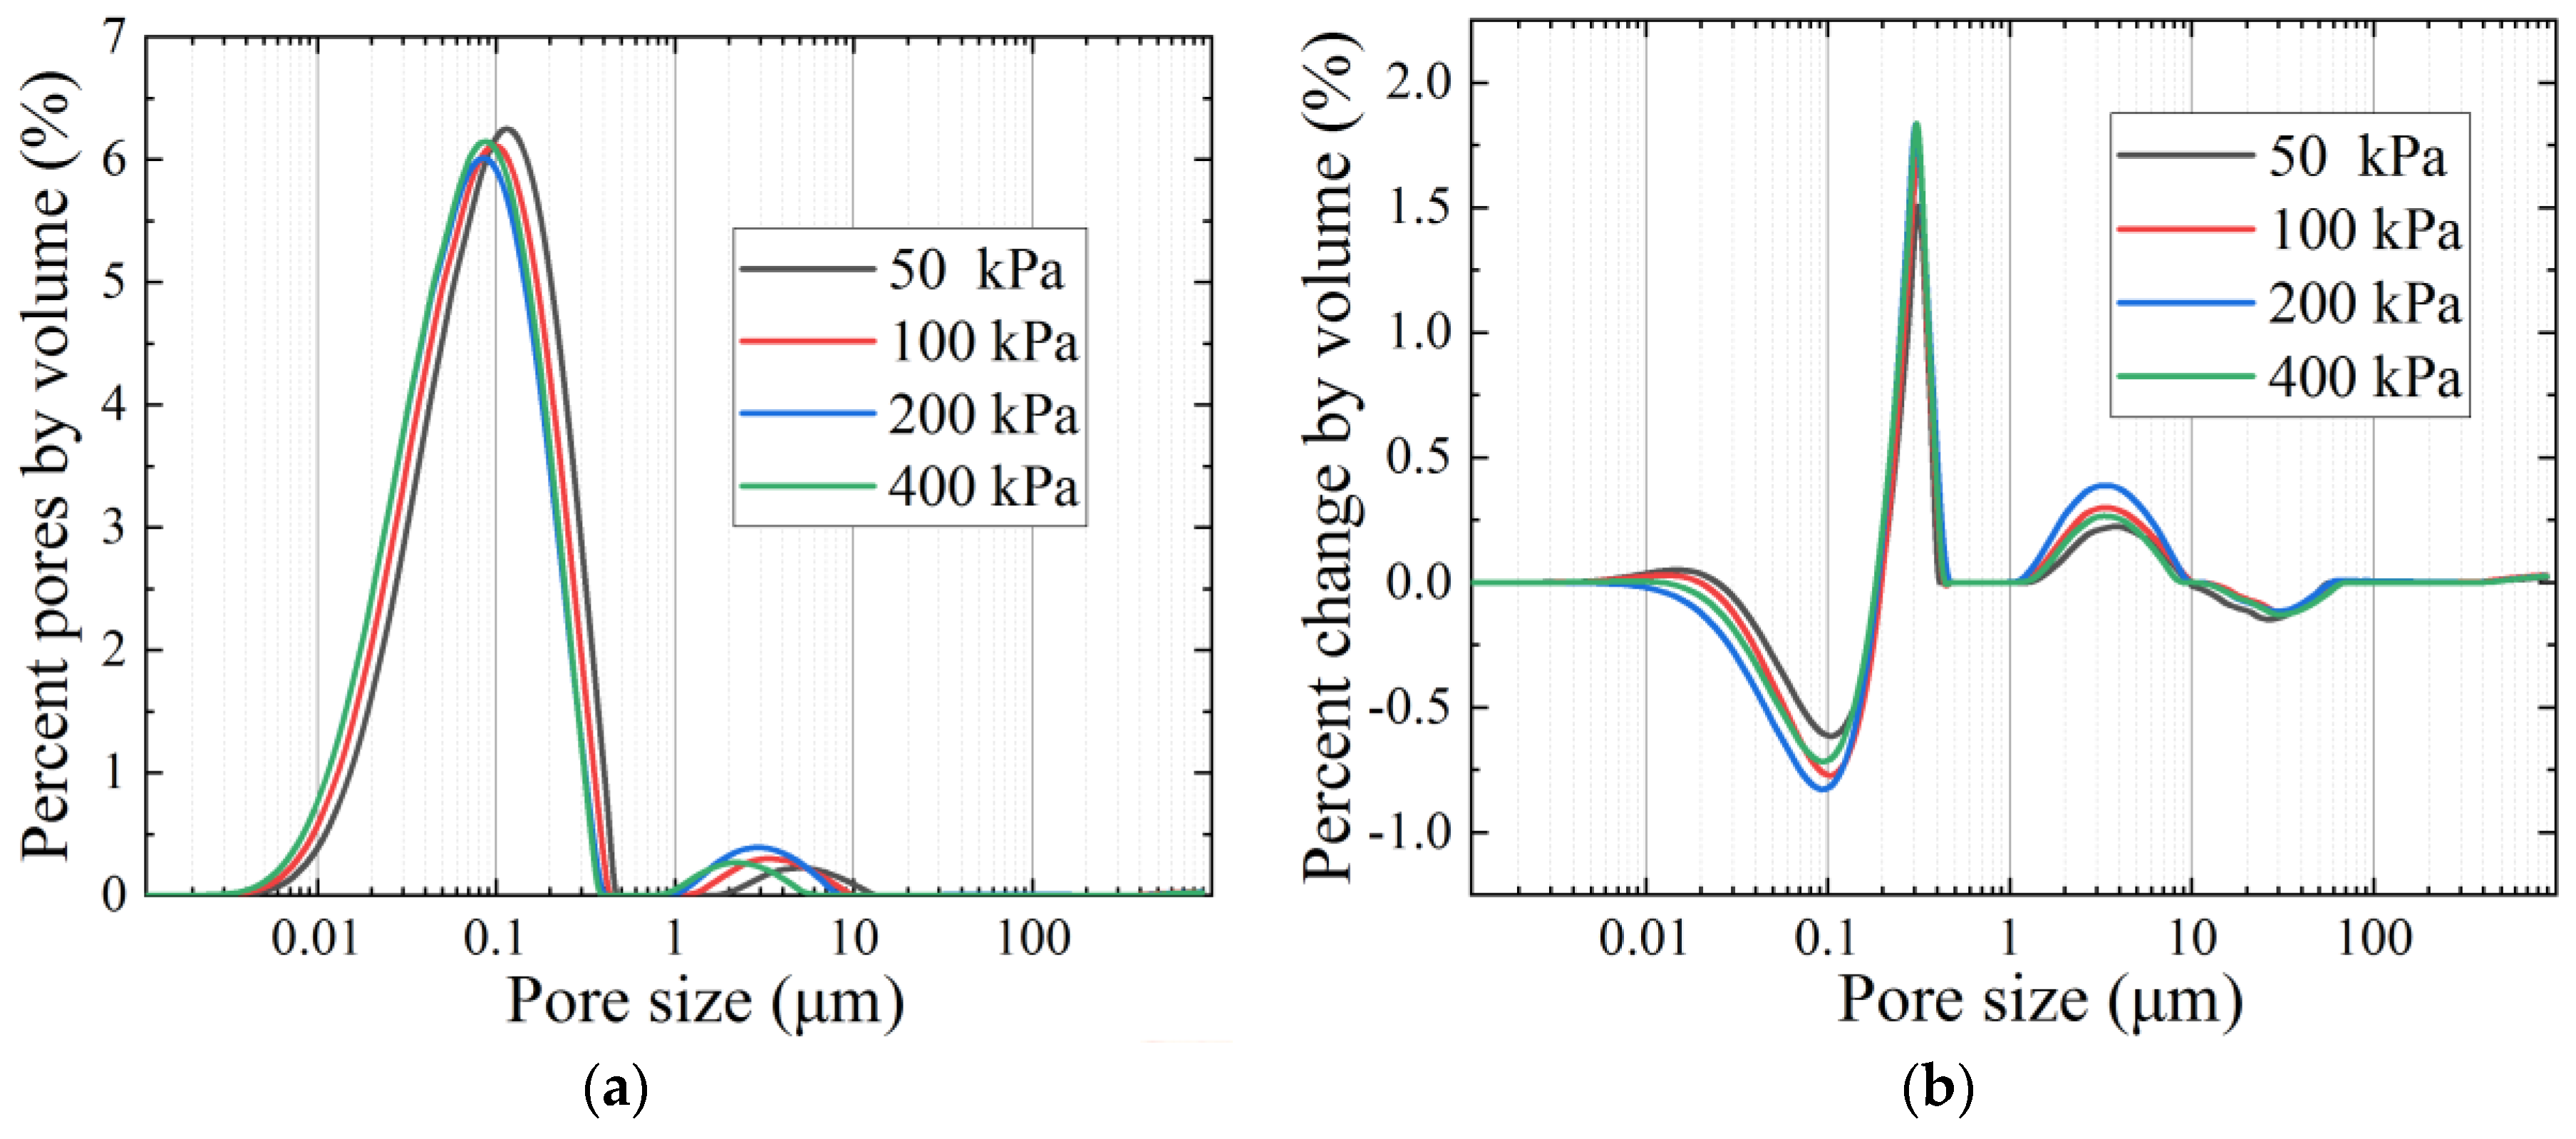
From the previous section, the proportion of smaller sized pores decreases while the proportion of pores of a larger size increases after the freeze–thaw cycle. Overburden earth pressure during the actual construction can influence the degree of pore size change. As pressure is applied to the soil samples during freezing and thawing, the effect of pressure on the proportion of pore sizes can be obtained by comparing the changes of soil pore distribution under different pressures. Figure 6a,b shows that the proportion of pore sizes of 0.01–0.2 μm decreases, and the pore size of 0.2–0.4 μm increases significantly. The proportion of 1–10 µm pore size increases, and the 10–100 µm pore size decreases to 0. In the selected pressure range, after the freezing confining pressure exceeds 100 kPa, the effect of freezing on the change of soil pores of 0.2–1 μm becomes small. It can be seen from the change of pore size distribution that, when freezing under a certain confining pressure, the water in small pores is difficult to freeze, and the freezing ratio of water in the mesopores decreases as the pressure increases. During the melting process, the pore volume of the mesopores is greatly reduced under the dual action of confining pressure and self-weight. In terms of pore size, the greater the pressure applied to the soil sample during the freezing and thawing process, the lower the percentage the middle pores occupied, and the larger the percentage the tiny pores occupied.
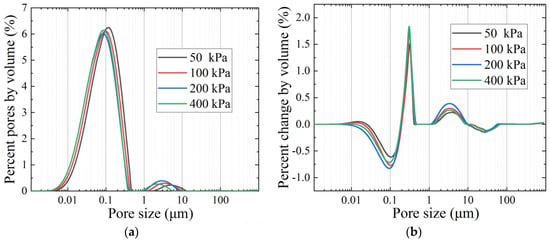
Figure 6.
Effect of freezing pressure: (a) pore size distribution; (b) differences in the pore size distribution.
3.3. Effect of Freezing Temperature on the Pore Size Distribution
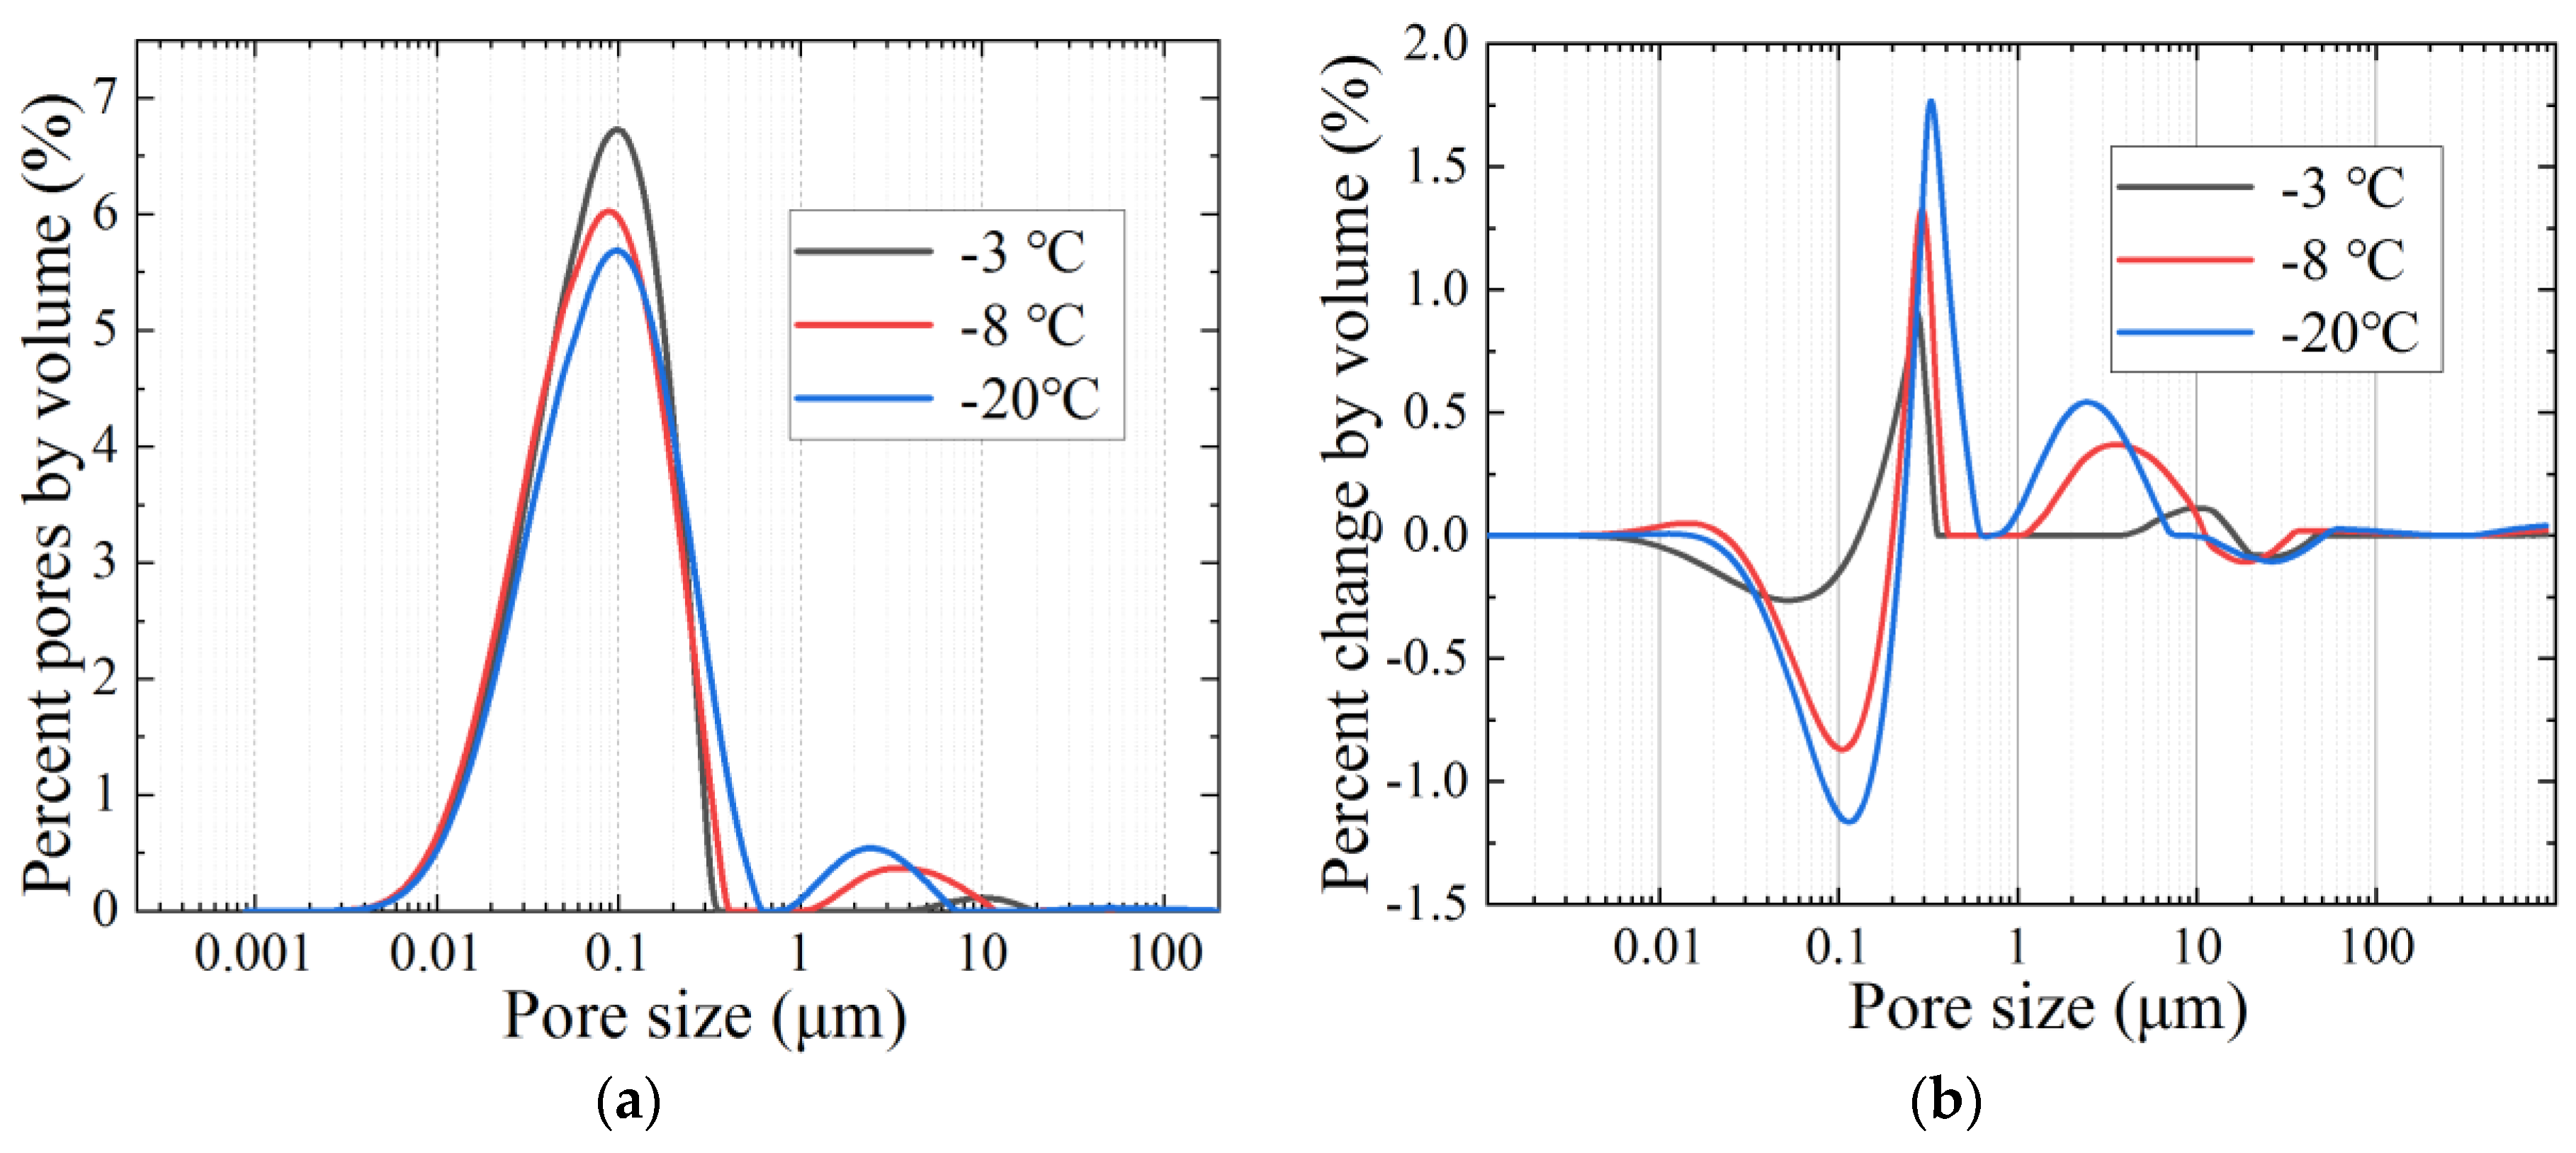
Figure 7a shows the pore distribution of frozen–thawed soil at different freezing temperatures. With the decrease of the freezing temperature, the peak value of the proportion of small pores decreases, while the proportion of medium pores increases. In Figure 7b, as the temperature dropped, the percentage change of pore size from 0.01 μm to 0.2 μm decreased and formed a main trough. At the same time, the percentage change of pore size between 0.2 μm and 1 μm increased to form a main peak. It is quite clear that the increase of the main peak was a result of the reduction of pores from 0.01 μm to 0.2 μm in diameter.
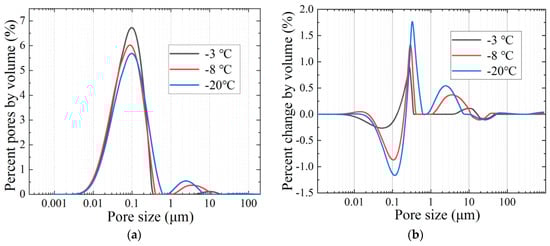
Figure 7.
Effect of freezing temperature: (a) pore size distribution; (b) differences in the pore size distribution.
From the percentage change in different freezing temperatures, the lower the temperature applied to the soil sample during the freezing process, the greater the peak value of the sub-peak. This is because the proportion of frozen water increases with the temperature decrease. The bound fluid in soil cannot be frozen easily under the action of hydrogen bonds, while the movable fluid can be frozen totally in a short time. Thus, the freezing effect is more obvious in larger pores, which occupy the vast majority of movable fluid.
3.4. Fractal Dimension of Frozen–Thawed Soil
From Section 3.3, it can be seen that the freezing action affects the distribution of pores in soil. The variation of pore distribution in soil results in the change of fractal dimensions of the soil pores. The pore distribution has self-similarity, so it can be characterized by fractal theory. Fractal dimension results from the NMR test can be calculated by linear fitting of two fluid types, which can be distinguished by 2.8 ms for T2 value [13]. In this paper, Db is the fractal dimension of the bound fluid pore, while Dm is the fractal dimension of the pore of movable fluid. Based on Formula (5), it can be concluded that
If the pores have a self-similar pore structure and fractal characteristics, then Equations (6) and (7) present linear relationships between lgSv and lgR. The calculated fractal dimension values for the NMR test are listed in Table 2.
Table 2.
Statistical results of nuclear magnetic resonance (NMR) fractal dimensions.
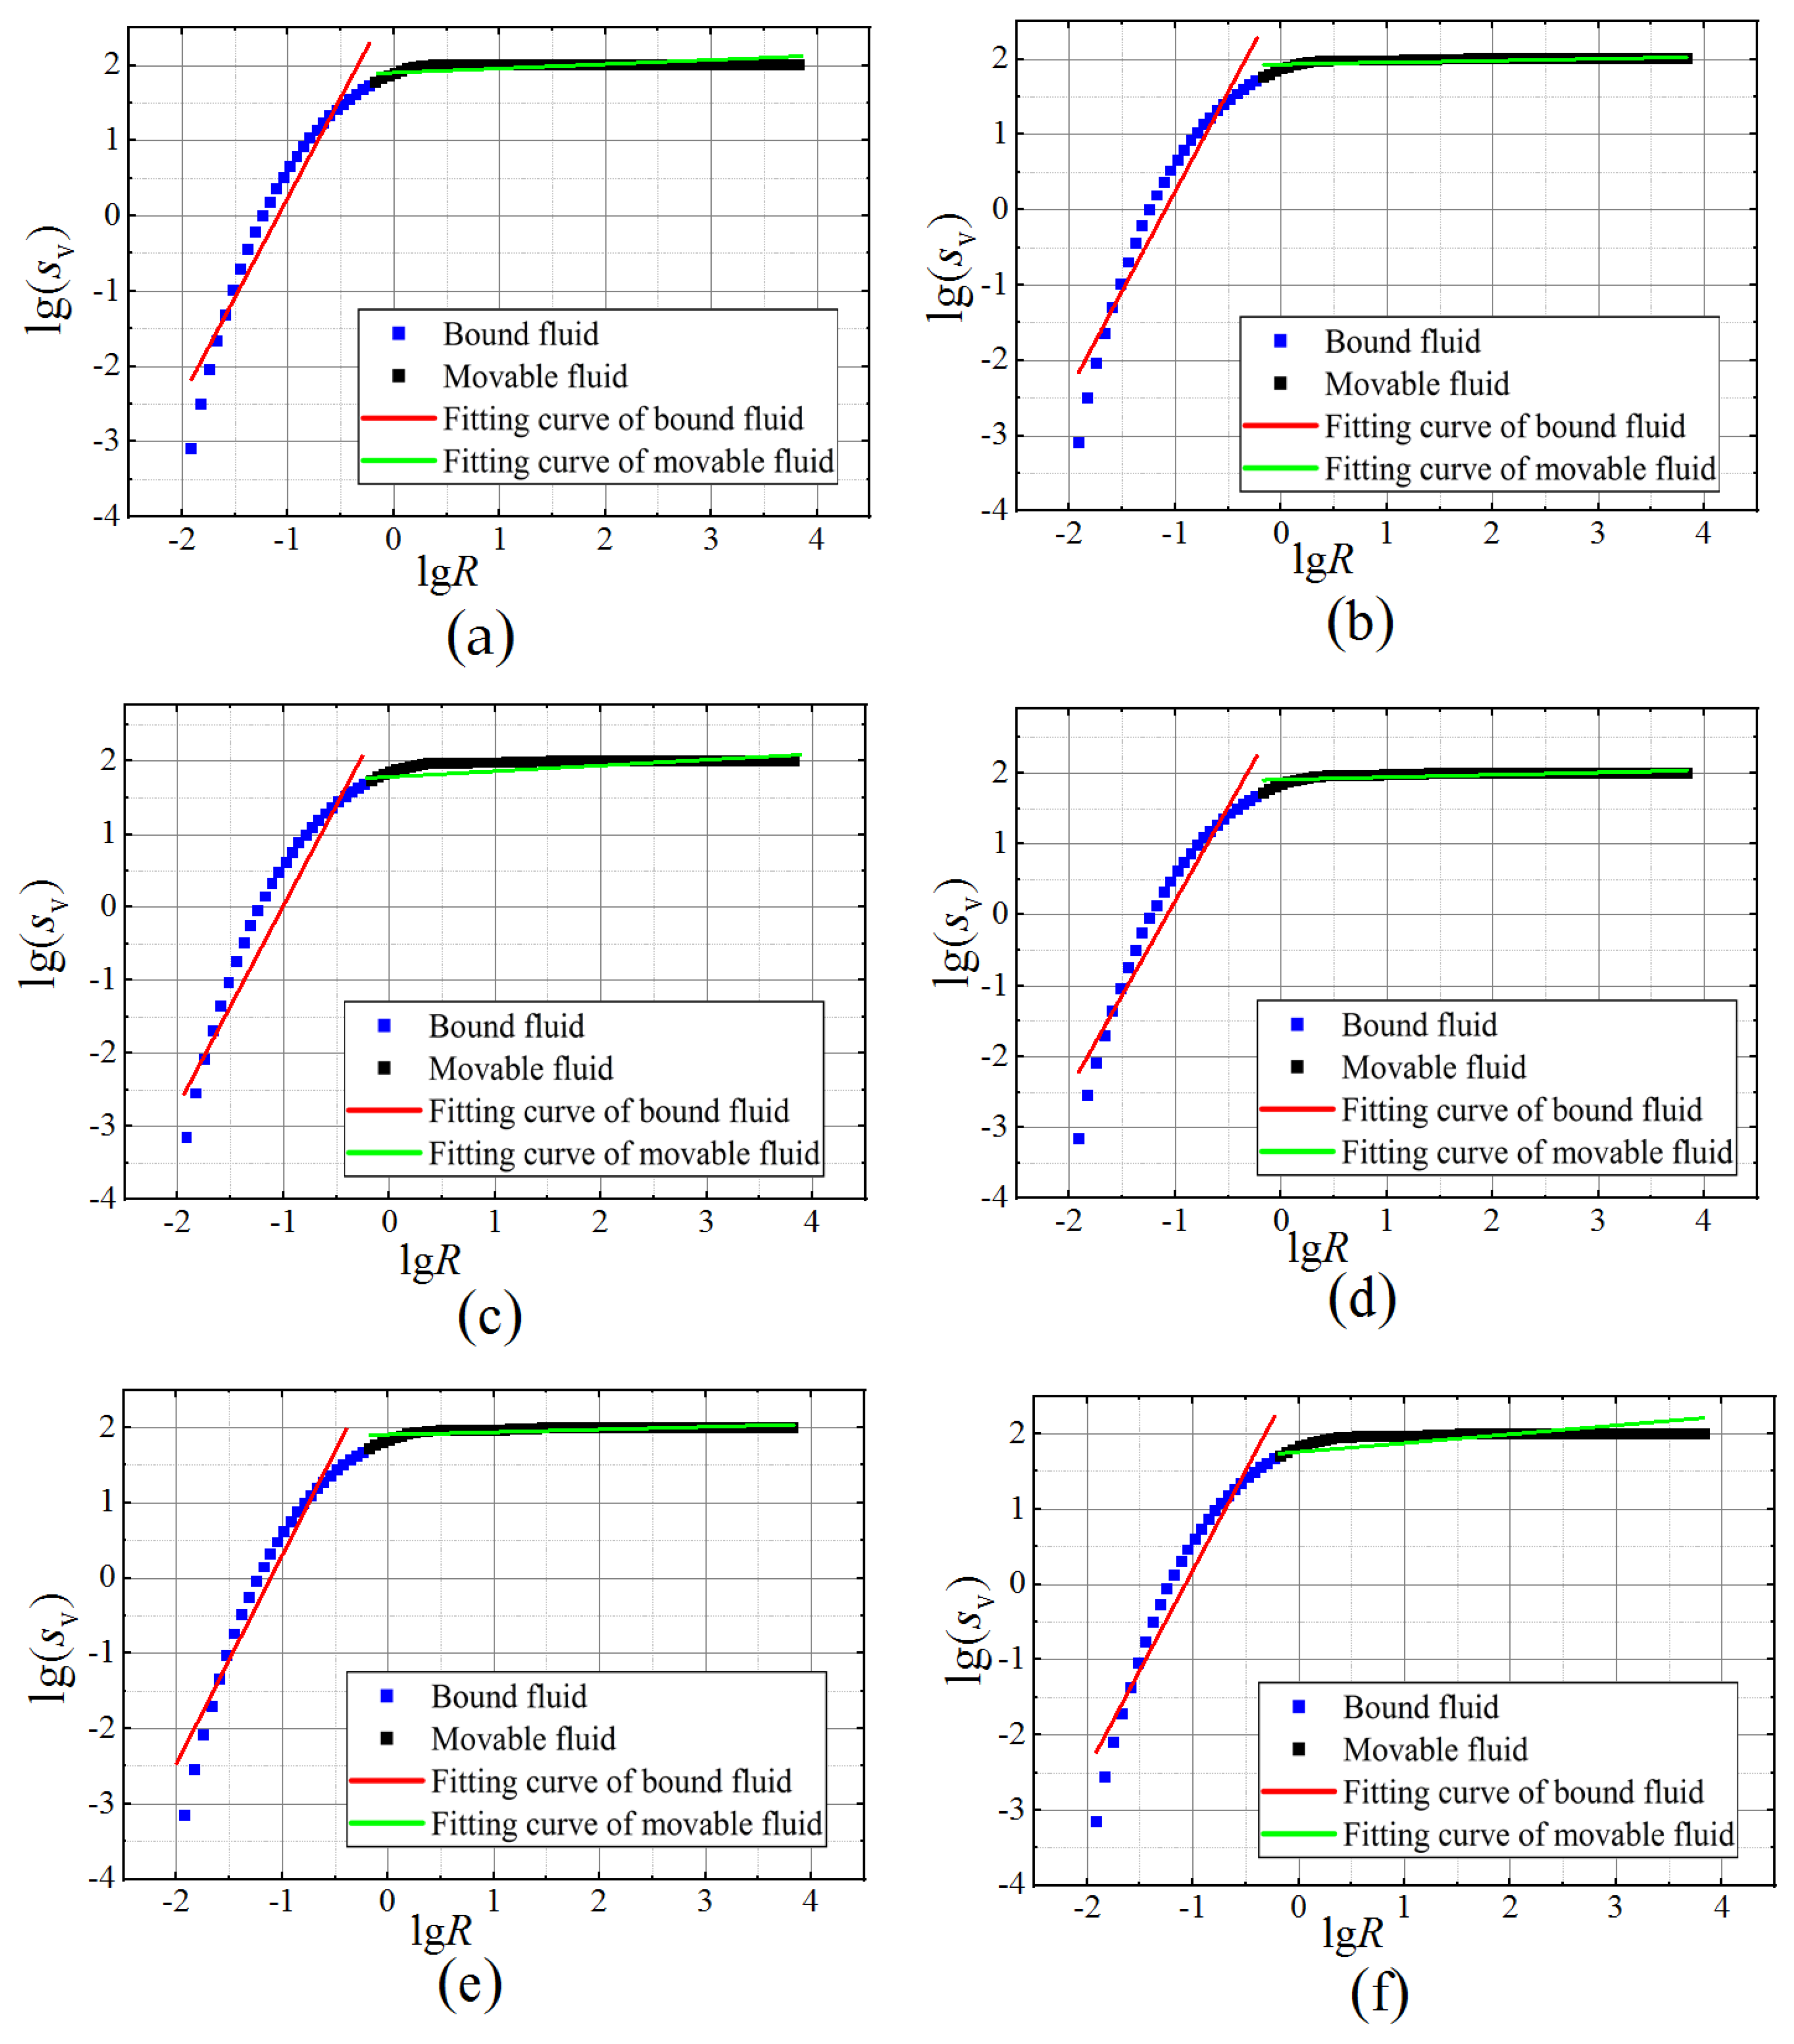
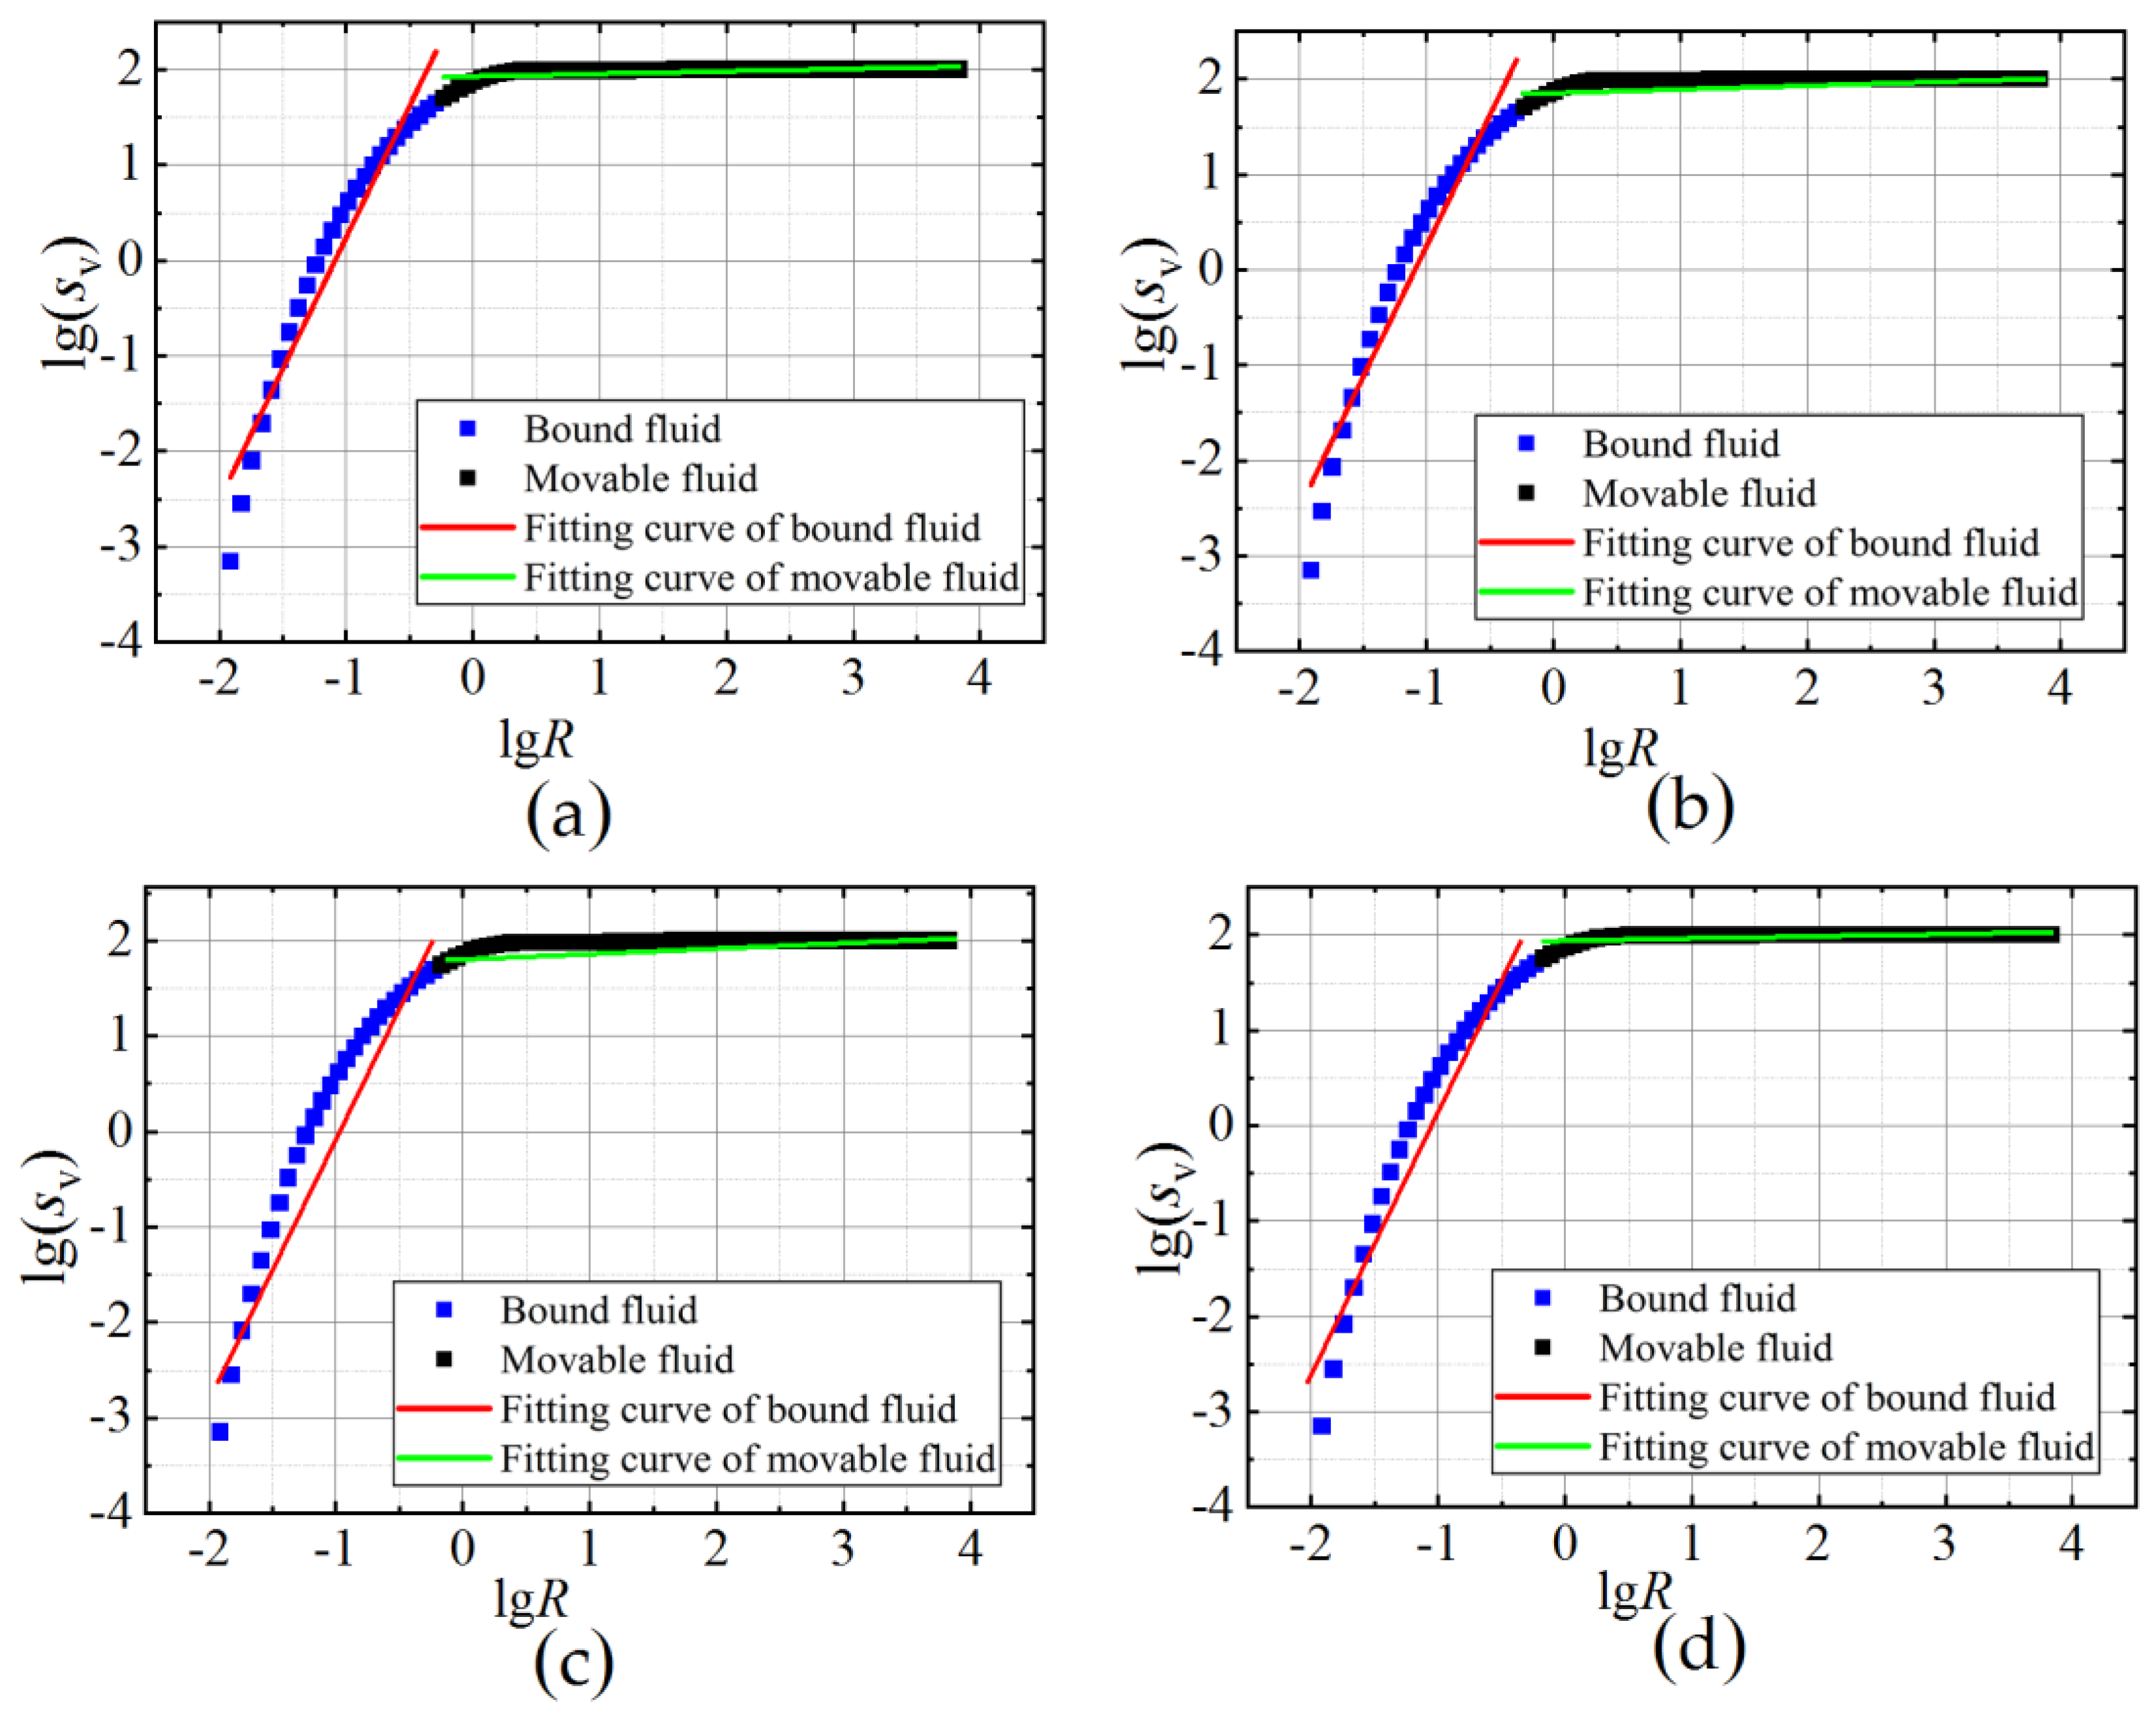
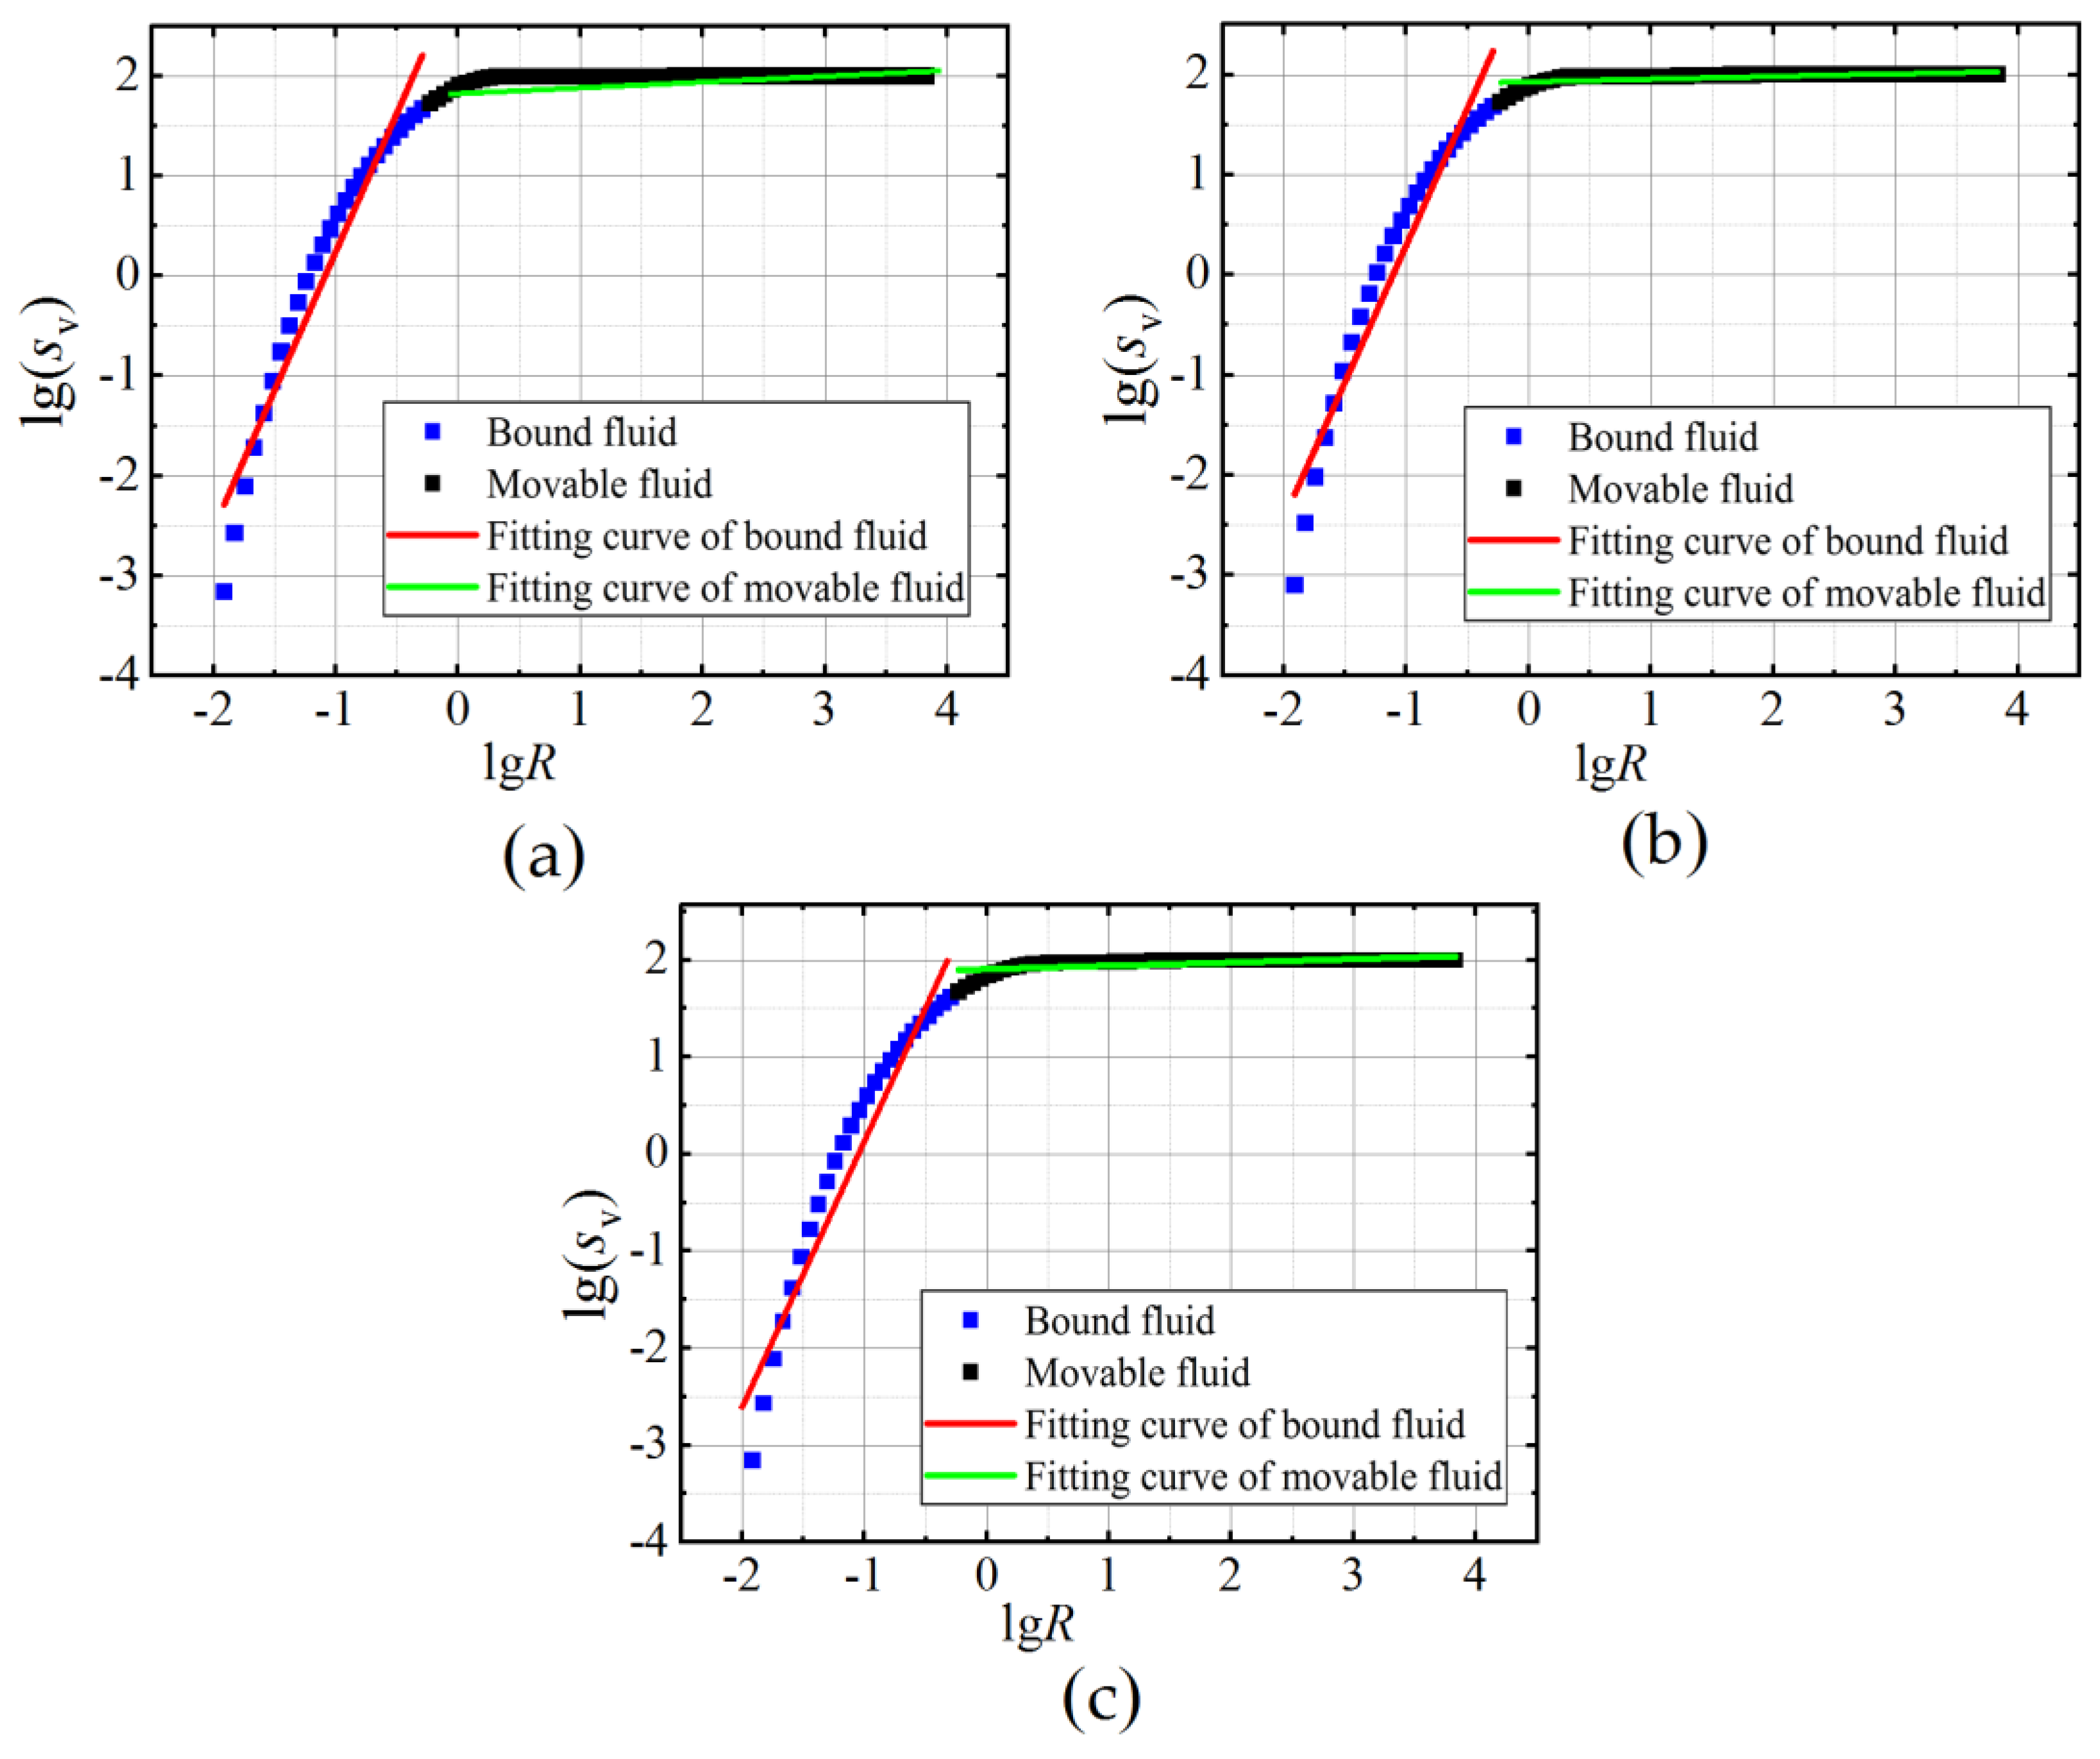
The lgSv-lgR curves of soil samples under various freezing durations, freezing pressures, and freezing temperatures are shown in Figure 8a–f, Figure 9a–d and Figure 10a–c, respectively. Based on Equation (8), the fractal dimension of the bound fluid and movable fluid is obtained through the regression analysis. The red lines in the figures represent the fitting line of the bound fluid, while the green lines represent the fitting line of movable fluid. The fitting results of fractal dimensions of freezing duration, freezing pressure, and freezing temperature all comply with the fractal law. The correlation coefficient (R2) of all specimens is 0.49–0.78 for Db and 0.86–0.94 for Dm. In these figures, the fractal characteristics of movable fluid are more obvious than those of bound fluid, indicating that frost heave and thawing settlement mainly affect macropores in the specimens. Further explanation is given in the next section.
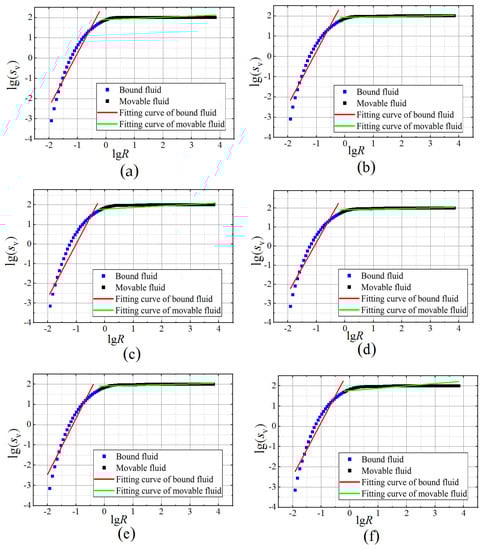
Figure 8.
The lgSv-lgR curves under various freezing durations: (a–f) represent 1 h, 2 h, 4 h, 6 h, 12 h and 18 h, respectively.
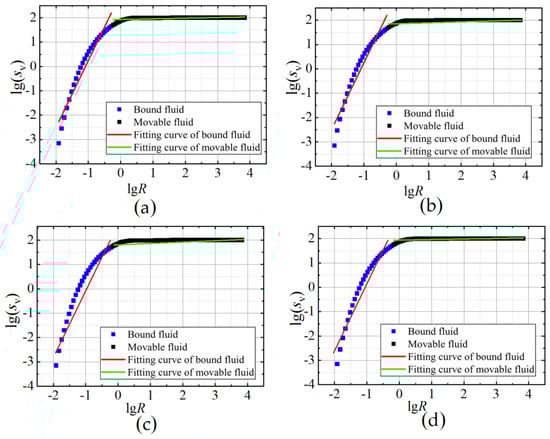
Figure 9.
The lgSv-lgR curves under various freezing pressures: (a–d) represent 50 kPa, 100 kPa, 200 kPa and 400 kPa, respectively.
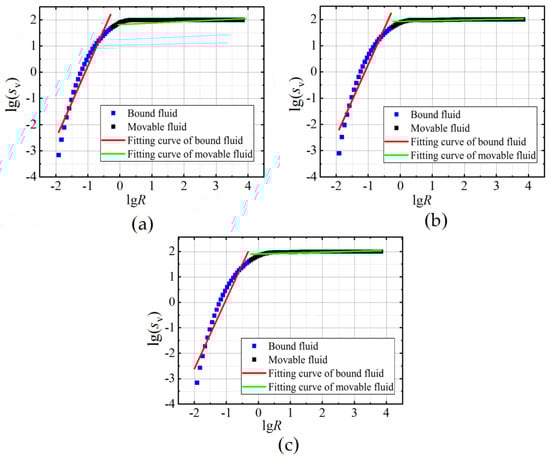
Figure 10.
The lgSv-lgR curves under various freezing temperatures: (a–c) represent −3 °C, −8 °C and −20 °C, respectively.
4. Discussion
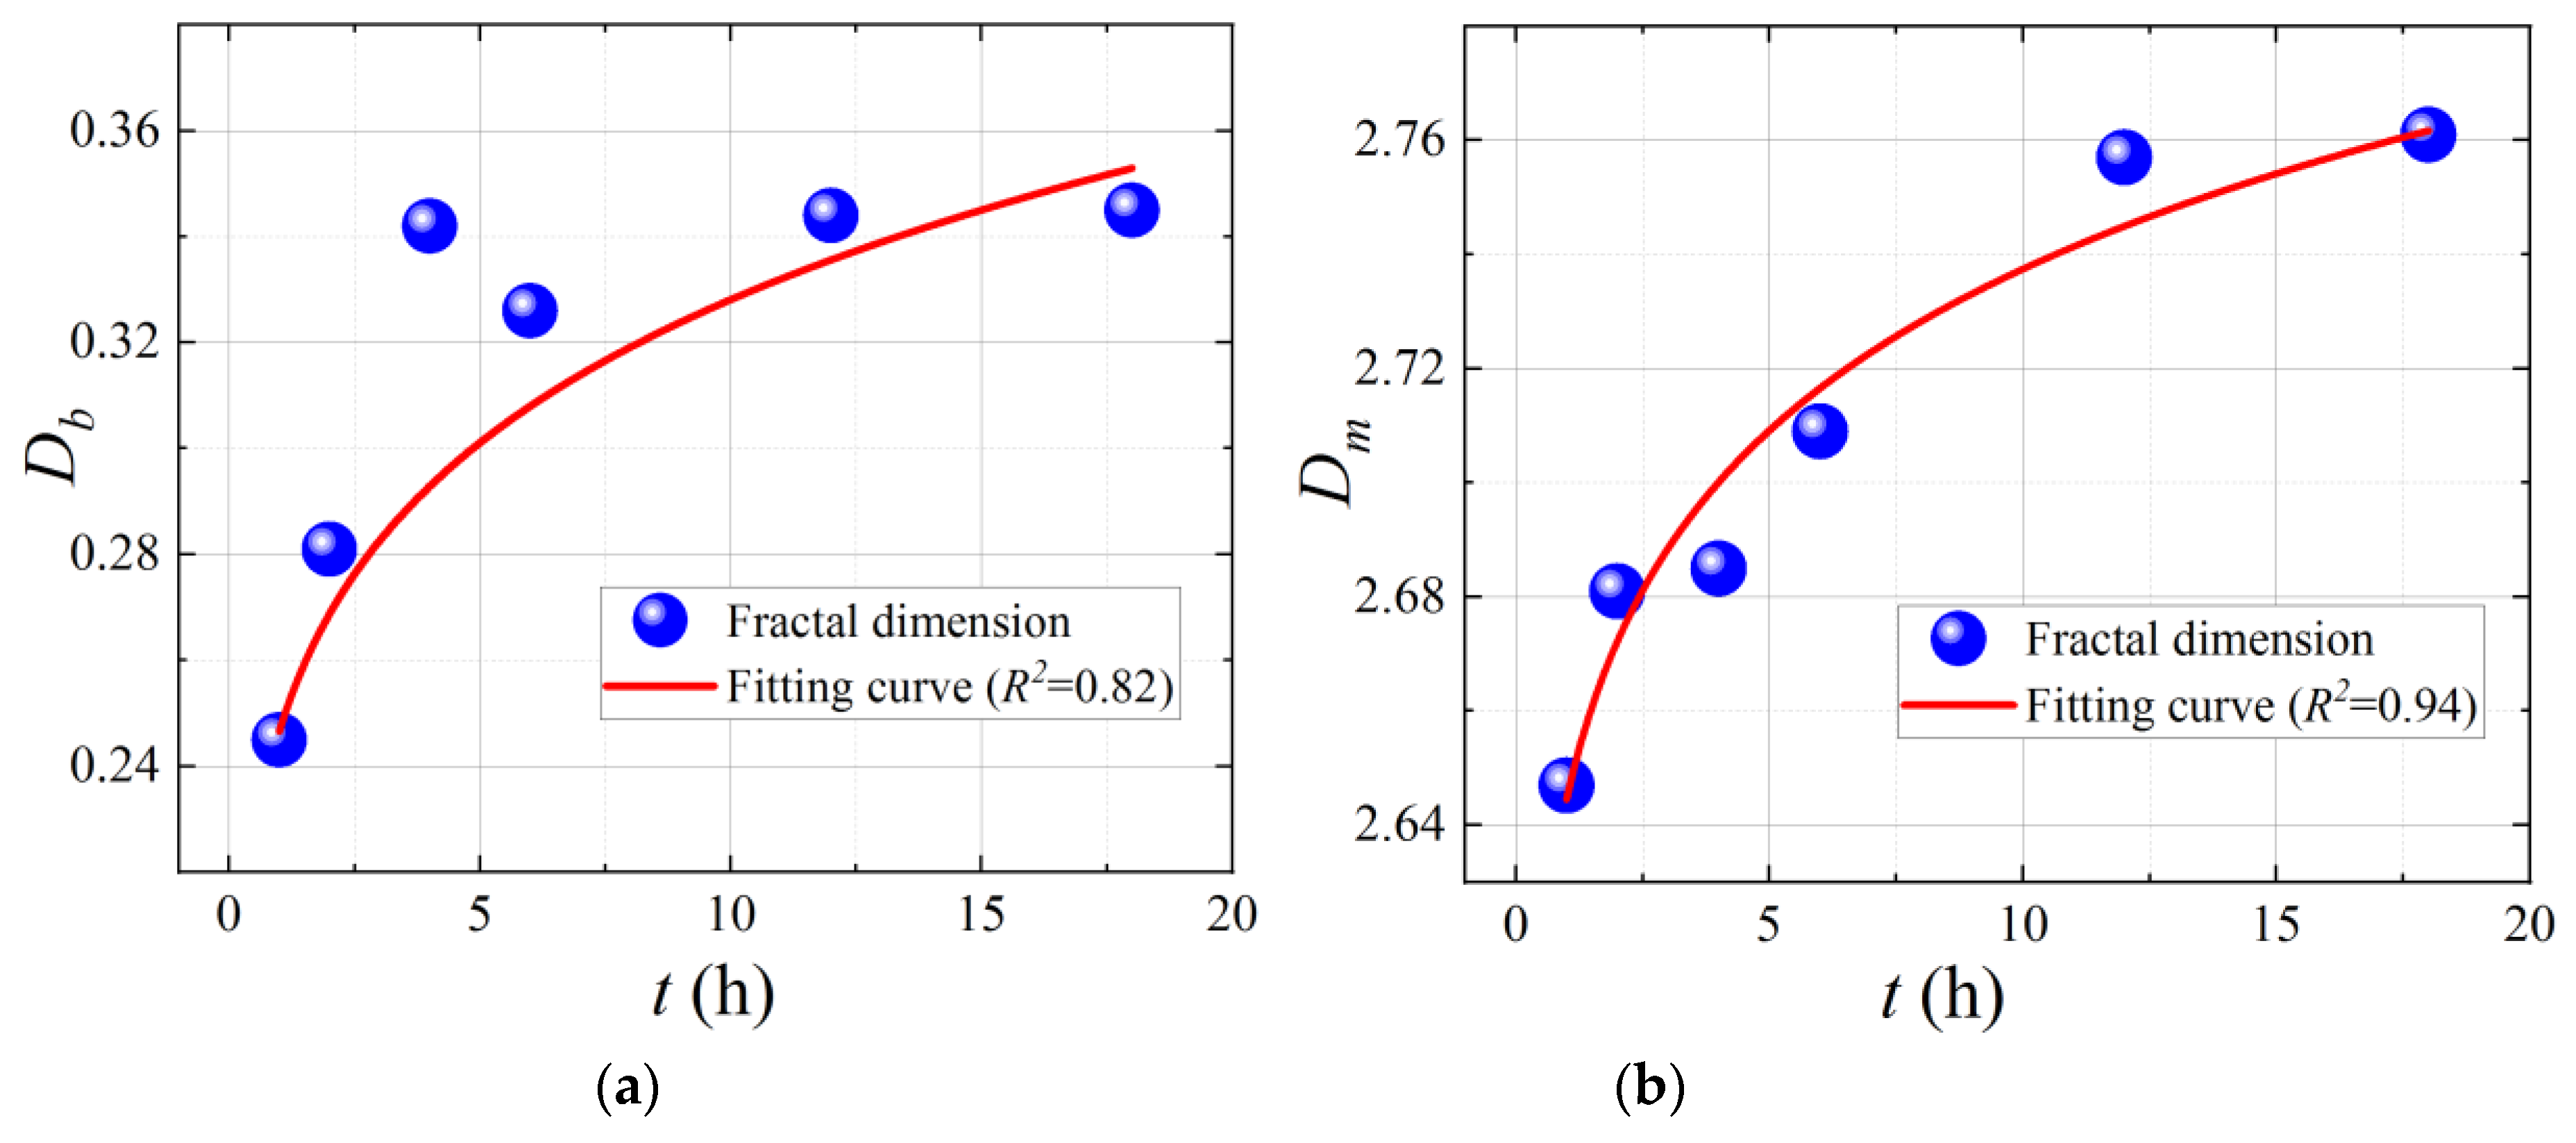
The freezing process of water in soil is fast at first and then slow, as specified in reference [13]. It can be seen from Figure 11 that the fractal dimension of pores in soil can be reflected by associating the Db and Dm values measured by NMR with freezing duration, as follows:
where D is the fractal dimension values, t is the freezing duration, a is the parameter related to soil structure properties, and b is related to the degree of freezing failure. The value of a and b is shown in Table 3. The fractal dimension increases with the freezing duration and tends to a fixed value a. A large proportion of the freezing process was concentrated in the first 6 h. Considering the energy required to freeze water, the movable fluid will be frozen quickly, and the bound fluid could be partly frozen, with the freezing time growing during the freezing process. Water freezing can break the structure of the soil’s skeleton, so the fractal dimension grows as the freezing progresses.

Figure 11.
Fractal dimension under various freezing durations: (a) fractal dimension for bound fluid; (b) fractal dimension for movable fluid.
Table 3.
Summaries of model parameters for fractal dimension under various freezing durations.
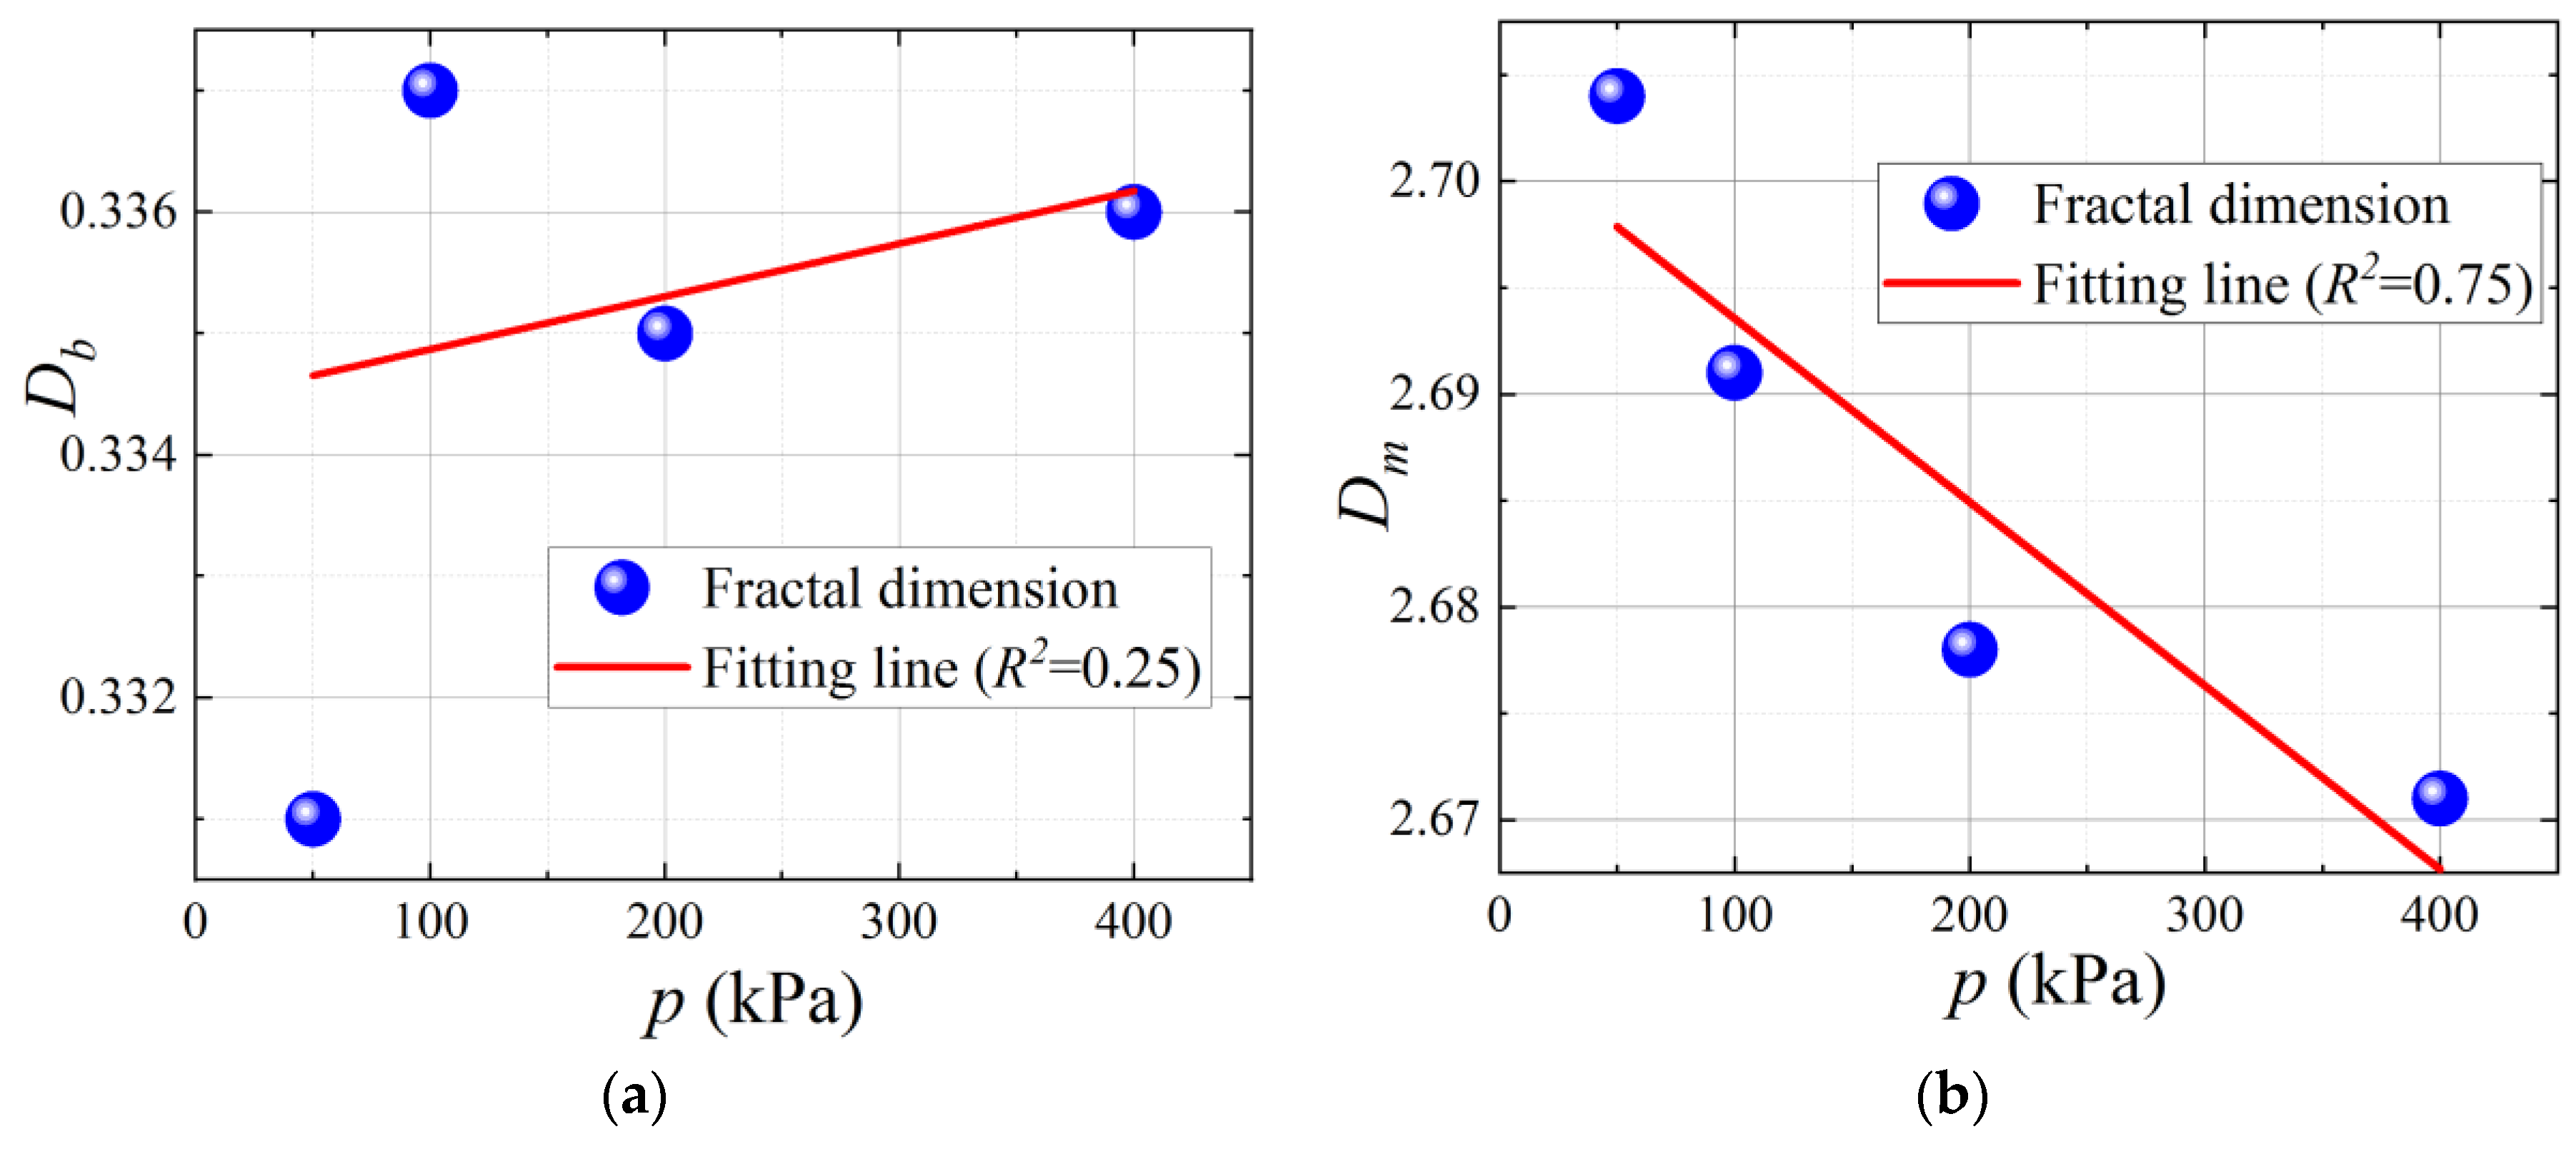
Figure 12 shows that the value of Db has no apparent linear relationship with the freezing pressure, while Dm is negatively correlated with the value of freezing pressure. The reason is that, for frozen-thawed soil, fractal dimension change is the result of frost heave action during freezing progress. When water freezes under a certain confining pressure, the freezing proportion of the water in the mesopores decreases. When the ice melts under a certain confining pressure, the pores’ structure is compressed greatly under the dual action of confining pressure and dead weight. In conclusion, the greater the pressure applied to the soil samples during freezing and thawing, the less the effect from frost heaving, and the lower the fractal dimension value of the thawing soil’s structure.
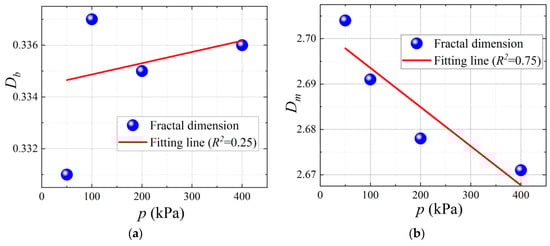
Figure 12.
Fractal dimension under various freezing pressures: (a) fractal dimension for bound fluid; (b) fractal dimension for movable fluid.
Figure 13a,b shows the relationship between fractal dimension and freezing temperature, and the degree of damage to the pore structure caused by freezing temperature can be clearly obtained. There is an obvious correlation between the fractal dimensions of the movable fluid (Figure 13b). Freezing progress is an energy exchange process; a lower freezing temperature has greater energy to break the chemical bonds and physical bonds between the pore water hydron. It can be seen that the lower the freezing temperature, the more loose the skeleton structure, and the larger the fractal dimension. The water in the macropores is more easily frozen than the water in the micropores; therefore, the relativity between the fractal dimension of movable fluid to the freezing temperature is larger than that of the fractal dimension of the bound fluid.
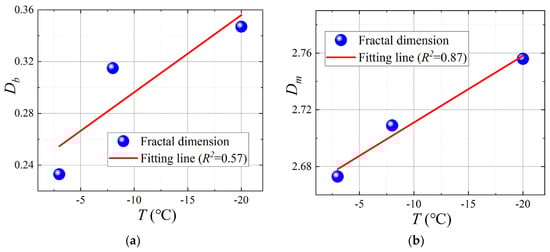
Figure 13.
Fractal dimension under various freezing temperatures: (a) fractal dimension for bound fluid; (b) fractal dimension for movable fluid.
Overall, NMR technology provides an accurate and reliable method to obtain fractal dimension information from frozen–thawed soil, which is helpful to predict the physical and mechanical properties [42]. The test result in this paper provides further research on the frozen–thawed soil’s micro-structure to that in reference [37]. The impact of various freezing conditions, including freezing duration, temperature and confining pressure, was obtained from the analysis of the test results, which describe the pore structure and fractal characteristics of frozen–thawed soft soil. The mathematical relationship between the fractal characteristics and thawing settlement characteristics deserves further investigation. In addition, some scientists found a relationship between hydraulic properties, grain size and fractal dimension [40,43,44,45], which can be applied in the field of frozen–thawed soil in future research.
5. Conclusions
The artificial ground freezing method is widely used in the construction of subway sections connecting passages in soft soil areas. The performance of frozen–thawed soil is strongly associated with the freezing conditions. According to the mechanism of water freezing, crystallization is the main cause of fractal dimension change for frozen–thawed soil. Various freezing conditions bring different types of damage to the soil structure. Accounting for the pore size distribution curves, the water in larger pores contains more movable fluid than that of smaller pores. Using NMR technology, the micro-structural change in soil could be observed, and the fractal dimension of pores can be calculated using pore size distribution curves. The following main conclusions were drawn:
(1) The shorter the freezing duration, the less damage was caused by freezing action. Movable fluid was more easily frozen than bound fluid, which caused the freezing rate to be rather high at the initial stage and then to slow down.
(2) The larger the confining pressure during freezing–thawing, the smaller the proportion of pores in the thawed soil, and the tighter the skeleton structure. The freezing confining pressure had little effect on the bound fluid freezing.
(3) The degree of damage to the soil microstructure varied with the freezing temperature, and the effect of freezing on water frost heaving was more obvious with the decrease of the freezing temperature.
(4) The larger pore structure of the soil assembly tended to be a skeleton pore structure with strong fractal fract. Therefore, the fractal dimension Dm for movable fluid was the dominant parameter reflecting the principal characteristics of the pore. This is because the frost heave rate of bound fluid is much higher than that of movable fluid.
(5) Water freezing could break the structure of the soil’s skeleton, so the fractal dimension grew as the freezing process progressed. The larger pressure applied to soil samples during freezing and thawing, the lower the fractal dimension value for the thawing soil’s structure, and the lower the freezing temperature, the larger the fractal dimension of the frozen–thawed soil.
Author Contributions
Conceptualization, B.K. and S.-H.H.; methodology, B.K.; validation, Y.T.; formal analysis, B.K.; investigation, Y.T.; resources, S.-H.H.; data curation, S.-H.H.; writing—original draft preparation, B.K.; writing—review and editing, B.K.; visualization, S.-H.H.; supervision, J.X.; project administration, J.X.; funding acquisition B.K. and J.X. All authors have read and agreed to the published version of the manuscript.
Funding
This research was funded by the Commonweal Project of Zhejiang Province, grant number LGG22E090002.
Institutional Review Board Statement
Not applicable.
Informed Consent Statement
Not applicable.
Data Availability Statement
The data are available from the corresponding author upon request.
Acknowledgments
The authors are very grateful to Yifei Sun from Ruhr University Bchum for his kind guidance in writing this article.
Conflicts of Interest
The authors declare no conflict of interest.
References
- Liu, J.; Ma, B.; Cheng, Y. Design of the gongbei tunnel using a very large cross-section pipe-roof and soil freezing method. Tunn. Undergr. Sp. Technol. 2018, 72, 28–40. [Google Scholar]
- Leung, C.K.W.; Leung, R.K.Y.; Cheung, A.K.K.; Chan, W.L. Application of artificial ground freezing method for tunnel. In Proceedings of the HKIE Civil Division International Conference, Hong Kong, China, 26–28 April 2012. [Google Scholar]
- Chang, D.K.; Lacy, H.S. Artificial ground freezing in geotechnical engineering. In Proceedings of the International Conference on Case Histories in Geotechnical Engineering, Arlington, VA, USA, 14 August 2008; pp. 1–11. [Google Scholar]
- Cui, Z.D.; Tang, Y.Q.; Yan, X.X. Centrifuge modeling of land subsidence caused by the high-rise building group in the soft soil area. Environ. Earth Sci. 2009, 59, 1819–1826. [Google Scholar]
- Casini, F.; Olivella, S.; Gens, A.; Viggiani, G.M.B. Artificial ground freezing of a volcanic ash: Laboratory tests and modelling. Environ. Geotech. 2016, 3, 141–154. [Google Scholar]
- Gao, Q.-F.; Jrad, M.; Hattab, M.; Fleureau, J.-M.; Ameur, L.I. Pore Morphology, Porosity, and Pore Size Distribution in Kaolinitic Remolded Clays under Triaxial Loading. Int. J. Geomech. 2020, 20, 04020057. [Google Scholar] [CrossRef]
- Li, Y.; Zhang, H.; Huang, M.; Yin, H.; Jiang, K.; Xiao, K.; Tang, S. Influence of Different Alkali Sulfates on the Shrinkage, Hydration, Pore Structure, Fractal Dimension and Microstructure of Low-Heat Portland Cement, Medium-Heat Portland Cement and Ordinary Portland Cement. Fractal Fract. 2021, 5, 79. [Google Scholar] [CrossRef]
- Fujikura, Y. Estimation of Permeability for Sand and Gravel Based on Pore-Size Distribution Model. J. Mater. Civ. Eng. 2019, 31, 04019289. [Google Scholar] [CrossRef]
- Gao, Q.-F.; Zhao, D.; Zeng, L.; Dong, H. A Pore Size Distribution-based Microscopic Model for Evaluating the Permeability of Clay. KSCE J. Civ. Eng. 2019, 23, 5002–5011. [Google Scholar] [CrossRef]
- Romero, E.; Gens, A.; Lloret, A. Water permeability, water retention and microstructure of unsaturated compacted Boom clay. Eng. Geol. 1999, 54, 117–127. [Google Scholar] [CrossRef]
- Tang, S.; Wang, Y.; Geng, Z.; Xu, X.; Yu, W.; Hubao, A.; Chen, J. Structure, Fractality, Mechanics and Durability of Calcium Silicate Hydrates. Fractal Fract. 2021, 5, 47. [Google Scholar]
- Ullah, A.S.; D’Addona, D.M.; Seto, Y.; Yonehara, S.; Kubo, A. Utilizing Fractals for Modeling and 3D Printing of Porous Structures. Fractal Fract. 2021, 5, 40. [Google Scholar]
- Kong, B.; He, S.; Xia, T.; Ding, Z. Research on Microstructure of Soft Clay under Various Artificial Ground Freezing Conditions Based on NMR. Appl. Sci. 2021, 11, 1810. [Google Scholar] [CrossRef]
- Pfeifer, P.; Avnir, D. Chemistry in noninteger dimensions between two and three. I. Fractal theory of heterogeneous surfaces. J. Chem. Phys. 1983, 79, 7. [Google Scholar]
- Avnir, D.; Jaroniec, M. An isotherm equation for adsorption on fractal surfaces of heterogeneous porous materials. Langmuir 1989, 5, 1431–1433. [Google Scholar]
- Dathe, A.; Eins, S.; Niemeyer, J.; Gerold, G. The surface fractal dimension of the soil-pore interface as measured by image analysis. Geoderma 2001, 103, 203–229. [Google Scholar]
- Wang, P.; Jiang, Z.; Ji, W.; Zhang, C.; Yuan, Y.; Chen, L. Heterogeneity of intergranular, intraparticle and organic pores in long- maxi shale in Sichuan basin, south China: Evidence from SEM digital images and fractal and multifractal geometries. Mar. Pet. Geol. 2016, 72, 122–138. [Google Scholar]
- Song, Z.; Liu, G.; Yang, W.; Zou, H.; Sun, M.; Wang, X. Multi-fractal distribution analysis for pore structure characterization of tight sandstone: A case study of the upper paleozoic tight formations in the longdong district. Ordos Basin Mar. Pet. Geol. 2018, 92, 842–854. [Google Scholar]
- Wang, J.; Li, P.; Ma, Y.; Vanapalli, S. Evolution of pore-size distribution of intact loess and remolded loess due to consolidation. J. Soils Sediments 2019, 19, 1226–1238. [Google Scholar] [CrossRef]
- Wang, J.-D.; Li, P.; Ma, Y.; Vanapalli, S.; Wang, X. Change in pore-size distribution of collapsible loess due to loading and inundating. Acta Geotech. 2020, 15, 1081–1094. [Google Scholar] [CrossRef]
- Feng, S.; Xu, Z.; Chai, J.; Li, Y. Using pore size distribution and porosity to estimate particle size distribution by nuclear magnetic resonance. Soils Found. 2020, 60, 1011–1019. [Google Scholar] [CrossRef]
- Griffiths, F.; Joshi, R. Discussion: Change in pore size distribution due to consolidation of clays. Geotechnique 1990, 40, 303–309. [Google Scholar] [CrossRef]
- Kong, B.; Xia, F.; Yu, B.; Xia, T.; Ding, Z. Pore Size Changes in Marine Soft Soil under Various Freezing Conditions. J. Mar. Sci. Eng. 2020, 8, 170. [Google Scholar] [CrossRef] [Green Version]
- Li, X.; Zhang, L. Characterization of dual-structure pore-size distribution of soil. Can. Geotech. J. 2009, 46, 129–141. [Google Scholar] [CrossRef] [Green Version]
- Mukunoki, T.; Miyata, Y.; Mikami, K.; Shiota, E. X-ray CT analysis of pore structure in sand. Solid Earth 2016, 7, 929–942. [Google Scholar] [CrossRef] [Green Version]
- Cai, Y.Q.; Hao, B.B.; Gu, C.; Wang, J.; Pan, L.Y. Effect of anisotropic consolidation stress paths on the undrained shear behavior of reconstituted Wenzhou clay. Eng. Geol. 2018, 242, 23–33. [Google Scholar] [CrossRef]
- Tang, l.; Song, Y.; Jiang, Z.; Jiang, S.; Li, Q. Pore Structure and Fractal Characteristics of Distinct Thermally Mature Shales. Energ. Fuel. 2019, 33, 5116–5128. [Google Scholar] [CrossRef]
- Yao, Y.; Liu, D.; Tang, D.; Tang, S.; Huang, W. Fractal characterization of adsorption-pores of coals from North China: An investigation on CH 4 adsorption capacity of coals. Int. J. Coal. Geol. 2008, 73, 27–42. [Google Scholar] [CrossRef]
- Sun, Y.; Gao, Y.; Zhu, Q. Fractional Order Plasticity Modelling of State-Dependent Behaviour of Granular Soils without Using Plastic Potential. Int. J. Plast. 2018, 102, 53–69. [Google Scholar] [CrossRef]
- Sun, Y.; Sumelka, W. Multiaxial stress-fractional plasticity model for anisotropically overconsolidated clay. Int. J. Mech. Sci. 2021, 205, 106598. [Google Scholar] [CrossRef]
- Sun, W.; Zuo, Y.; Zhonghu, W.; Liu, H.; Xi, S.; Shui, Y.; Wang, J.; Liu, R.; Lin, J. Fractal analysis of pores and the pore structure of the Lower Cambrian Niutitang shale in northern Guizhou province: Investigations using NMR, SEM and image analyses. Mar. Pet. Geol. 2018, 99, 416–428. [Google Scholar] [CrossRef]
- Yang, R.; He, S.; Yi, J.; Hu, Q. Nano-scale pore structure and fractal dimension of organic-rich Wufeng-Longmaxi shale from Jiaoshiba area, Sichuan Basin: Investigations using FE-SEM, gas adsorption and helium pycnometry. Mar. Pet. Geol. 2015, 7, 27–45. [Google Scholar] [CrossRef]
- Shao, X.; Pang, X.; Li, H.; Zhang, X. Fractal Analysis of Pore Network in Tight Gas Sandstones Using NMR Method: A Case Study from the Ordos Basin, China. Energy Fuels 2017, 31, 10358–10368. [Google Scholar] [CrossRef]
- Li, A.; Ding, W.; Jiu, K.; Wang, Z.; Wang, R.; He, J. Investigation of the pore structures and fractal characteristics of marine shale reservoirs using NMR experiments and image analyses: A case study of the Lower Cambrian Niutitang Formation in northern Guizhou Province, South China. Mar. Pet. Geol. 2017, 89, 530–540. [Google Scholar] [CrossRef]
- Liang, Z.K.; Li, Z.; Jiang, Z.X.; Gao, F.L.; Zhang, Y.H.; Xiao, L.; Yang, Y.D.; Hou, Y.F.; Wang, L.W. Characteristics of pore struc- ture and fractal dimension in continental shale based on NMR experiments and SEM image analyses:A case study of Shahezi formation shale in Changling fault depression of Songliao Basin, China. J. Earth Sci. Environ. 2020, 42, 313–328. [Google Scholar]
- Cetin, H.; Fener, M.; Söylemez, M.; Günaydin, O. Soil structure changes during compaction of a cohesive soil. Eng. Geol. 2007, 92, 38–48. [Google Scholar]
- Ding, Z.; Kong, B.; Wei, X.; Zhang, M.; Xu, B.; Zhao, F. Laboratory Testing to Research the Micro-Structure and Dynamic Characteristics of Frozen–Thawed Marine Soft Soil. J. Mar. Sci. Eng. 2019, 7, 85. [Google Scholar] [CrossRef] [Green Version]
- Jia, B.; Chen, Z.; Xian, C. Investigations of CO2 storage capacity and flow behavior in shale formation. J. Petrol. Sci. Eng. 2022, 208, 109659. [Google Scholar] [CrossRef]
- Zhou, S.; Liu, D.; Cai, Y.; Yao, Y. Fractal characterization of pore–fracture in low-rank coals using a low-field NMR relaxation method. Fuel 2016, 181, 218–226. [Google Scholar]
- He, S.-H.; Ding, Z.; Hu, H.-B.; Gao, M. Effect of Grain Size on Microscopic Pore Structure and Fractal Characteristics of Carbonate-Based Sand and Silicate-Based Sand. Fractal Fract. 2021, 5, 152. [Google Scholar] [CrossRef]
- Kruse, A.M.; Darrow, M. Adsorbed cation effects on unfrozen water in fine-grained frozen soil measured using pulsed nuclear magnetic resonance. Cold Reg. Sci. Technol. 2017, 142, 42–54. [Google Scholar] [CrossRef]
- Huang, Y.; Zhang, P.; Zhang, J.; Tang, X.; Liu, C.; Yang, J. Fractal Characteristics of Pores in the Longtan Shales of Guizhou, Southwest China. Geofluids 2020, 2020, 1–16. [Google Scholar] [CrossRef]
- Dou, W.; Liu, L.; Jia, L.; Xu, Z.; Wang, M.; Du, C. Pore structure, fractal characteristics and permeability prediction of tight sandstones: A case study from Yanchang Formation, Ordos Basin, China. Mar. Pet. Geol. 2021, 123, 104737. [Google Scholar] [CrossRef]
- Kong, L.; Ostadhassan, M.; Liu, B.; Li, C.; Liu, K. Multifractal Characteristics of MIP-Based Pore Size Distribution of 3D-Printed Powder-Based Rocks: A Study of Post-Processing Effect. Transp. Porous Media 2019, 129, 599–618. [Google Scholar] [CrossRef]
- Fu, X.; Ding, H.; Sheng, Q.; Zhang, Z.; Yin, D.; Chen, F. Fractal Analysis of Particle Distribution and Scale Effect in a Soil–Rock Mixture. Fractal Fract. 2022, 6, 120. [Google Scholar] [CrossRef]

Publisher’s Note: MDPI stays neutral with regard to jurisdictional claims in published maps and institutional affiliations. |
© 2022 by the authors. Licensee MDPI, Basel, Switzerland. This article is an open access article distributed under the terms and conditions of the Creative Commons Attribution (CC BY) license (https://creativecommons.org/licenses/by/4.0/).