Article

Macro- and Micromechanical Assessment of the Influence of Non-Plastic Fines and Stress Anisotropy on the Dynamic Shear Modulus of Binary Mixtures

Chair of Soil Mechanics, Foundation Engineering and Environmental Geotechnics, Ruhr-Universität Bochum, 44801 Bochum, Germany
*
Author to whom correspondence should be addressed.
Fractal Fract. 2022, 6(4), 205; https://doi.org/10.3390/fractalfract6040205
Submission received: 28 February 2022 / Revised: 31 March 2022 / Accepted: 4 April 2022 / Published: 6 April 2022
(This article belongs to the Special Issue Fractal and Fractional in Geomaterials)

Abstract

:
Resonant column tests were carried out on Hostun sand mixed with 5%, 10% and 20% non-plastic fines (defined as grains smaller than 0.075 mm) in order to quantify the combined influence of the void ratio (e), anisotropic stress state (defined as σv/σh) and fines content (fc) on the maximum small-strain shear modulus Gmax. A significant reduction in the Gmax with increasing fc was observed. Using the empirical model forwarded by Roesler, the influence of e and σv/σh on Gmax was captured, although the model was unable to capture the influence of varying fines content using a single equation. From the micro-CT images, a qualitative observation of the initial skeletal structure of the ‘fines-in-sand’ grains was performed and the equivalent granular void ratio e* was determined. The e was henceforth replaced by e* in Roesler’s equation in order to capture the variation in fc. The new modification was quantified in terms of the mean square error R2. Furthermore, the Gmax of Hostun sand–fine mixtures was predicted with good accuracy by replacing e with e*. Additionally, a micromechanical interpretation based on the experimental observation was developed.

1. Introduction

The determination of soil stiffness is of primary importance, considering its application in practical fields of geotechnical engineering, including foundation settlements, deformations caused by excavations or wave propagation in the ground due to vibration. In addition, all geotechnical sub/superstructure designs require the soil stiffness parameters in order to estimate the resistance of a structure against dynamic motions, such as earthquakes. In recent years, the development of elasto-plastic and advanced constitutive models (e.g., hardening soil model with small-strain stiffness, SANISAND) exclusively requires the small-strain soil stiffness parameter Gmax as an input, underlining its importance in terms of research and practice in the field of soil dynamics.
Soil stiffness typically has a maximum value at low strains (strain < 10−6), denoted either Gmax or G0, and decreases by increasing the strain amplitude. Since the 1960s, several researchers ([1,2,3]) identified the influence of the void ratio and the effective stress on the small-strain shear modulus Gmax. The authors of [1] were the earliest to formulate an empirical equation to capture the influence of the void ratio and effective stress under isotropic stress conditions (Equation (1)):
G m a x = A   p a   f e p p a n  
where A is a material constant depending on the soil type, pa is the atmospheric pressure (≈100 kPa), p’ is the effective stress, n is a stress exponent and f(e) is the void ratio function, which popularly takes the form of Equation (2) ([1]) or Equation (3) ([4]):
f e = c e 2 1 + e  
f e = e d
c and d are fitting parameters. The authors of [5,6] studied the influence of the grain size distribution on Gmax, where they reported a significant influence of the uniformity coefficient Cu and the mean grain size D50, which they characterized via empirical relations. Other than grain size, the fines content (i.e., grains passing through a standard US 200 sieve and smaller than 0.075 mm) can also influence the mechanical behavior of soils, as was evidenced in previous studies, e.g., refs. [7,8,9,10,11]. Systematic studies on the effect of fines content and isotropic stress on Gmax have been published by [8,9,10,11,12,13,14,15,16,17,18]. These studies showed a strong influence of the non-cohesive fines fraction on Gmax—a decrease in Gmax was observed with increasing fines content. Therefore, ref. [12] proposed a reduction factor for Equation (1), as shown in Figure 1.
It must be noted that Equation (1), in conjunction with the reduction factor, is not very suitable since it assumes different values for each soil type, as demonstrated by [17,18,19]. The authors of [9,11] reported that the fitting parameters of Equations (1)–(3) are influenced by fines content, which means for every binary mixture, the fitting parameters must be separately determined.
It is possible to capture the influence of the fines content on the mechanical behavior of granular soils by utilizing the concept of equivalent granular void ratio, as defined by [7]. Furthermore, ref [19] defined that a certain portion of fines actively participate in the granular structure contributing to force chains, based on which Equation (4) was suggested, where a boundary was formulated, below which the soil behavior would be dominated by sand (defined as ‘fines-in-sand’) and above which by fines (‘sand-in-fines) ([19,20]).
    e = e + 1 b f c 1 1 b f c                                                   f c < f t h r
The b-value holds a value between 0 and 1 and is responsible for denoting the active proportion of fines in the soil structure; therefore, it is a function of the fine content—the higher the value the higher the percentage of fines contributing to force chains in the mixture. In [20,21], the authors developed a semi-empirical equation (Equation 5) to calculate b-parameter.
b = 1 e x p 0.3 f c / f t h r k × r f c f t h r r
where r = (D10/d50)−1, D10 = sand grain size corresponding to 10% finer materials by weight passing through, d50 = fine grain size corresponding to 50% finer materials by weight passing through, k = (1 − r0.25). The authors of [17,19] had previously used this formulation in their work on binary mixtures.
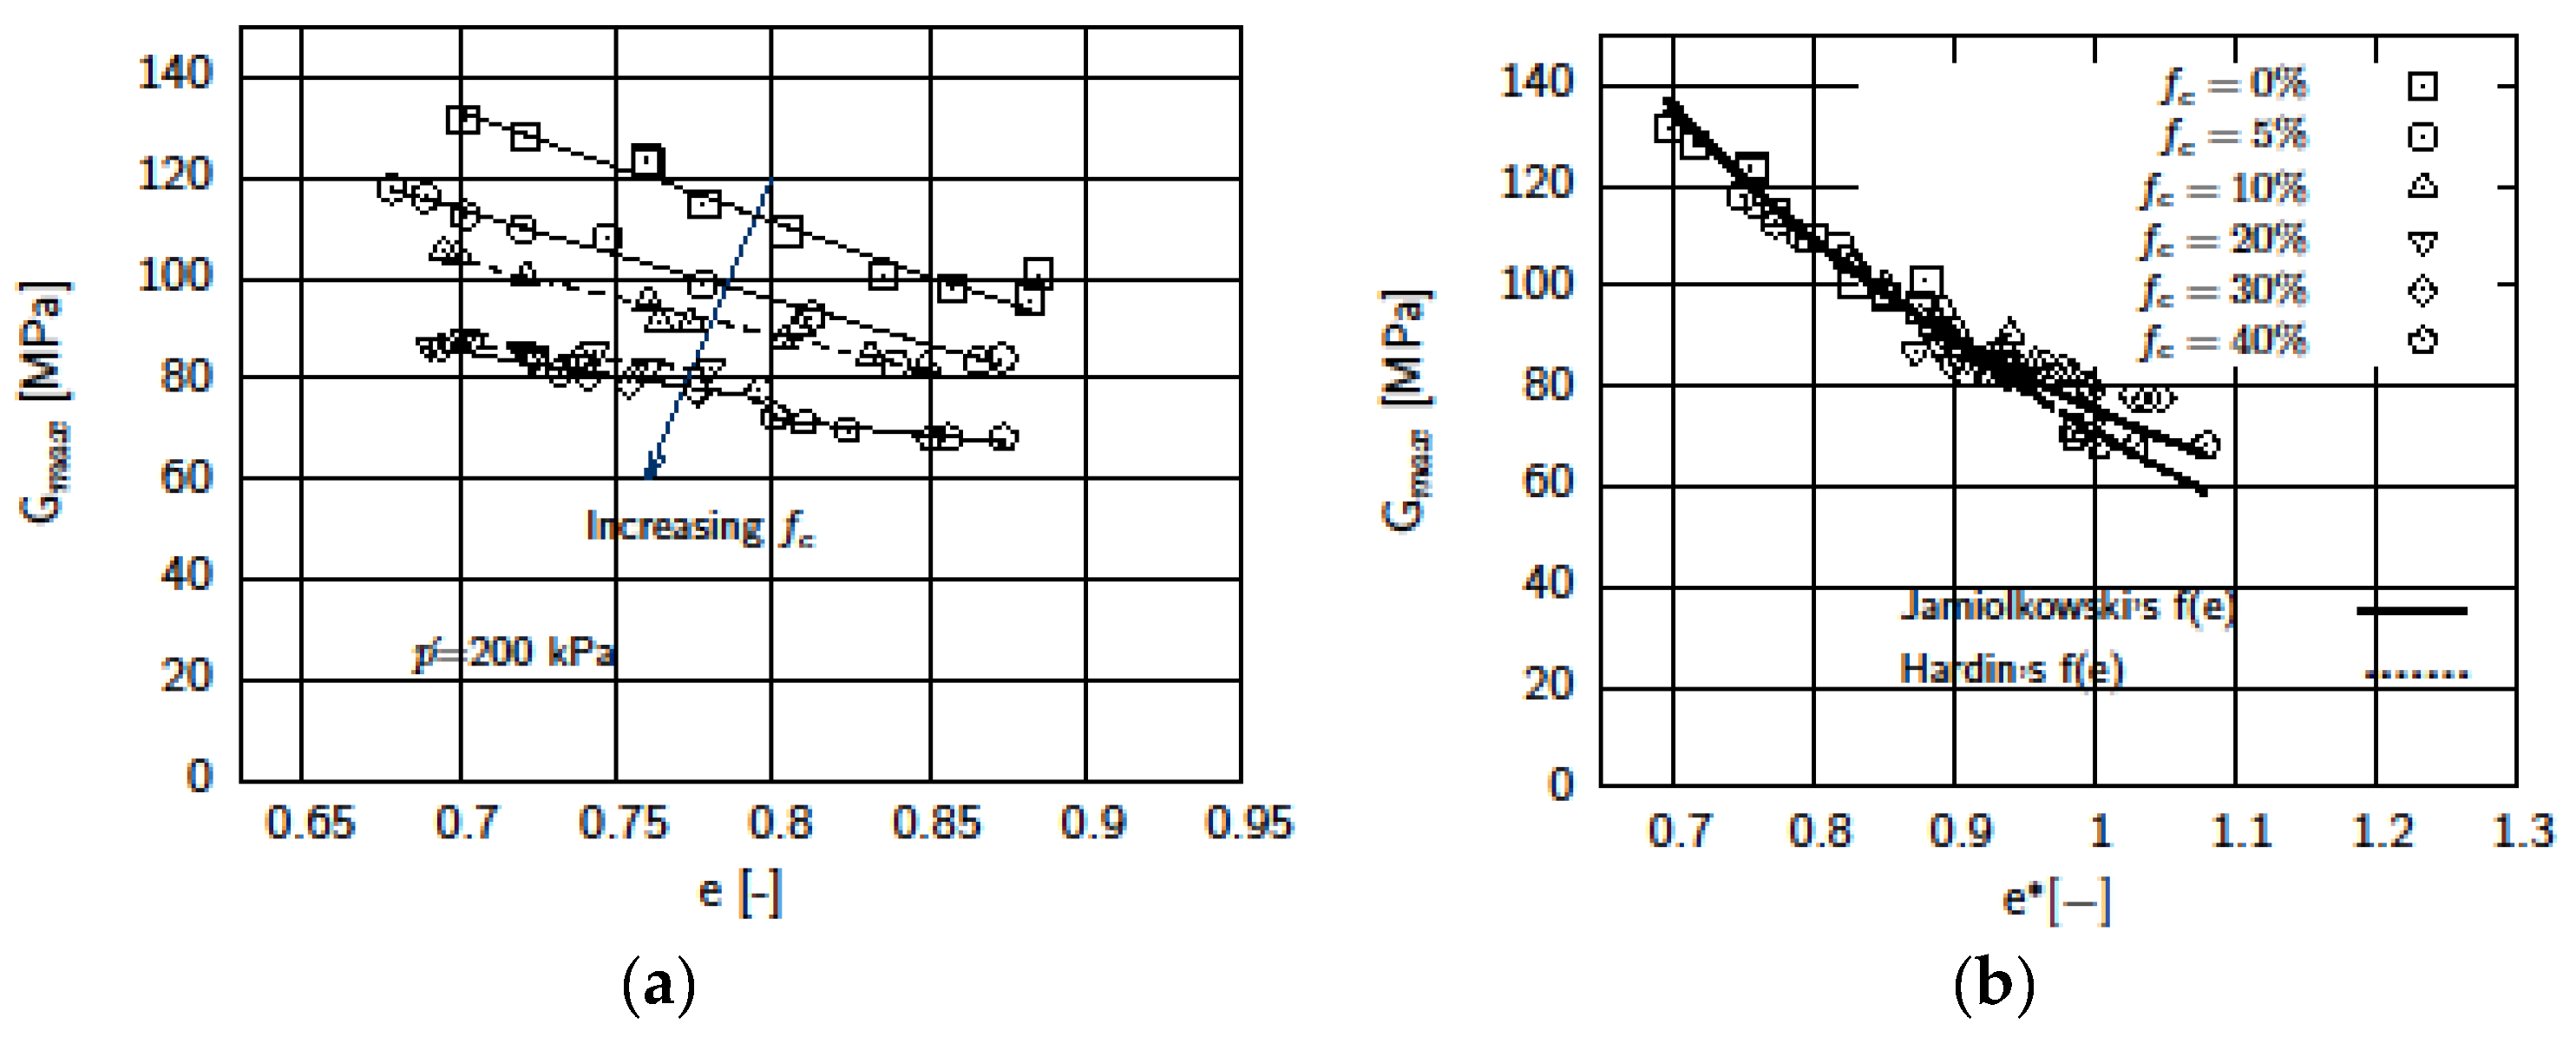
Ref. [10] carried out resonant column (RC) tests on Hostun sand mixed with a fine fraction. They reported the significant influence of the fines content on the maximum shear modulus (Figure 2a). The concept of equivalent granular void ratio e* [22,23] was successfully used to predict the maximum shear modulus in Equation (1) under isotropic stress conditions. However, no investigation was done for anisotropic stress states.
In order to evaluate the effect of anisotropy, numerous laboratory tests using bender elements ([11,24,25,26,27,28,29,30]), RC and torsional shear tests ([1,11,31,32,33,34,35]) have already been carried out. Furthermore, [1] and [24] extended the empirical relations to account for anisotropy. [1] believed that shear stress plays an insignificant role on shear modulus and suggested replacing p′ in Equation (1) with the average of vertical and horizontal stresses Equation (6).
G m a x = A f e p a 1 n σ v + σ h 2 n
σ v and σ h   denotes the vertical and horizontal stresses.
Ref. [24] conducted experimental studies on cubic soil samples to investigate the effects of stress components on shear wave velocity under anisotropic loading, where a significant influence of vertical stress on shear wave velocity and, consequently, on Gmax was reported. Therefore, Hardin’s relationship was modified accordingly by using σ v and σ h instead of p′, as shown in Equation (7):
G m a x = A f e p a σ v p a n v σ h p a n h σ c p a n c
n v , n h and n c are the stress exponents, while σ c represents the out-of-plane stress.
Furthermore, it was also found out that the placing technique of the sand does not influence the shear wave velocities. Reference [11] performed tests on glass beads, concluding that reference shear strain was affected by anisotropy, and an empirical relationship was developed, considering confining pressure and anisotropic stress components. Performing tests on Ticino sand under both horizontal and vertical directions using geophones equipped with bender and compression elements, ref. [25] noted stiffnesses in the horizontal plane were larger than in the vertical plane. Using a similar procedure, ref. [26] investigated the interdependence of the active earth pressure coefficient K0 on stress-induced anisotropy. The work of [24] was further extended by [27], in which the author attempted to establish a difference between the effects of fabric anisotropy and effective stress on soil stiffness. A similar approach using a multiaxial triaxial cell equipped with bender/extender elements was adopted by [28] to assess the evolution of elastic anisotropy under axially symmetric stress conditions. Using results backed by experiments, ref. [29] carried out discrete element method simulations and stated that more contact normal tensors preferred to distribute along the horizontal direction. Reference [30] used three different sample preparation methods to investigate the fabric anisotropy of Hostun sand, where air-pluviated and tamped samples exhibited higher stiffness in the horizontal and vertical directions, respectively.
Most of the previous studies have focused on either of the two aspects: either anisotropy of clean sands or sands with varying fines content. In nature, sands are often mixed with fines, and subjected to anisotropic stress states, possibly due to an existing sub-structure or repetitive loading over time. Therefore, studies combining both fines content under anisotropic stress conditions are necessary considering their practical importance. Therefore, in the present work, the influence of fines content on Gmax under anisotropic stress conditions was investigated in detail. In addition, the application of e* in Equation (7) in specimens under anisotropic stress was inspected.

2. Experimental Procedure and Sample Preparation

The following sub-sections describe the experimental device and procedure followed by the tested materials and the method of sample preparation.

2.1. The RC Device

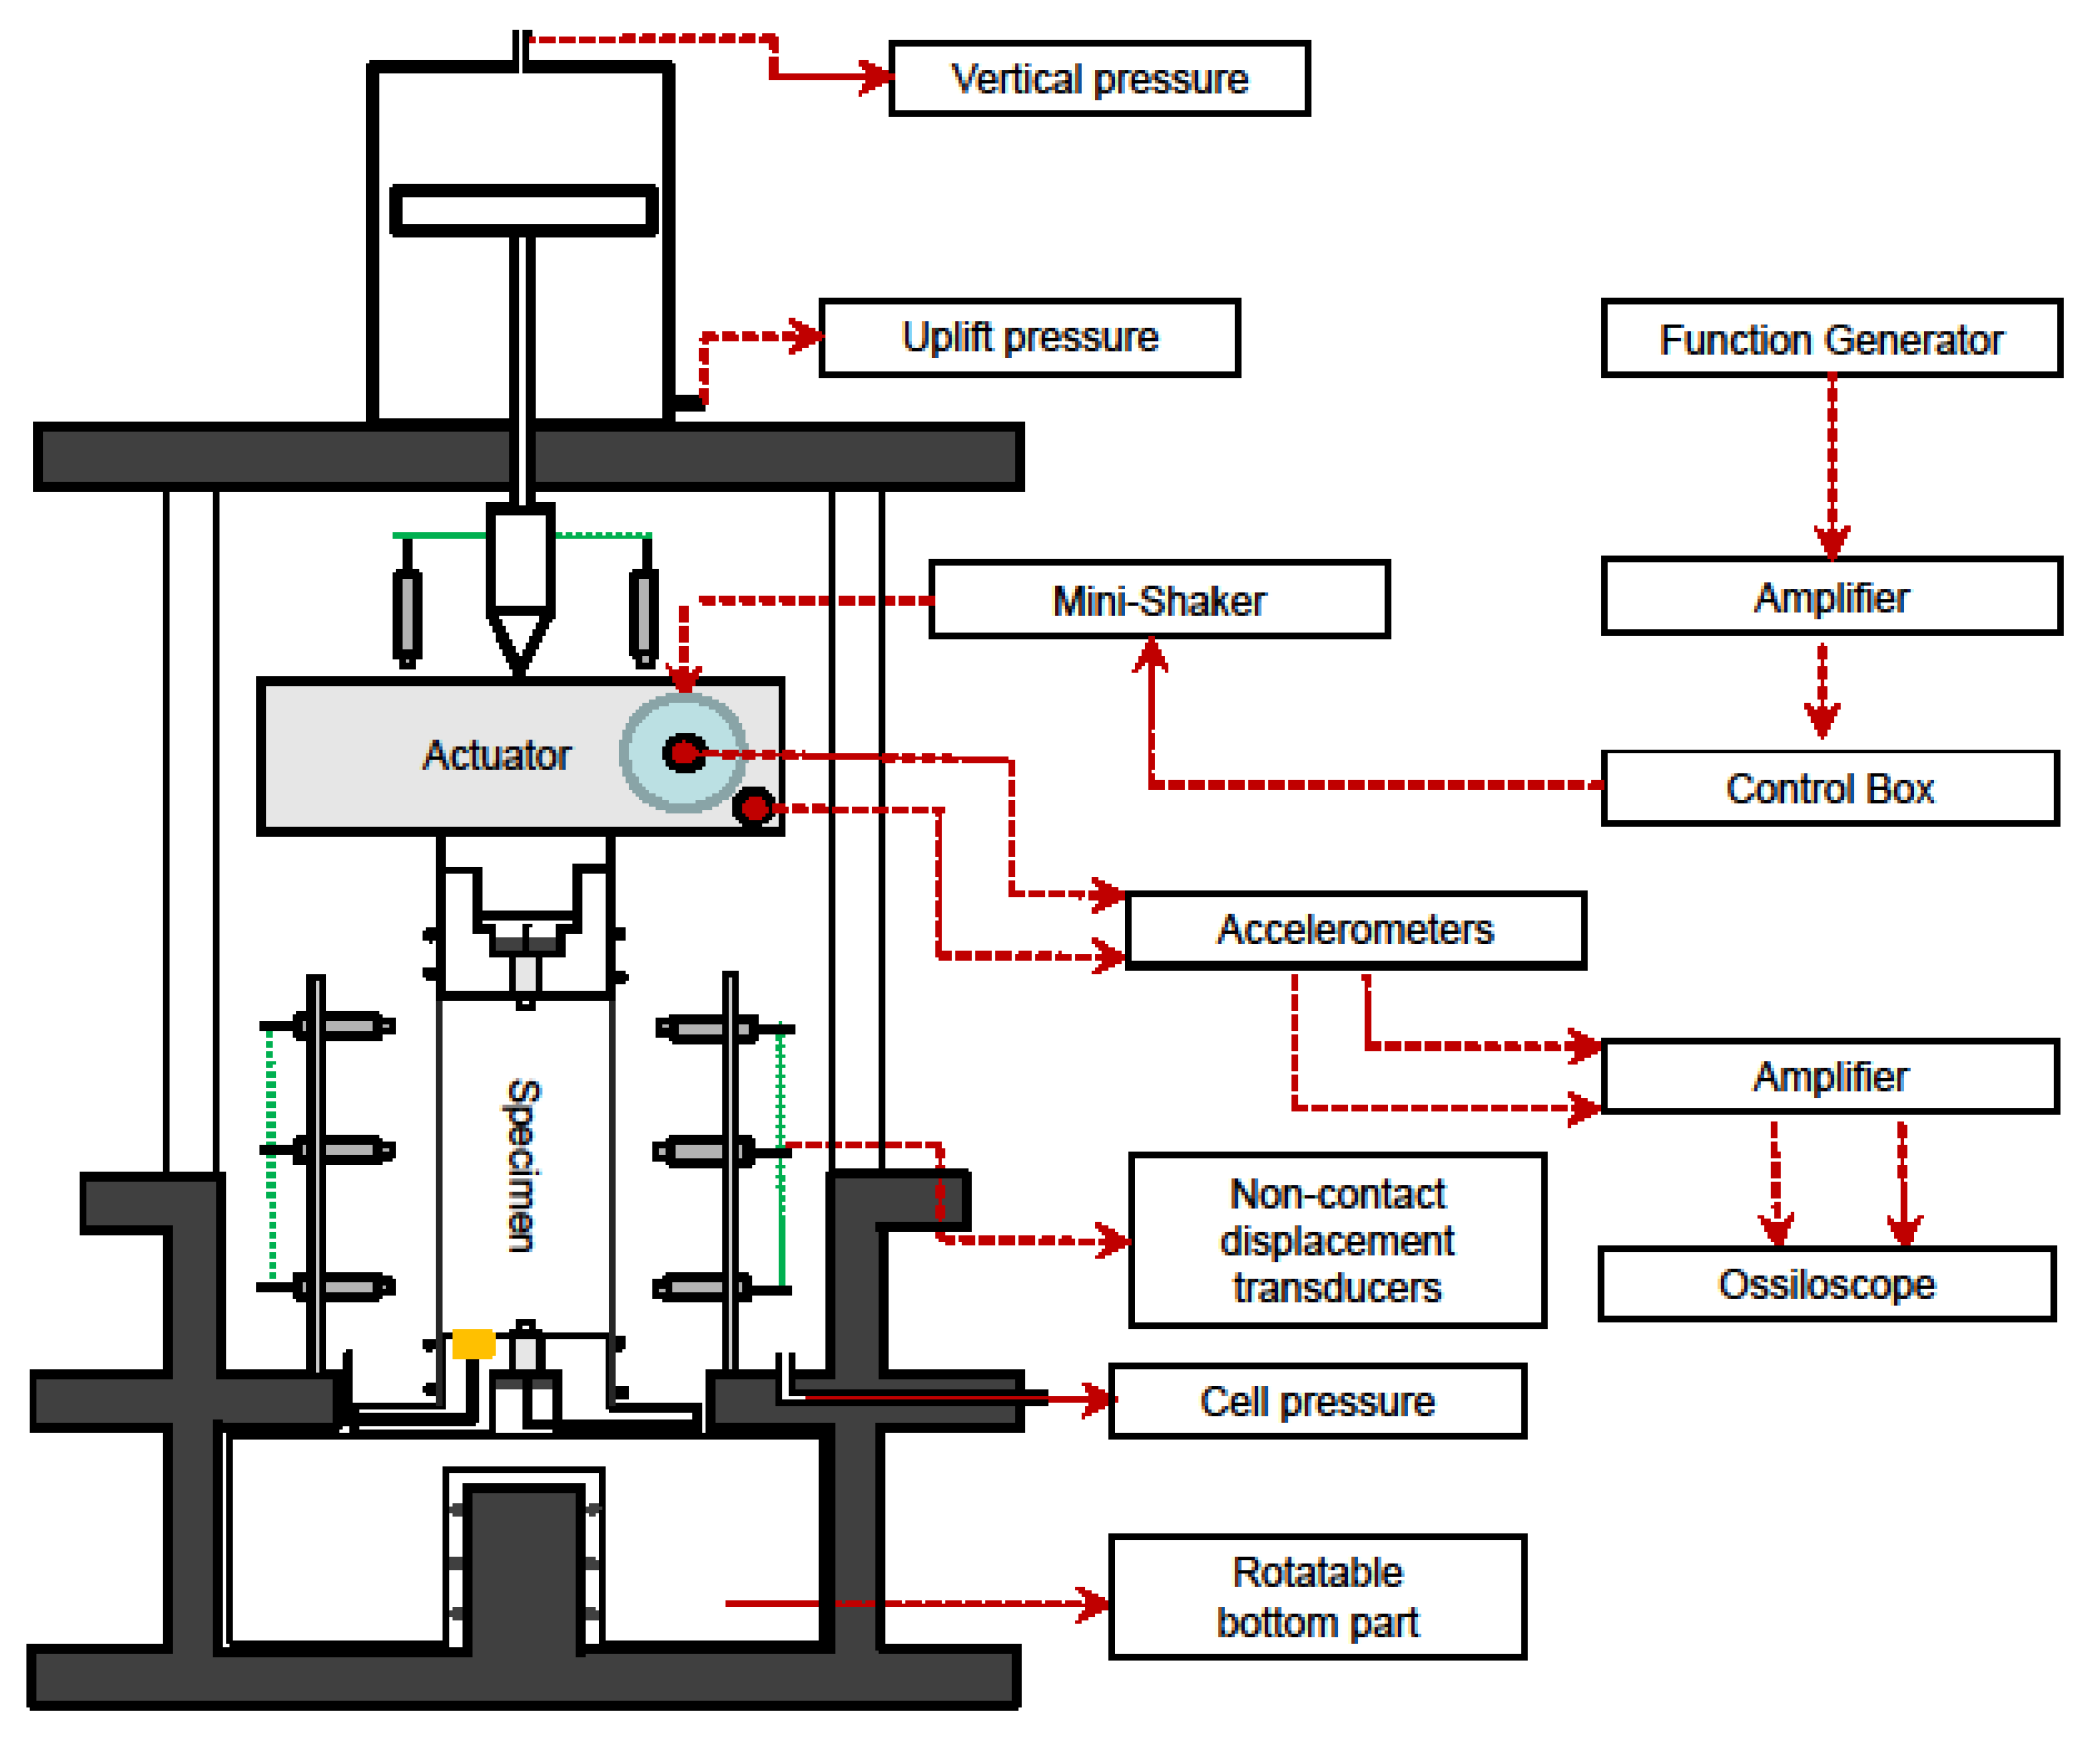
The RC and Bender element tests are common methods to determine the small-strain dynamic properties of soils (e.g., shear wave velocity, shear stiffness and damping). To determine the shear modulus and damping, the RC device available at the Ruhr-Universität Bochum was used. The device is capable of investigating the influence of small (shear strain γ < 10−5) and medium shear strains (10−3 < γ < 10−5). This free-free mode of vibration, i.e., the bottom and top plates are freely movable ([36]), was employed. This specimen is enclosed by a latex membrane of thickness 0.4 mm. The inserted cylindrical soil sample is subjected to harmonic torsional vibrations about the longitudinal axis by two electromagnetic excitation heads. The generated acceleration is measured with the help of two accelerometers, which then results in the linearly distributed torsion γ over the specimen height. This recorded acceleration is displayed on an oscilloscope as a sinusoidal excitation signal, the frequency of which is varied using a function generator until the resonant frequency fR is determined. The dynamic shear modulus for the specific load amplitude can then be calculated from fR ([36]):
G = 2 π f R a 2
a   t a n a J 2 J 0   J L   t a n a a = J J 0 + J J L          
The polar mass moment of inertia for the bottom and top parts of the device, as well as the sample, are denoted by J 0 , J L and J respectively. ρ denotes the sample density, while a = ω L v s , ω is the rotational frequency, L is the sample height and v s the shear wave velocity. The schematic figure of the RC device is shown in Figure 3.
The device was modified for performing tests under anisotropic stress states ([37]). A pneumatic pressure cylinder was mounted on the top of the cell, as shown in Figure 3, for applying vertical pressure on the specimen. The calibration and validation of the device were performed following different methods, further details of which are in [11,37]. At the beginning, the specimen was isotropically loaded with a cell pressure σ h = 50 kPa. From a cell pressure of 200 kPa onwards, the vertical pressure ensures anisotropy in the specimen. The results on isotropically loaded specimens were shown previously in [17]. This paper aimed to describe the results on the same soil mixtures, but under anisotropic loading. The stress path is currently divided into two areas: isotropic condition at σ h = 200 kPa ([11,17]) and anisotropic condition where σ h is constant 200 kPa and σ v is increased up to 600 kPa (i.e., effective vertical to horizontal stress ratio σ v / σ h = 3).

2.2. Tested Materials

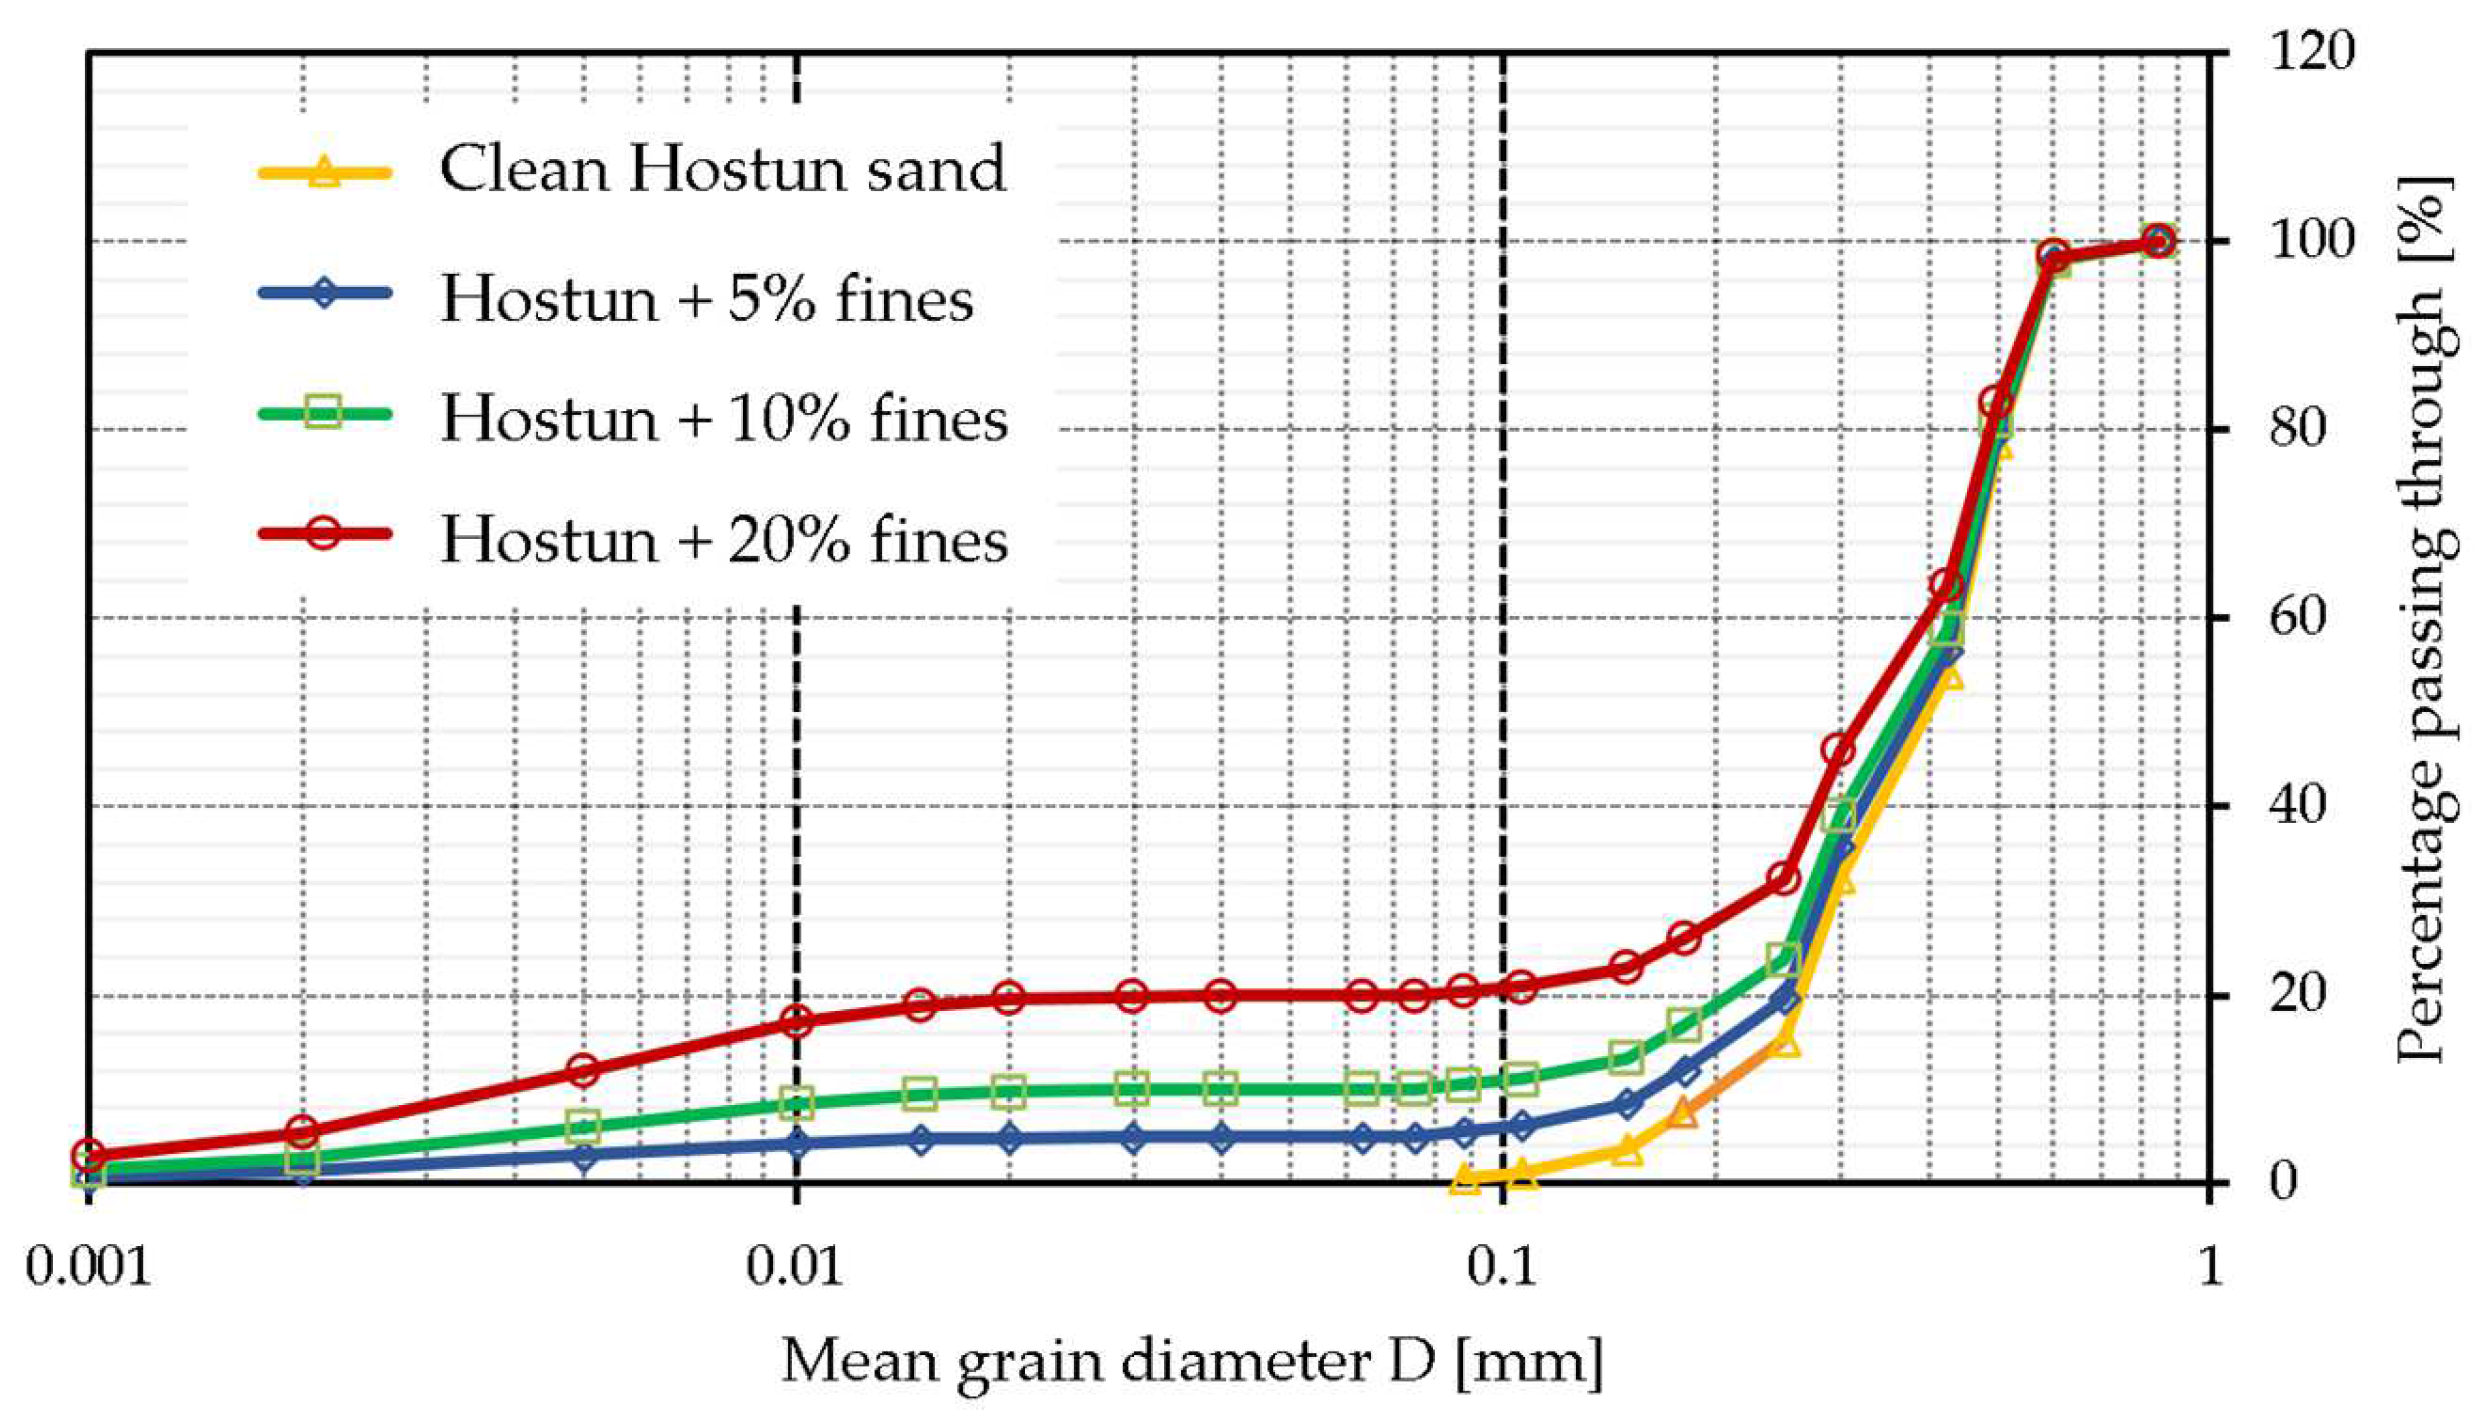
In the present work, four series of tests were carried out with a mixture of Hostun sand (a quartz sand originally mined in France) and non-plastic quartz (obtained locally) as fines with different proportions by weight—0%, 5%, 10% and 20%. The material mixtures of Hostun sand and the different proportions of fines are shown in Figure 4. The white opaque parts show the quartz powder and the light-colored elements denote sand particles. Hostun sand has been used previously in numerous tests ([37]). Silica is the predominant chemical that constitutes the sand grains (SiO2 > 98%). The sand is angular with a grain density of 2.65 g/cm3. The mean grain size of Hostun sand and quartz powder (also consisting of SiO2 as the main component) is 0.375 mm and 0.004 mm, respectively. Figure 5 shows the grain size distribution of the tested materials obtained following [38].

3. Experimental Results

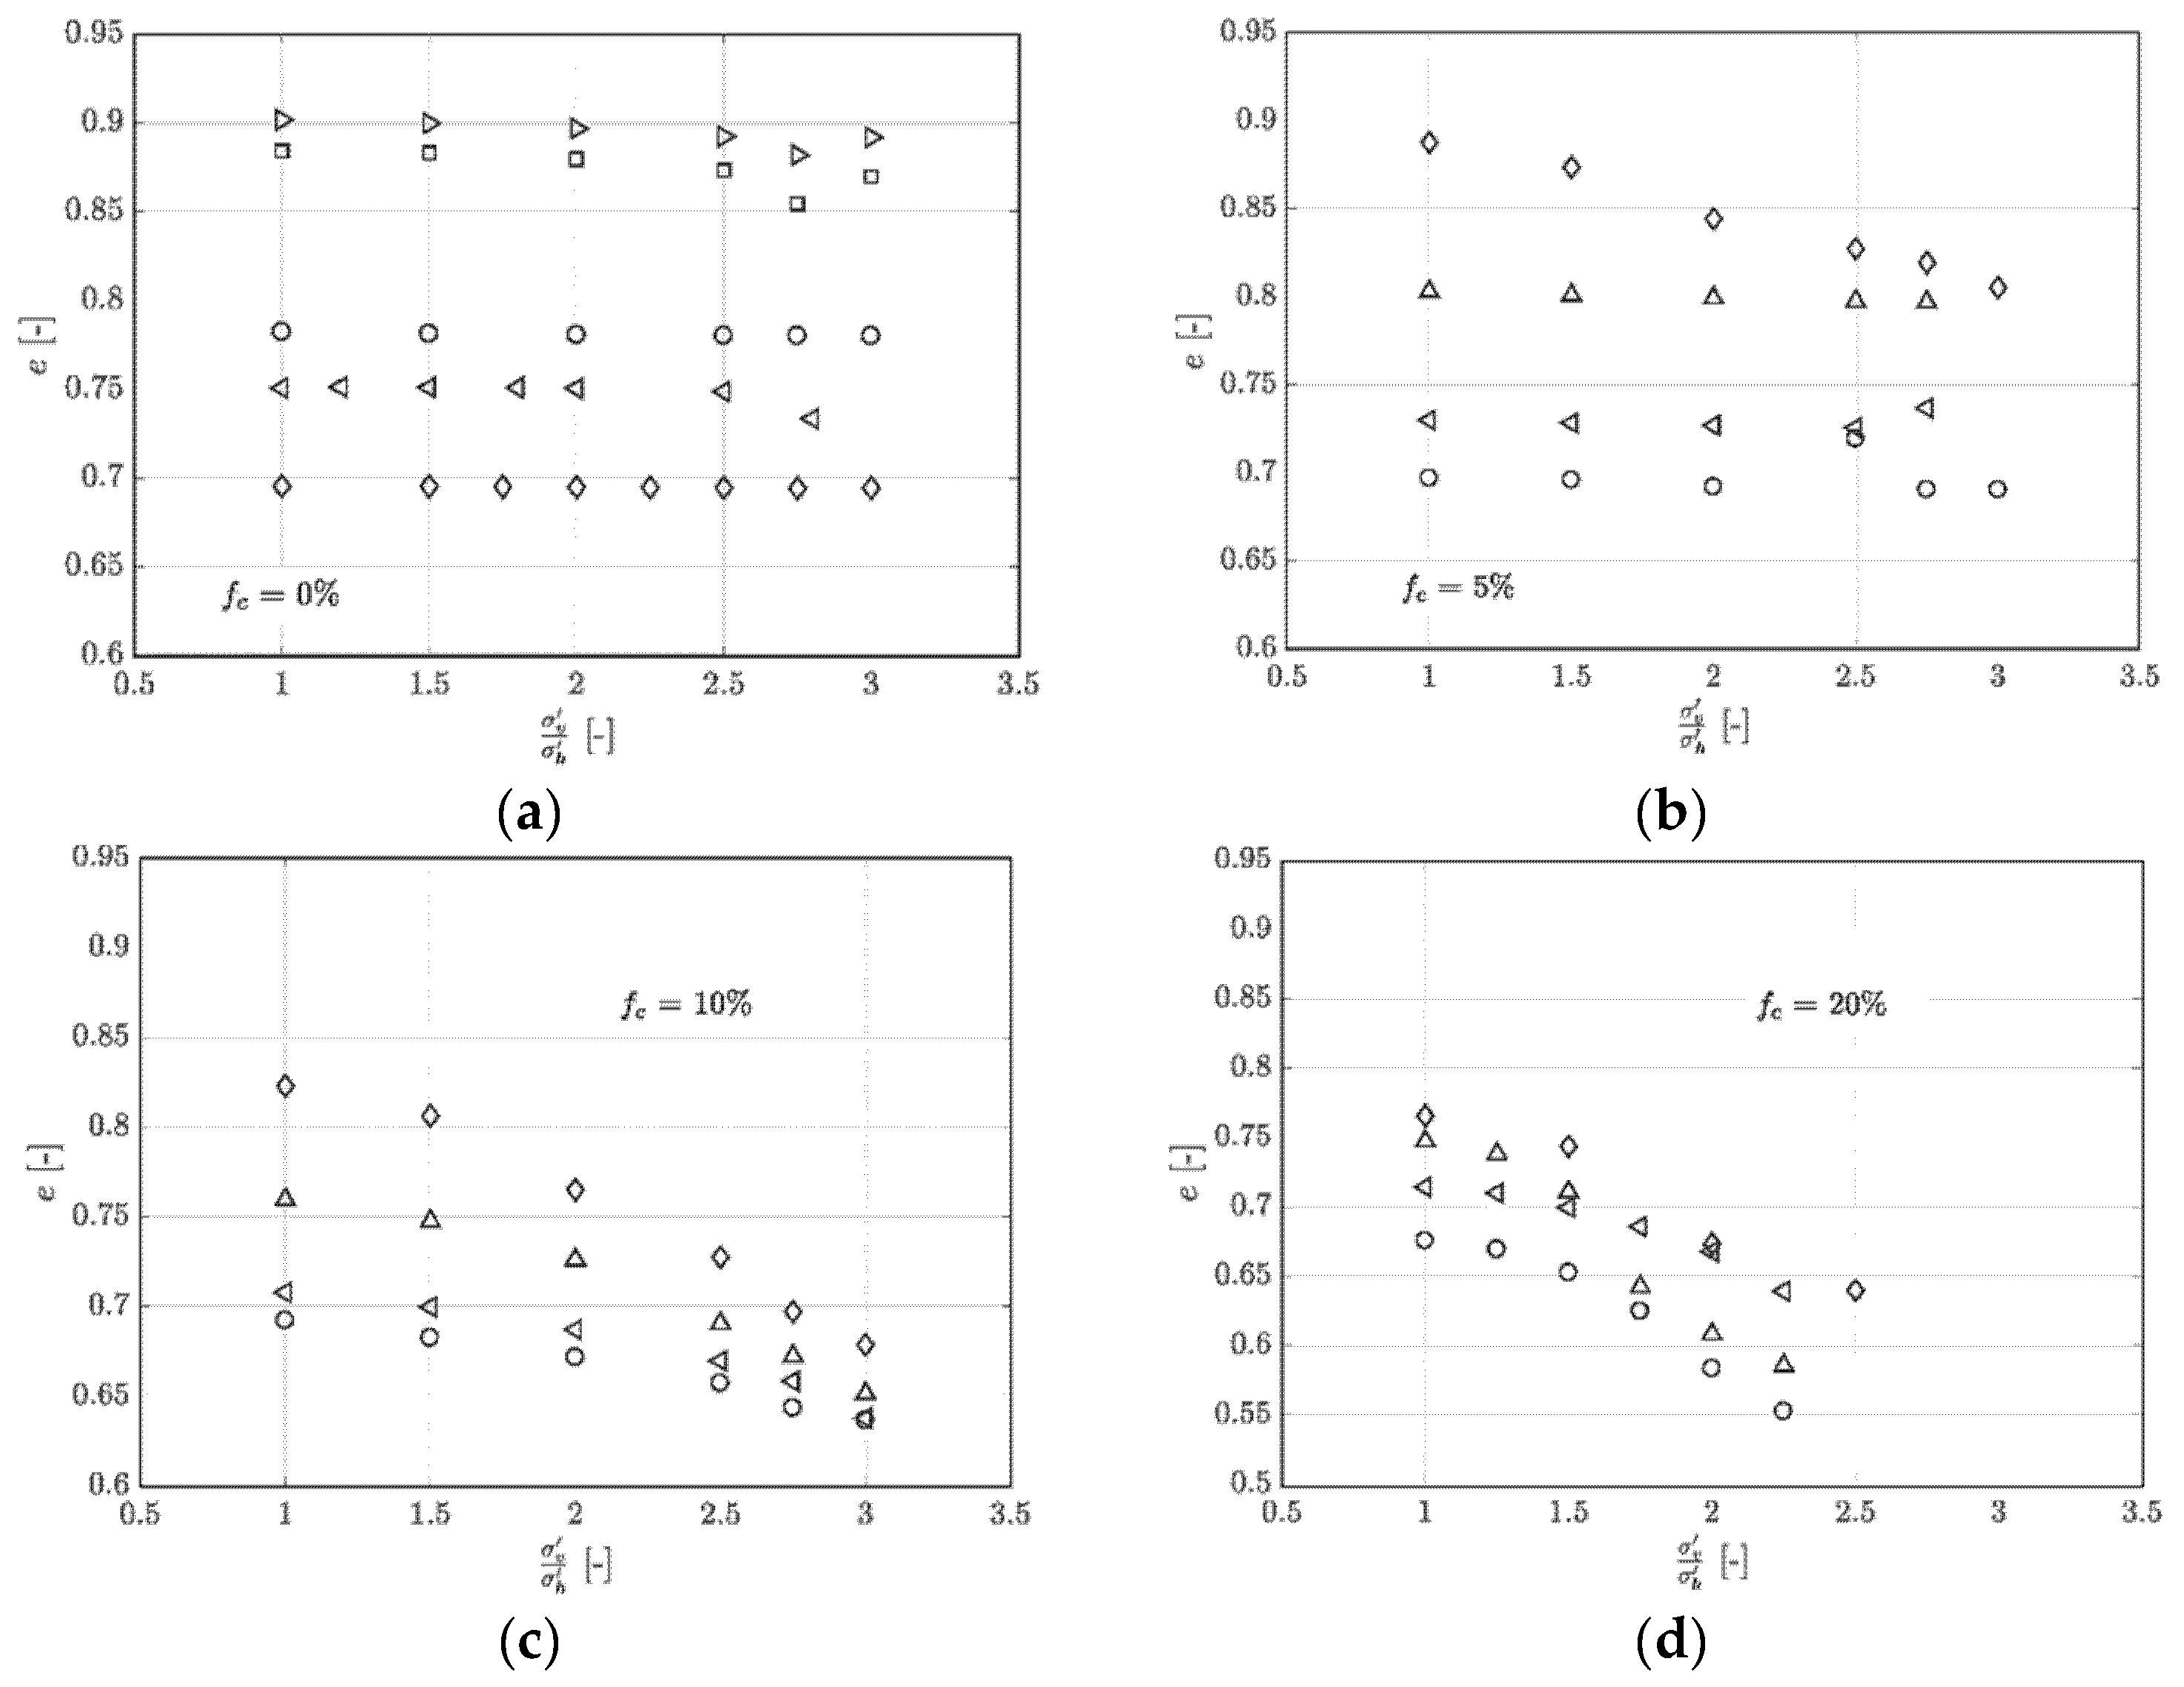
From Figure 6a–d, the influence of the anisotropic stress on the variation in void ratio e over different fines content is shown. The results show that with an increase in the effective anisotropic deviatoric stress σ v / σ h , the e decreases with increasing fines, whereas the decrease is minimal for the clean sand (Figure 6a). This implies a higher compressibility of the mixtures with higher fines.
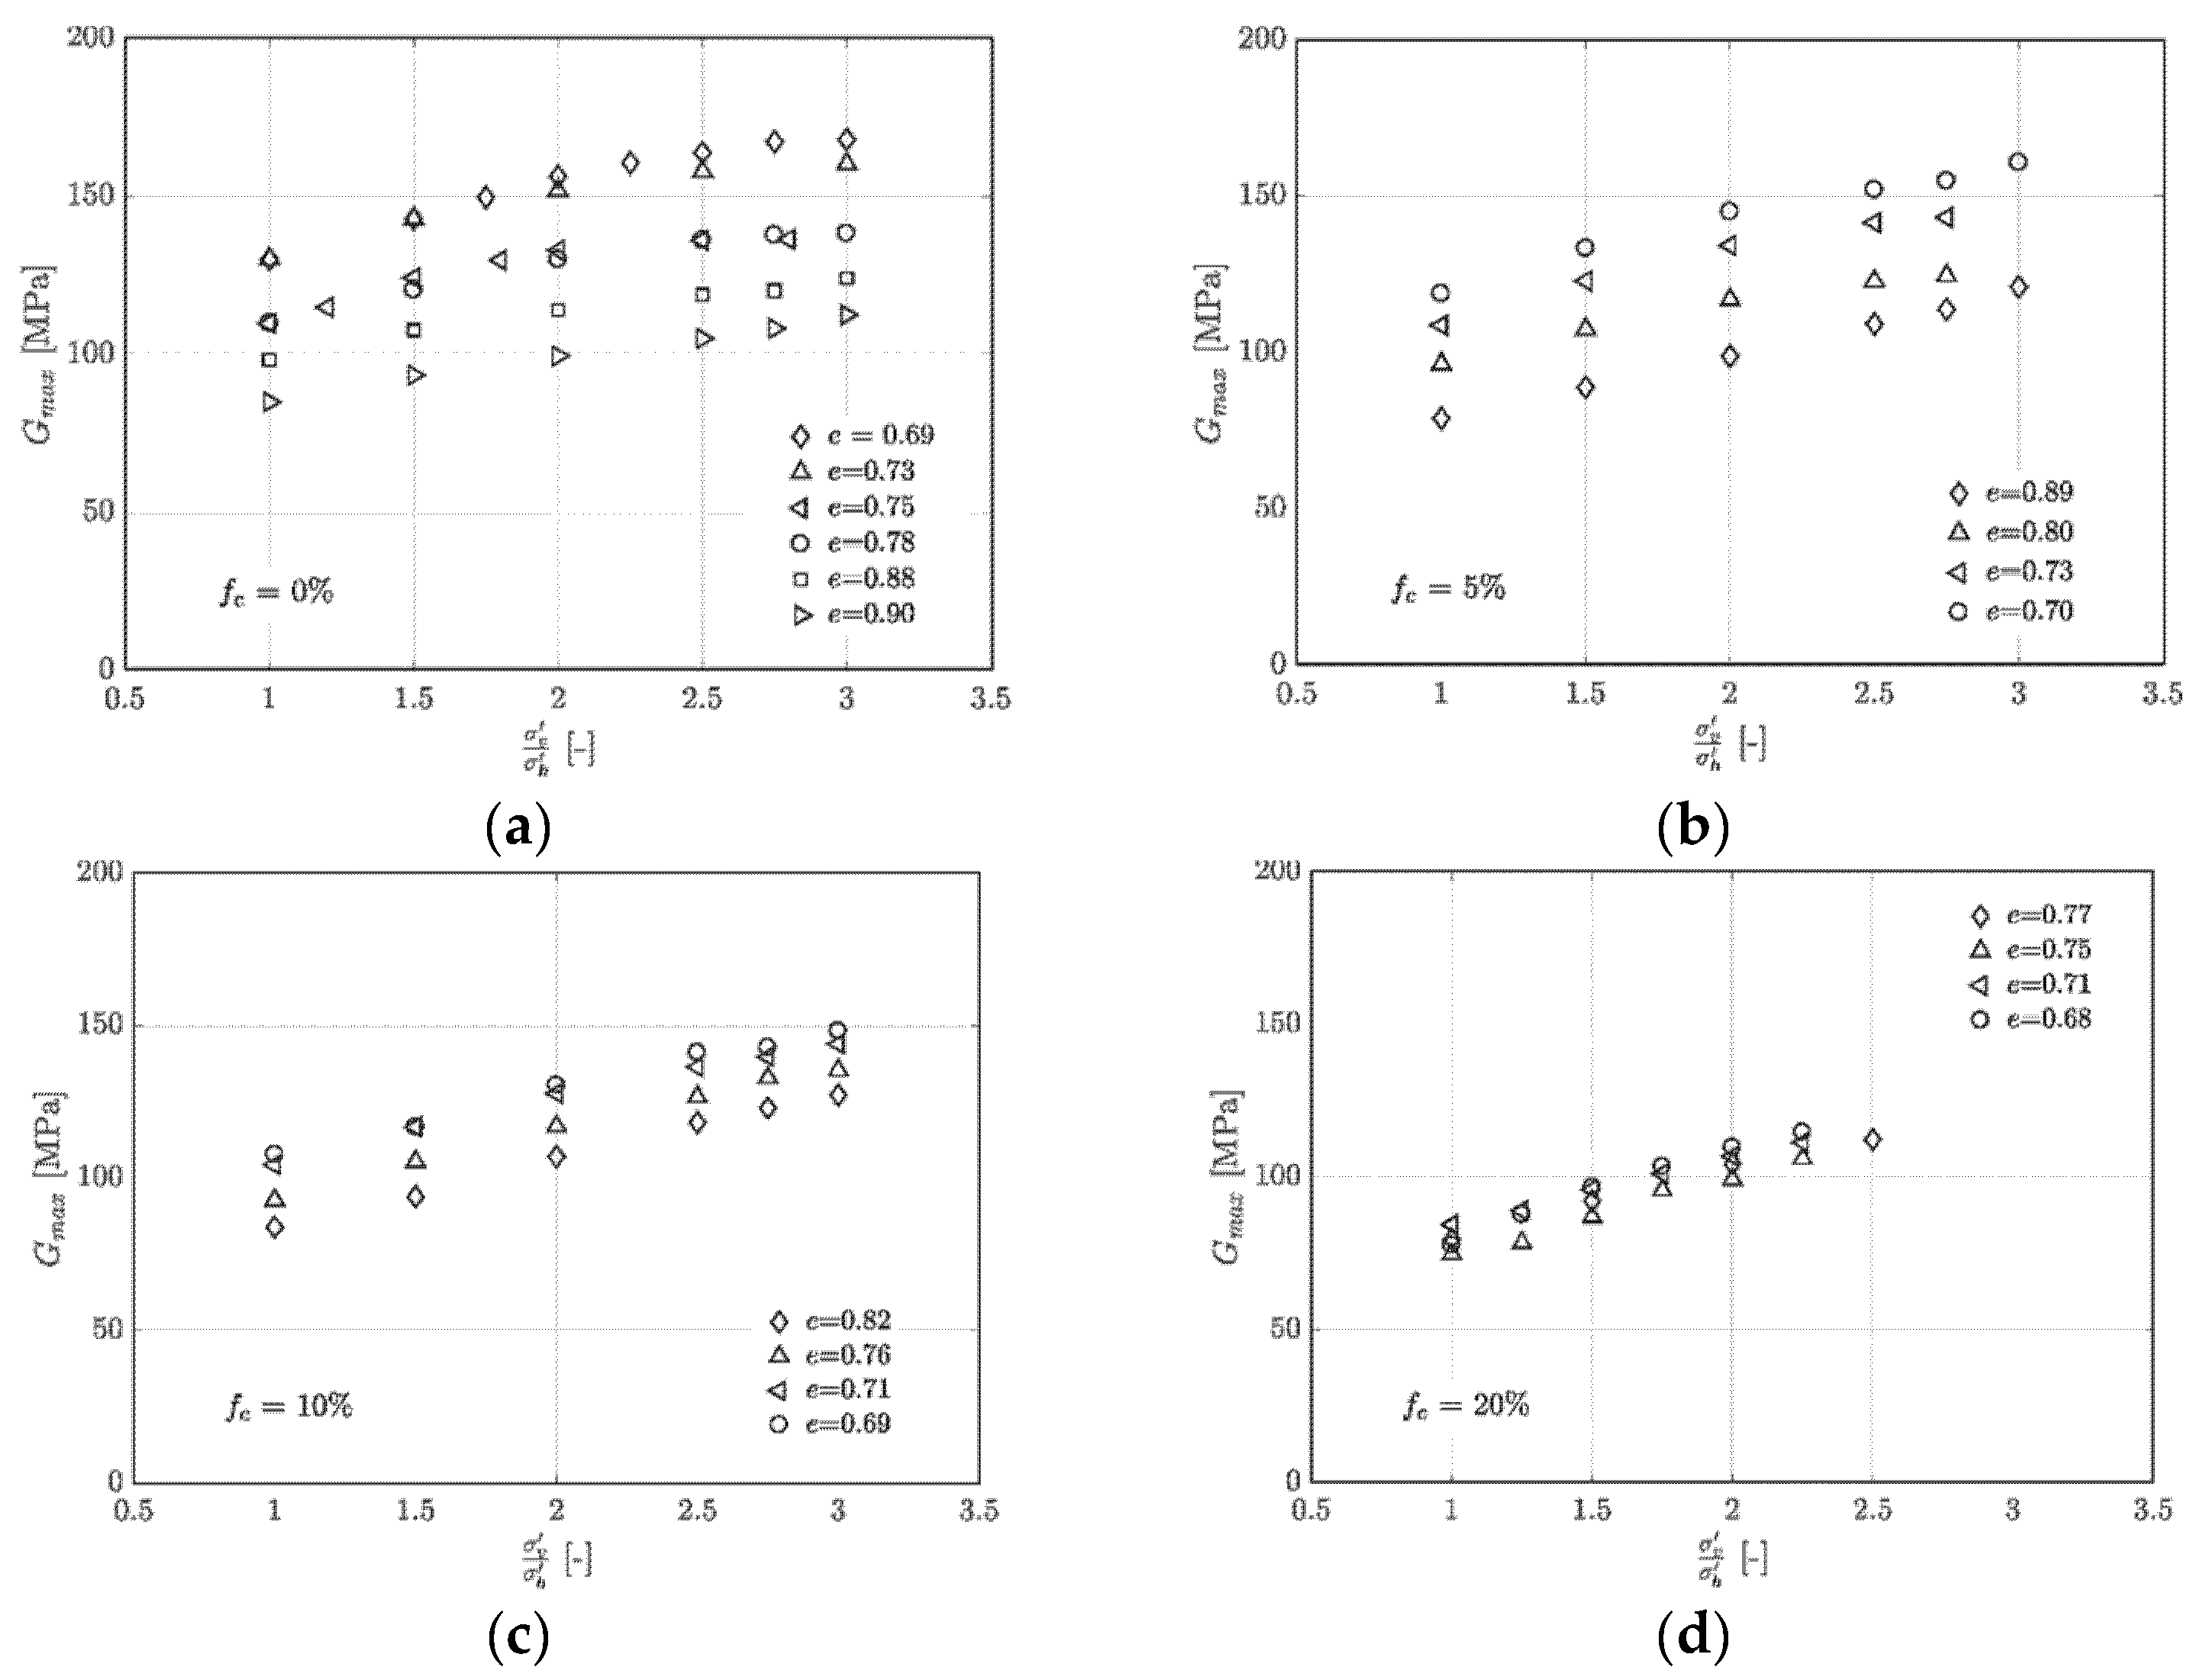
Furthermore, Figure 7 shows the relationship between Gmax, e and   σ v / σ h . It is clear that the Gmax increases with decreasing e and increasing σ v σ h .   It is interesting to note the relative magnitudes of the Gmax for differing fines content—it is higher for the clean Hostun sand (Figure 7a) but reduces with increasing fines content. In addition, the reduction in Gmax is much larger at higher fines content, although the specimens are prepared at an initially dense state (see Figure 7d). Practically, the influence of e is diminished at fc = 20%, while it is largest at fc = 0%.
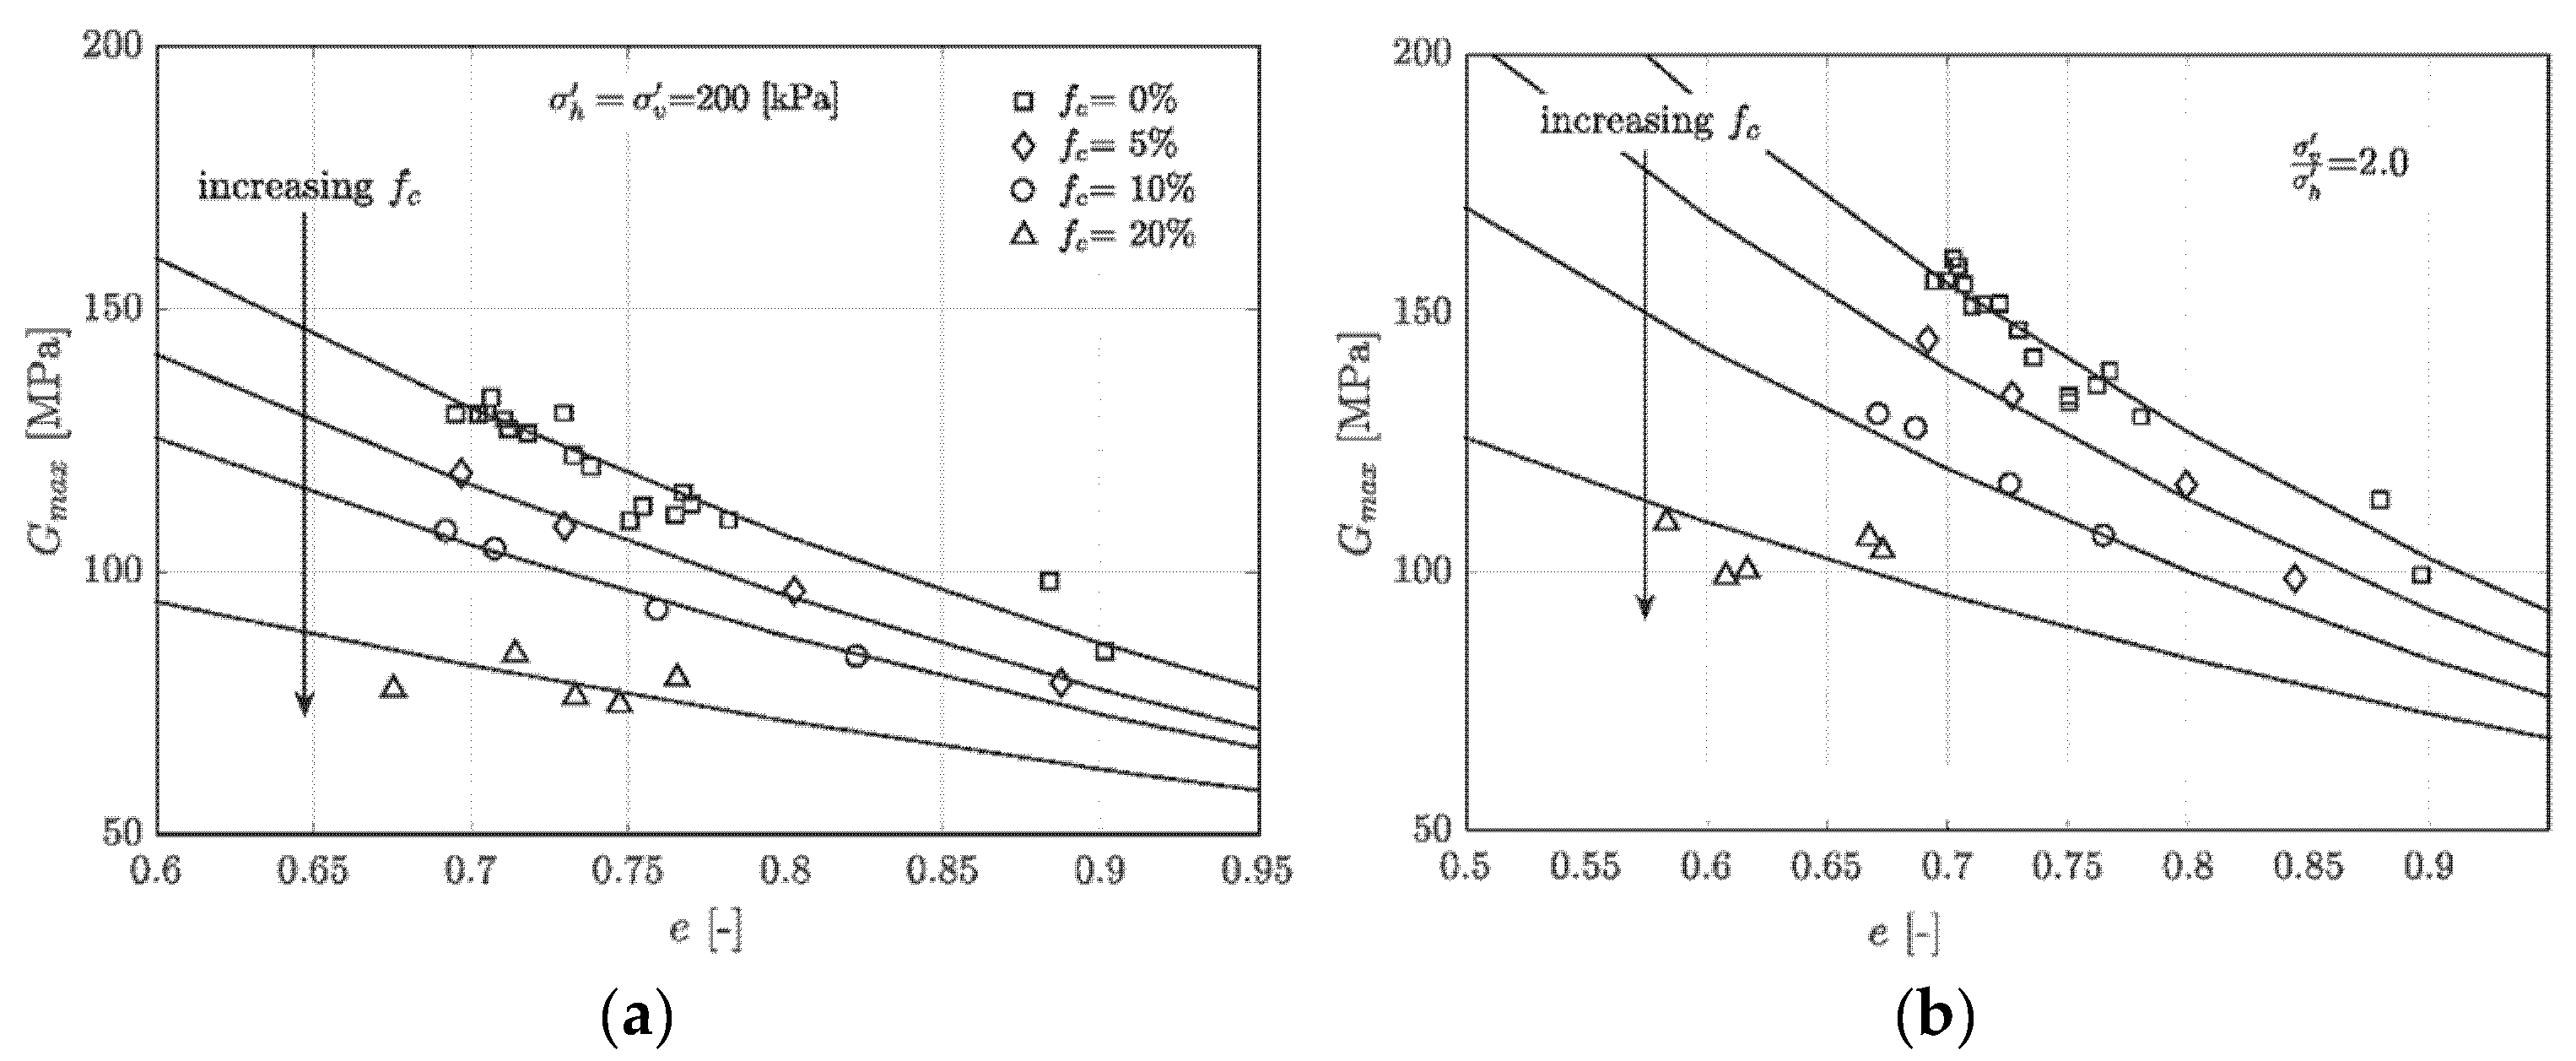
In Figure 8, the variation of the Gmax with different e and fc values is shown along with isotropic (Figure 8a) and anisotropic (Figure 8b) states. For all specimens with 0%, 5%, 10% and 20% fines content, Gmax decreases with the increase in e and increase of vertical stress,   σ v . In comparison to the isotropic specimen with initial e = 0.80 and containing 5% fines, the 20% fines specimen under the same boundary conditions shows a lower Gmax- for 5% fc, which is close to 100 MPa, while for the other, it measures around 75 MPa. The same trend can be noted for the anisotropic specimen in Figure 8b, which implies an increase in anisotropic stress load causes an increase in the maximum shear modulus, whereas the increase in fc causes a reduction in the maximum shear modulus.
For   σ v / σ h = 2, the Gmax for clean sand measures approximately 160 MPa at e = 0.70 (Figure 8b), while under isotropic conditions (Figure 8a), it measures around 135 MPa. This reinforces the observation that at anisotropic stress conditions, an increase in the e as well as fines content results in a significant decrease in the Gmax.

4. Analysis of Results

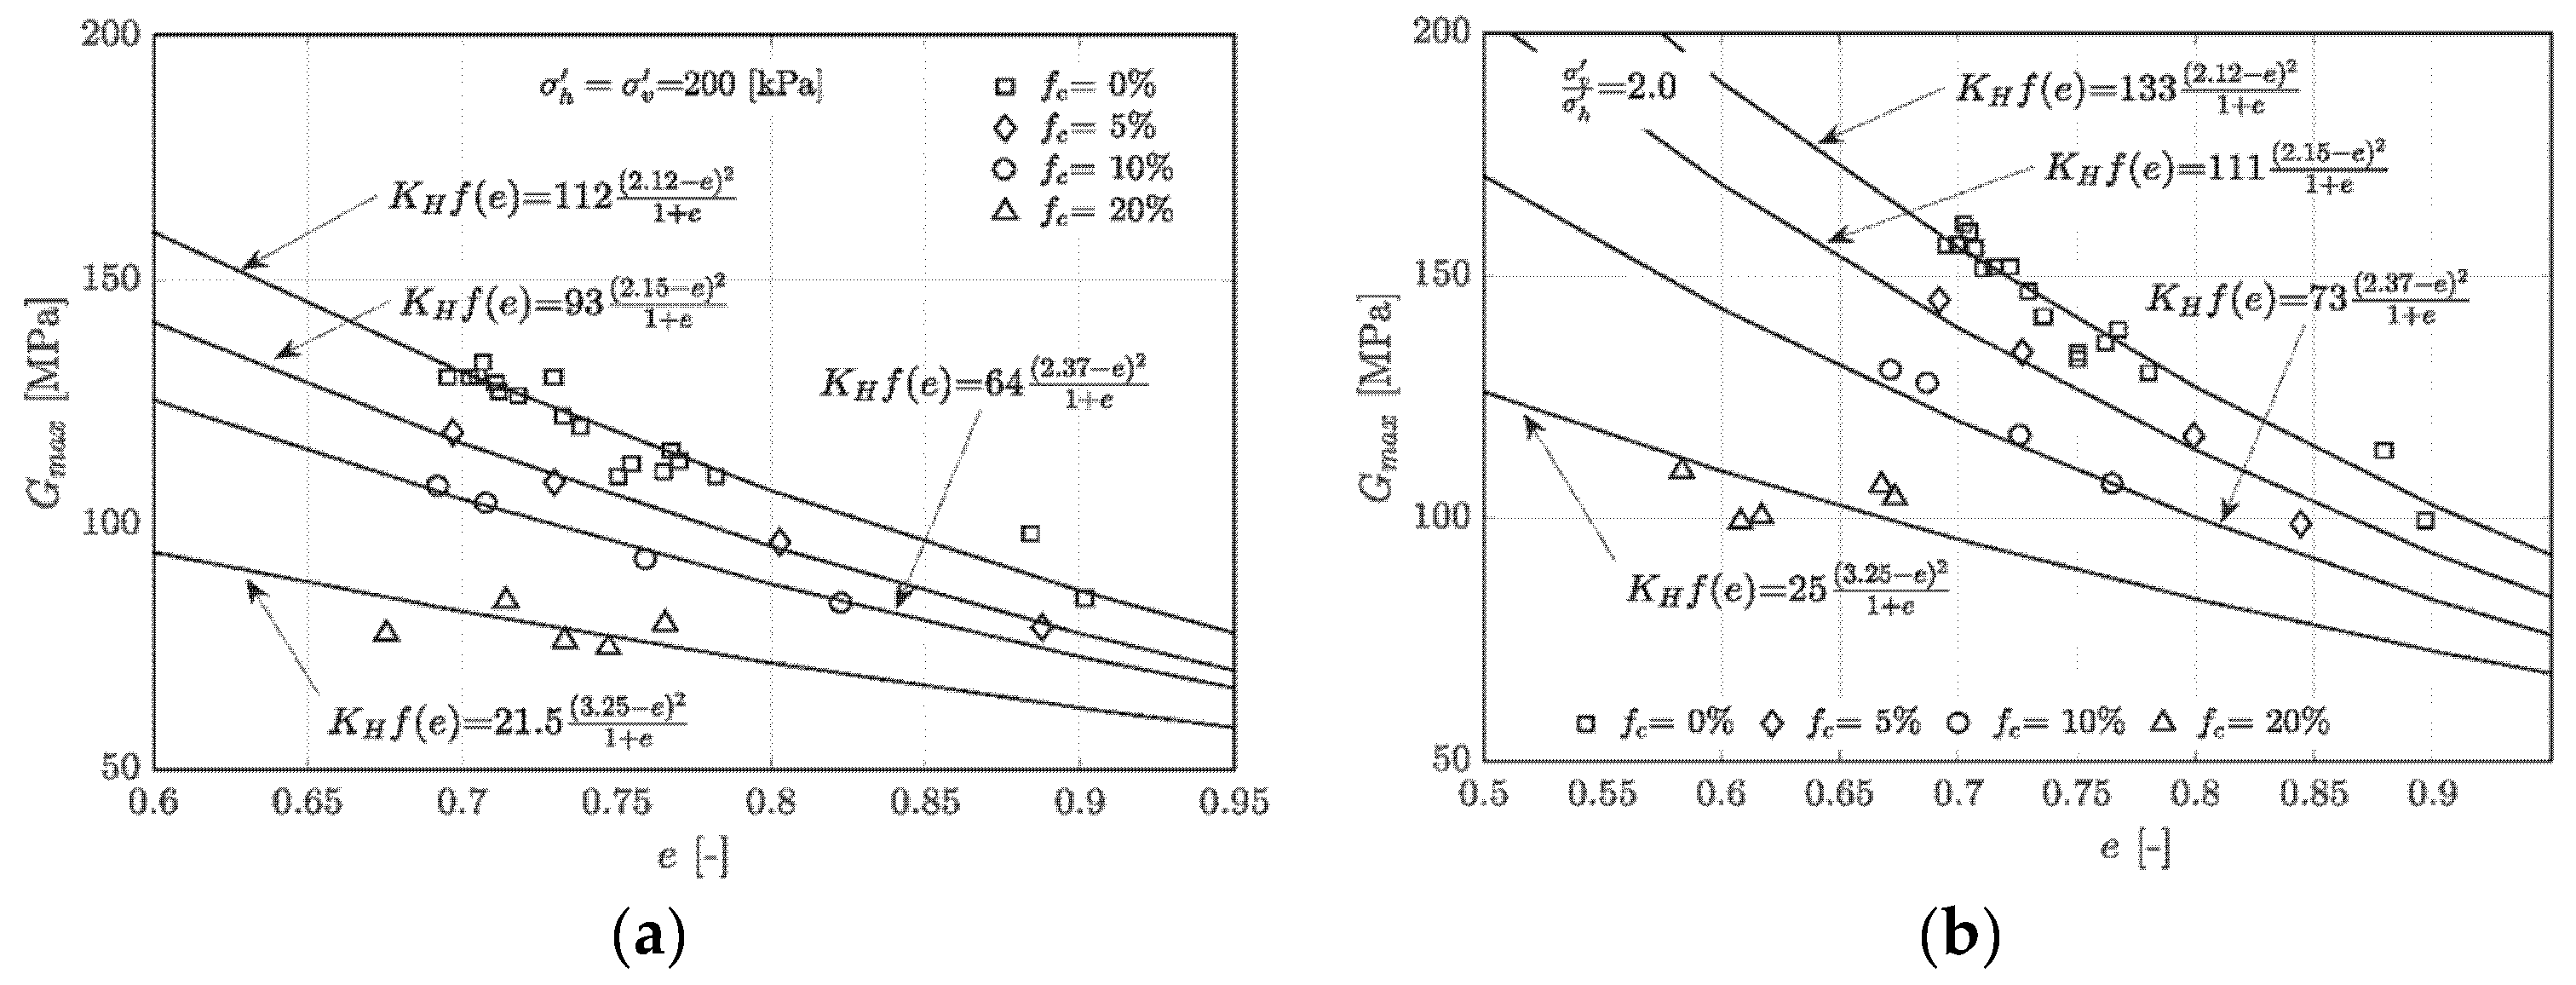
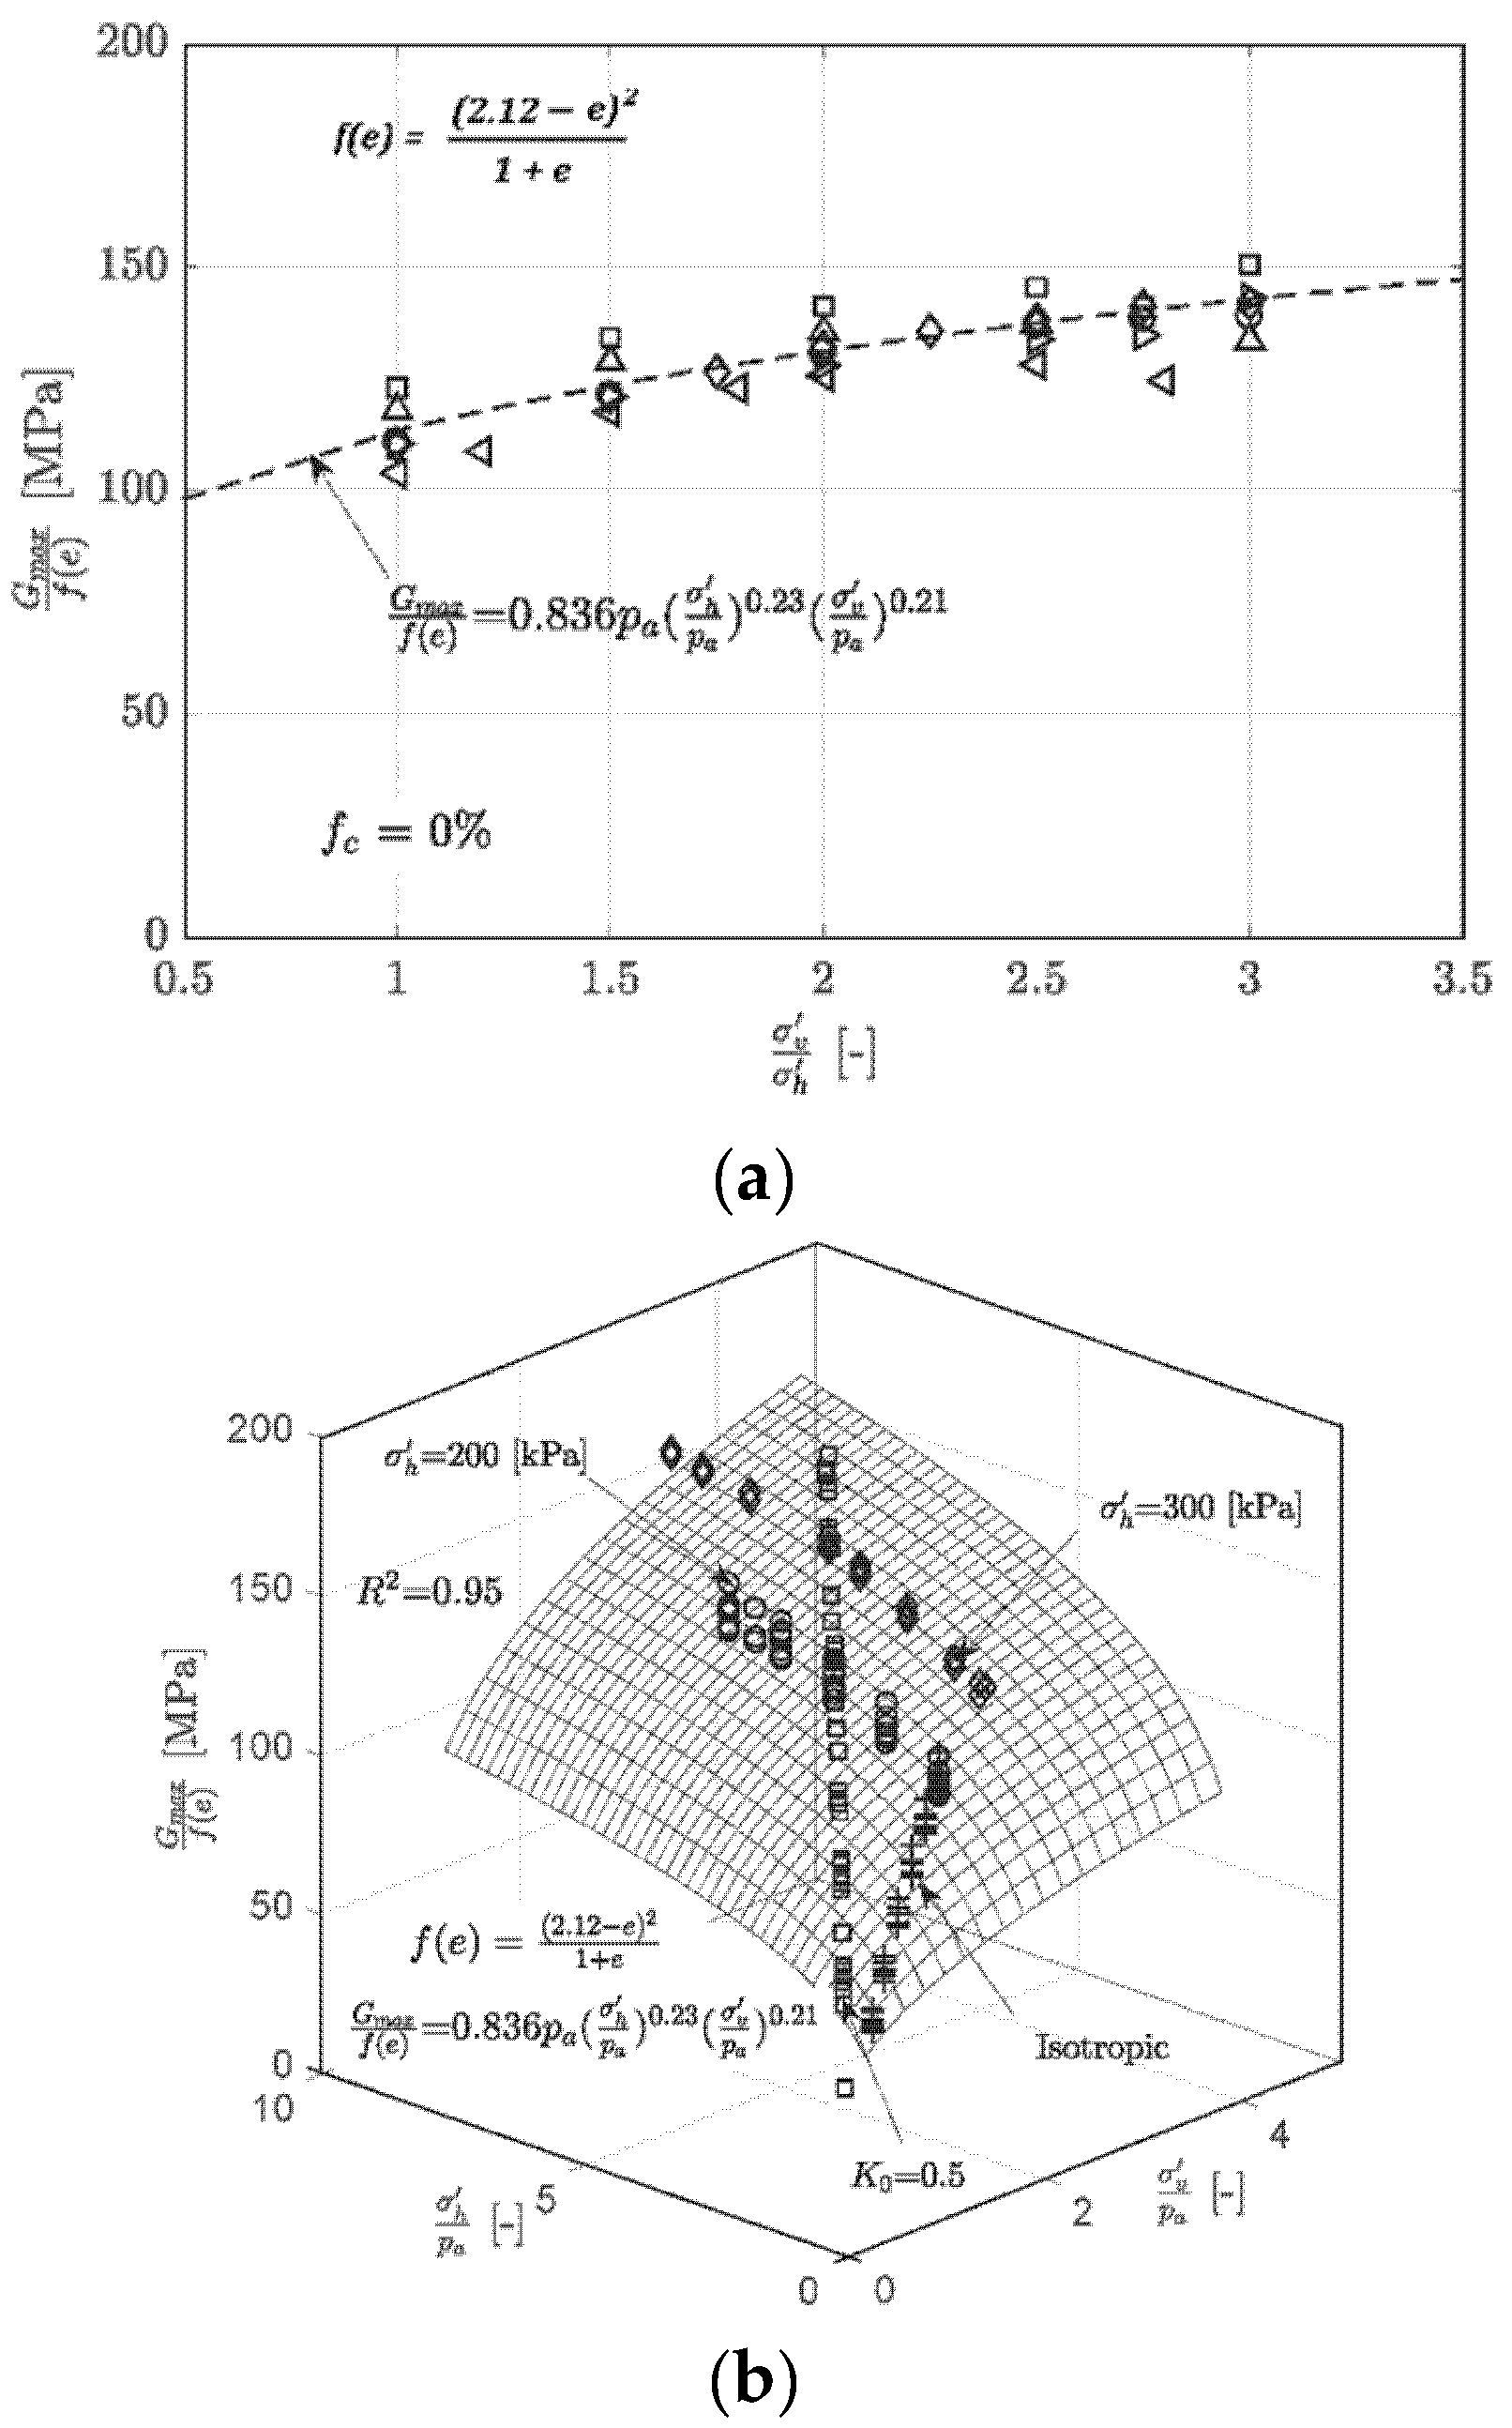
Using the popular models of [1,23], the variation in the Gmax with e, p′ and   σ v / σ h = 1 (isotropic) and 2 (anisotropic) was quantified as shown in Figure 9. In general, a good fit with the experimental data can be seen. Later, the Gmax was normalized with the void ratio function employing an average value of the fitting parameter c (= 2.12, 2.15, 2.37 and 3.25 for 0%, 5%, 10% and 20% fines, respectively). To capture the variation in the anisotropic stress, the Gmax was initially normalized with the Hardin’s void ratio function, considering the average value of the fitting parameter c (= 2.12, 2.15, 2.37 and 3.25 for 0%, 5%, 10% and 20% fines, respectively), following which the normalized Gmax was further plotted against the   σ v / σ h (shown only for the clean sand case in Figure 10a) to obtain the best fit magnitudes of the fitting parameters n v and   n h . Figure 10b presents a 3D overview of the variation of Gmax with regards to e,   σ v and   σ h (Equation (10) in the case of the clean sand only, shown in Figure 10b below, where the proposed model shows a good fit with the experimental data with R2 = 0.95 ( K 0   denotes the ratio   σ h / σ v ).
G m a x f e = 0.836 p a σ v p a 0.21 σ h p a 0.23
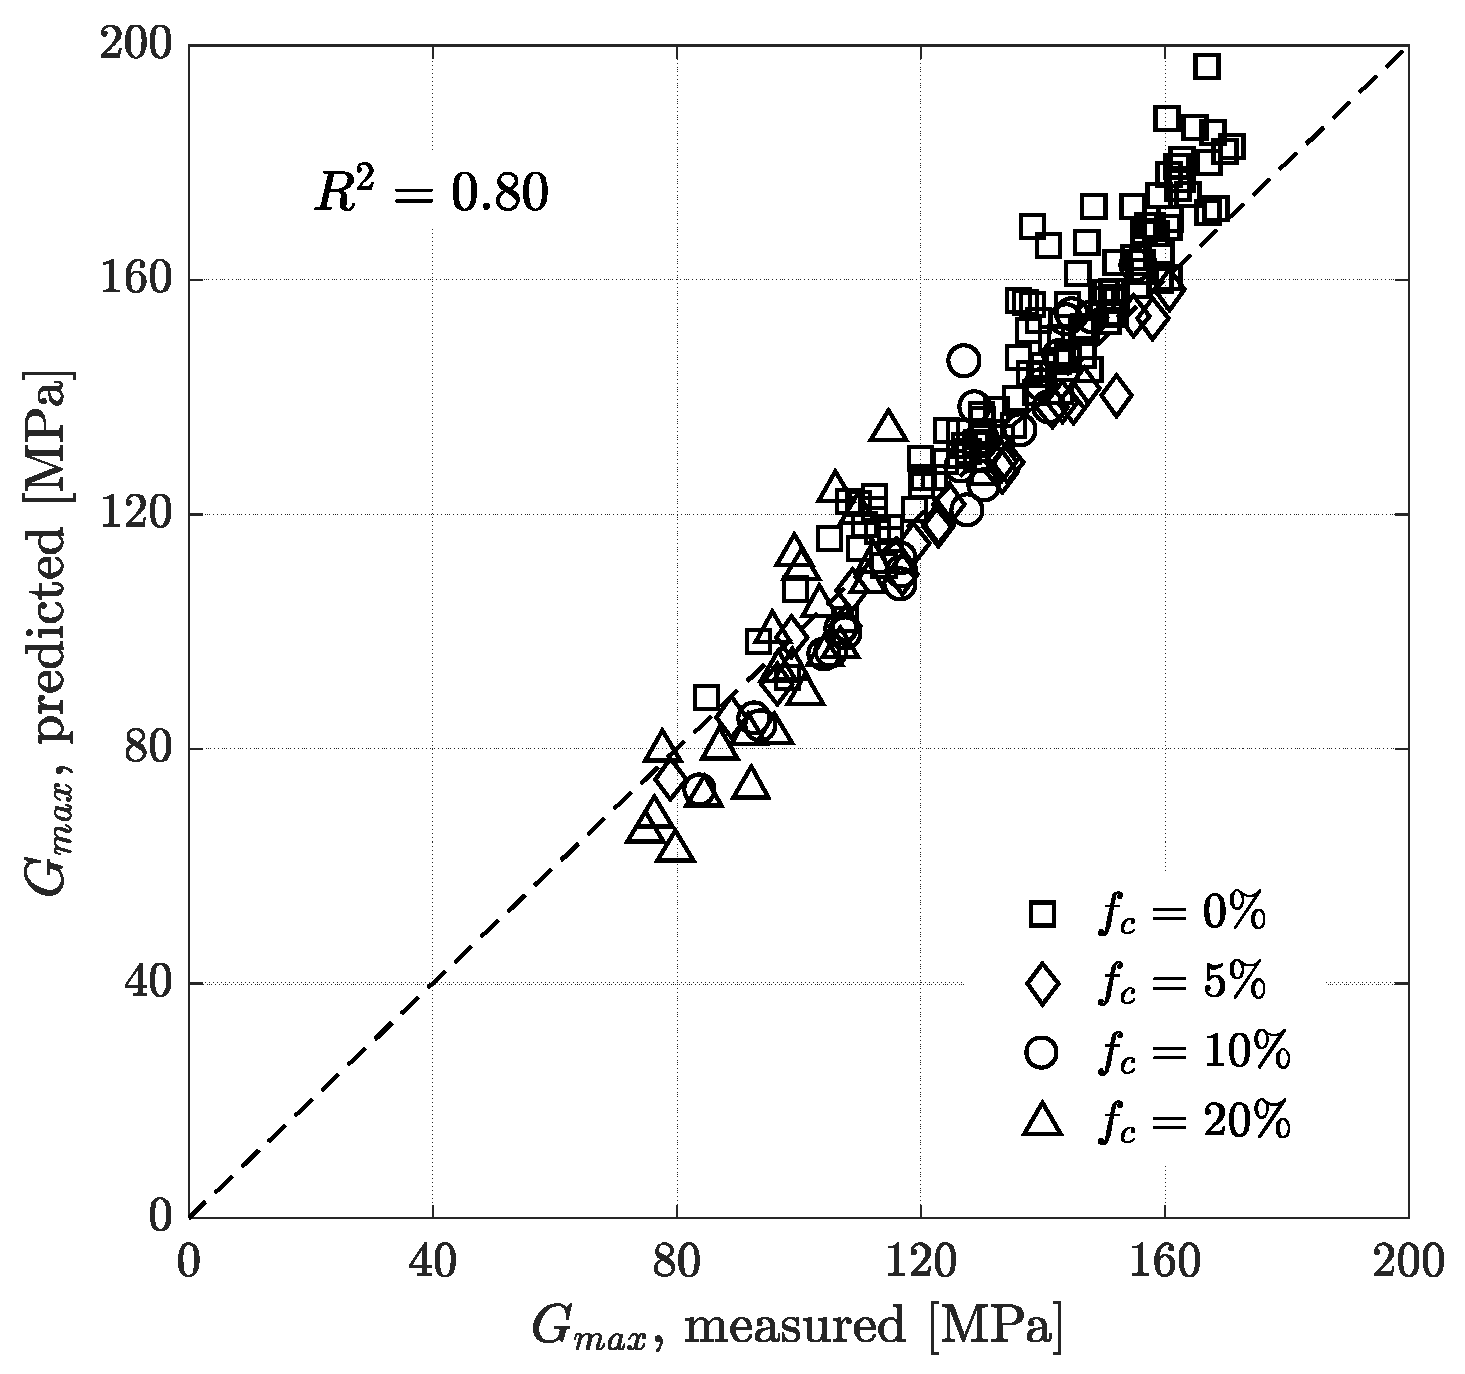
However, it is not possible to capture in a single curve the influence of varying fines content. Therefore, as suggested by various studies, the global void ratio can also be replaced by the equivalent granular void ratio e*, which would have the same magnitude as e for clean sand but would depend on the parameter b for fine content below the threshold fines. Based on the suggestion of [20] from their experiments with 10 sands, a value of 30% was deemed suitable for the fthr since it was able to capture many characteristic responses of undrained soil behavior regardless of host sands. The b value was calculated accordingly in order to convert the e to e* up to a fines content of 20%. The resulting Gmaxe* curves for both isotropic and anisotropic stress states are shown in Figure 11 below. The data at higher e* and lower Gmax show relatively greater scatter than at lower e* and higher Gmax. Hardin’s relationship also shows a slight deviation to higher e* and lower Gmax, which may be attributed to the inherent variability of Gmax. Figure 12 shows a comparison of the measured and predicted Gmax with the proposed Equation (10), where a good fit is evident (R2 = 0.80) for different fc values ranging between 0–20% as well as different degrees of anisotropy achieved by loading in the vertical direction ( 1 σ v / σ h 3 ).

5. Discussion

As shown in the previous section, by using e* instead of e in the Hardin’s model, it was possible to capture the influence of varying fines lower than the threshold value. The biggest advantage afforded by using e* is that one can avoid the numerous back calculations to determine the fitting parameters for each fines content. In addition, a solid micromechanical interpretation based on certain existing studies employing similar concepts [40,41,42,43,44] asserts a more logical approach, which, presently, is achieved via the b parameter—a micromechanical parameter specially designed to account for the positive or negative effects of fc or the micromechanical influence of fc in fine sand mixtures, and can be roughly estimated if the grain size distribution is available.

Micromechanical Interpretation

The stiffness of soil samples depends on microstructural properties, mainly grain-to-grain contacts that dictate the stiffness of the material. According to the theory of Hertz–Mindlin, the tangential or shear stiffness KT between two grains is a function of the normal stiffness KN, contact forces fT and fN and the elastic properties of the grains ([45,46]), and is mathematically represented as:
K T = C 2   K N   1 f T f N   t a n φ η  
K N = C 1 f N n  
η = n = 1 3  
n and η are fitting parameters. With the increase in the vertical load fN, the normal stiffness increases, which results in increments in the friction and, consequently, the tangential stiffness and shear modulus Gmax between particles. An additional load applied in the vertical direction results in an increase in fT. However, according to Equation (11), an increase in fT should result in a decrease in KT, which explains the slower increase in Gmax for anisotropic stresses compared to Gmax for isotropic cases.
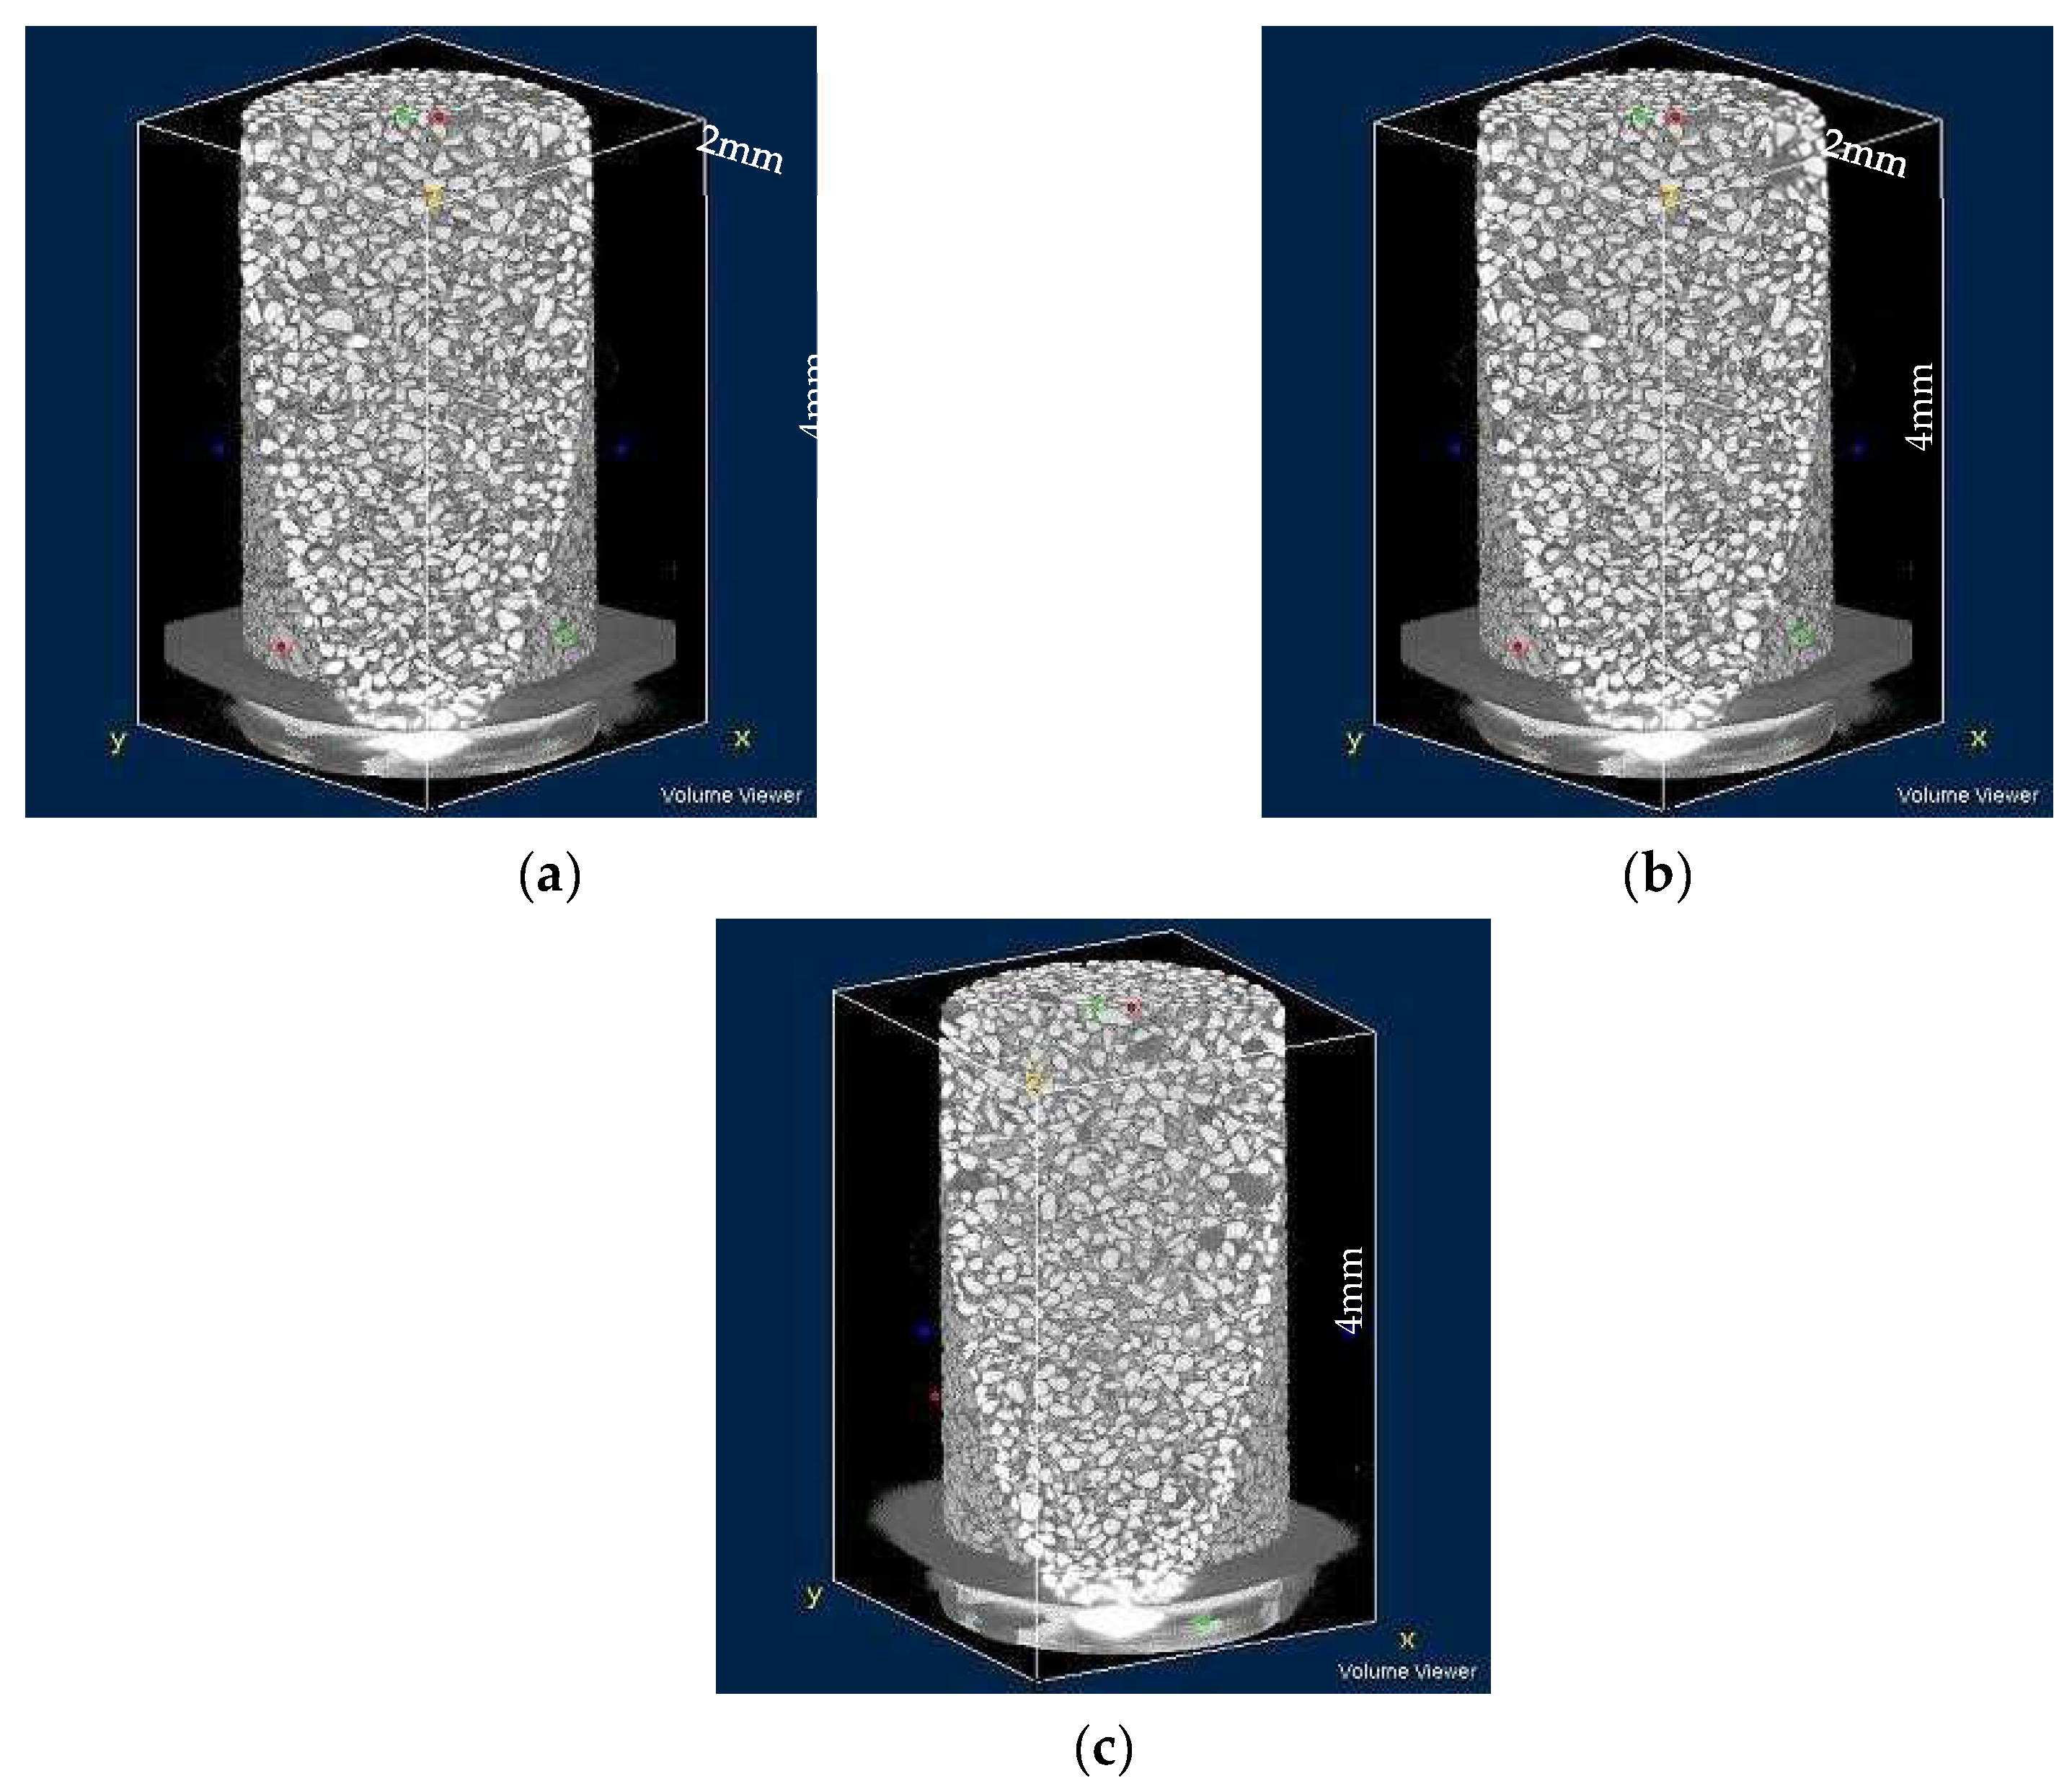
Presently, to reinforce our observations, a micro-CT scan was performed on the sample having 10% fines content in Kumamoto University in Japan (Figure 13a). The sample height and diameter for the CT scan was 40 mm and 7 mm, respectively (Figure 13b). Three densities were selected: loose ( ρ = 1.207 g/cm3, Figure 14a), medium-dense ( ρ = 1.312 g/cm3, Figure 14b) and dense ( ρ = 1.437 g/cm3, Figure 14c), details of which are in Table 1. The white particles denote sand grains, while those in gray denote fines, i.e., the quartz powder. From Figure 14a, the fines cover some of the coarse particles merely like a coating. Some of the fine grains arrange themselves between the coarse particles, i.e., these fine grains actively interact with the sand grains. The remaining fine grains distribute themselves in the voids between the coarse grains, i.e., these parts of the fine grains act inactively ([17]). An external load causes friction between the individual grains. For large grains, the friction surface is correspondingly large, making the grain-to-grain contact system relatively stable. Adding more fine grains (Figure 14b,c) reduces the friction area between the individual grains, causing the system to lose stability. Mathematically, this results in a lower contact force KT and thus results in a lower maximum shear stiffness ([10]).

6. Conclusions

The aim of the study was to demonstrate the variation of the maximum shear modulus in binary mixtures of sand–non-plastic fines considering stress anisotropy due to additional vertical loading. As already mentioned, individual studies considering stress anisotropy or mixtures were conducted in previous research, however this work presents one of the first considering both these influences. This paper briefly summarizes the results and interpretation of the tests with respect to the influence of stress anisotropy and fine grain content on the Gmax. The major findings are summed up below:
  • Based on a series of resonant column tests with different initial global void ratios and confining pressures, it was found that Gmax is lower for increasing fines content as well as higher void ratios. Using a popular empirical model, the variation of Gmax with void ratio, confining pressure and stress state was captured with a good accuracy.
  • Furthermore, to include fines content, the concept of equivalent intergranular void ratio was used where the global void ratio e was replaced by e* in the various formulations with a higher degree of accuracy, particularly for lower magnitudes of e*.
  • Micro-CT scans of the binary mixtures were additionally made to enable a closer look into the microstructure, e.g., grain-to-grain contacts. From the skeletal structure, the contact forces between the individual grains were evident. In the case of anisotropic stress, a shear force acts in addition to the normal force for isotropically loaded specimens. An increase in fines results in a reduction in the friction between sand grains which leads to lower contact stiffness.
The results of the present work will provide practical knowledge for design engineers to predict the shear modulus in binary mixtures considering the designed overburden vertical stress leading to a stress anisotropy, and therefore, allow them to reliably calculate ground settlements/factor of safety of structures under dynamic loads. Furthermore, advanced constitutive models can also incorporate both these influencing factors in complex multi-variable numerical simulations.
For future work, the influence of stress anisotropy and grain distribution on elastic modulus E, grain shape or size and grain minerals can be investigated. In addition, the influence of other stress paths can be checked. Furthermore, a higher percentage of fines greater than 20% can be investigated. For a more accurate interpretation of the results, various methods, such as the discrete element method (DEM), to determine the number of grain contacts or the force distribution on the grains can be applied.

Author Contributions

Conceptualization, M.G.; methodology, M.G.; validation, M.G.; formal analysis, M.G.; writing—original draft preparation, D.S.; writing—review and editing, M.G. and D.S. All authors have read and agreed to the published version of the manuscript.

Funding

This research received no external funding.

Institutional Review Board Statement

Not applicable.

Data Availability Statement

Not applicable.

Acknowledgments

The authors would like to acknowledge the student Huma Randjoor for assisting in the experiments. Furthermore, the authors would like to dedicate this work in the memory of the late Tom Schanz, who was instrumental with his ideas, and without whose support, the research would not have been successfully accomplished. The authors are further grateful to Kumamoto University, Japan for providing us the micro-CT scans of the materials in 2014.

Conflicts of Interest

The authors declare no conflict of interest.

References

  1. Hardin, B.O.; Black, W.L. Sand stiffness under various triaxial stresses. J. Soil Mech. Found. Div. 1966, 92, 27–42. [Google Scholar] [CrossRef]
  2. Drnevich, V.P. Resonant-Column Testing: Problems and Solutions; Technical Report; Dynamic Geotechnical Testing: ASTM International, USA, 1978; pp. 384–398. [Google Scholar]
  3. Seed, B.; Wong, R.; Idriss, I.; Tokimatsu, K. Moduli and Damping Factors for Dynamic Analyses of Cohesionless Soils; Technical Report; National Science Foundation: Alexandria, VA, USA, 1984. [Google Scholar]
  4. Jamiolkowski, M.; Lancellotta, R.; Lo Presti, D.C.F. Remarks on the stiffness at small strains of six Italian clays. In Proceedings of the International Symposium, Sapporo, Japan, 12–14 September 1994; pp. 817–836. [Google Scholar]
  5. Darendeli, M.B. Development of a New Family of Normalized Modulus Reduction and Material Damping Curves. Ph.D. Thesis, University of Texas at Austin, Austin, TX, USA, 2001. [Google Scholar]
  6. Wichtmann, T.; Triantafyllidis, T. On the influence of the grain size distribution curve of quartz sand on the small strain shear modulus. J. Geotech. Geoenviron. Eng. 2009, 135, 1404–1418. [Google Scholar] [CrossRef]
  7. Thevanayagam, S. Effect of fines and confining stress on undrained shear strength of silty sands. J. Geotech. Geoenviron. Eng. 1998, 124, 479–491. [Google Scholar] [CrossRef]
  8. Salgado, R.; Bandini, P.; Karim, A. Shear strength and stiffness of silty sand. J. Geotech. Geoenviron. Eng. 2000, 126, 451–462. [Google Scholar] [CrossRef]
  9. Wichtmann, T.; Navarrete Hernández, M.A.; Triantafyllidis, T. On the influence of a non-cohesive fines content on small strain stiffness, modulus degradation and damping of quartz sand. Soil Dyn. Earthq. Eng. 2015, 69, 103–114. [Google Scholar] [CrossRef]
  10. Goudarzy, M.; König, D.; Schanz, T. Small strain stiffness of granular materials containing fines. Soils Found. 2016, 56, 756–764. [Google Scholar] [CrossRef]
  11. Goudarzy, M.; König, D.; Santamarina, J.C.; Schanz, T. Influence of anisotropic stress state on the intermediate strain behaviour of granular materials. Geotechnique 2018, 68, 221–232. [Google Scholar] [CrossRef] [Green Version]
  12. Iwasaki, T.; Tatsuoka, F. Effects of grain size and grading on dynamic shear moduli of sands. Soils Found. 1977, 17, 19–35. [Google Scholar] [CrossRef]
  13. Tao, M.; Figueroa, J.; Saada, A. Influence of non-plastic fines content on the liquefaction resistance of soils in terms of the unit energy. In Cyclic Behavior of Soils and Liquefaction Phenomena; CRC Press: Boca Raton, FL, USA, 2004. [Google Scholar]
  14. Chien, L.K.; Oh, Y.N. Influence of fines content and initial shear stress on dynamic properties of hydraulic reclaimed soil. Can. Geotech. J. 2002, 39, 242–253. [Google Scholar] [CrossRef] [Green Version]
  15. Carraro, J.A.H.; Prezzi, M.; Salgado, R. Shear strength and stiffness of sands containing plastic of non-plastic fines. J. Geotech. Geoenviron. Eng. 2009, 135, 1167–1178. [Google Scholar] [CrossRef]
  16. Yang, J.; Liu, X. Shear wave velocity and stiffness of sand: The role of non-plastic fines. Geotechnique 2016, 66, 500–514. [Google Scholar] [CrossRef] [Green Version]
  17. Goudarzy, M.; Rahman, M.M.; König, D.; Schanz, T. Influence of non-plastic fine particles on maximum shear modulus of granular materials. Soils Found. 2016, 56, 973–983. [Google Scholar] [CrossRef]
  18. Goudarzy, M.; König, D.; Schanz, T. Small and intermediate strain properties of sands containing fines. Soil Dyn. Earthq. Eng. 2018, 110, 110–120. [Google Scholar] [CrossRef]
  19. Rahman, M.M.; Cubrinovski, M.; Lo, S.R. Initial shear modulus of sandy soils and equivalent granular void ratio. Geomech. Geoengin. 2012, 7, 219–226. [Google Scholar] [CrossRef]
  20. Rahman, M.M.; Lo, S.C.R.; Gnanendran, C.T. On equivalent granular void ratio and steady state behavior of loose sand with fines. Can. Geotech. J. 2008, 45, 1439–1455. [Google Scholar] [CrossRef] [Green Version]
  21. Rahman, M.M.; Lo, S.C.R.; Gnanendran, C.T. Reply to the discussion by Wanatowski and Chu on “On equivalent granular void ratio and steady state behaviour of loose sand with fines”. Can. Geotech. J. 2008, 46, 483–486. [Google Scholar] [CrossRef] [Green Version]
  22. Thevanayagam, S.; Shenthan, T.; Mohan, S.; Liang, J. Undrained fragility of clean sands, silty sands, and sandy silts. J. Geotech. Geoenviron. Eng. 2002, 128, 849–859. [Google Scholar] [CrossRef]
  23. Zuo, L.; Baudet, B.A. Determination of the transitional fines content of sand-non plastic fines mixtures. Soils Found. 2015, 55, 213–219. [Google Scholar] [CrossRef]
  24. Roesler, S. Anisotropic shear modulus due to stress anisotropy. J. Geotech. Eng. Div. 1979, 105, 871–880. [Google Scholar] [CrossRef]
  25. Bellotti, R.; Jamiolkowski, M.; Lo Presti, D.C.; O'Neill, D.A. Anisotropy of small strain stiffness in Ticino sand. Geotechnique 1996, 46, 115–131. [Google Scholar] [CrossRef]
  26. Zeng, X.; Ni, B. Stress-induced anisotropic Gmax of sands and its measurement. J. Geotech. Geoenviron. Eng. 1999, 125, 741–749. [Google Scholar] [CrossRef]
  27. Fioravante, V. Anisotropy of small strain stiffness of Ticino and Kenya sands from seismic wave propagation measured in triaxial testing. Soils Found. 2000, 40, 129–142. [Google Scholar] [CrossRef] [Green Version]
  28. Sadek, T.; Lings, M.; Dihoru, L.; Wood, D.M. Wave transmission in Hostun sand: Multi-axial experiments. Riv. Ital. Geotech. 2007, 2, 69–84. [Google Scholar]
  29. Wang, Y.; Mok, C. Mechanisms of small strain shear modulus anisotropy in soils. J. Geotech. Geoenviron. Eng. 2008, 134, 1516–1530. [Google Scholar] [CrossRef]
  30. Ezaoui, A.; Di Benedetto, H. Experimental measurements of the global anisotropic elastic behaviour of dry Hostun sand during triaxial tests, and effect of sample preparation. Geotechnique 2009, 59, 621–635. [Google Scholar] [CrossRef]
  31. Yanagisawa, E. Influence of void ratio and stress condition on the dynamic shear modulus of granular media. Adv. Mech. Flow Granul. Mater. 1983, 2, 947–960. [Google Scholar]
  32. Yu, P.; Richart, F. Stress ratio effects on shear modulus of dry sands. J. Geotech. Eng. 1984, 110, 331–345. [Google Scholar] [CrossRef]
  33. Ishibashi, I.; Chen, Y.; Chen, M.T. Anisotropic behavior of Ottawa sand in comparison with glass spheres. Soils Found. 1991, 31, 145–155. [Google Scholar] [CrossRef] [Green Version]
  34. Santamarina, C.; Cascante, G. Stress anisotropy and wave propagation: A micromechanical view. Can. Geotech. J. 1996, 33, 770–782. [Google Scholar] [CrossRef]
  35. Payan, M.; Khoshghalb, A.; Senetakis, K.; Khalili, N. Small-strain stiffness of sand subjected to stress anisotropy. Soil Dyn. Earthq. Eng. 2016, 88, 143–151. [Google Scholar] [CrossRef]
  36. Wichtmann, T.; Sonntag, T.; Triantafyllidis, T. Über das Erinnerungsvermögen von Sand unter zyklischer Belastung. Bautechnik 2001, 78, 852–865. [Google Scholar] [CrossRef]
  37. Goudarzy, M. Micro and Macro Mechanical Assessment of Small and Intermediate Strain Properties of Granular Material. Ph.D. Thesis, Ruhr-Universität Bochum, Bochum, Germany, 2015. [Google Scholar]
  38. DIN 18126:1996-11; Baugrund, Untersuchung von Bodenproben—Bestimmung der Dichte Nichtbindiger Böden bei Lockerster und Dichtester Lagerung. Beuth: Berlin, Germany, 1996. (In German)
  39. Goudarzy, M.; König, D.; Schanz, T. Interpretation of small and intermediate strain characteristics of Hostun sand for various stress states. Soils Found. 2018, 58, 1526–1537. [Google Scholar] [CrossRef]
  40. Bohaienko, V.; Bulavatsky, V. Fractional-Fractal Modeling of Filtration-Consolidation Processes in Saline Saturated Soils. Fractal Fract. 2020, 4, 59. [Google Scholar] [CrossRef]
  41. He, S.; Ding, Z.; Hu, H.; Gao, M. Effect of Grain Size on Microscopic Pore Structure and Fractal Characteristics of Carbonate-Based Sand and Silicate-Based Sand. Fractal Fract. 2021, 5, 152. [Google Scholar] [CrossRef]
  42. Fu, X.; Ding, H.; Sheng, Q.; Zhang, Z.; Yin, D.; Chen, F. Fractal Analysis of Particle Distribution and Scale Effect in a Soil–Rock Mixture. Fractal Fract. 2022, 6, 120. [Google Scholar] [CrossRef]
  43. Xu, J.; Shen, Y.; Sun, Y. Cyclic Mobilisation of Soil–Structure Interface in the Framework of Fractional Plasticity. Fractal Fract. 2022, 6, 76. [Google Scholar] [CrossRef]
  44. Adeli, E.; Rosic, B.V.; Matthies, H.G.; Reinstädler, S.; Dinkler, D. Bayesian Parameter determination of a CT-Test described by a Viscoplastic-Damage model considering the Model Error. Metals 2020, 10, 1141. [Google Scholar] [CrossRef]
  45. Yimsiri, S.; Soga, K. Application of micromechanics model to study anisotropy of soils at small strains. Soils Found. 2002, 42, 15–26. [Google Scholar] [CrossRef] [Green Version]
  46. Johnson, K.L. Contact Mechanics; Cambridge University: Cambridge, UK, 1985. [Google Scholar]
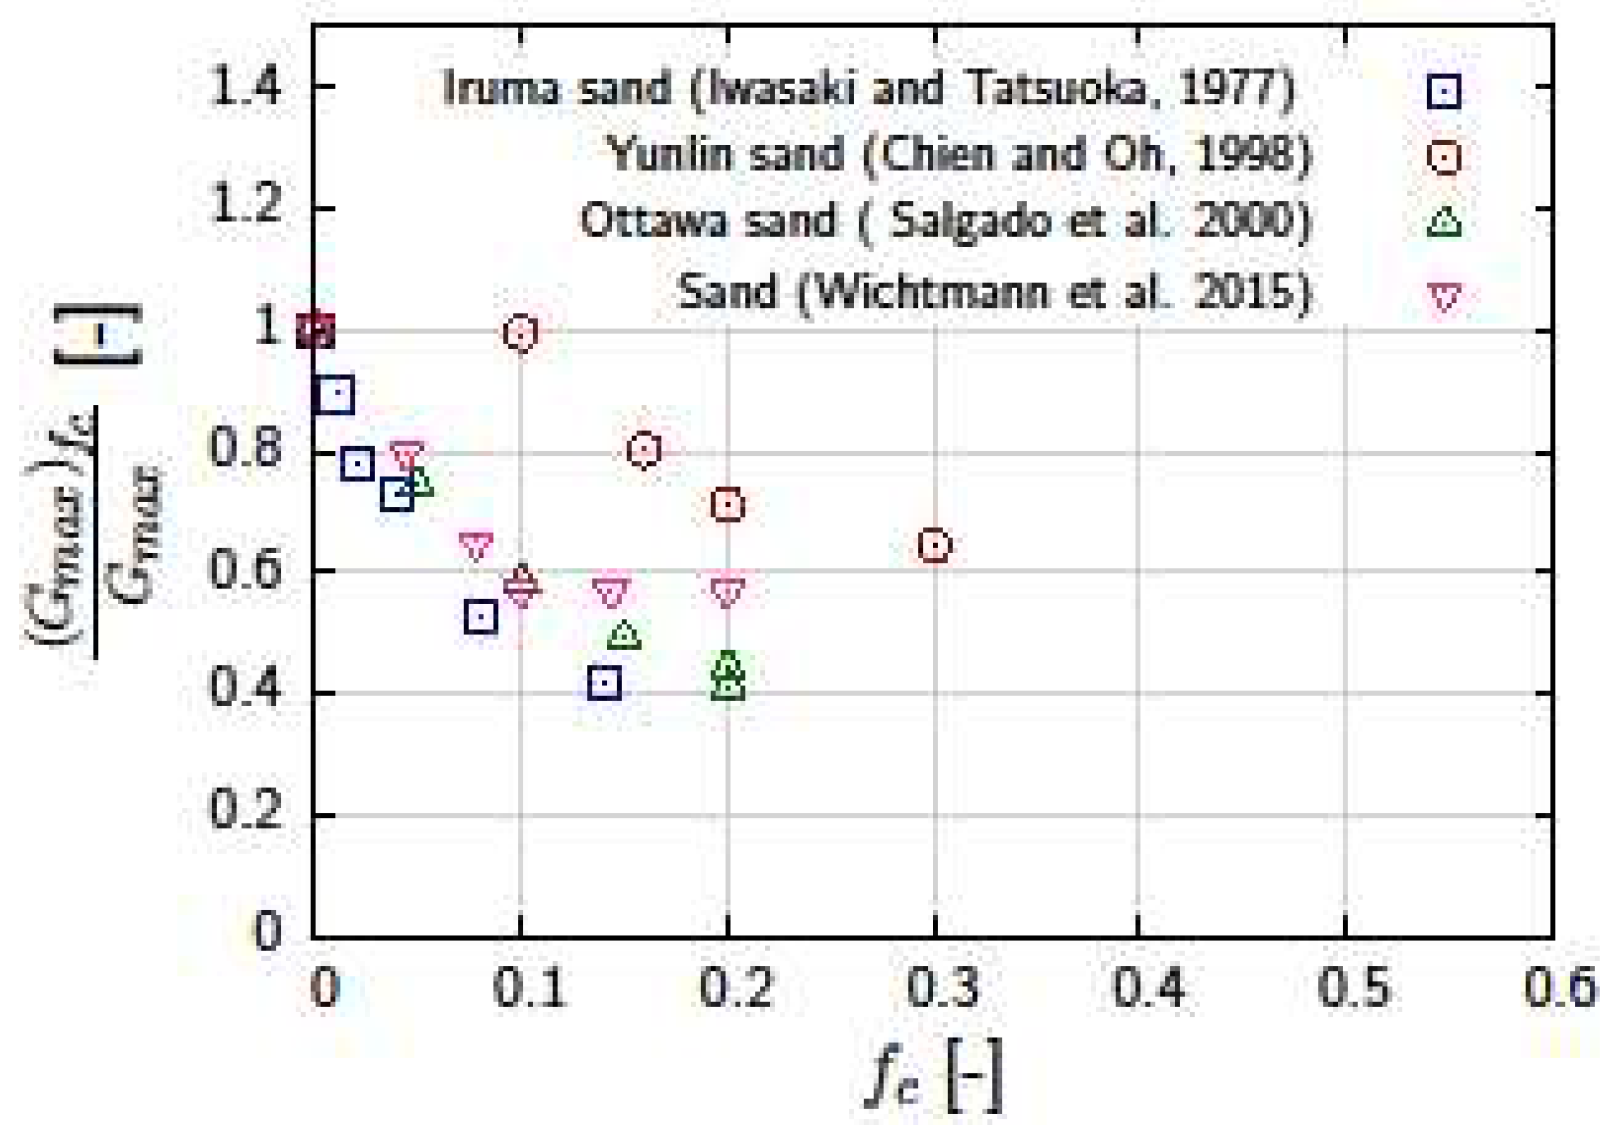
Figure 1. Reduction factor accompanying Equation (1) recommended by [12] to capture the influence of non-plastic fines on the maximum small-strain shear stiffness Gmax.
Fractalfract 06 00205 g001
Figure 2. (a) Influence of fines content on the Gmax via RC tests; (b) using the concept of equivalent granular void ratio e* to capture varying percentages of fines content ([10]).
Fractalfract 06 00205 g002
Figure 3. Schematic representation of the RC device used in the present study.
Fractalfract 06 00205 g003
Figure 4. (a) Clean Hostun sand and sand mixed with (b) 5%, (c) 10% and (d) 20% quartz fines used in the present study.
Fractalfract 06 00205 g004aFractalfract 06 00205 g004b
Figure 5. Grain size distribution of the tested materials.
Fractalfract 06 00205 g005
Figure 6. Void ratio e vs. anisotropic stress for (a) clean Hostun sand and sand mixed with (b) 5%, (c) 10% and (d) 20% fines, respectively.
Fractalfract 06 00205 g006
Figure 7. The influence of the anisotropic stress on the Gmax for (a) clean Hostun sand and sand mixed with (b) 5%, (c) 10% and (d) 20% fines, respectively.
Fractalfract 06 00205 g007
Figure 8. Variation of the Gmax with different void ratios and fines content under (a) isotropic and (b) anisotropic stress states.
Fractalfract 06 00205 g008
Figure 9. Prediction of the Gmax with different void ratios and fines content under (a) isotropic and (b) anisotropic stress states. The lines denote the best fits obtained using the Hardin void ratio equation,   K H f e .
Fractalfract 06 00205 g009
Figure 10. (a) Variation of the normalized Gmax (using the Hardin void ratio function) with the horizontal and vertical stresses accounting for both isotropic and anisotropic states; (b) 3D representation of the same (also shown in [39]).
Fractalfract 06 00205 g010
Figure 11. Using e* instead of e to predict Gmax under (a) isotropic and (b) anisotropic stress states.
Fractalfract 06 00205 g011
Figure 12. Comparison of the measured and predicted Gmax values considering different fines content.
Fractalfract 06 00205 g012
Figure 13. (a) Mixture of 10% quartz and 90% Hostun sand; (b) typical sample for micro-CT analysis.
Fractalfract 06 00205 g013
Figure 14. Micro-CT scan images for (a) loose, (b) medium-dense and (c) dense specimens for 10% fines content.
Fractalfract 06 00205 g014
Table 1. Schedules of the various samples for micro-CT analysis for different densities.
CaseMaterialWeight Ratio (%)Sample Height (mm)Weight (g)Dry Density (g/cm3)
QuartzHostun
1Quartz/Hostun109037.51.7421.207
234.51.312
331.51.437
Publisher’s Note: MDPI stays neutral with regard to jurisdictional claims in published maps and institutional affiliations.