Article

Application of Asymmetric Notched Semi-Circular Bending Specimen to Evaluate Mixed-Mode I-II Fracture Behaviors of Sandstone

1
School of Civil Engineering, Central South University, Changsha 410075, China
2
School of Resources and Safety Engineering, Central South University, Changsha 410083, China
3
School of Civil Engineering, Xuzhou University of Technology, Xuzhou 221018, China
*
Author to whom correspondence should be addressed.
Fractal Fract. 2022, 6(6), 336; https://doi.org/10.3390/fractalfract6060336
Submission received: 6 May 2022 / Revised: 12 June 2022 / Accepted: 15 June 2022 / Published: 17 June 2022
(This article belongs to the Special Issue Fractal Mechanics of Engineering Materials)

Abstract

:
In this paper, to investigate mixed-mode I-II fracture behaviors, three different asymmetric notched semi-circular bending specimens (ANSCB) were designed by adjusting the angle and the distance between supporting rollers to conduct asymmetric three-point bending tests. Several aid technologies, including acoustic emission (AE), digital image correlation (DIC), crack propagation gauge (CPG), and scanning electron microscopy (SEM), was utilized to monitor and assess the fracture characteristic. Meanwhile, the fractal dimension of the fracture surface was assessed based on the reconstructed digital fracture surface. The results show that mixed-mode I-II ANSCB three-point bending fracture is a brittle failure with the characteristics of the main crack being rapidly transfixed and the bearing capacity decreasing sharply. Based on the DIC method, the whole fracture process consists of a nonlinear elastic stage, fracture process zone, crack initiation stage and crack propagation stage. The crack initiation is mainly caused by the tension-shear strain concentration at the pre-existing crack tip. At the microscale, the crack propagation path is always along the grain boundary where the resultant stress is weakest. According to the monitoring of the AE, it can be found that micro-tensile cracks are mainly responsible for the asymmetric three-point bending fracture. The data obtained by CPG suggest that the subcritical crack growth rate is positively correlated to the ultimate load. In addition, asymmetric loading leads to a coarser fracture surface, and thus a higher fractal dimension of the fracture surface. The current study can provide a better understanding of the mixed-mode I-II fracture behaviors of rock.

1. Introduction

With the development of various geotechnical projects, such as civil engineering and mining engineering which involves rock mass, the hazards induced by the rock cracking are severe instability problems [1,2]. Several engineering instability cases and laboratory tests indicated that the progressive propagation of cracks can cause breakage of the rock mass [3]. Different from pure mode I or mode II loading in laboratory tests, rock cracking under mixed-mode I-II loadings is ubiquitous in actual engineering [4]. Therefore, the investigation of mixed-mode I-II fracture behaviors of rocks is crucial for the stability of geotechnical engineering.
It is acknowledged that rock cracking is mainly affected by many factors (for example, loading modes (i.e., pure mode I, pure mode II, and mixed-mode I-II), stress path [5], and environmental conditions (i.e., freezing-thawing [6], heating-cooling [7], chemical corrosion [8])). For the loading modes, mode I fracture and mode II fracture has been widely studied in rock in recent years. For instance, Wong [9] has fully studied mode I fracture behaviors of granite and sandstone, including microcrack propagation, and fracture process zone, and they found that the microcracking behavior is correlated to the fully-developed fracture process zones. Rao [10,11] devoted herself to investigating the mode II fracture mechanism and a novel measurement of mode II toughness has been proposed. In addition, the effect of environmental conditions on mode I fracture or mode II fracture has also been investigated. Cao [12,13] conducted a series of three-point bending tests to analyze the effect of the freezing-thawing (F-T) treatment on mode I fracture toughness and pointed out that the F-T treatment can weaken mode I fracture toughness. What’s more, they also reported that the F-T treatment can lead to rough fracture paths and a large fractal dimension of the fracture surface. Apart from the mode I and mode II fractures, there is little attention has been attracted to mixed mode I-II fractures. Therefore, it is necessary to conduct experimental research on the mechanism of mixed-mode I/II fracture.
The pre-existing testing methods for fracture analysis are various and many specimen models were developed, including semi-circular bending (SCB) [14], short bar (SB), Brazilian disk (BD) [15], and single edge notch beam (SENB) [16]. In particular, SCB was widely adopted for the advantages of little material consumption, simple sample preparation, and accurately experimental result [17]. Mixed-mode I + II fracture can be realized by adjusting the pre-existing crack angle. Based on the SCB, Wang [18] performed experimental and numerical investigation on the mixed-mode I-II fracture toughness of coal, and demonstrated that mixed-mode I-II fracture toughness decreases with the increase of the angle. In addition, adjusting the distance between supporting rollers is also can achieve mixed-mode I + II fracture, and some attempts have already been made. Guo [19] performed asymmetric three-point bending tests on the SCB specimens, and cracking mechanisms were discussed. Although the mechanical and fracture behavior of mixed-mode I-II mode has been extensively studied, there are few applications of asymmetric notched semi-circular bending to evaluate mixed-mode I-II fracture behaviors. It’s also worth noting that many novel insights into the rock were obtained by the technology-aid, such as acoustic emission (AE) [20], digital image correlation (DIC) [21], scanning electron microscopy (SEM) [22], and numerical simulation [23]. These aid technologies can give us a comprehensive understanding of fracture behaviors. Based on the AE technology, Zhou [24] study the brittle failure of granite and sandstone, and the correlation between fracture and AE behaviors (i.e., event, energy, amplitude) was developed. Insights from the DIC method, Chen [22] divided the crack growth process of sandstone into three stages, including the primary stage, secondary stage, and tertiary stage. In addition, microscopic failure mechanisms (i.e., intergranular failure, and transgranular failure) can be observed by SEM. Therefore, AE, DIC, SEM, and crack propagation gauge (CPG) was applied in this paper to assess the characteristics of mixed-mode I-II fracture.
As for the fracture surface morphology, it records the crack initiation and propagation to failure under the co-effect of loading conditions, environmental conditions, and other factors. Currently, many scholars have studied the fracture surface morphology, especially the fractal dimension. For example, Cui [25] investigated the effect of loading rate on split fracture surface topography and found that the fractal dimension increased with the increase of the loading rate. Zhuang [26] reported the effect of temperature and injection flow rate on the fractal dimension, and also found that the fractal dimension increase with increasing temperature and lowering rate. Additionally, the relationship between the fractal dimension and fracture mechanism has been widely concerned. Therefore, this work also evaluates the mixed-mode I-II fracture behaviors of sandstone from the fractal dimension.
The objective of this paper is to evaluate mixed-mode I-II fracture behaviors of rock by the asymmetric notched semi-circular bending specimen, and the red sandstone from Yunnan, China was selected as the research object. Three different asymmetric notched semi-circular bending (ANSCB) specimens were designed by adjusting the angle and the distance between supporting rollers. Apart from the mechanical properties, the fractal dimension of the fracture surface has also been discussed. This study can provide effective guidance to design the tunnel infrastructure, slope, bridge abutments, and other rock-related projects.

2. Test Procedures

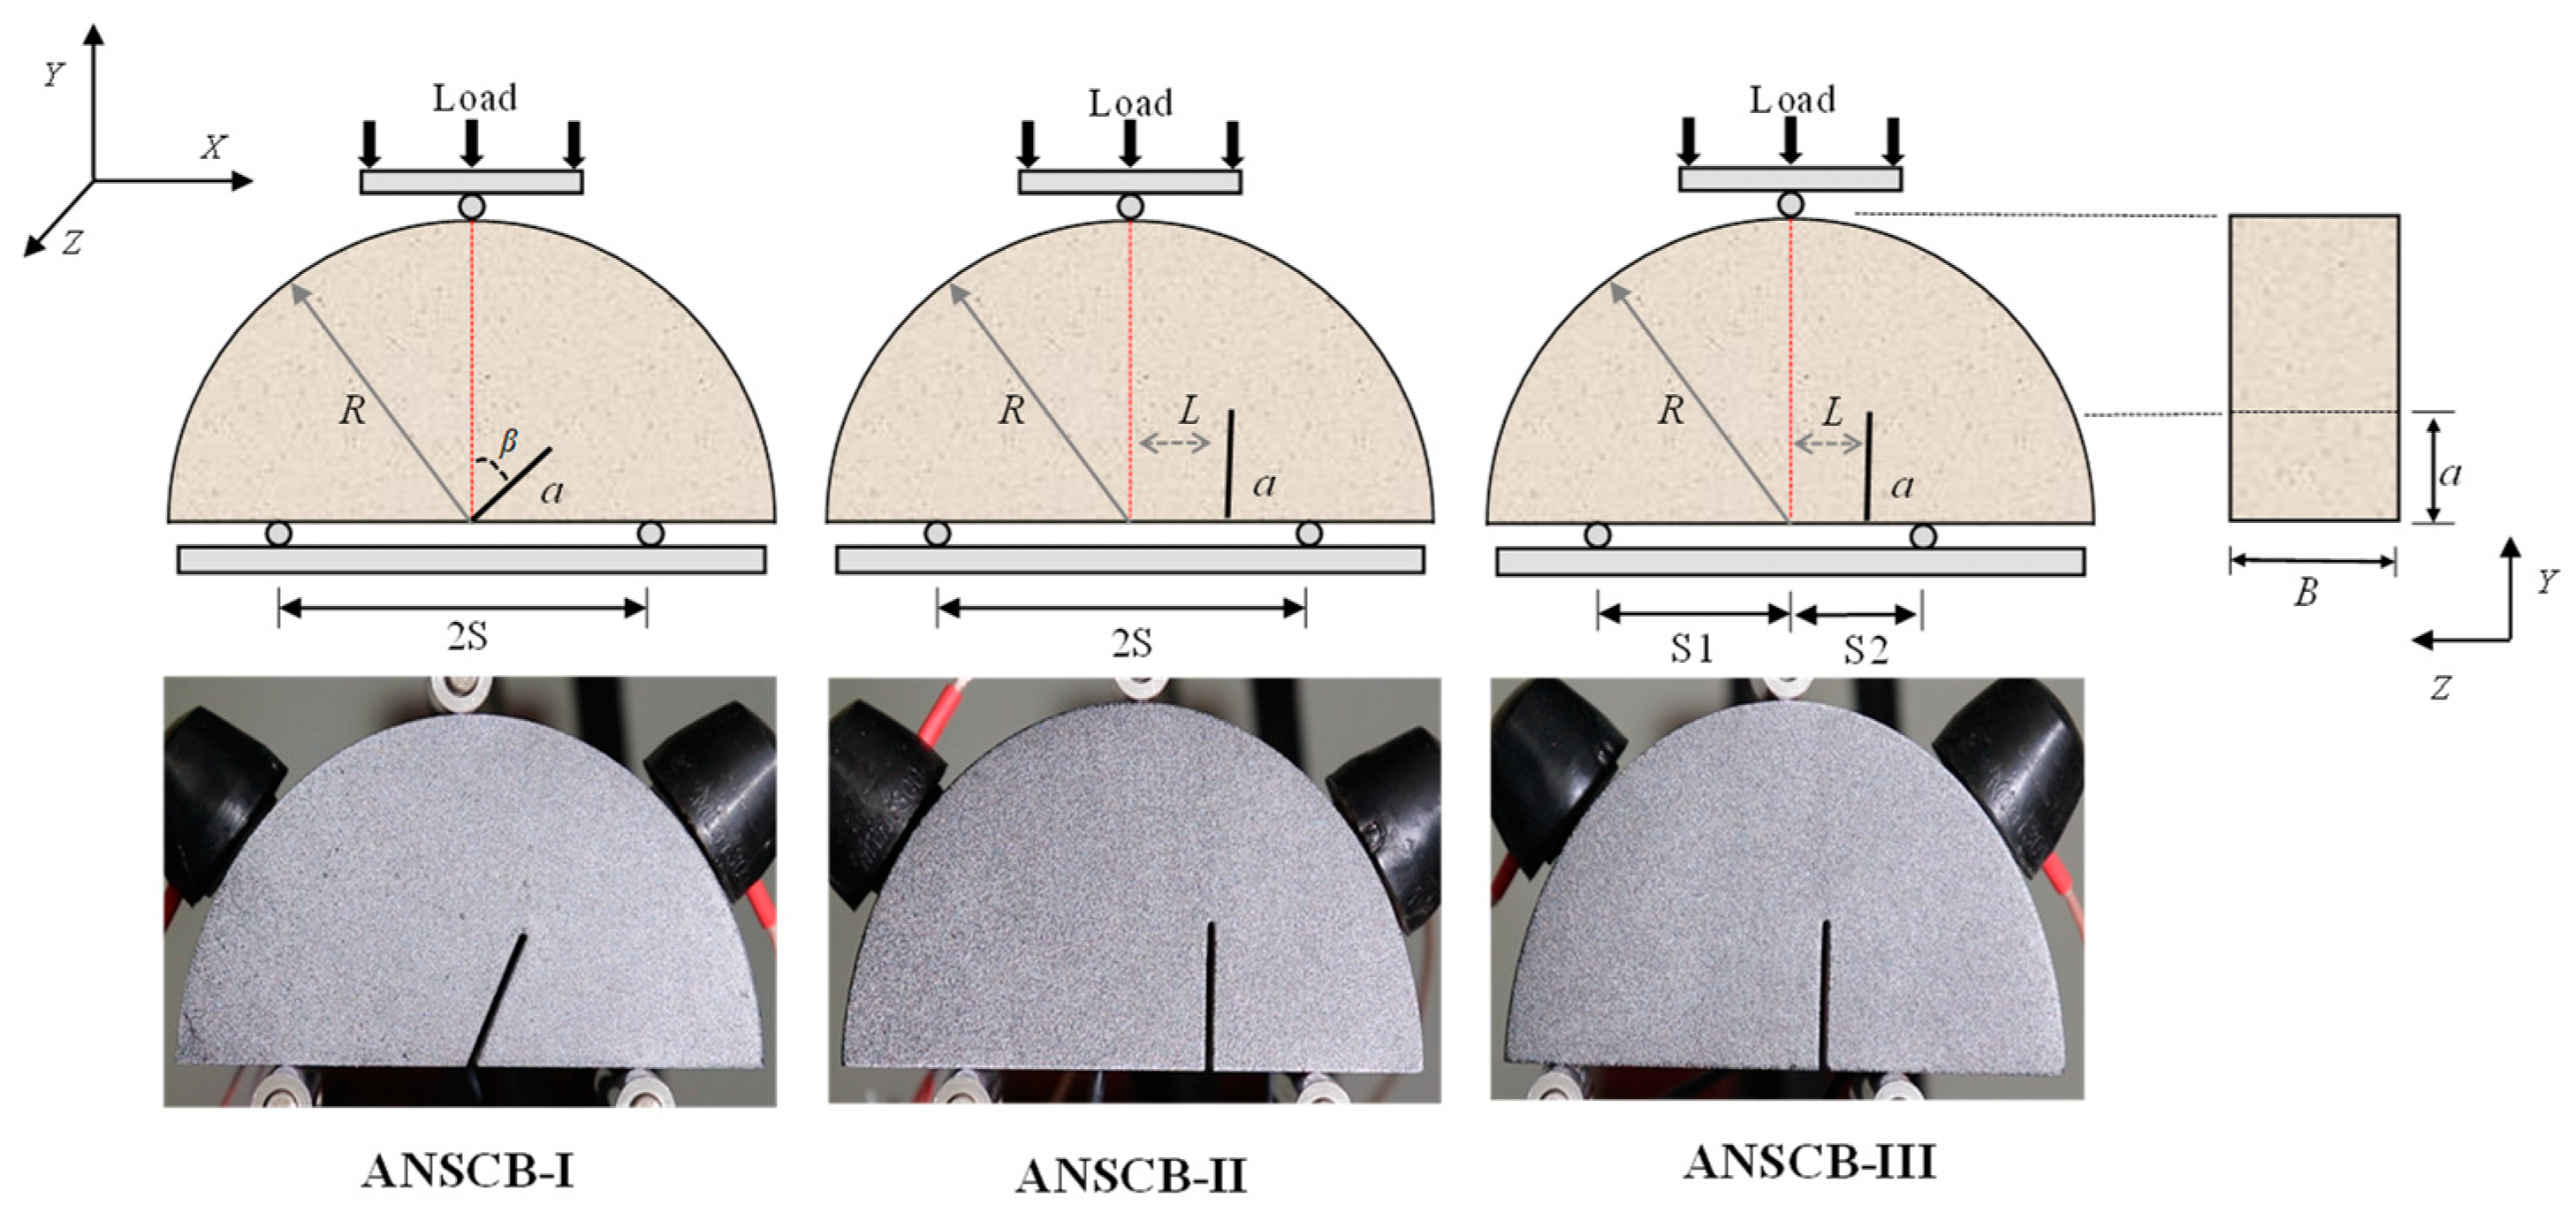
2.1. Materials and Specimen Preparation
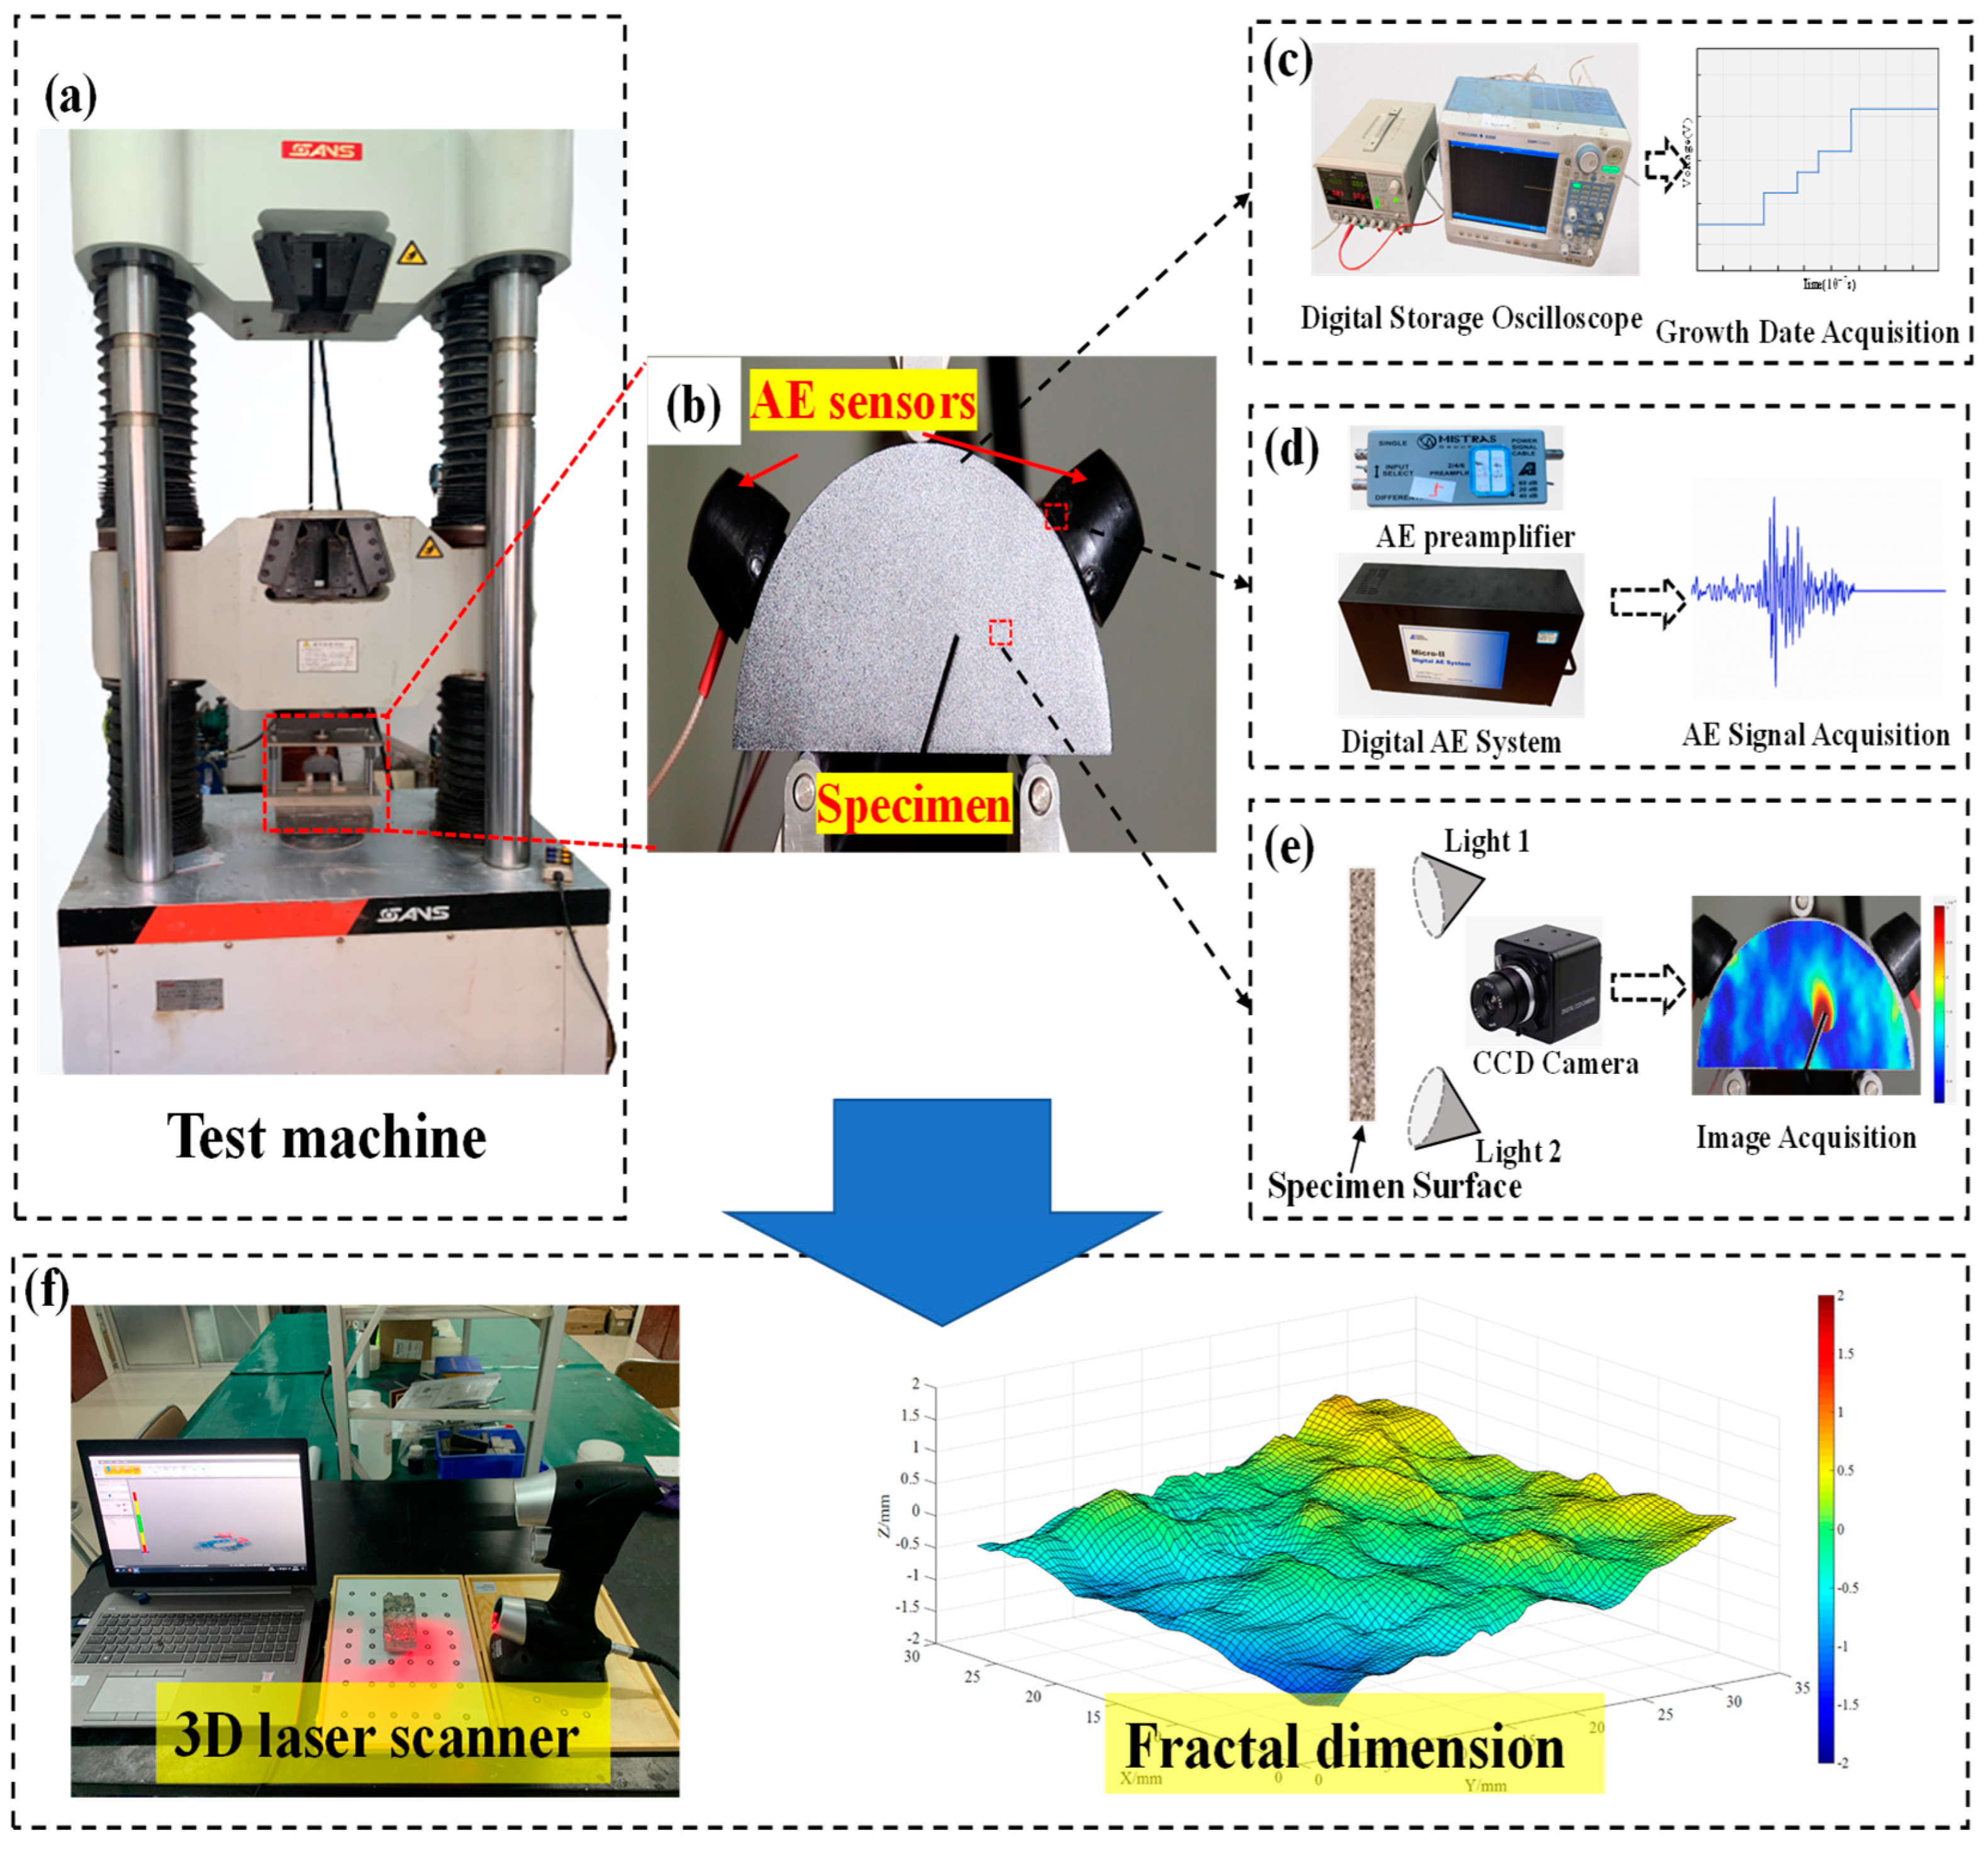
There are various kinds of rock in nature, and each of them has different physical and chemical properties. As a widely distributed rock, red sandstone was selected as the research object in this paper. To ensure the uniformity of the test result, all specimens were cored from the same intact red sandstone mass. The investigated sandstone belongs to fine sandstone, and it is light brown, and the grains are dense. Based on the basic mechanical test, including the uniaxial compression on the standard cylindrical specimen ( 50 × 100 mm) and the Brazilian disc splitting test on the standard disc specimen ( 50 × 25 mm), some essential physical and mechanical properties of the investigated sandstone can obtain, as presented in Table 1.
This paper employed three specifications of asymmetric notched semi-circular bending specimens (ANSCB), and three samples were prepared for each model. The detailed structure and photos of the specimen are displayed in Figure 1. The specimen with a radius of 50 mm and a thickness of 35 mm. The prefabricated notch was cut by a water jet, and the width of the notch is approximately 1 mm and the notch length is 20 mm. The ratio of notch length to the radius of the ANSCB specimen is a / R = 0.4 in this work. In the test, the specimen is subjected to three-point bending until stress-induced cracks initiate from the notch tips and propagate upwards. Asymmetric loading was realized by adjusting the crack angle and the distance between two support rollers, and the dimensional parameters of three ANSCBs were listed in Table 2. It is noted that asymmetric loading can change the stress intensity factor at the crack tip, and from ANSCB-I to ANSCB-II and ANSCB-III, the mode II stress intensity factor increases, while the mode I stress intensity factor decreases [27].

2.2. Test Apparatus

The tests were conducted by a SANS-CHT4206 universal material testing machine, as shown in Figure 2a, and its maximum load is 2000 kN. As commonly non-destructive monitoring techniques, the acoustic emission system (AE) (see Figure 2d) and digital image correlation (DIC) (see Figure 2e) were also employed to monitor and evaluate the failure process of specimens. In the test, two AE sensors were pasted on the side of the specimen by the black fixator, as shown in the photo in Figure 2b, to receive the AE signal. The gain of the preamplifier was set to 40 dB, and the threshold was also set to 40 dB. For the DIC measurement, the shooting frequency was set as 40 Hz, and Matlab software was used to calculate the strain and displacement field. In addition, the displacement-control method was adopted at a loading rate of 0.05 mm/min, which was conducive to the steady development of pre-existing cracks along the expected direction [28]. Representative load-deflection curves of each ANSCB specimen are plotted in Figure 3.
A crack propagation gauge (CPG) was used to record crack growth rate, and the measuring principle and acquisition equipment is shown in Figure 4, including a power supply, an oscilloscope, two 50 Ω resistors, and a computer. The CPG was pasted along the line between the pre-existing crack tip and the loading point. The CPG was composed of 15 parallel resistance wires, the distance between adjacent resistance wires is 1.5 mm. Assuming that the crack propagation path was perpendicular to each gate line, which means the crack propagation path was regarded as a straight line between adjacent resistance wires [29]. If the resistance wires in parallel broke successively, the total resistance of the CPG would change, and it was directly reflected in voltage fluctuation, and the variation of voltage signals was collected by an oscilloscope with a frequency of 10 MHz. Once the resistance wire broke one by one, the voltage increased in a stepwise manner, as shown in Figure 2c. The duration time of each step corresponded to the time required for crack propagation in 1.5 mm. Based on the time of voltage variation, the crack growth rate can be calculated by:
V i = l t i t i 1 ( i = 1 , 2 15 ) ,
where t i is the instant moment when the i-th resistance wire breaks; V i is the instantaneous crack propagation rate among t i and t i 1 ; ∆l is the distance between two adjacent resistance wires and l = 1.5 mm in this paper.
Additionally, an automatic 3D laser scanner was employed to scan the fracture surface topography, as displayed in Figure 2f. Specifically, the scanning accuracy was set at a 0.01 mm sampling interval in this study. Based on Matlab, the box method was used to calculate fractal dimensions in this work. First, suppose a cube box with a side length δ , and the employing cubic boxes to measure the fracture surface, and there are N ( δ ) cubic boxes on the fracture surface, and its principle is as follows [30]:
N ( δ ) = δ D ,
D = l o g 10 ( N ( δ ) ) l o g 10 ( δ ) ,
where D is the fractal dimension. N ( δ ) represents the total number of cubic boxes and can be calculated by [31]:
N ( δ ) = i , j = 1 n 1 N i , j = I N T { 1 δ [ max ( z 1 ( i , j ) , z 2 ( i + 1 , j ) , z 3 ( i , j + 1 ) , z 4 ( i + 1 , j + 1 ) ) min ( z 1 ( i , j ) , z 2 ( i + 1 , j ) , z 3 ( i , j + 1 ) , z 4 ( i + 1 , j + 1 ) ) ] } ,
where N i , j represents the elementary surface determined by four adjacent points i, j, i + 1, and j + 1. z n ( i , j ) represents the interpolated height of the surface at the point (i, j), and INT() represents the integrating function.

3. Results and Discussion

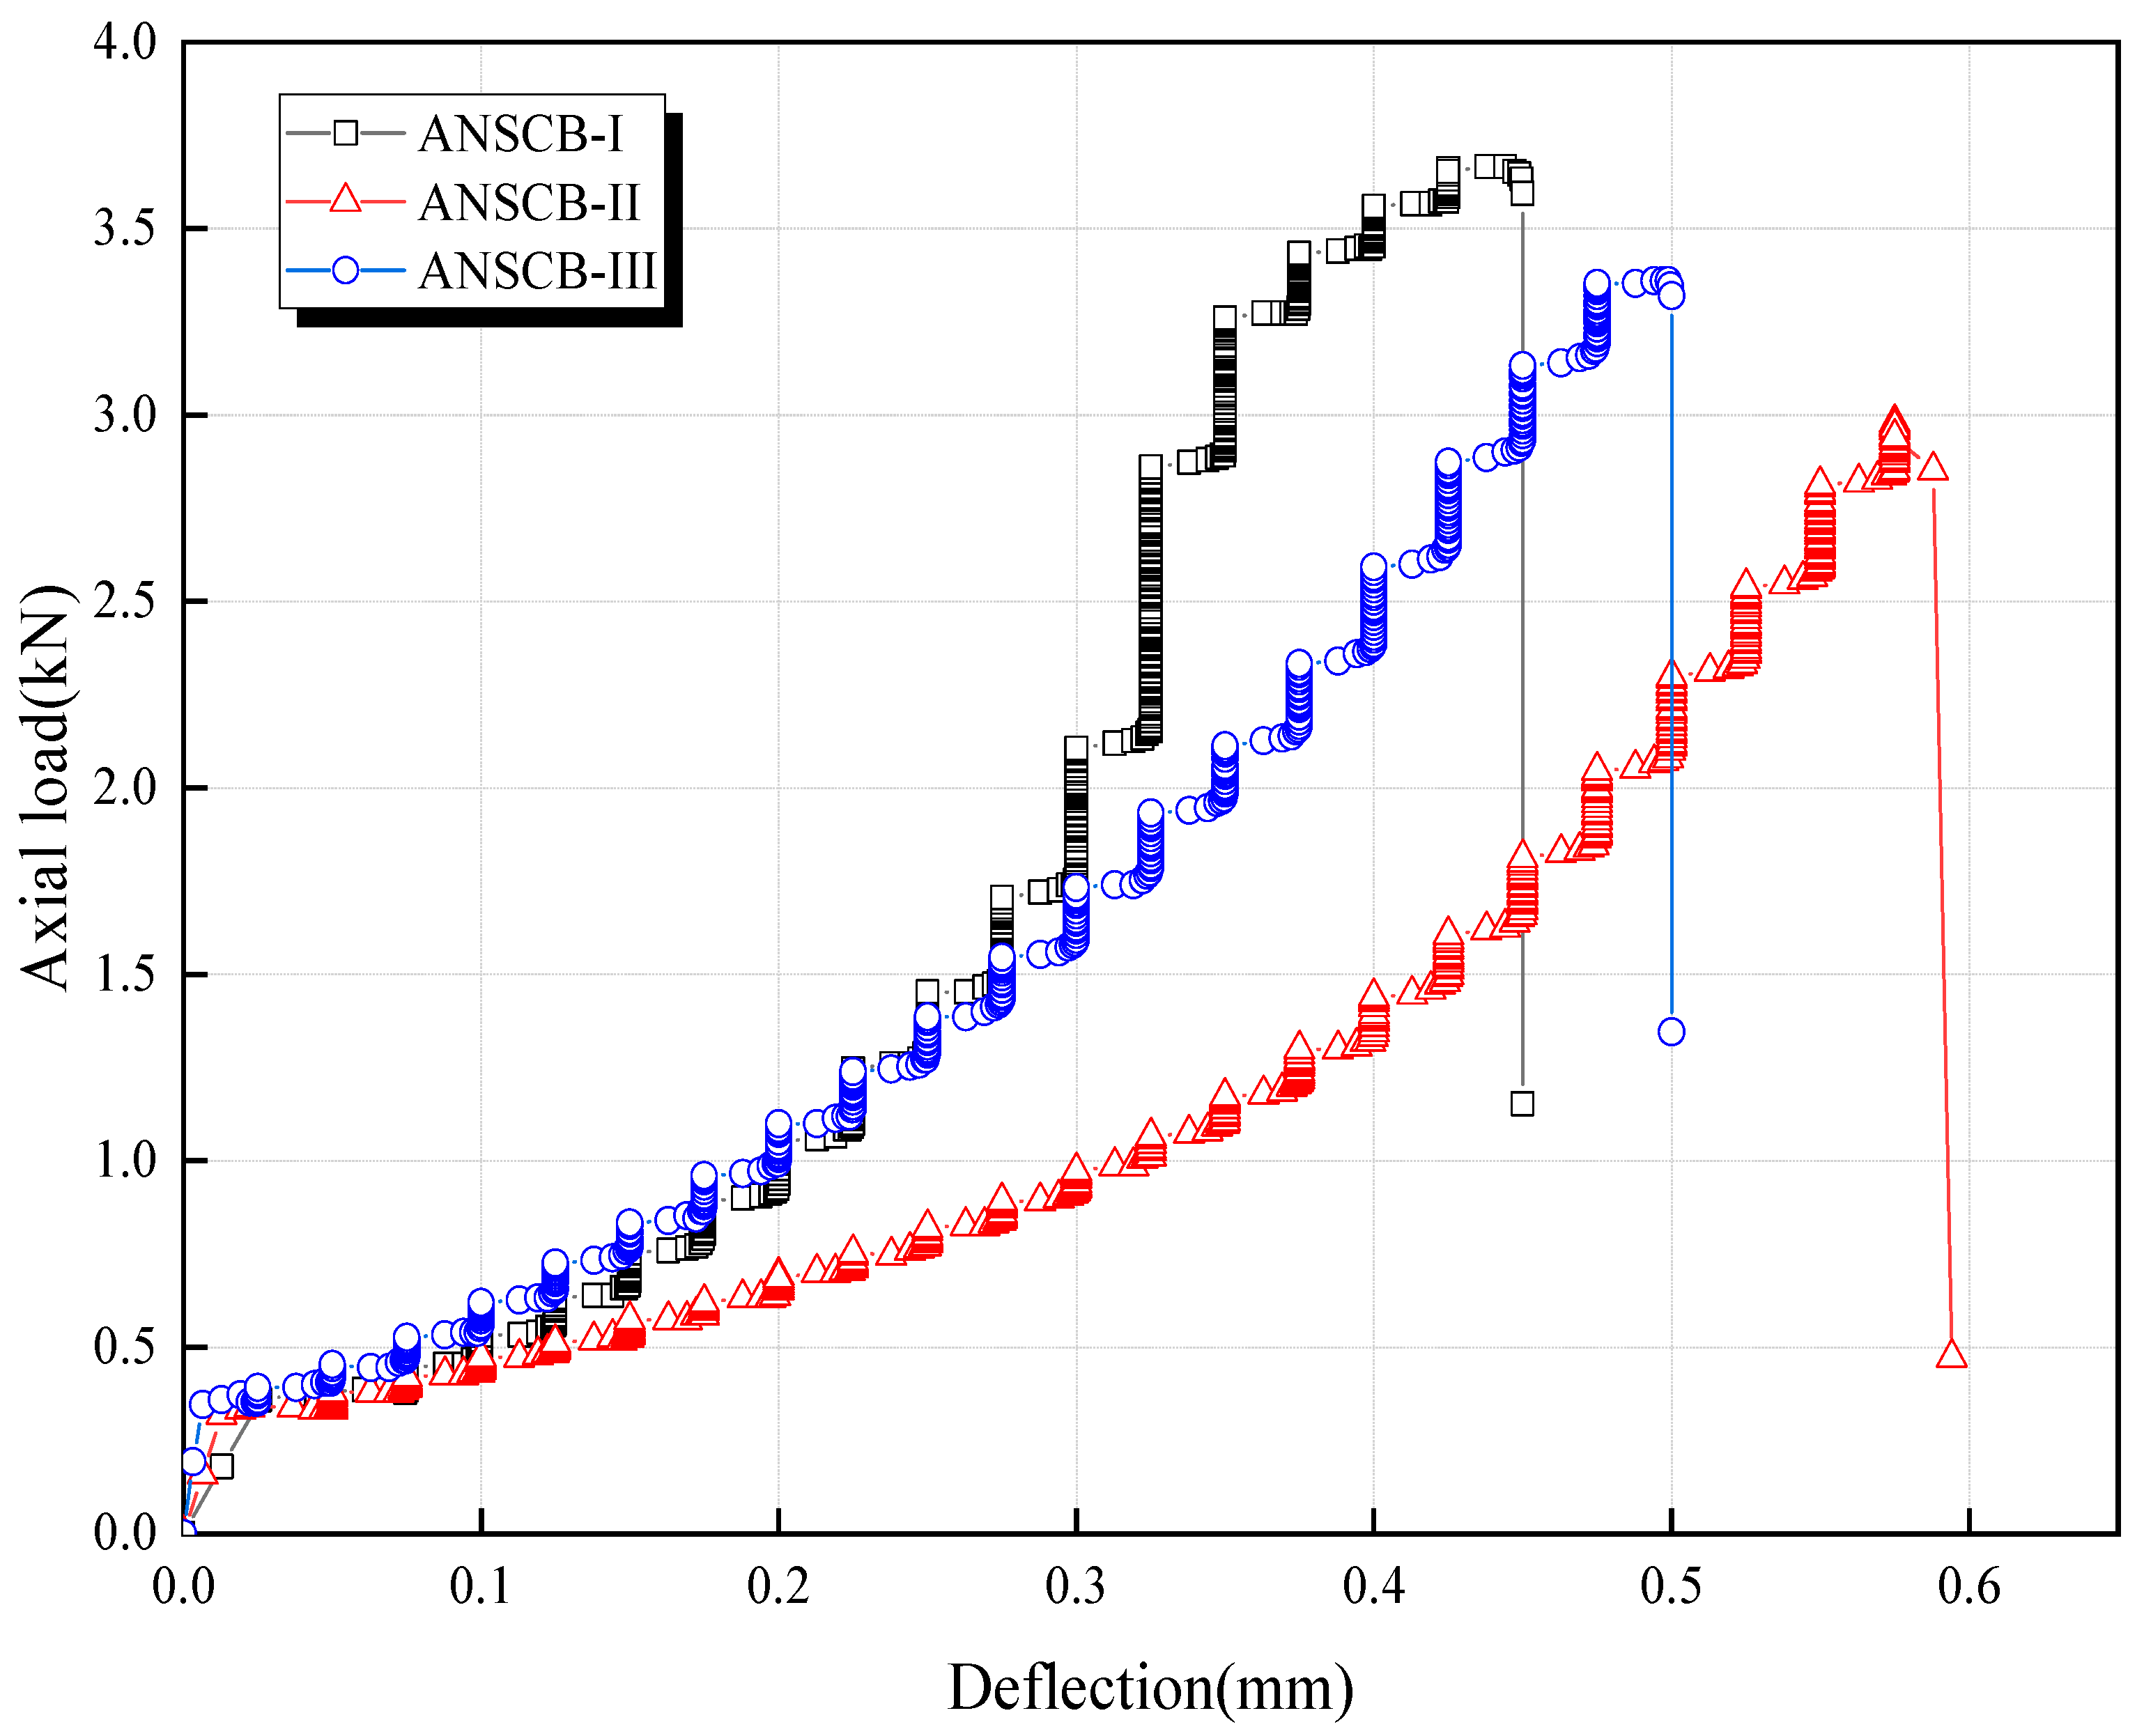
3.1. AE Response to Fracture Behavior

AE cumulative counts, which could directly reflect the temporal and spatial evolution behavior of microcracks in a rock mass, play an important role in the evaluation of fracture behavior [32]. The test results showed that three different mixed I-II ANSCB specimens exhibit similar failure trends. Considering the similarity of AE behaviors and loading curves during the whole loading process, the failure process can be divided into three typical stages, as displayed in Figure 5.
Stage I: The loading curve and AE cumulative counts show a gentle trend in this stage. The voids in the compression zone inside the specimen are closed and only a small number of acoustic emission signals are generated.
Stage II: AE cumulative counts increase linearly at a certain rate, suggesting that the damage inside the specimen accumulates gradually. The crack begins to propagate erratically with the increase of the loading levels, and microcracks gradually coalesce, while AE cumulative counts curve’s slope increases rapidly. This stage can be considered as corresponding to the elastic-plastic stage.
Stage III: The specimen enters an unstable expansion stage and the elastic energy is released fast at this time. When the loading reaches the peak value, the main crack runs through the whole specimen, resulting in a sharp increase in AE cumulative counts. Meanwhile, the bearing capacity decreases sharply, and overall instability and tensile failure occur in specimens at this moment.
As displayed in Figure 5, it is also noted that ANSCB-II and ANSCB-III have obvious compaction stages, indicating that the size of the compression zone of these two models is larger than that of ANSCB-I, which can be attributed to asymmetric loading.

3.2. Multiscale Analysis of Fracturing Process

It is well known that rock is a brittle material with rapid crack propagation, and the crack initiation and propagation cannot be observed by the naked eye during the test [2]. To evaluate the crack initiation and propagation in the fracture process, the DIC technique is used to analyze the strain and displacement filed in this section.
Figure 6 shows the evolution of the horizontal strain field at different loading stages. Specifically, in the early stage of loading, when the specimen is subjected to the low applied loading (about 25% P m a x ), the horizontal strain is evenly distributed (Figure 6a). There is no obvious local strain, and the strain value is small, indicating that the specimen is in a linear elastic state without cracking.
Figure 6b plots the fracture process zone (FPZ) beginning to develop at the pre-existing crack tip (the applied loading is about 70% P m a x ), and plastic deformation occurs in FPZ [33]. It can be seen that the high strain concentration zone (tension-shear strain) gradually appears around the pre-existing crack tip, and the compression-shear strain along both sides also changes significantly. The above-mentioned results imply that the crack initiation is mainly caused by the tension-shear strain concentration at the crack tip.
As the applied loading increases, the strain accumulated and the strain localization region developed along the crack propagation path (Figure 6c), and an obvious strain band develops. It is worth noting that the crack begins to initiate at this time. When the loading reaches the peak value, the strain localization region expands dramatically, as displayed in the red circular region in Figure 6d. Macro-cracks propagate rapidly outward from the pre-existing crack tip to the loading point, forming a through-through crack, and thus failure occurs. In addition, there are no friction zones and debris falls on the fracture surface, illustrating that the fracture process is mainly affected by tensile stress [2].
Figure 7 exhibits the horizontal displacement of the specimen when it is damaged, and the displacement presents an obvious discontinuity. In addition, the failure path of each specimen is marked in Figure 7 (black line), and the macro failure path develops along the line from the crack tip to the loading point. It is noted that the failure path is not a straight line, and the failure path of the ANSCB-II and ANSCB-III is almost arc-shaped, and it can be explained from a micro-perspective. Specifically, grain-scale microcracks (i.e., grain-boundary cracks, intra-grain cracks, and transgranular cracks) are generated in grain and expand in the matrix along grain boundaries [34], as is depicted in Figure 8. When the crystal breaks along the cleavage plane, the failure path is slightly deflected. Typical transgranular fracture and intergranular fracture can be observed in ANSCB-I (Figure 8a), while intergranular fracture is dominant in ANSCB-II (Figure 8b) and ANSCB-III (Figure 8c). With a greater failure loading, the failure path tends to be a straight line. It is known that intergranular fracture, transgranular fracture, and coupling fracture are the main fracture mechanism of rock, which are generated by the local high tensile stress field.
For transgranular fractures, when rupture of the crystals occurs along cleavage planes, there is typical sparkling cleavage cracking through minerals [35], demonstrating that the angle between the direction of stress and the normal vector line is large at the fracture surface. With the propagation of the crack and the migration of the neutral axis, a certain point is alternately loaded, and the transgranular failure occurs. The total energy W t , which is required to overcome grain cracking to produce a new surface and isostatic pressure within the grain, correlated to the applied loading can be determined by:
W t = 2 π r 2 γ a g + 1 2 π F r 2 μ 1 2 ,
where γ a g is the average surface energy of grains, μ 1 is the distance of crack opening in the grain, and r is grain size.
For intergranular fracture, the bonding strength between grains is lower than that of grains themselves. The cracks spread between grains, and the total energy W i carried out by the applied loading can be calculated by:
W i = 4 π r 2 γ f + 1 3 π F r 2 μ 2 2 ,
where γ f denotes fracture energy per unit area of the interface, μ 2 denotes the distance of crack opening at the interface, and r also denotes grain size. W i contains the interfacial fracture energy and the energy needed to overcome the interfacial compressive stress.
From Equations (5) and (6), based on the minimum energy consumption, the crack propagation path is always along the boundary where the resultant force is weakest. It can be deduced that the nucleation of micro-pores and micro-cracks on the grain plane or grain boundary involves the breaking of atomic bonds. Therefore, a conclusion is reached that the crack propagation path is affected by the micro failure pattern to some extent.

3.3. Microcrack Classification and Propagation

AE, as a nondestructive evaluation technique, can analyze and evaluate the fracture process by detecting stress waves caused by crack initiation and propagation. There are many AE parameters are shown in Figure 9a, and each parameter represents a different physical meaning. To further classify the microcracks, AF-RA distribution was used to describe the types of microcracks [36,37]. The ratio of rising time to amplitude (RA) and the average frequency (AF) can be approximately estimated by Equations (7) and (8), respectively. According to the previous literature [38,39], a dividing line can be defined, and the data above the dividing line represents the tensile crack, while the data below the dividing line represents the shear crack, a schematic diagram is shown in Figure 9b.
R A = R i s e   t i m e M a x i m u m   a m p l i t u d e ,  
A F = A E   c o u n t s D u r a t i o n   t i m e .  
At present, many scholars have studied the determination method of dividing lines. For instance, Niu [36] reported that tensile events are dominated by P-wave propagation, while shear events are dominated by S-wave propagation. Based on the study of concrete, De Smedt [38] proposed AF = 0.1 RA as the dividing line for judging failure modes. Du [39] investigated the dividing line of granite, marble, and red sandstone by several basic lab tests, including an indirect tension test, three-point bending test, shear test, and uniaxial compression test, and then found that the red sandstone’s dividing line of the AF-RA is AF = 3 RA + 75. Since red sandstone was also selected as a research object in this paper, which has similar properties, AF = 3 RA + 75 is regarded as the dividing line in this section. The AF-RA scatter plots and the statistical analyses for microcrack classifications were executed and displayed in Figure 10.
The experimental result shows that the damage of mixed I-II ANSCB specimens is mainly caused by micro-tensile and micro-shear. It can be seen from Figure 10 that no matter what the cracking degree is, the number of tensile cracks is more than that of shear cracks. For ANSCB-I, ANSCB-II, and ANSCB-III, the proportion of the tensile cracks in the total number of microcracks is approximately 59.01 ± 2.95%,74.13 ± 3.91%, and 68.34 ± 3.42%, respectively. Combined with Figure 8 in Section 3.2, it is noted that ANSCB-I has a large particle breakage degree (i.e., transgranular damage), while ANSCB-II and ANSCB-III have less particle breakage, indicating that micro-shear rarely occurs in mixed I-II ANSCB specimens. Niu [36] reported that the shear mechanism mainly occurs at crack initiation and propagation, which can help explain the experimental phenomenon in this paper.

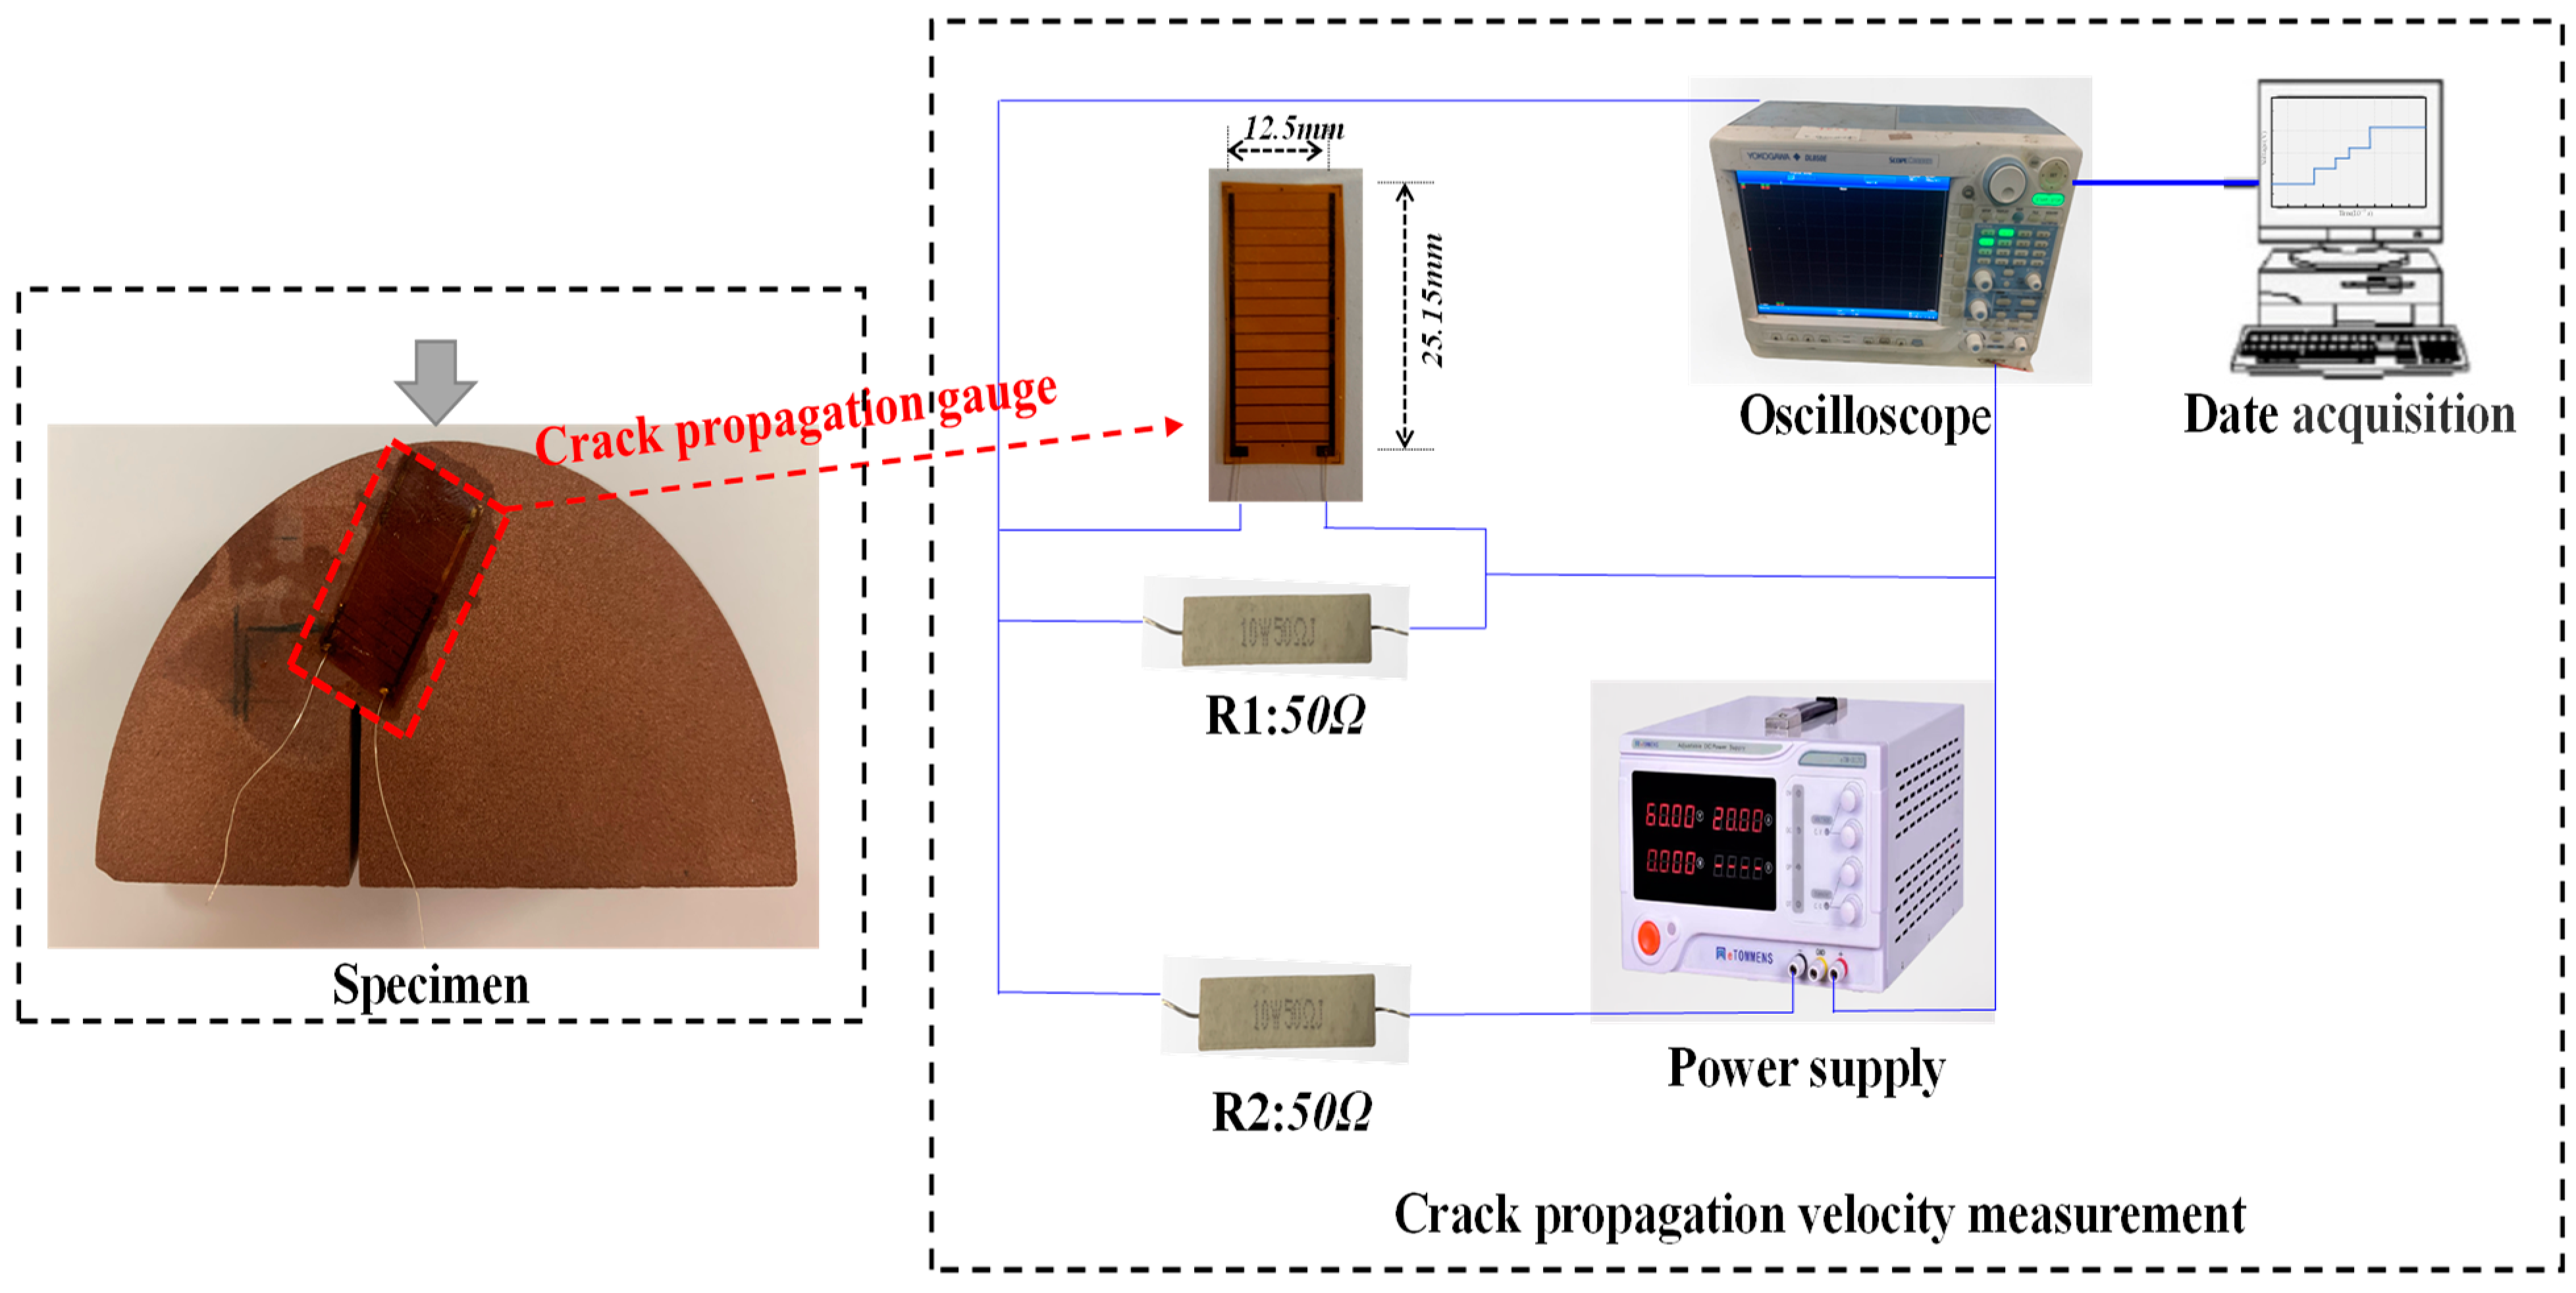
3.4. Subcritical Crack Growth Rate

Previous studies thought that the crack propagation rate in rock is a nonlinear dynamic process, showing a trend of increasing-decreasing-increasing [40,41]. After crack initiation, there is a very short period of accelerated motion until the crack propagation rate reaches a threshold, and oscillates up and down [42,43]. This is due to the fact that the stress wave generated during crack initiation propagates and is reflected by the free boundary, making the rate of the accelerated crack tip oscillate [44]. When cracks occur, new cracks gradually expand and grow moderately with time, and it can be considered the subcritical crack growth stage [45].
The typical variation of the CPG voltage was obtained by an oscilloscope, as shown in Figure 11a, which accurately reflects the trend of the crack growth rate. It indicates that at the initial stage, the crack propagation rate is so fast that several resistance wires broke quickly in a short time. After that, it enters a stable growth stage (subcritical crack growth). When the crack develops from nucleation and subcritical propagation to critical length, moving from steady-state to dynamic-state, rapid fracture occurs. Meanwhile, the crack bifurcation phenomenon also occurs. Combined with Equation (1) and Figure 11a, the subcritical crack growth rate (SCGR) of three mixed I-II ANSCB specimens under three-point bending conditions were calculated, respectively. For the reasons of the precision of CPG and the inhomogeneity of rock, the SCGR is discretized [45]. The experimental result shows that the rate sensitivity of ANSCB-I is higher than that of ANSCB-II and ANSCB-III, as presented in Figure 11b–d, the average SCGR is 33.13 ± 1.66 m/s, 24.33 ± 1.22 m/s, and 30.28 ± 1.52 m/s, respectively. The larger the failure loading is, the faster the SCGR is. Most of the crack growth rates expressed in previous research are the average rate of the whole process, with an order of about 200–400 m/s [41,46], while the SCGR is lower than the overall average crack growth velocity.
In addition, the SCGR is gradually accelerated in the whole process of subcritical crack growth, as can be seen in Figure 11b–d. Generally, the SCGR is related to the subcritical crack growth resistance of the specimen, and the higher the fracture resistance, the higher the SCGR is. Relevant studies pointed out that shear resistance plays an important role in the crack growth rate [45]. Combining Figure 10 in Section 3.3, the more shear cracks in the failure process, the faster the growth rate is. A possible explanation is that shear failure must overcome not only the adhesion stress but also the friction between mineral particles, resulting in the shear resistance being stronger than the tensile stress.

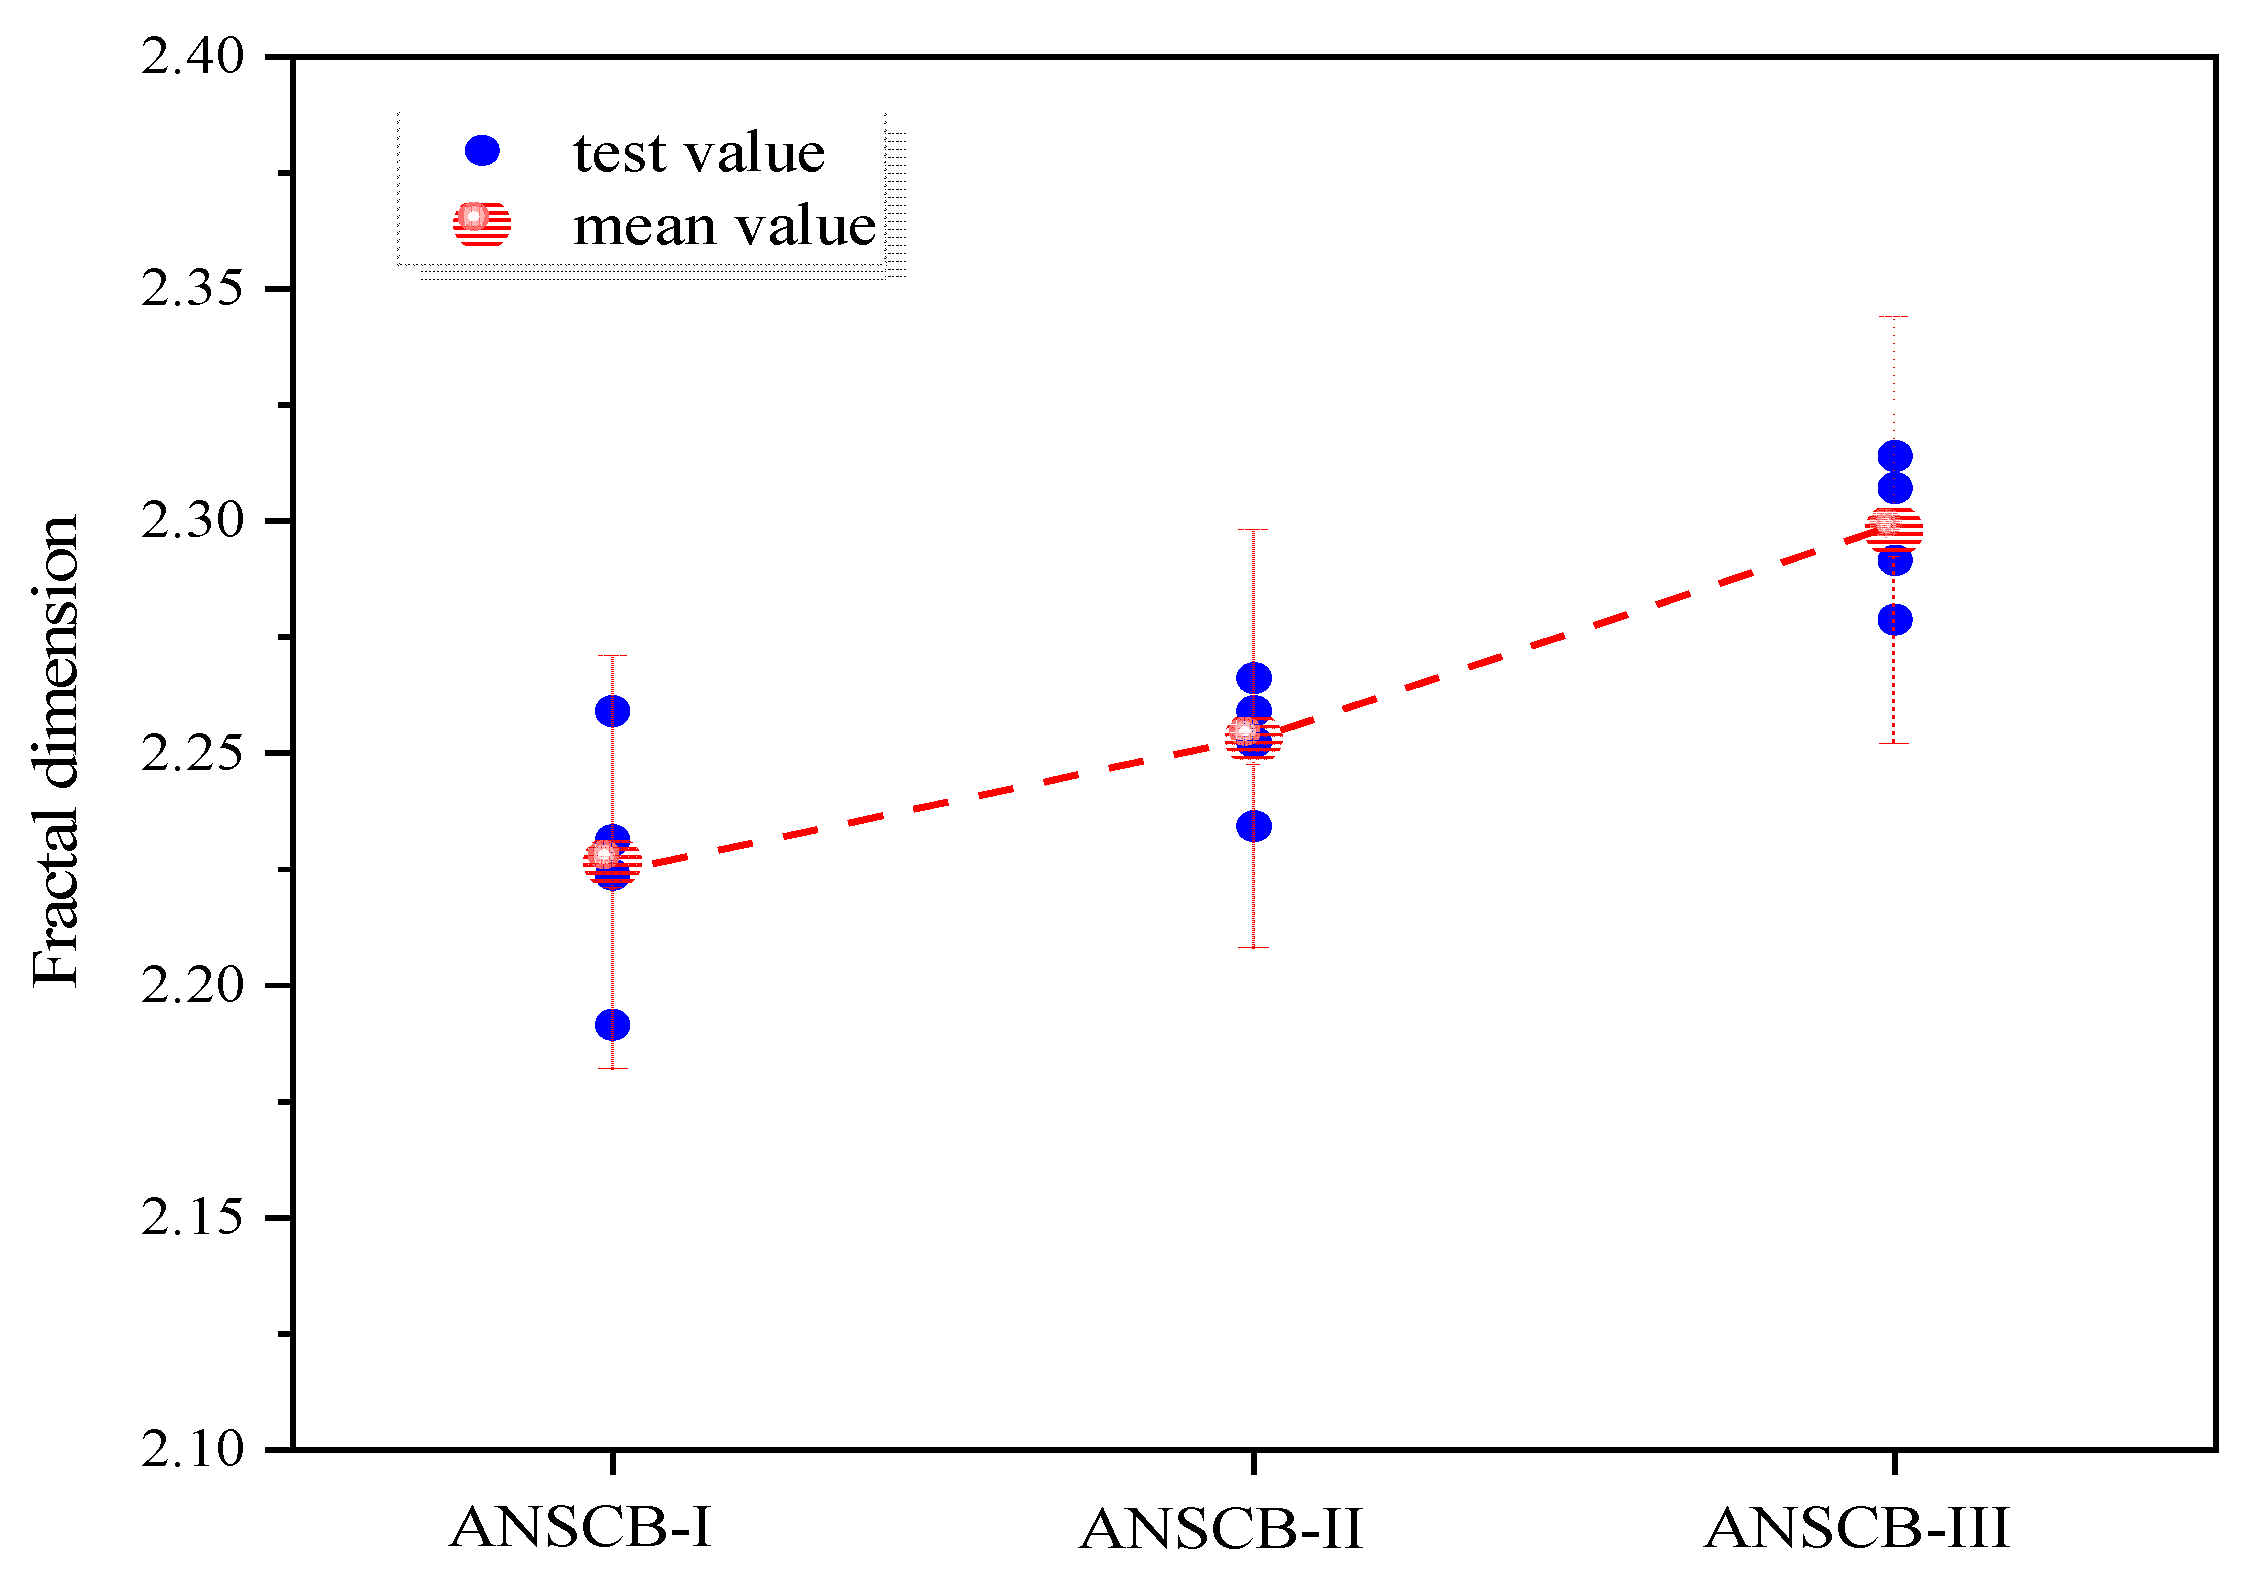
3.5. Fractal Dimension of the Fracture Surface

Based on Matlab, the digitized fracture surfaces were reconstructed, and a rectangular area (30 mm × 35 mm) in the center of the fracture surface was selected for investigation, as presented in Figure 12. The fracture surfaces are rough and the difference in morphological characteristics cannot be distinguished by the naked eye. It can be found that the degree of undulation of the fracture surfaces or the altitude difference between the highest and lowest points is different. The altitude difference between the highest and lowest points is 2.09 mm, 3.13 mm, and 3.89 mm corresponding to ANSCB-I, ANSCB-II, and ANSCB-III, respectively. Additionally, for ANSCB-I and ANSCB-II, the fluctuation distribution of fracture surfaces is relatively uniform, while the fracture surfaces undulate greatly for ANSCB-III. This indicates that asymmetric loading has an important effect on the fracture surface topography.
According to the box-dimension method, the fractal dimension was calculated, as shown in Figure 13. Previous studies have shown that the fractal dimension of the rock’s three-dimensional failure surface ranges from 2 to 3 [47]. The range of fractal dimensions is 2.1915~2.3140 in this paper, and the fractal dimension of the ANSCB-I approaches that of the ANSCB-II. However, the fracture surface of the ANSCB-III is uneven and rough, and the fractal dimension maximizing. Therefore, it can be concluded that a higher fractal dimension value indicates a coarser fracture surface. In addition, as mentioned previously, asymmetric loading can affect the propagation path of the crack and the morphology of the final fracture surface.

4. Conclusions

In this study, mixed-mode I-II fracture behaviors of ANSCB sandstones were investigated. The evolution of AE cumulative counts was analyzed, and fine analysis of microcracks was also implemented based on AE parameters. The DIC method was employed to assess the strain and displacement filed during the fracture process. In addition, based on the crack propagation gauge, the subcritical crack growth rate was measured in real-time. From this work, the major conclusions can be drawn as follows:
(1)
The fracture process of mixed I-II ANSCB specimens mainly includes three stages: a compaction and initiation stage, steady-state stage, and an unsteady-state crack propagation stage. An obviously brittle failure was observed, and if applied loading approaches the peak value, the main crack is rapidly transfixed, and the bearing capacity decreases sharply.
(2)
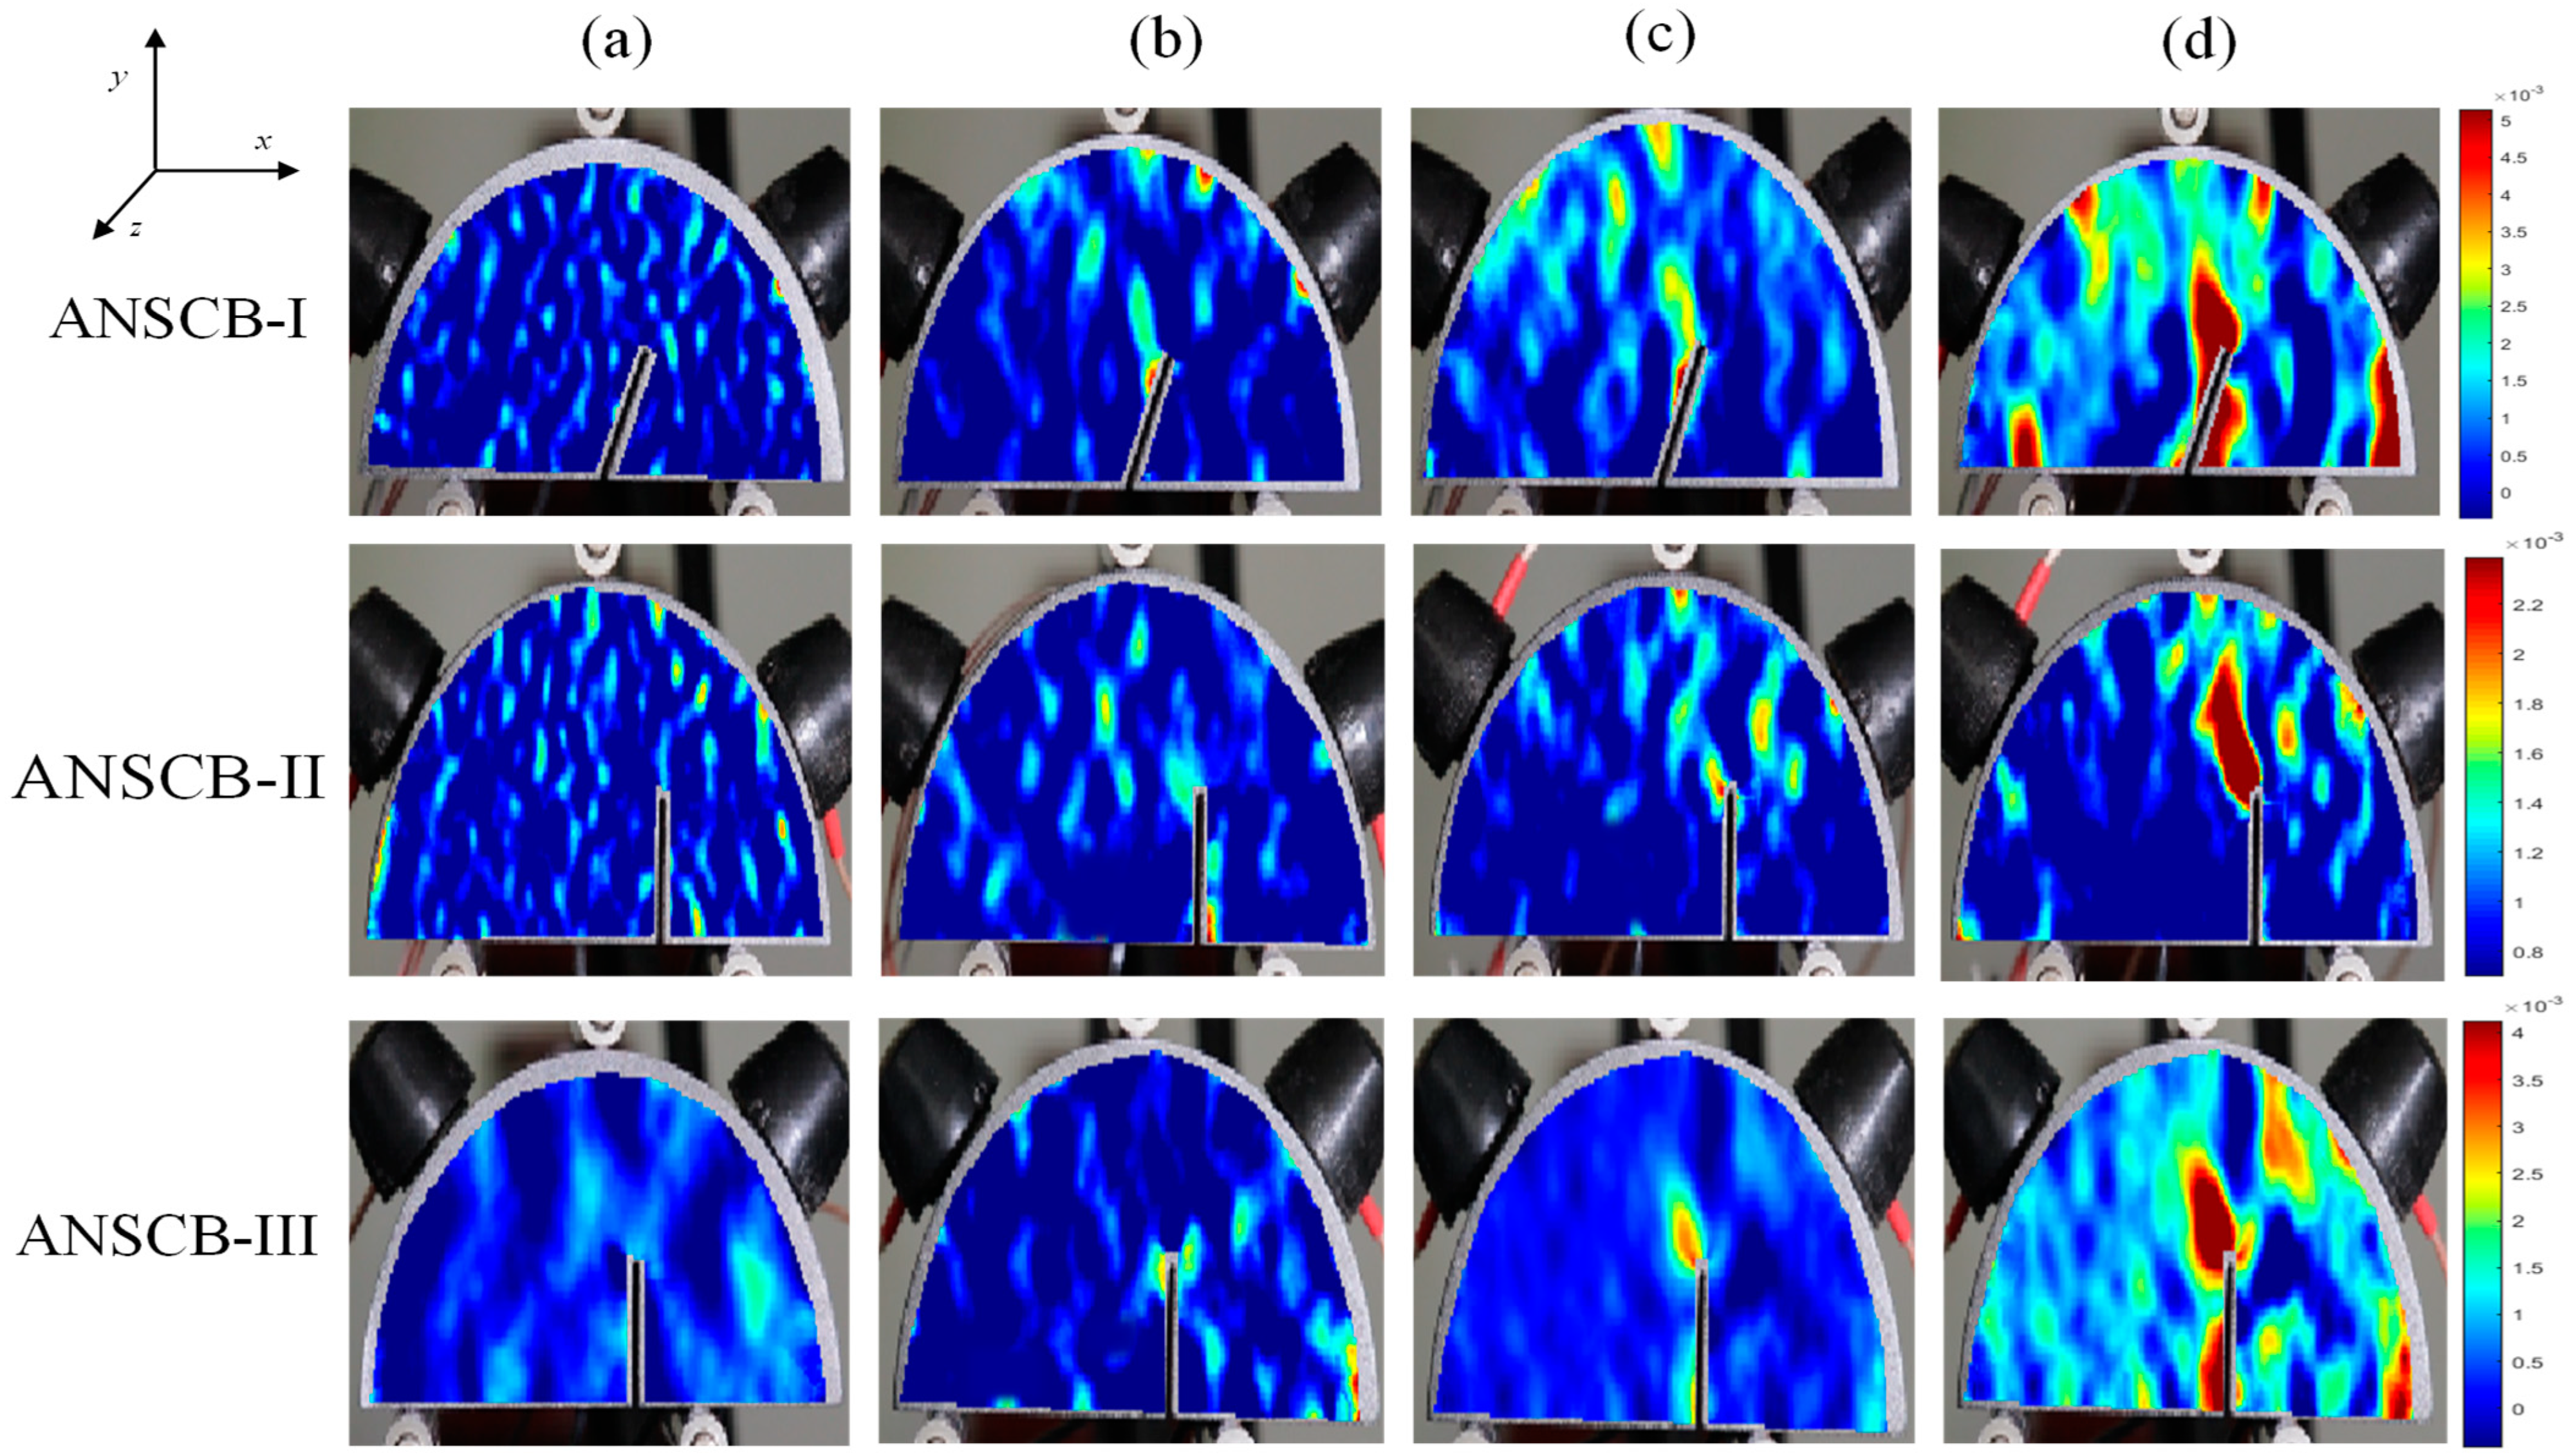
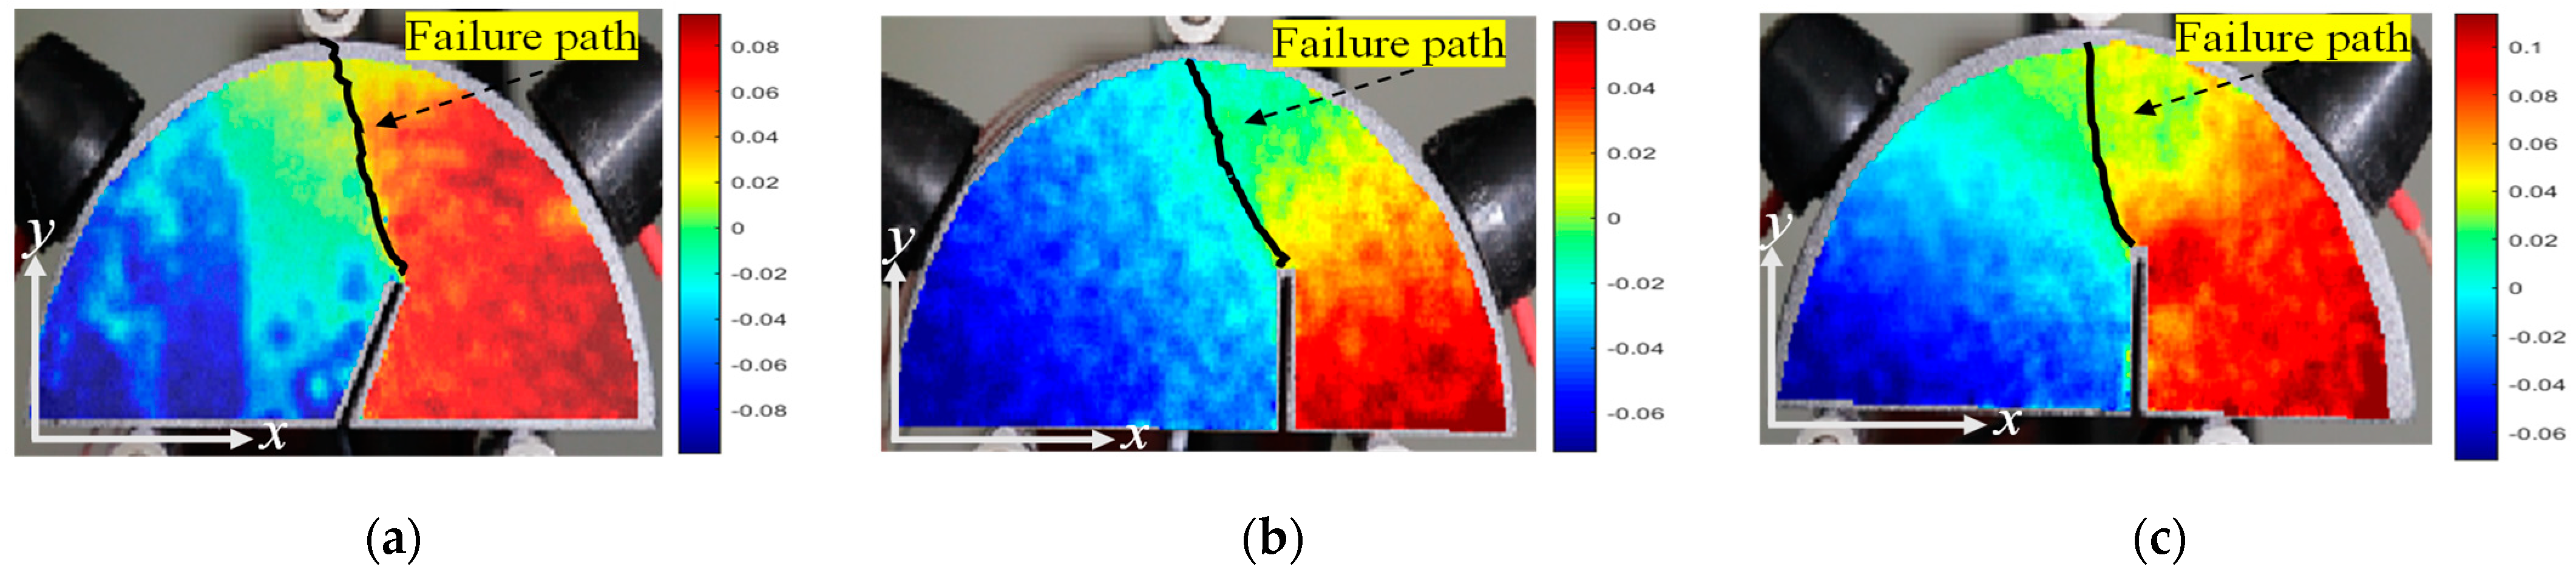
Based on the digital image correlation method, it can be determined that the whole fracture process consists of a nonlinear elastic stage, fracture process zone, crack initiation stage, and crack propagation stage. The crack initiation is mainly caused by the tension-shear strain concentration at the pre-existing crack tip. In addition, insight from a microscale, the crack propagation path is always along the grain boundary where the resultant stress is weakest.
(3)
According to the monitoring of the acoustic emission, it can be found that micro-tensile cracks are mainly responsible for the asymmetric three-point bending fracture, and the number of tensile cracks is more than that of shear cracks.
(4)
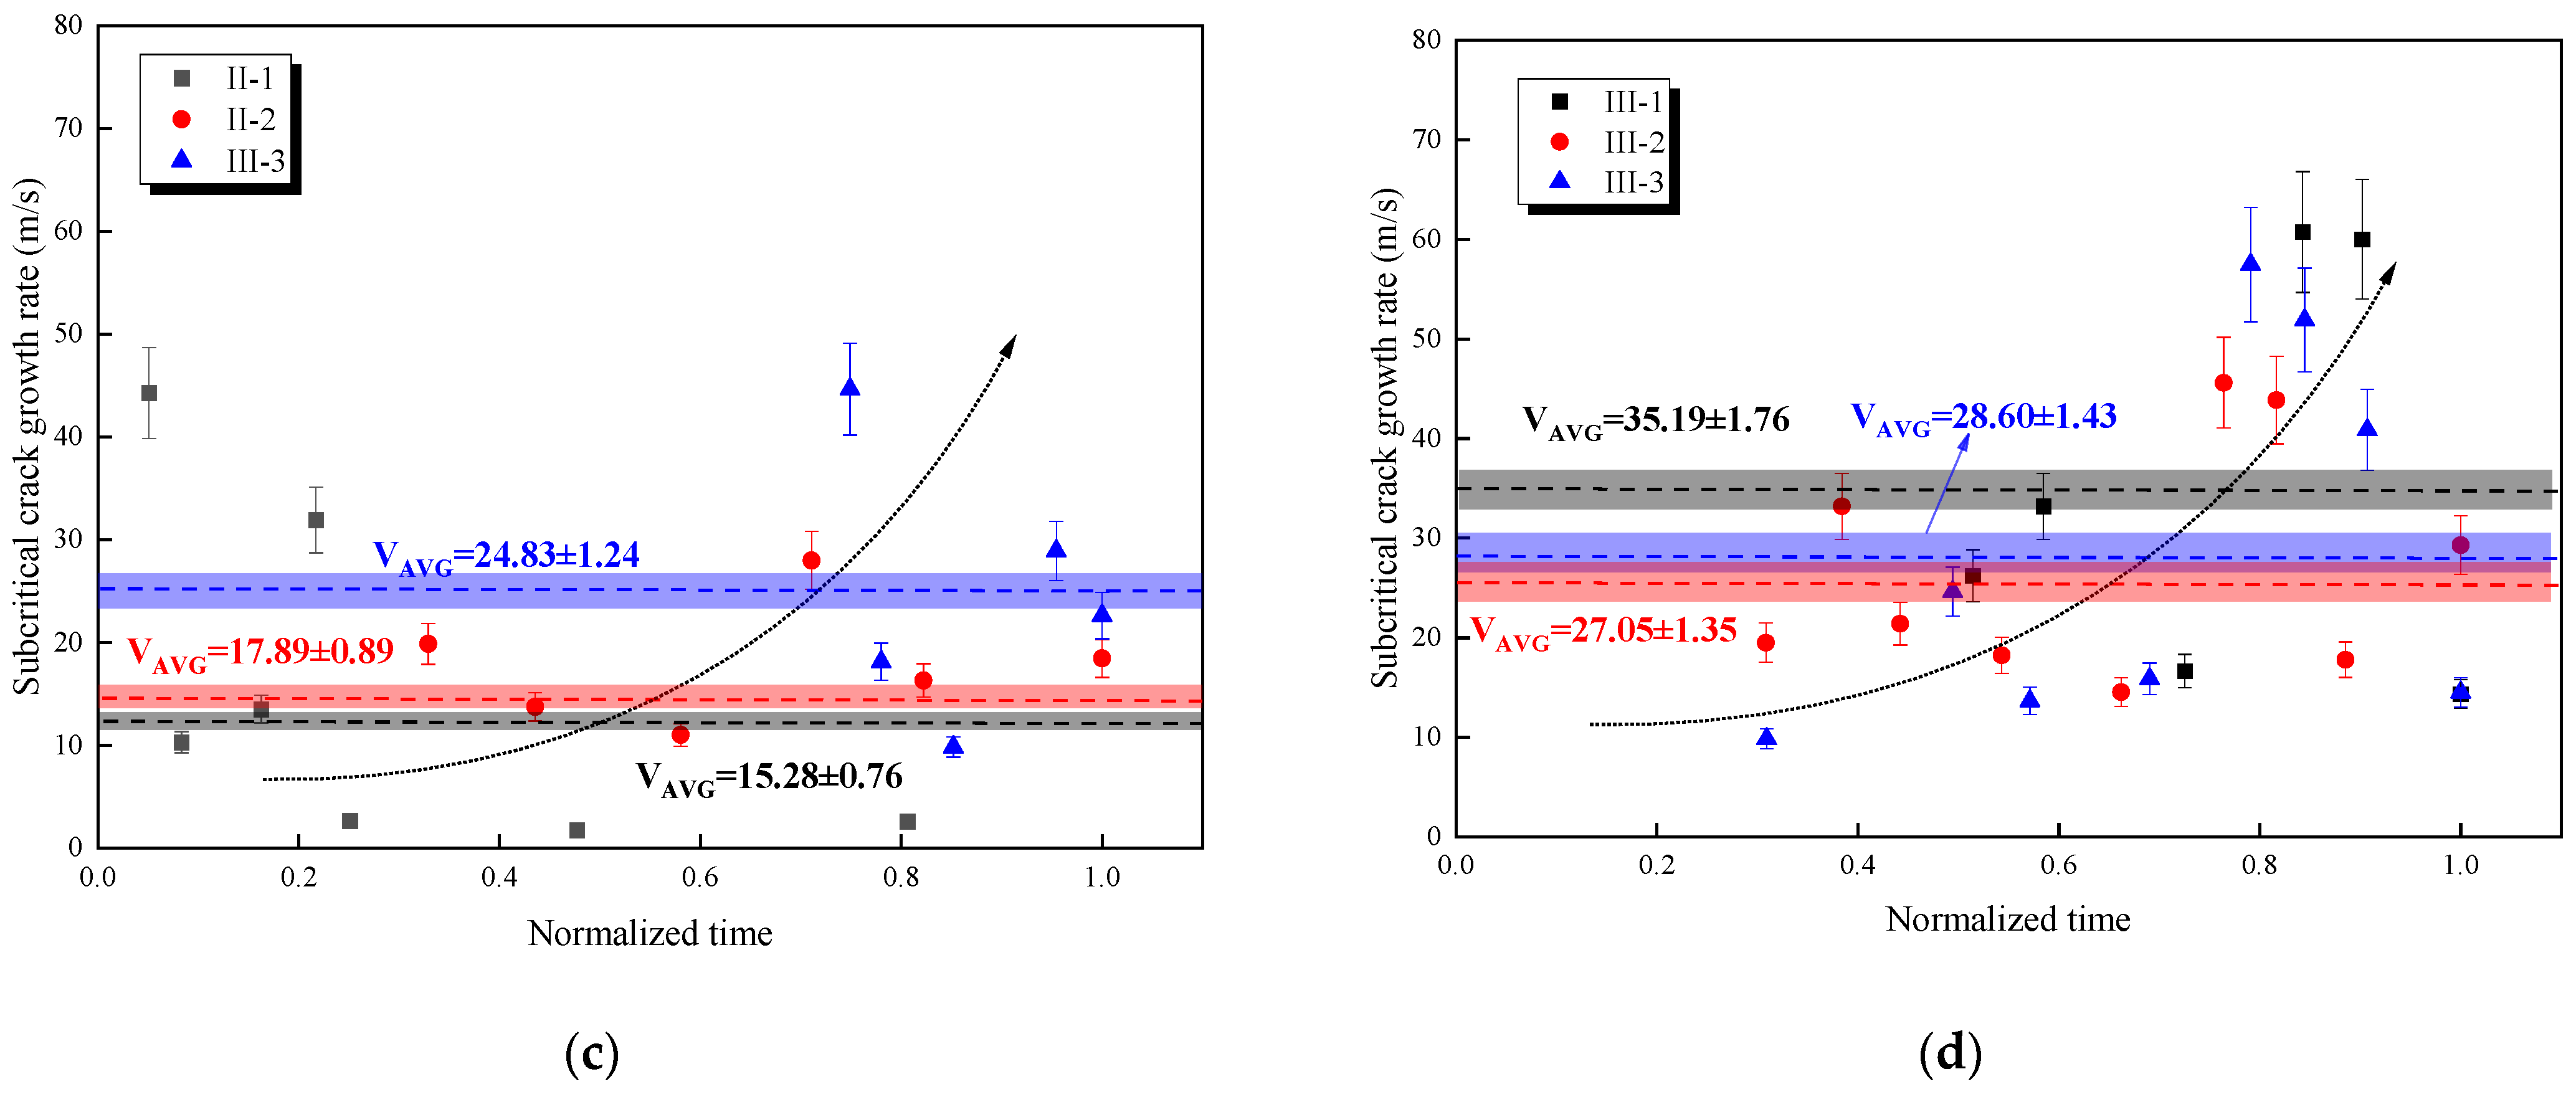
The subcritical crack growth rate is positively correlated to the ultimate load. The subcritical crack growth rate is gradually accelerated at the subcritical crack growth stage, and it is related to the subcritical crack growth resistance.
(5)
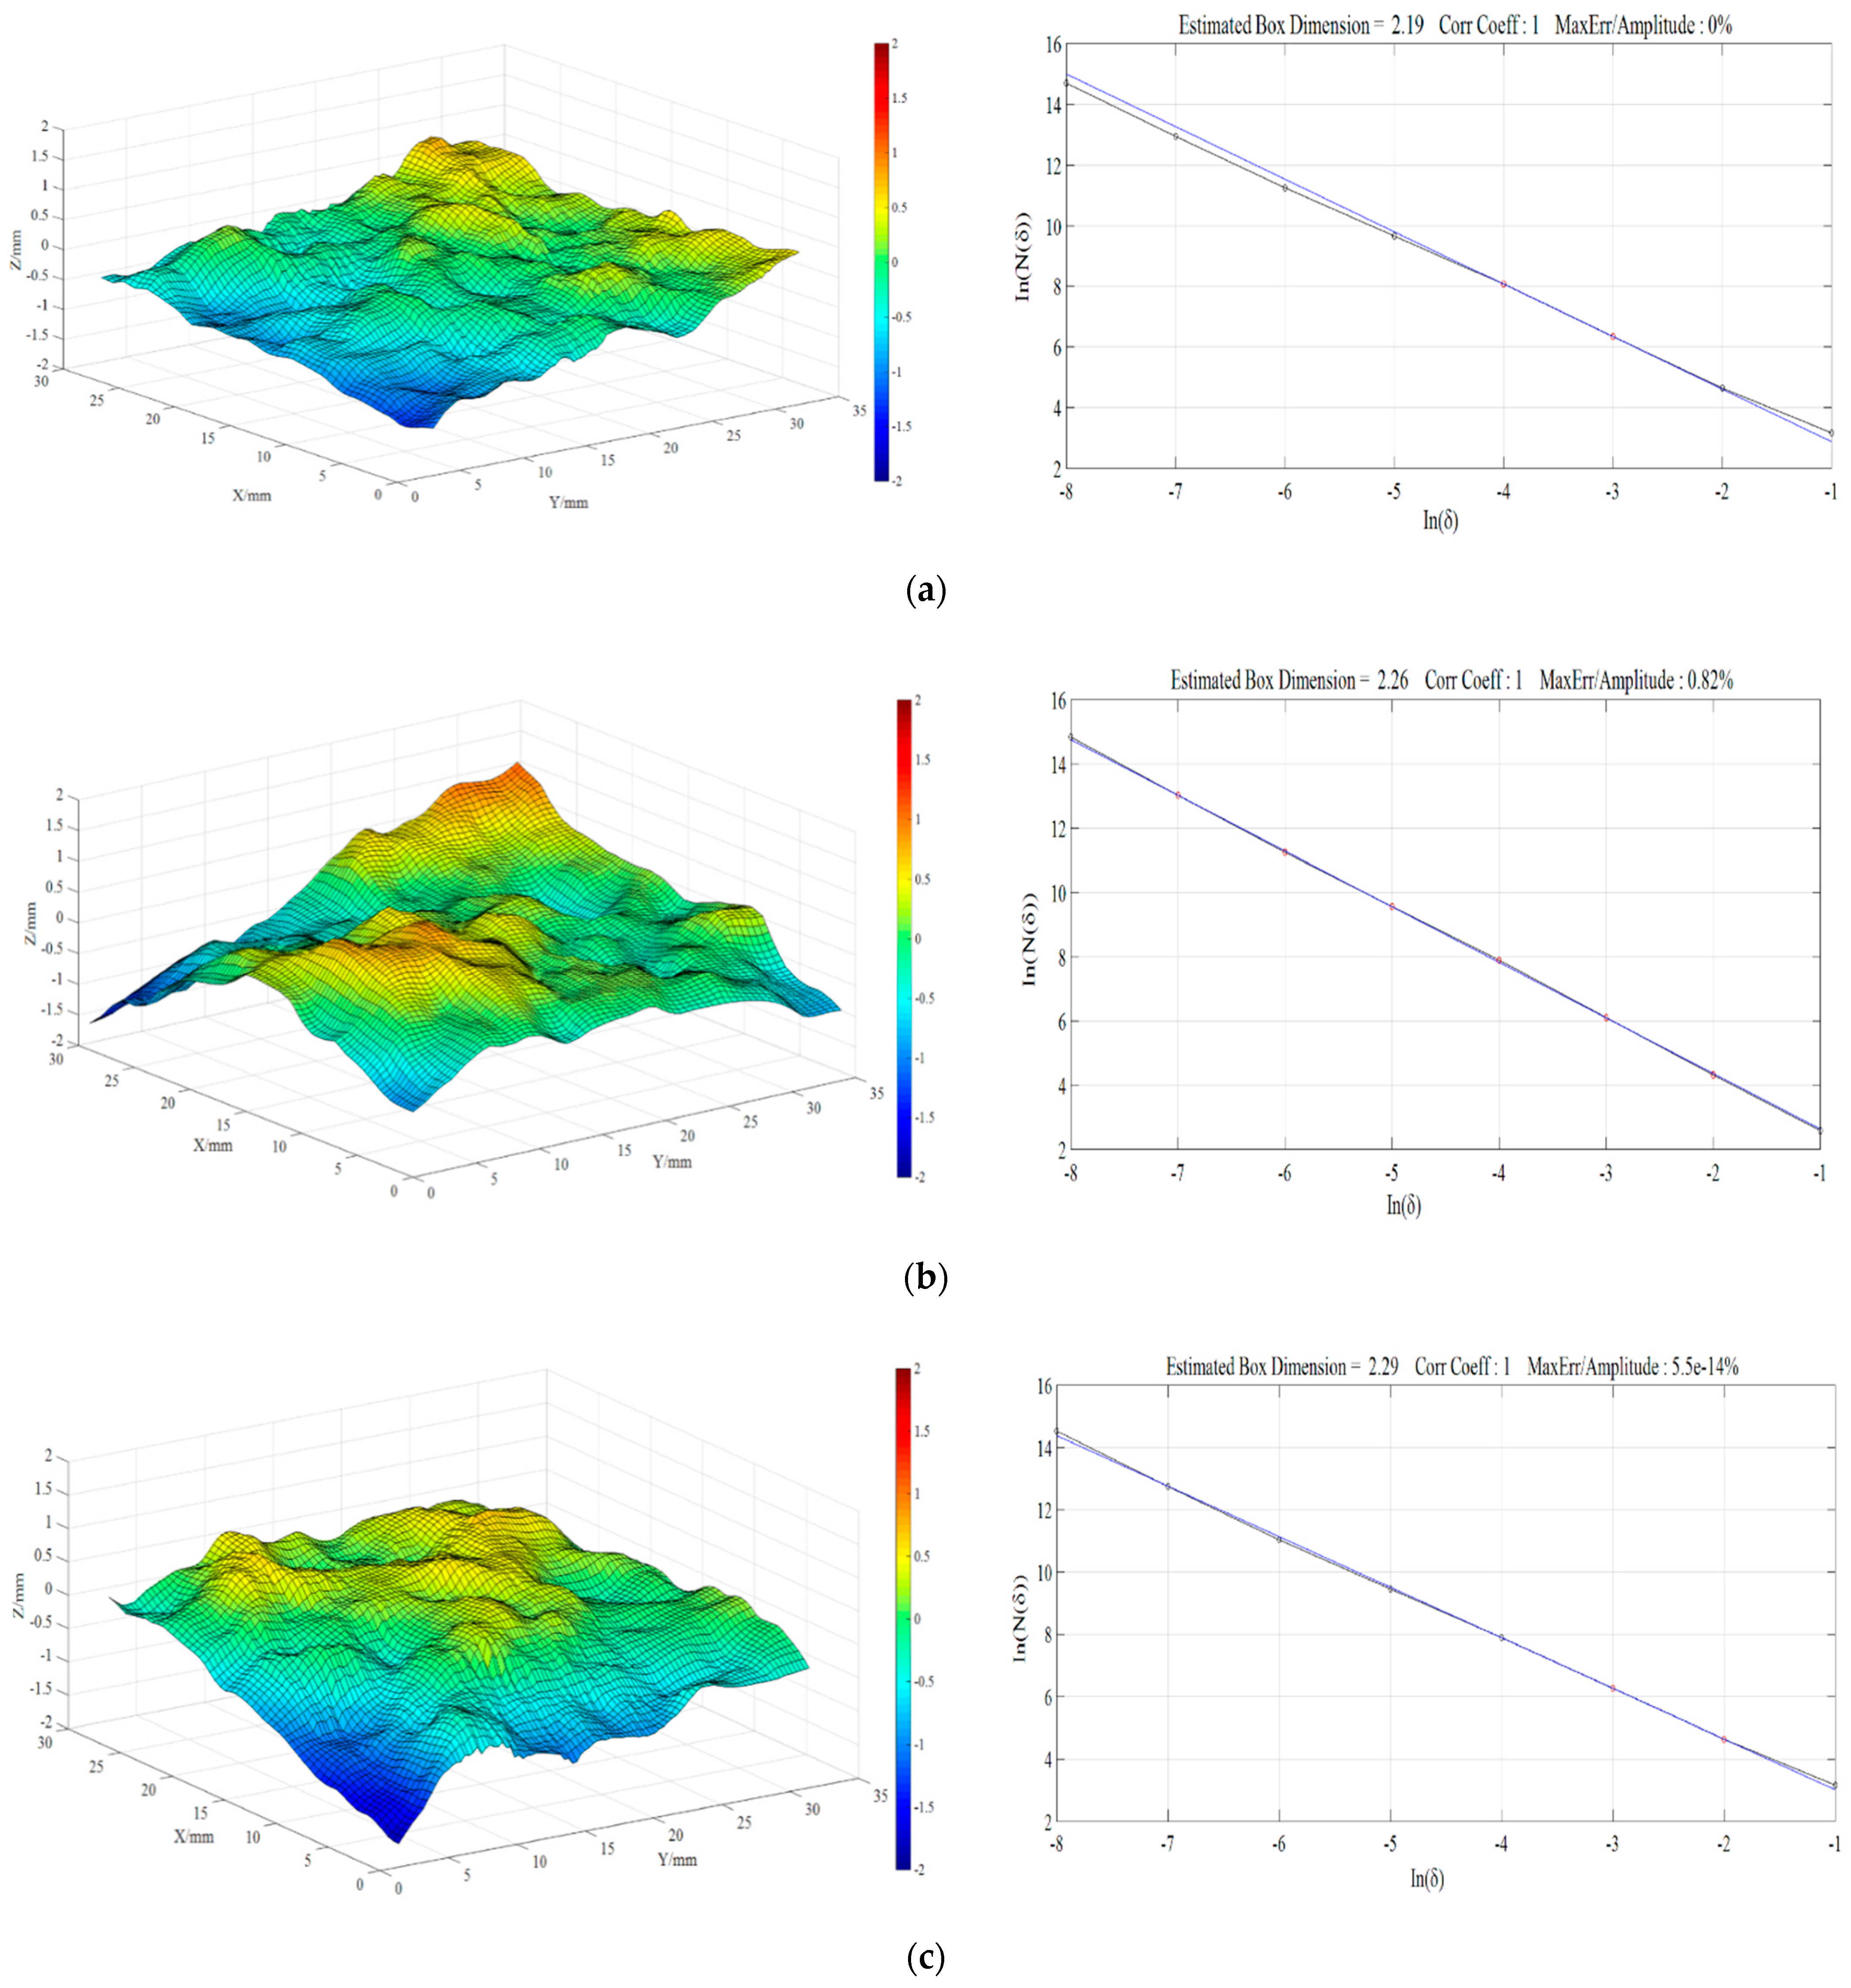
Asymmetric loading can affect the propagation path of the crack and the morphology of the final fracture surface, and a higher fractal dimension value indicates a coarser fracture surface.

Author Contributions

Conceptualization, methodology, investigation, writing—original draft preparation, G.M.; writing—review and editing, J.L.; visualization, X.Z.; supervision, project administration, P.Q. and Y.Y.; funding acquisition, L.Z. All authors have read and agreed to the published version of the manuscript.

Funding

This work was supported by the National Science Foundation of China (52074240), the University-level Science and Technology Cultivation Project of XZIT (XKY2019115), and the Civil Engineering College High-level Talent Training Fund of XZIT.

Acknowledgments

The authors would like to thank all the anonymous referees for their constructive comments and suggestions.

Conflicts of Interest

The authors declare that they have no known competing financial interests or personal relationships that could have appeared to influence the work reported in this paper.

References

  1. Zhao, Y.L.; Liu, Q.; Zhang, C.S.; Liao, J.; Lin, H.; Wang, Y.X. Coupled seepage-damage effect in fractured rock masses: Model development and a case study. Int. J. Rock Mech. Min. Sci. 2021, 144, 104822. [Google Scholar] [CrossRef]
  2. Wu, J.Y.; Jing, H.W.; Gao, Y.; Meng, Q.B.; Yin, Q.; Du, Y. Effects of carbon nanotube dosage and aggregate size distribution on mechanical property and microstructure of cemented rockfill. Cem. Concr. Compos. 2022, 127, 104408. [Google Scholar] [CrossRef]
  3. Lin, Q.B.; Cao, P.; Wen, G.P.; Meng, J.J.; Cao, R.H.; Zhao, Z.Y. Crack coalescence in rock-like specimens with two dissimilar layers and pre-existing double parallel joints under uniaxial compression. Int. J. Rock Mech. Min. Sci. 2021, 139, 104621. [Google Scholar] [CrossRef]
  4. Erarslan, N. Analysing mixed mode (I-II) fracturing of concrete discs including chevron and straight-through notch cracks. Int. J. Solids Struct. 2019, 167, 79–92. [Google Scholar] [CrossRef]
  5. Wang, J.; Li, J.T.; Shi, Z.M. Deformation damage and acoustic emission characteristics of red sandstone under fatigue–creep interaction. Theor. Appl. Fract. Mech. 2022, 117, 103192. [Google Scholar] [CrossRef]
  6. Zhou, X.P.; Fu, Y.H.; Wang, Y.; Zhou, J.N. Experimental study on the fracture and fatigue behaviors of flawed sandstone under coupled freeze–thaw and cyclic loads. Theor. Appl. Fract. Mech. 2022, 119, 103299. [Google Scholar] [CrossRef]
  7. Zhang, L.Y.; Mao, X.B.; Li, M.; Li, B.; Liu, R.X.; Lu, A.H. Brittle–Ductile Transition of Mudstone in Coal Measure Rock Strata under High Temperature. Int. J. Geomech. 2020, 20, 04019149. [Google Scholar] [CrossRef]
  8. Qiu, P.T.; Zhang, L.Y.; Li, Y.; Li, B.; Zhu, J.; Ma, C.; Bi, X.X.; Yu, Y. Permeability evolution model of coarse porous concrete under sulphuric acid corrosion. Constr. Build. Mater. 2022, 326, 126475. [Google Scholar] [CrossRef]
  9. Wong, L.N.Y.; Guo, T.Y. Microcracking behavior of two semi-circular bend specimens in mode I fracture toughness test of granite. Eng. Fract. Mech. 2019, 221, 106565. [Google Scholar] [CrossRef]
  10. Rao, Q.H.; Sun, Z.Q.; Stephansson, O.; Li, C.L.; Stillborg, B. Shear fracture (Mode II) of brittle rock. Int. J. Rock Mech. Min. Sci. 2003, 40, 355–375. [Google Scholar] [CrossRef]
  11. Sun, D.L.; Rao, Q.H.; Wang, S.Y.; Shen, Q.Q.; Yi, W. Shear fracture (Mode II) toughness measurement of anisotropic rock. Theor. Appl. Fract. Mech. 2021, 115, 103043. [Google Scholar] [CrossRef]
  12. Cao, R.H.; Wang, C.S.; Yao, R.B.; Hu, T.; Lei, D.X.; Lin, H. Effects of cyclic freeze-thaw treatments on the fracture characteristics of sandstone under different fracture modes: Laboratory testing. Theor. Appl. Fract. Mech. 2020, 109, 102738. [Google Scholar] [CrossRef]
  13. Cao, R.H.; Wang, C.S.; Hu, T.; Yao, R.B.; Li, T.B.; Lin, Q.B. Experimental investigation of plane shear fracture characteristics of sandstone after cyclic freeze–thaw treatments. Theor. Appl. Fract. Mech. 2022, 118, 103214. [Google Scholar] [CrossRef]
  14. Yin, T.B.; Wu, Y.; Li, Q.; Wang, C.; Wu, B.Q. Determination of double-K fracture toughness parameters of thermally treated granite using notched semi-circular bending specimen. Eng. Fract. Mech. 2020, 226, 106865. [Google Scholar] [CrossRef]
  15. Yin, T.B.; Wu, Y.; Wang, C.; Zhuang, D.D.; Wu, B.Q. Mixed-mode I plus II tensile fracture analysis of thermally treated granite using straight-through notch Brazilian disc specimens. Eng. Fract. Mech. 2020, 234, 107111. [Google Scholar] [CrossRef]
  16. Qin, X.F.; Su, H.J.; Feng, Y.J.; Zhao, H.H.; Pham, T.N. Fracture and deformation behaviors of saturated and dried single-edge notched beam sandstones under three-point bending based on DIC. Theor. Appl. Fract. Mech. 2022, 117, 103204. [Google Scholar] [CrossRef]
  17. Zhou, X.P.; Wang, L.F.; Shou, Y.D. Understanding the fracture mechanism of ring Brazilian disc specimens by the phase field method. Int. J. Fract. 2020, 226, 17–43. [Google Scholar] [CrossRef]
  18. Wang, W.; Zhao, Y.X.; Teng, T.; Zhang, C.; Jiao, Z.H. Influence of Bedding Planes on Mode I and Mixed-Mode (I-II) Dynamic Fracture Toughness of Coal: Analysis of Experiments. Rock Mech. Rock Eng. 2021, 54, 173–189. [Google Scholar] [CrossRef]
  19. Guo, T.Y.; Wong, L.N.Y. Cracking mechanisms of a medium-grained granite under mixed-mode I-II loading illuminated by acoustic emission. Int. J. Rock Mech. Min. Sci. 2021, 145, 104852. [Google Scholar] [CrossRef]
  20. Zhou, X.P.; Zhang, J.Z.; Qian, Q.H.; Niu, Y. Experimental investigation of progressive cracking processes in granite under uniaxial loading using digital imaging and AE techniques. J. Struct. Geol. 2019, 126, 129–145. [Google Scholar] [CrossRef]
  21. Zhou, X.P.; Lian, Y.J.; Wong, L.N.Y.; Berto, F. Understanding the fracture behavior of brittle and ductile multi-flawed rocks by uniaxial loading by digital image correlation. Eng. Fract. Mech. 2018, 199, 438–460. [Google Scholar] [CrossRef]
  22. Chen, J.C.; Li, J.T.; Ma, G. Experimental investigation on Mode I crack growth and damage mechanism of sandstone subjected to cyclic loading. Eng. Fract. Mech. 2022, 267, 108429. [Google Scholar] [CrossRef]
  23. Ma, G.; Xie, Y.J.; Long, G.C.; Tang, Z.; Zhou, X.; Zeng, X.H.; Li, J.T. Mesoscale investigation on concrete creep behaviors based on discrete element method. Constr. Build. Mater. 2022, 342, 127957. [Google Scholar] [CrossRef]
  24. Zhou, X.P.; Zhang, J.Z. Damage progression and acoustic emission in brittle failure of granite and sandstone. Int. J. Rock Mech. Min. Sci. 2021, 143, 104789. [Google Scholar] [CrossRef]
  25. Cui, Z.; Sheng, Q.; Zhang, G.M.; Zhang, M.C. An Experimental Investigation of the Influence of Loading Rate on Rock Tensile Strength and Split Fracture Surface Morphology. Rock Mech. Rock Eng. 2021, 54, 1969–1983. [Google Scholar] [CrossRef]
  26. Zhuang, D.D.; Yin, T.B.; Li, Q.; Wu, Y.; Chen, Y.J.; Yang, Z. Fractal fracture toughness measurements of heat-treated granite using hydraulic fracturing under different injection flow rates. Theor. Appl. Fract. Mech. 2022, 119, 103340. [Google Scholar] [CrossRef]
  27. Ayatollahi, M.R.; Aliha, M.R.M.; Saghafi, H. An improved semi-circular bend specimen for investigating mixed mode brittle fracture. Eng. Fract. Mech. 2011, 78, 110–123. [Google Scholar] [CrossRef]
  28. Liu, R.F.; Zhu, Z.M.; Li, Y.X.; Liu, B.; Wan, D.Y.; Li, M. Study of rock dynamic fracture toughness and crack propagation parameters of four brittle materials under blasting. Eng. Fract. Mech. 2020, 225, 106460. [Google Scholar] [CrossRef]
  29. Ju, M.H.; Li, J.C.; Yao, Q.L.; Li, X.F.; Zhao, J. Rate effect on crack propagation measurement results with crack propagation gauge, digital image correlation, and visual methods. Eng. Fract. Mech. 2019, 219, 106537. [Google Scholar] [CrossRef]
  30. Zhou, H.W.; Xie, H.P. Direct Estimation of the Fractal Dimensions of a Fracture Surface of Rock. Surf. Rev. Lett. 2003, 10, 751–762. [Google Scholar] [CrossRef]
  31. Ai, T.; Zhang, R.; Zhou, H.W.; Pei, J.L. Box-counting methods to directly estimate the fractal dimension of a rock surface. Appl. Surf. Sci. 2014, 314, 610–621. [Google Scholar] [CrossRef]
  32. Wang, X.R.; Wang, E.Y.; Liu, X.F.; Zhou, X. Failure mechanism of fractured rock and associated acoustic behaviors under different loading rates. Eng. Fract. Mech. 2021, 247, 107674. [Google Scholar] [CrossRef]
  33. Ghamgosar, M.; Bahaaddini, M.; Erarslan, N.; Williams, D.J. A new experimental approach to quantify microfractures in the Fracture Process Zone (FPZ) under various loading conditions. Eng. Geol. 2021, 283, 106024. [Google Scholar] [CrossRef]
  34. Zuo, J.P.; Wang, X.S.; Mao, D.Q. SEM in-situ study on the effect of offset-notch on basalt cracking behavior under three-point bending load. Eng. Fract. Mech. 2014, 131, 504–513. [Google Scholar] [CrossRef]
  35. Erarslan, N.; Alehossein, H.; Williams, D.J. Tensile Fracture Strength of Brisbane Tuff by Static and Cyclic Loading Tests. Rock Mech. Rock Eng. 2014, 47, 1135–1151. [Google Scholar] [CrossRef]
  36. Niu, Y.; Zhou, X.P.; Berto, F. Evaluation of fracture mode classification in flawed red sandstone under uniaxial compression. Theor. Appl. Fract. Mech. 2020, 107, 102528. [Google Scholar] [CrossRef]
  37. Ohno, K.; Uji, K.; Ueno, A.; Ohtsu, M. Fracture process zone in notched concrete beam under three-point bending by acoustic emission. Constr. Build. Mater. 2014, 67, 139–145. [Google Scholar] [CrossRef]
  38. De Smedt, M.; Vrijdaghs, R.; Van Steen, C.; Verstrynge, E.; Vandewalle, L. Damage analysis in steel fibre reinforced concrete under monotonic and cyclic bending by means of acoustic emission monitoring. Cem. Concr. Compos. 2020, 114, 103765. [Google Scholar] [CrossRef]
  39. Du, K.; Li, X.F.; Tao, M.; Wang, S.F. Experimental study on acoustic emission (AE) characteristics and crack classification during rock fracture in several basic lab tests. Int. J. Rock Mech. Min. Sci. 2020, 133, 104411. [Google Scholar] [CrossRef]
  40. Li, D.Y.; Ma, J.J.; Wan, Q.R.; Zhu, Q.Q.; Han, Z.Y. Effect of thermal treatment on the fracture toughness and subcritical crack growth of granite in double-torsion test. Eng. Fract. Mech. 2021, 253, 425. [Google Scholar] [CrossRef]
  41. Xie, Q.; Li, S.X.; Liu, X.L.; Gong, F.; Li, X.B. Effect of loading rate on fracture behaviors of shale under mode I loading. J. Cent. South Univ. 2020, 27, 3118–3132. [Google Scholar] [CrossRef]
  42. Ma, G.; Li, J.T.; Wang, H.W. Related Rule Study of Subcritical Crack Growth and Threshold Values in Transversely Isotropic Slates. Geofluids 2020, 2020, 8843381. [Google Scholar] [CrossRef]
  43. Fineberg, J.; Gross, S.P.; Marder, M.; Swinney, H.L. Instability in the propagation of fast cracks. Phys. Rev. B Condens. Matter 1992, 45, 5146–5154. [Google Scholar] [CrossRef] [PubMed]
  44. Ying, P.; Zhu, Z.M.; Wang, F.; Wang, M.; Niu, C.Y.; Zhou, L. The characteristics of dynamic fracture toughness and energy release rate of rock under impact. Measurement 2019, 147, 106884. [Google Scholar] [CrossRef]
  45. Meng, T.; Yue, Y.; Ma, J.W.; Jiao, B.; Niu, H.J.; Wen, L.; Xue, Y.B. Use of DC voltage fluctuation method to investigate real-time Mode I and Mode II subcritical crack growth behavior in gypsum rock. Eng. Fract. Mech. 2020, 234, 107104. [Google Scholar] [CrossRef]
  46. Zhou, Z.L.; Cai, X.; Ma, D.; Cao, W.; Chen, L.; Zhou, J. Effects of water content on fracture and mechanical behavior of sandstone with a low clay mineral content. Eng. Fract. Mech. 2018, 193, 47–65. [Google Scholar] [CrossRef]
  47. Xie, H.P.; Sun, H.Q.; Ju, Y.; Feng, Z.G. Study on generation of rock fracture surfaces by using fractal interpolation. Int. J. Solids Struct. 2001, 38, 57–65. [Google Scholar] [CrossRef]
Figure 1. Diagrams and photos of three different asymmetric notched semi-circular bending specimens. The circles on the top and bottom of the specimen represent the loading and supporting rollers, respectively. it should be noted that the white-black speckle on the sample surface can be analyzed by the DIC method.
Fractalfract 06 00336 g001
Figure 2. Schematic of the test system. (a) SANS−CHT4206 universal material testing machine, (b) the photo view of the specimen, (c) the measurement system of CPG, (d) the AE system, (e) the DIC measurement, and (f) the calculation of the fractal dimension.
Fractalfract 06 00336 g002
Figure 3. The load-deflection curves and peak loads of different ANSCB specimens.
Fractalfract 06 00336 g003
Figure 4. Schematic of crack propagation rate measurement.
Fractalfract 06 00336 g004
Figure 5. Evolution of axial load and AE counts (a) ANSCB-I; (b) ANSCB-II; (c) ANSCB-III.
Fractalfract 06 00336 g005
Figure 6. Evolution of strain ε x x representing different cracking stages: (a) Nonlinear elastic stage; (b) fracture process zone; (c) crack initiation stage; (d) crack propagation stage.
Fractalfract 06 00336 g006
Figure 7. x-displacements and the failure paths of specimen failure: (a) ANSCB−I; (b) ANSCB−II; (c) ANSCB−III.
Fractalfract 06 00336 g007
Figure 8. SEM images of the fractured surfaces: blue marks and green marks represent transgranular fracture and intergranular fracture, respectively. (a) ANSCB−I; (b) ANSCB−II; (c) ANSCB−III.
Fractalfract 06 00336 g008
Figure 9. A method to distinguish microcrack by acoustic emission parameters: (a) AE parameters; (b) microcrack distribution (modified from [37]).
Fractalfract 06 00336 g009
Figure 10. Microcrack classification for ANSCB specimen: (a) ANSCB−I; (b) ANSCB−II; (c) ANSCB−III.
Fractalfract 06 00336 g010
Figure 11. The voltage signal and subcritical crack growth rate. (a) Variation of CPG voltage signal during the whole process for specimen ANSCB−II−1, (b) the subcritical crack growth rate of ANSCB−I, (c) the subcritical crack growth rate of ANSCB−II, and (d) the subcritical crack growth rate of ANSCB-III.
Fractalfract 06 00336 g011aFractalfract 06 00336 g011b
Figure 12. Digitized fracture surfaces and the associated fitting results of lnN(δ) and lnδ. (a) ANSCB−I, (b) ANSCB−II, and (c) ANSCB−III.
Fractalfract 06 00336 g012
Figure 13. Fractal dimension of the fracture surface.
Fractalfract 06 00336 g013
Table 1. Some physical and mechanical properties of the investigated sandstone.
Density Porosity Elasticity Modulus Poisson Ratio UCS TS
2.436 g·cm−32.488%43.702 GPa0.23370.841 MPa5.921 MPa
Note: UCS represents uniaxial compressive strength, TS represents tensile strength.
Table 2. Dimensional parameters of three asymmetric notched semi-circular bendings.
Specimen ModelR/mmB/mma/mmS1/mmS2/mmDifferences
ANSCB-I5035203030 β = 26.5 °
ANSCB-II5035203030L = 13.6 mm
ANSCB-III5035204020L = 7 mm
Publisher’s Note: MDPI stays neutral with regard to jurisdictional claims in published maps and institutional affiliations.

