Article

A Fractal Entropy-Based Effective Particle Model Used to Deduce Hydraulic Conductivity of Granular Soils

1
Institute of Solid Mechanics, School of Physics and Elecronic-Electrical Engineering, Ningxia University, Yinchuan 750021, China
2
School of Civil and Hydraulics Engineering, Ningxia University, Yinchuan 750021, China
3
Department of Civil Engineering, University of Engineering and Technology Lahore, Punjab 54890, Pakistan
*
Author to whom correspondence should be addressed.
Fractal Fract. 2022, 6(9), 474; https://doi.org/10.3390/fractalfract6090474
Submission received: 12 July 2022 / Revised: 11 August 2022 / Accepted: 26 August 2022 / Published: 28 August 2022
(This article belongs to the Special Issue Fractal and Fractional in Geomaterials)

Abstract

:
In this study, a rigorous mathematical approach used to compute an effective diameter based on particle size distribution (PSD) has been presented that can predict the hydraulic conductivity of granular soils with enhanced rigor. The PSD was discretized based on an abstract interval system of fractal entropy, while the effective diameter of soil was computed using the grading entropy theory. The comparisons between current entropy-based effective diameter (DE) and those computed using existing procedures show that the current DE can capture the particle size information of a given soil more accurately than others. Subsequently, the proposed DE was successfully implicated into Kozeny–Carman’s formula to deduce the saturated hydraulic conductivity of soils with enhanced accuracy. The proposed model was tested using current and previously published experimental data from literature. Not surprisingly, the results of the current model and those from previous experimental studies were found to be consistent, which can sufficiently verify the proposed entropy-based effective diameter model.

1. Introduction

The particle size distribution (PSD) curve is an important soil characteristic that is widely used for preliminary estimates of numerous physical properties of granular soils, such as potentials of internal erosion, particle breakage, sedimentation, and saturated hydraulic conductivity, etc. [1,2,3,4,5]. For instance, Seelheim [6] and Hazen [7] pioneered the determination of saturated hydraulic conductivity based on the semi-logarithmic PSD curve. Ever since, several researchers have attempted to propose more rigorous and accurate correlations, such as the semi-empirical method of Kozeny–Carman (henceforth abbreviated as K-C), which combines soil properties, including the void ratio and specific particle sizes, to predict saturated hydraulic conductivity [8]. Nevertheless, the differences in the proportion and fraction of a PSD significantly affect the evaluation of sedimentary mixtures, such as loess, paleosol, river sediments, and glacial deposits [9]. For instance, the soil modulus extracted from a soil’s PSD also influences its mechanical properties, including the shear strength and dynamic shear modulus [10]. Similarly, PSD is an important factor in assessing the potential of the internal erosion of soils [3,11,12,13,14]. Lately, Indraratna et al. [15] combined the PSD with the relative density considering the condition of particle packing and proposed the meaningful constriction size distribution (CSD)-based method. Israr and Zhang [16] adopted Loincz’s model [17] to extract full grading information through entropy theory and proposed a fractal (grading) entropy-based method to promptly as well as accurately assess the internal erosion potential of granular soils.
Thus far, several end-member modeling algorithms have been proposed for decomposing and extracting valuable information from the PSD curves of soils [18]. For example, parametric curve-fitting, a statistical method such as the end-member modeling algorithm, has been used to identify the sub-populations of geological materials by decomposing its PSD [19]. Similarly, Chapuis and Saucer [20] proposed a modal decomposition method (MDM) to extract the sub-populations or modes from a soil’s PSD curve to deduce its specific surface and to subsequently assess its internal erosion potential, while the PSD of sediments was fitted by the gradient descent (GD) method. Nonetheless, the above methods mainly account for a finer fraction of a non-uniform soil, whereas a coarser fraction is characterized through additional mathematical models with certain fitting parameters, such as the Gates–Gaudin–Schuhmann model, the Fuller model, the Gaudin–Meloy model (GMM), and the Fredlund unimodal (FUM) [21]. Meanwhile, a set of characteristic diameters determined from a PSD such as D10, D15, D60, and D85 and the coefficients of uniformity and curvature have been widely used in several geotechnical engineering applications (where the numeric value represents the percentage finer by mass). For example, D15 and D85 are widely adopted particle sizes in both filter design and the potential of internal instability assessment criteria [22,23,24,25,26,27].
Based on a simple and semi-automated sampling procedure, Hazen [8] proposed using D10 as a representative size of a PSD to capture its saturated hydraulic conductivity (k), which was later adopted for capturing the heterogeneity of a soil mixture through the coefficient of uniformity (Cu = D60/D10). Subsequently, several empirical formulae have been developed for estimating k based on Hazen’s specific size D10 [1,28,29,30], D17 [31], D20 [32], D50 [33,34], and D75 [35]. However, in the widely accepted Kozeny–Carman (K-C) equation for k, an effective particle size is used instead of Hazen’s D10 [8]. This effective particle size represents the entire PSD and is used for extracting material properties [19]; however, it is computed through complex procedures involving over-simplified assumptions [8,36,37,38,39,40,41]. A brief review of some of the most adopted methods is given in Appendix A.
Notably, the existing methods compute effective particle sizes based on different particle sizes and their relative weightage in terms of the percentage finer on the PSD curve. As an approximate and over-simplified approach, the PSD curves are plotted based on the results of sieve analysis, while only specific sieve sizes are used in delineating the distribution of particles. The accuracy of a PSD curve significantly depends on the interval chosen between various particle sizes and their corresponding percentage finer by either mass, number, or surface area. It is therefore recommended not to further simplify a given PSD curve for deducing the approximate effective particle size to indirectly represent the soil’s pore size distributions and hence the hydraulic conductivity. Thus, the current study purports extracting PSD information more rigorously using the theory of grading entropy to compute the effective diameter for direct use in the K-C formula to capture saturated hydraulic conductivity with enhanced accuracy. The current proposition has been verified using an independent experimental dataset to demonstrate its enhanced rigor and the practical implication of this study has been demonstrated for utility to practitioners.

2. Effective Particle Diameter Based on Fractal Entropy

The effective particle size of a soil depends on the distribution of particle sizes and their relative proportion in a PSD curve, which is generally obtained from sieve analysis. For instance, the soil’s particle sizes are plotted against the percentage finer by the mass of those particle sizes in a semi logarithmic coordinate system in order to obtain a PSD curve. Given that the group of discrete data can be analyzed through either a frequency distribution or cumulative frequency distribution diagram, wherein both number of discrete data intervals and their sizes are important, not surprisingly, the discrete intervals of a group of data will have a different impact on each dataset. For instance, a group of discrete data consisting of a single class interval (too wide) would compromise a lot of useful information, whereas the same dataset discretized into many small class intervals would yield a large amount of sparse data, which may not be conducive for subsequent analysis. Nevertheless, the entropy-based discretization method is an optimal solution [16]. In this paper, the grading entropy is used to discretize the PSD data to deduce a reasonable effective particle diameter that can accurately represent the grading information of soils.

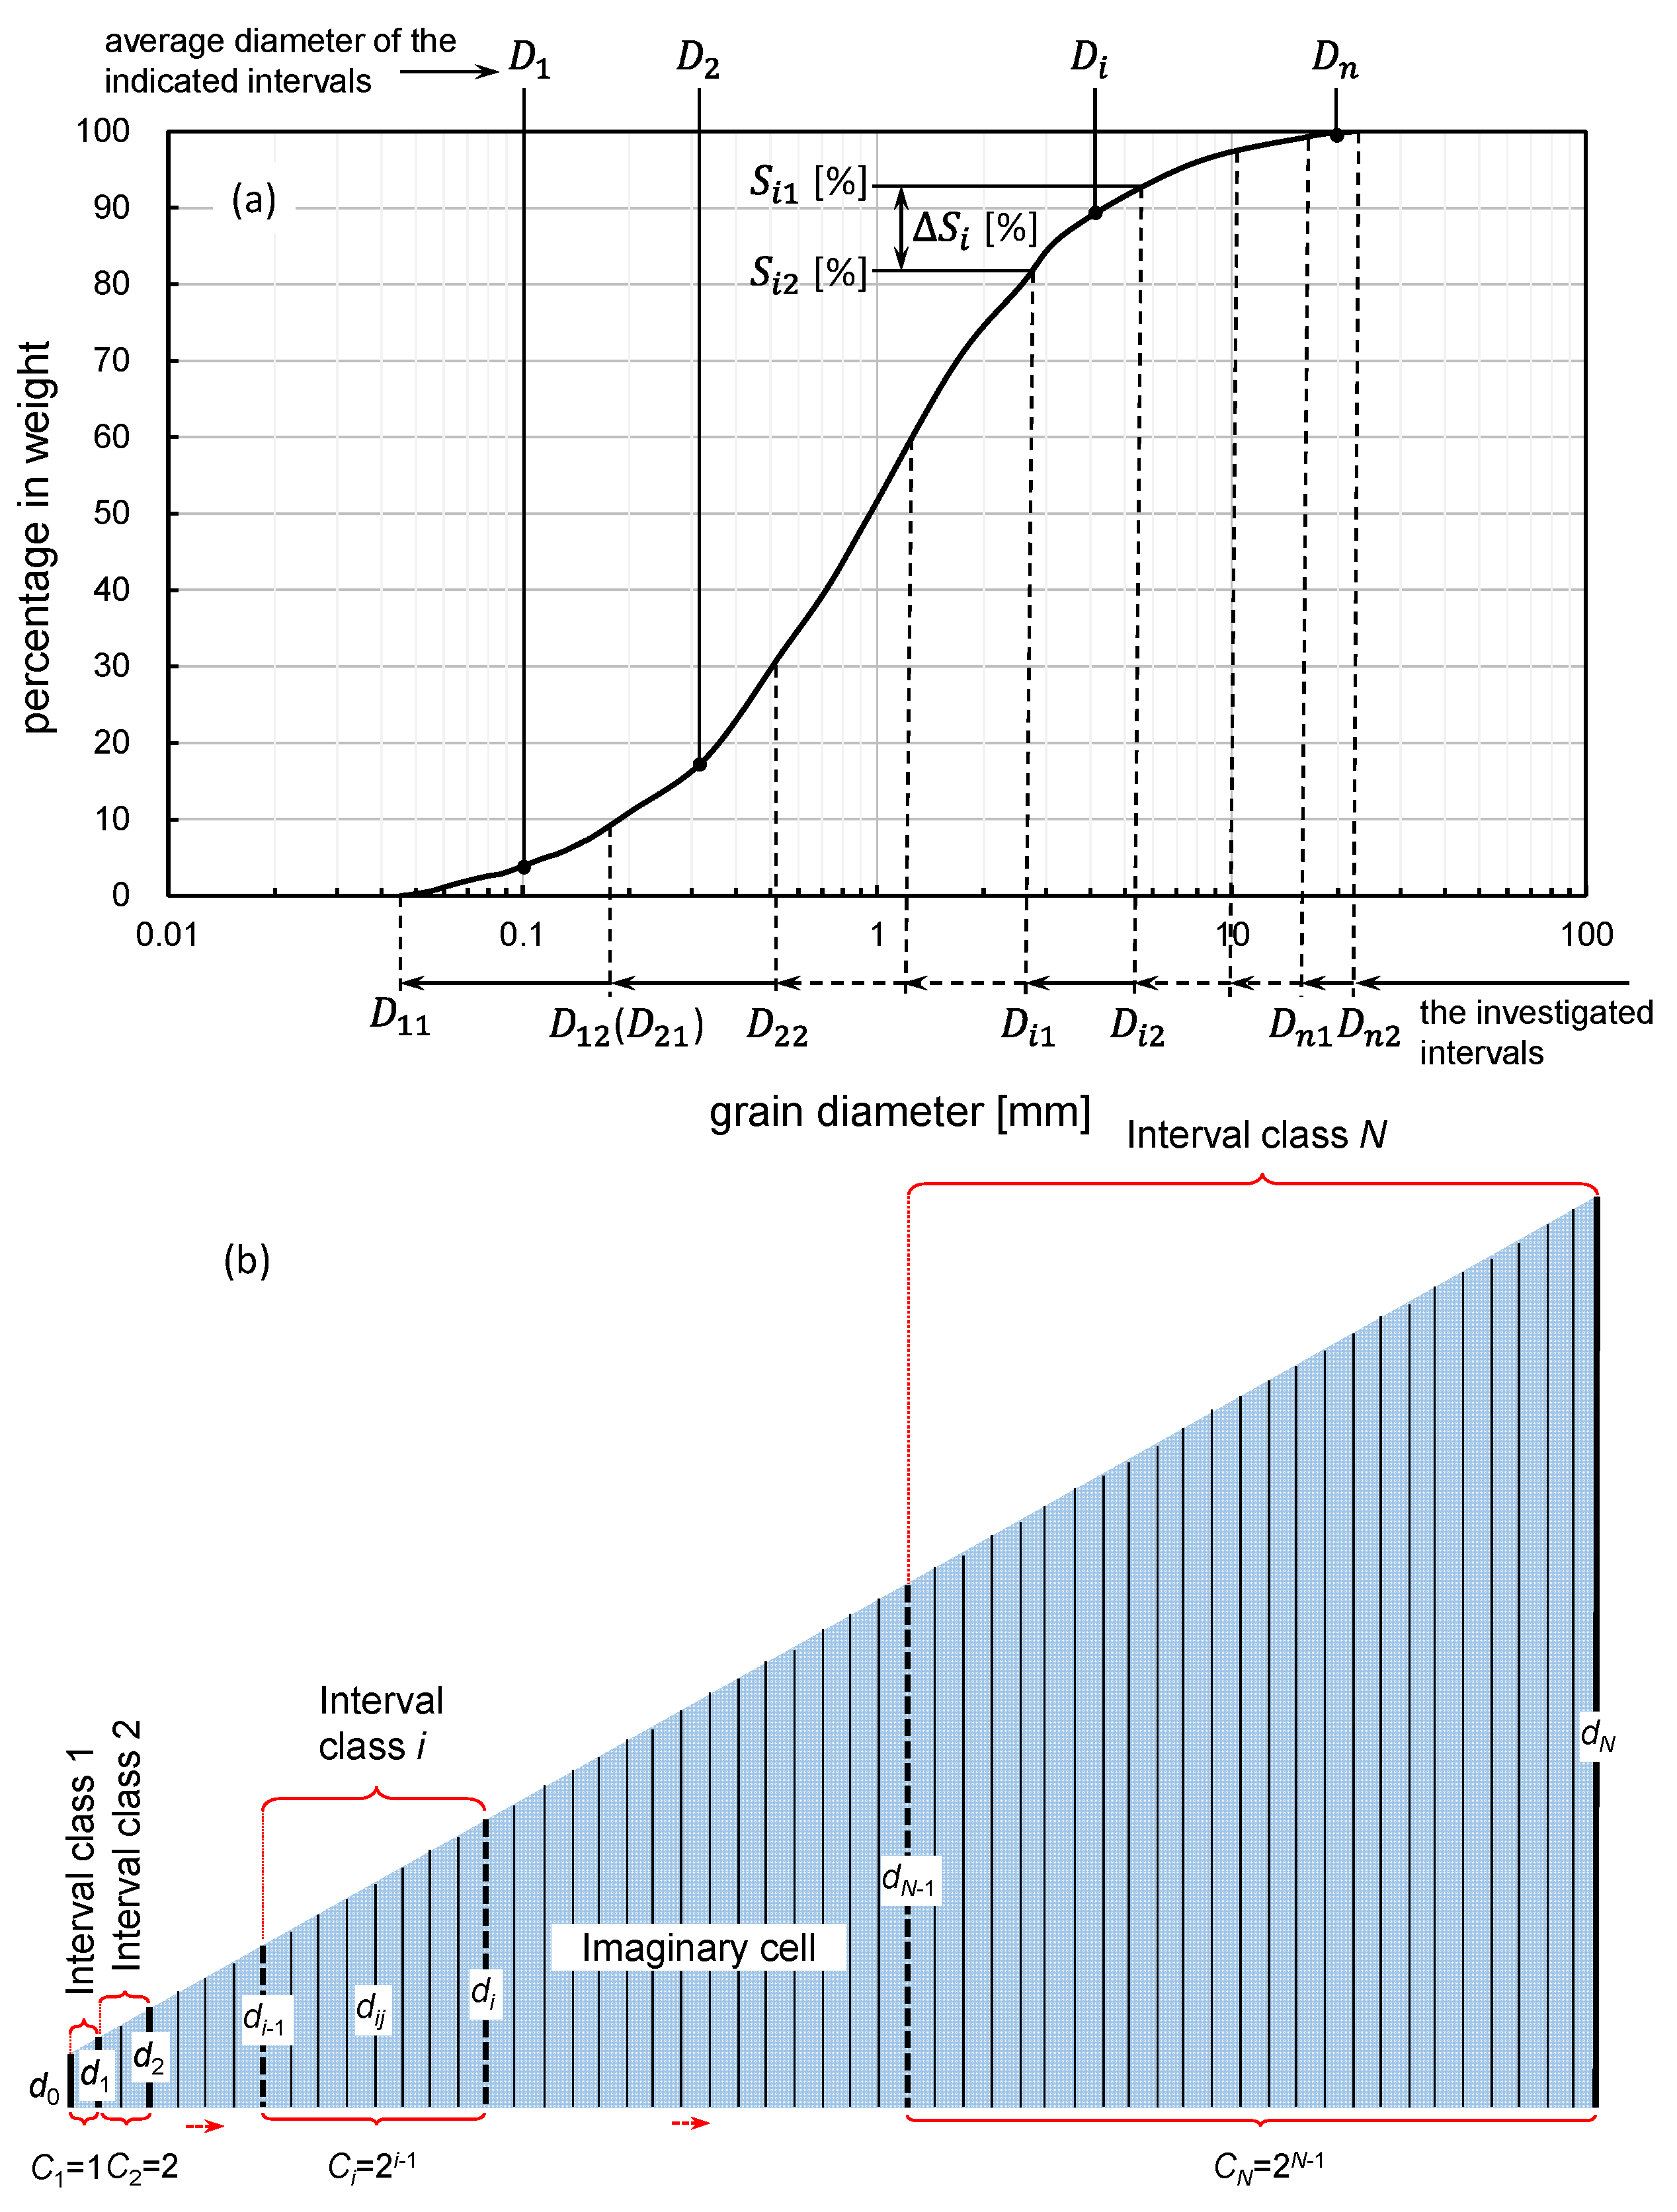
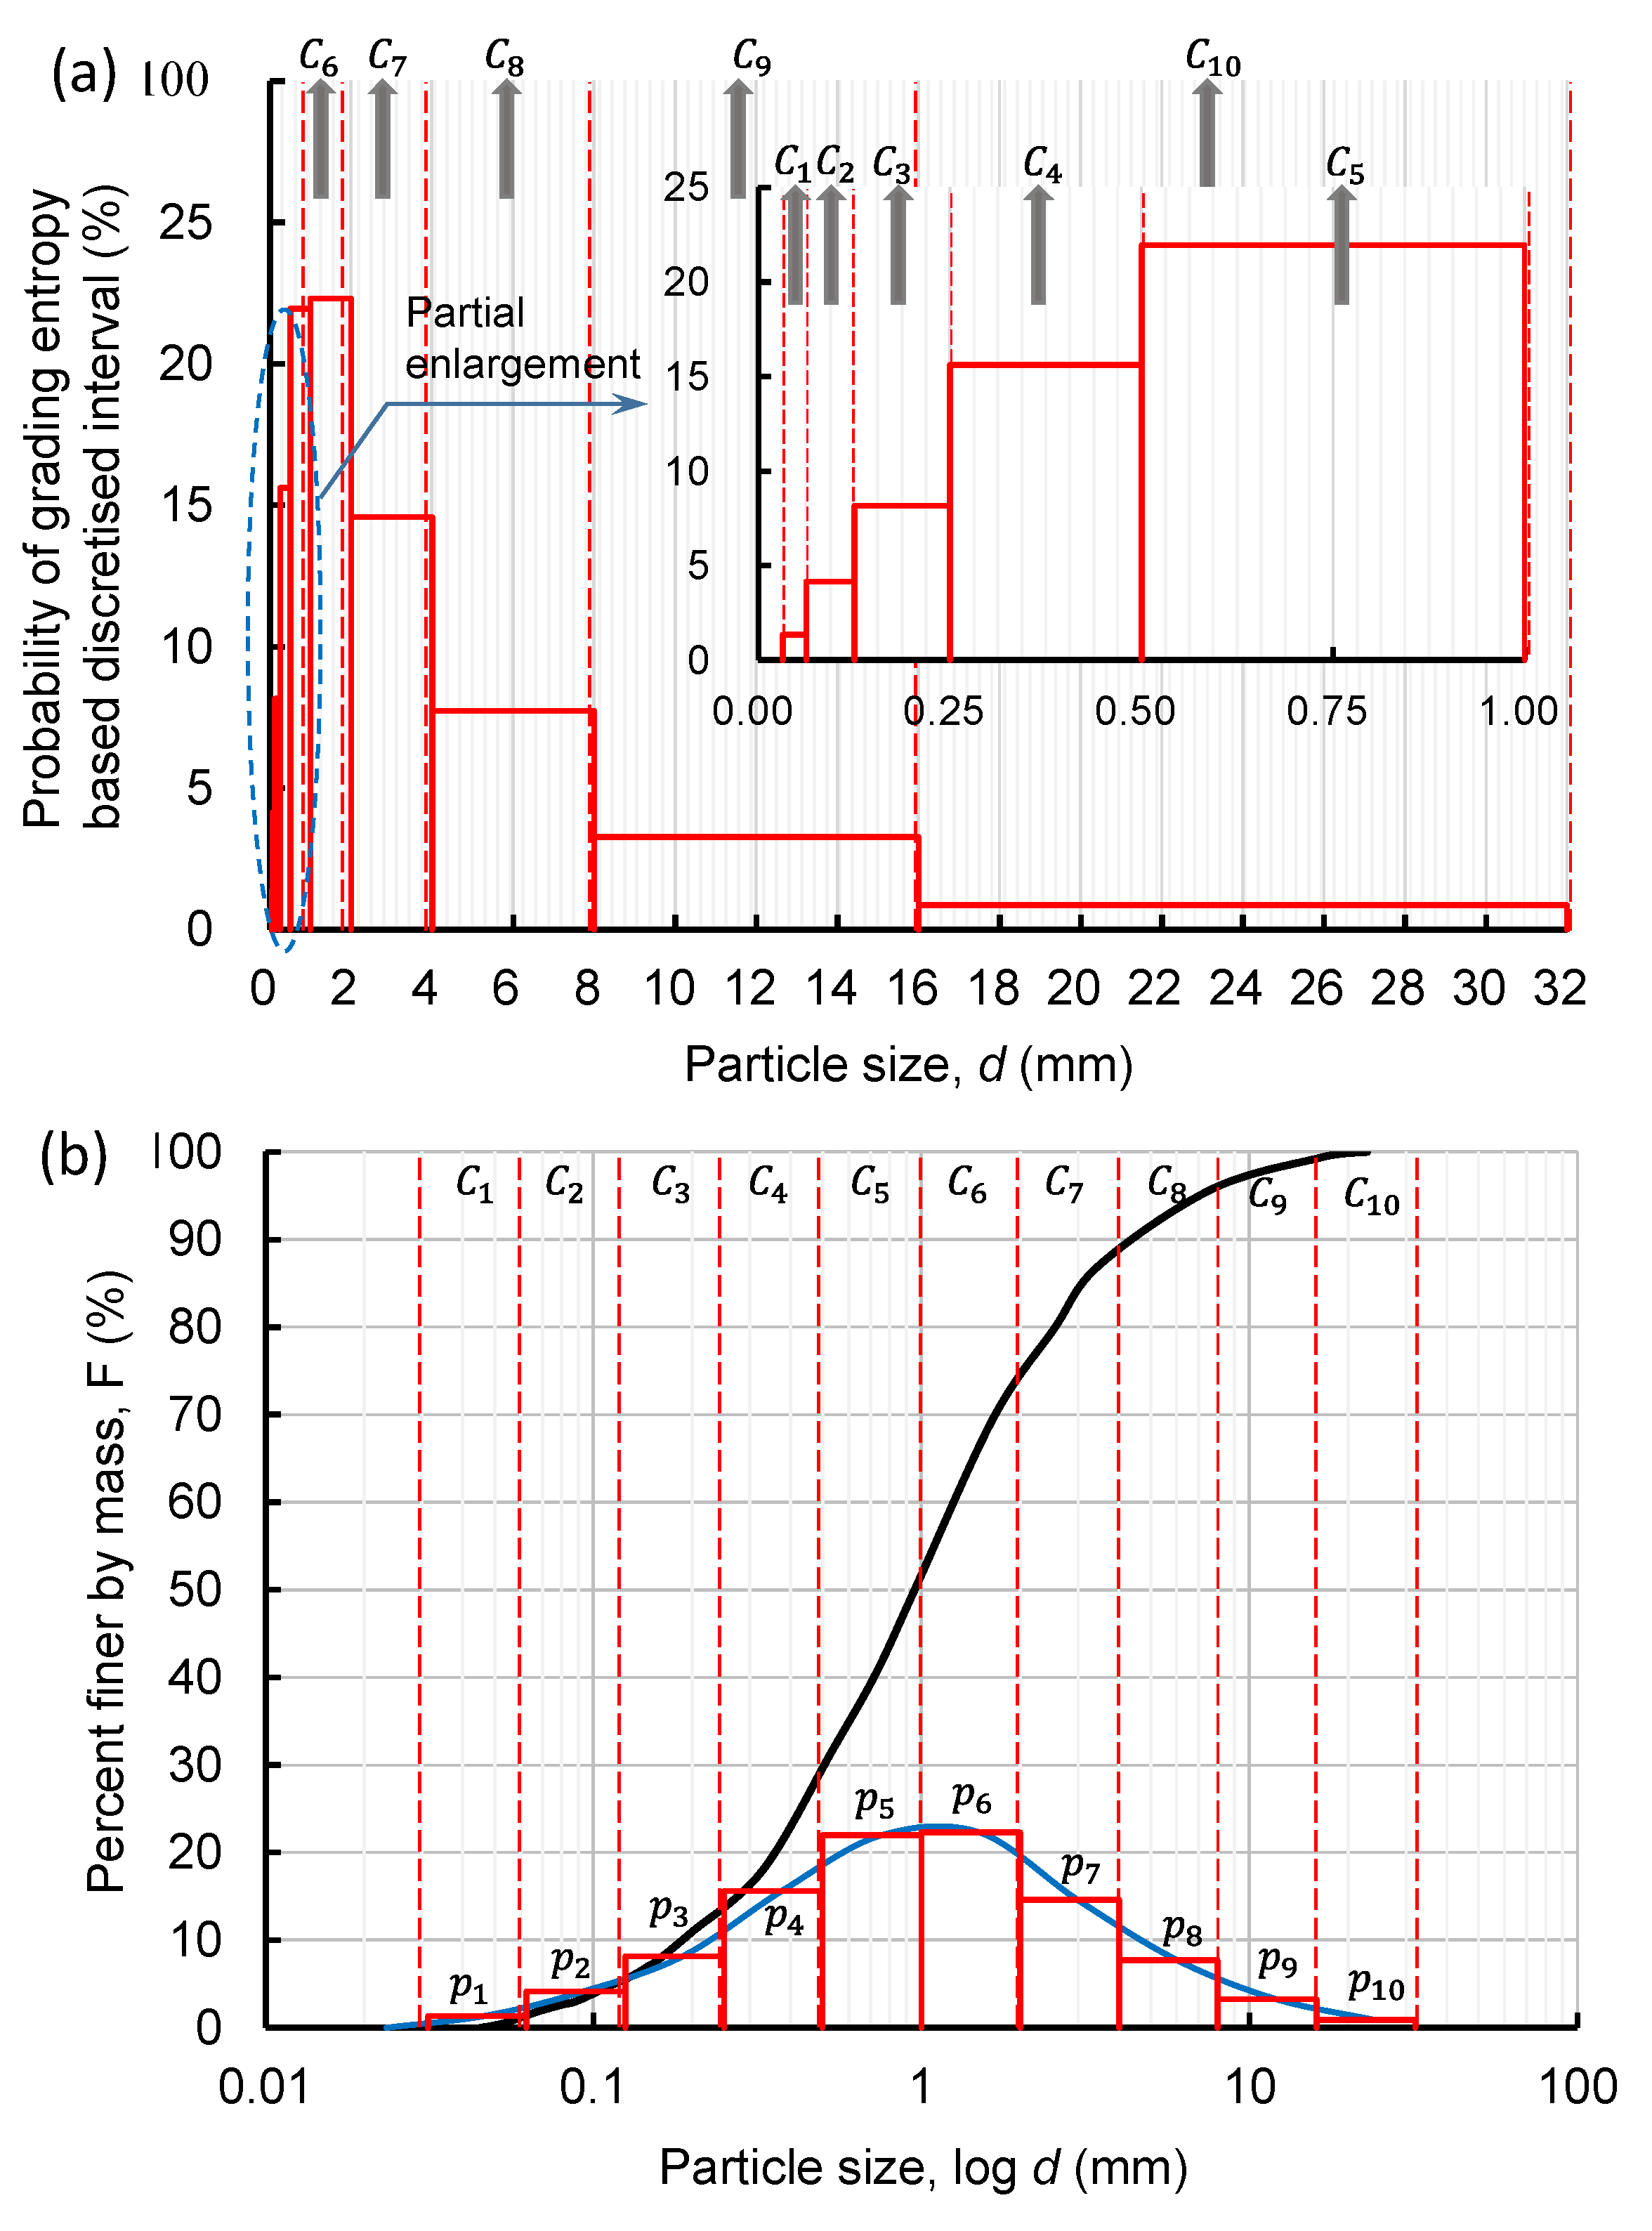
2.1. Interval Class Discretization Based on Grading Entropy

Discretization based on the grading entropy principal was applied on the results of sieve analysis, whereby soil is divided into different class intervals (i.e., sieve opening sizes) and the size of a discretized interval class is not fixed. For instance, Lőrincz et al. [42] pointed out that the size of the subsequent interval class is twice the size of the former class interval. For instance, for a given series of sieve openings 0.063, 0.125, 0.25, 0.5, 1, 2, 4, 8, ... mm, the class size multiple is 2, whereas the suggested size of the elementary class interval class, also known as minimum soil particle size, remains d 0 = 2 17 mm. This sequence of the interval class constitutes the primary statistical interval class system (referred to as the primary interval class), which is shown in the red brackets in Figure 1b. To accurately extract information from each interval class, a primary interval class can be sub-divided further into hypothetical secondary classes called an abstract interval system.
According to the abstract interval system (Figure 2), the PSD of a soil can be discretized into N different size interval classes, and the following formula can be obtained:
d i = 2 i 1 d 0 ,   i = 1 , 2 , N
d i j = d i + ( j 1 ) d 0 ,   j = 1 , 2 , C i
where d i is the upper diameter size of the i interval class; d i j is the upper diameter size of the j imaginary cell within the i interval class; C i is the number of imaginary cells within the i interval class, and
C i = d i + 1 d i d 0 = 2 i 1
Figure 2a shows the abstract size fraction system of the PSD curve shown previously in Figure 1a, whereas Figure 2b demonstrates the application of the method of abstract size fractions in a semi logarithmic coordinate system. It can be seen from the comparison between Figure 1a and Figure 2b that the information extracted by the grading entropy discretization method is more comprehensive.

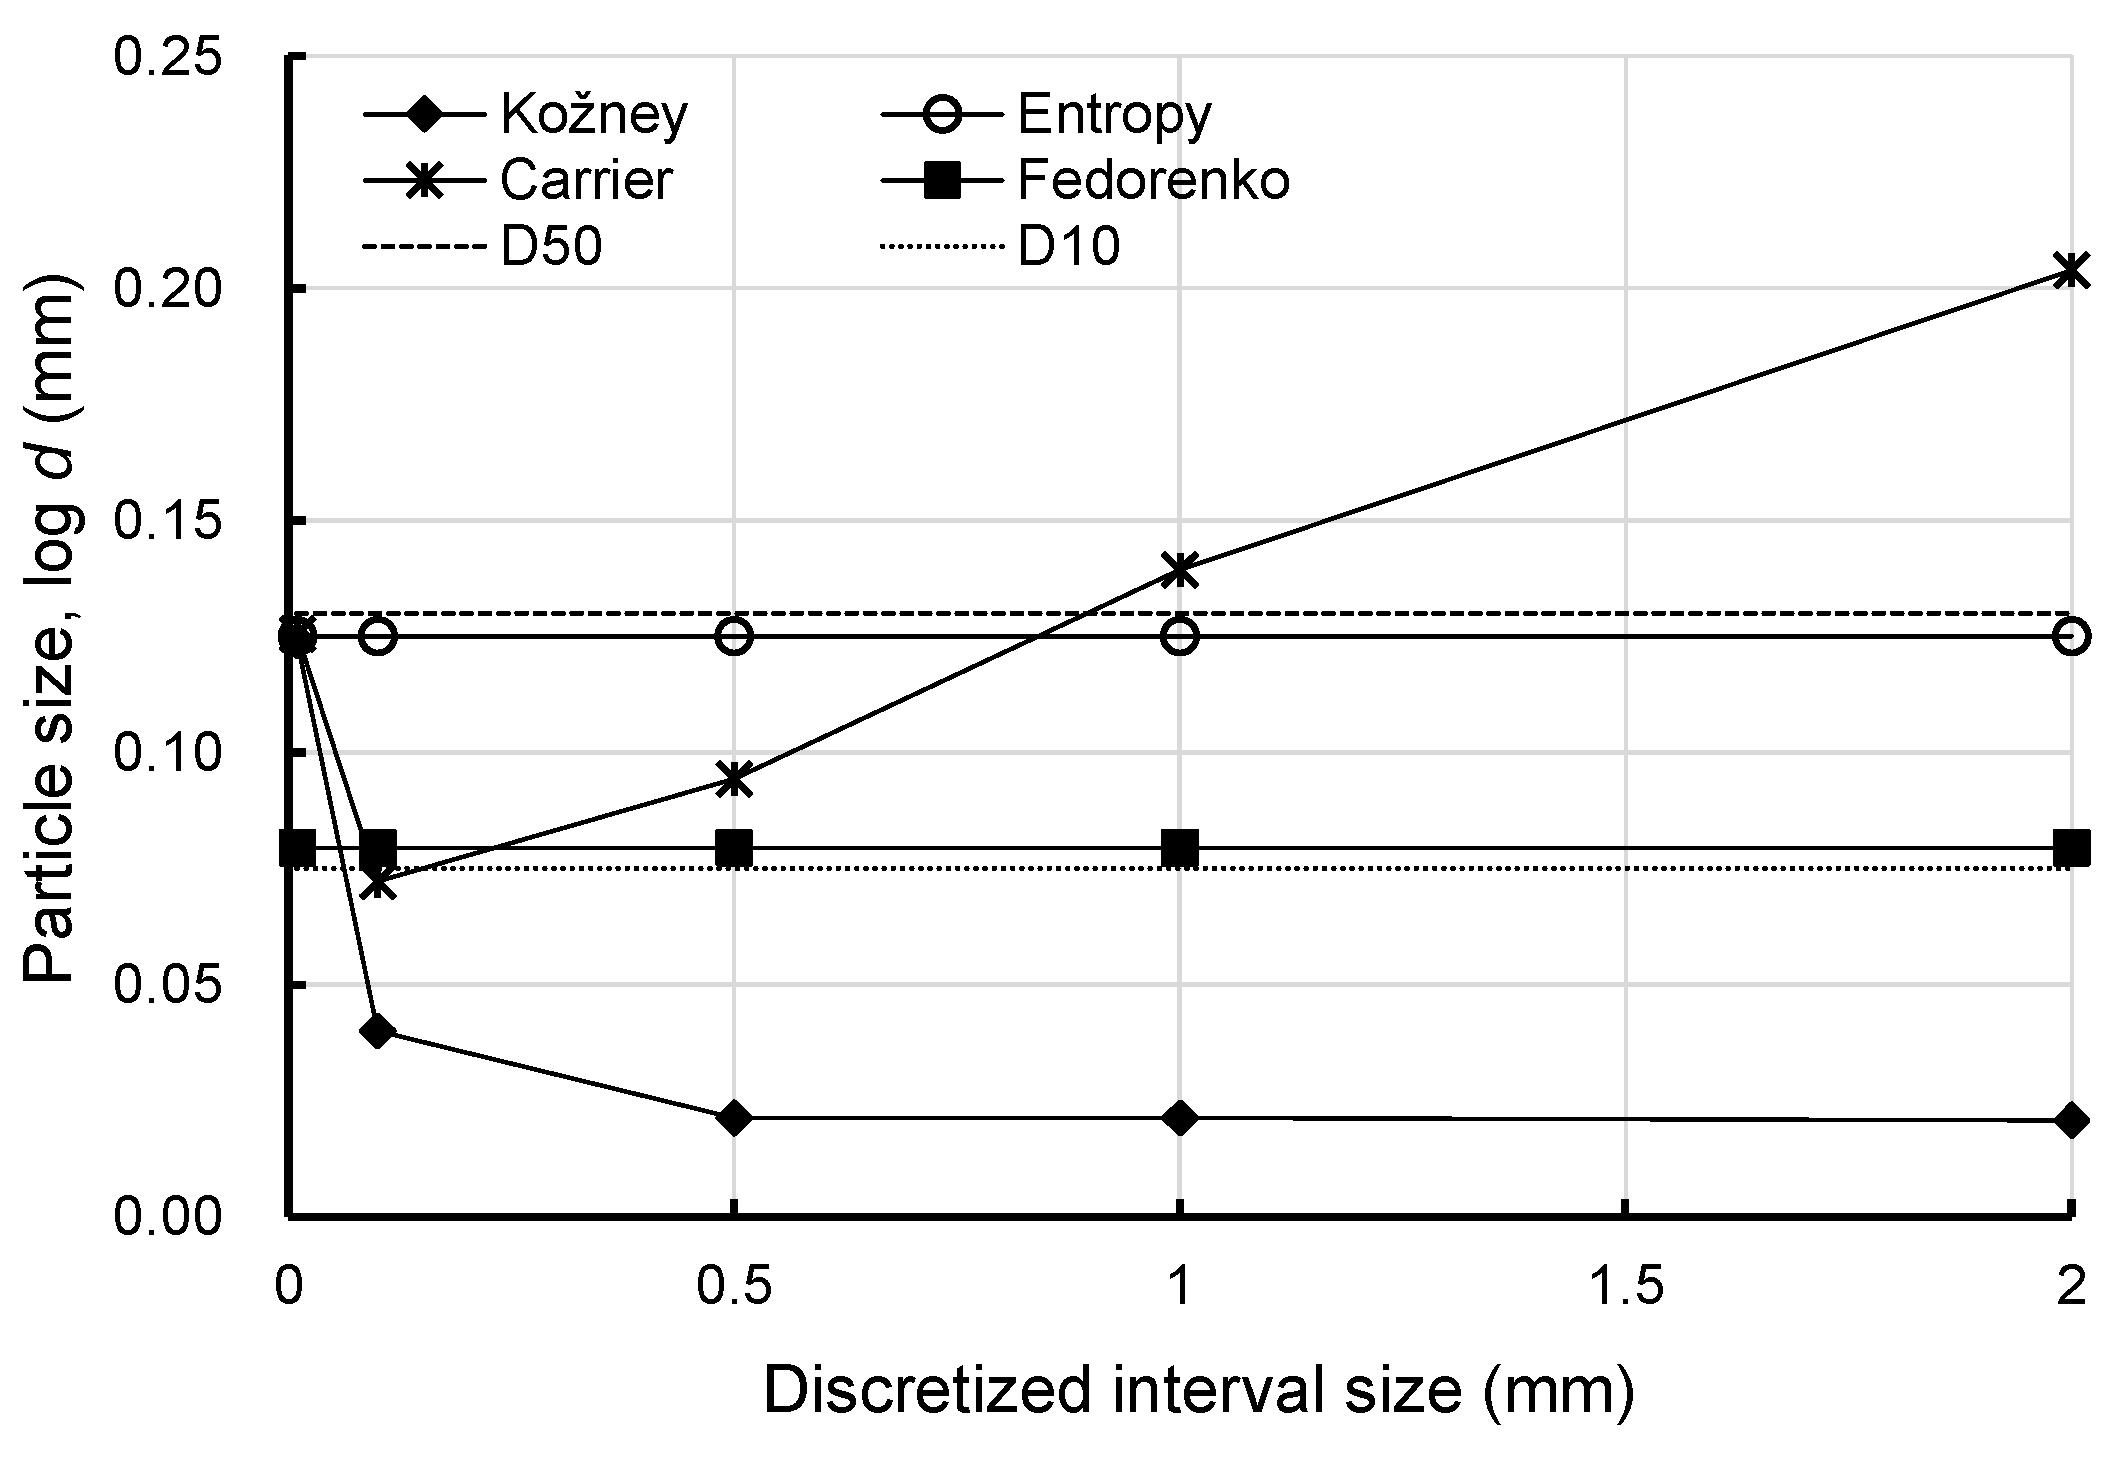
2.2. Effective Particle Diameter Based on Grading Entropy

Given that a PSD curve can be discretized into several different size interval classes by using a series of data sequences ( μ i j ,   d i j ) within each interval class that can be substituted into Equation (A3), the effective particle diameter can be given by:
D E = 1 i = 1 N j = 1 C i μ i j d ¯ i j = 1 i = 1 N j = 1 C i 1 d ¯ i j p i C i
where D E is the grading entropy-based effective particle diameter, μ i j is the probability of the j imaginary cell within the i interval class, d ¯ i j is the average diameter in the j imaginary cell within the i interval class, and
d ¯ i j = 3 1 d i , j 1 + 2 d i , j 1 + d i , j + 1 d i , j
The above equation assumes that the soil particles are spherical, which does not take the shape factor into consideration. In this paper, the shape coefficient of Kovács [39] is adopted to account for the particle shape. For simplicity, the values of the shape coefficient of some regular geometries α D are shown as follows: for sphere: α D = 6 ; for cube: α D = 10.4 ; for octahedron: α D = 10.4 ; for tetrahedron: α D = 18 ; for other complicated shapes, the values can be interpolated using these values.

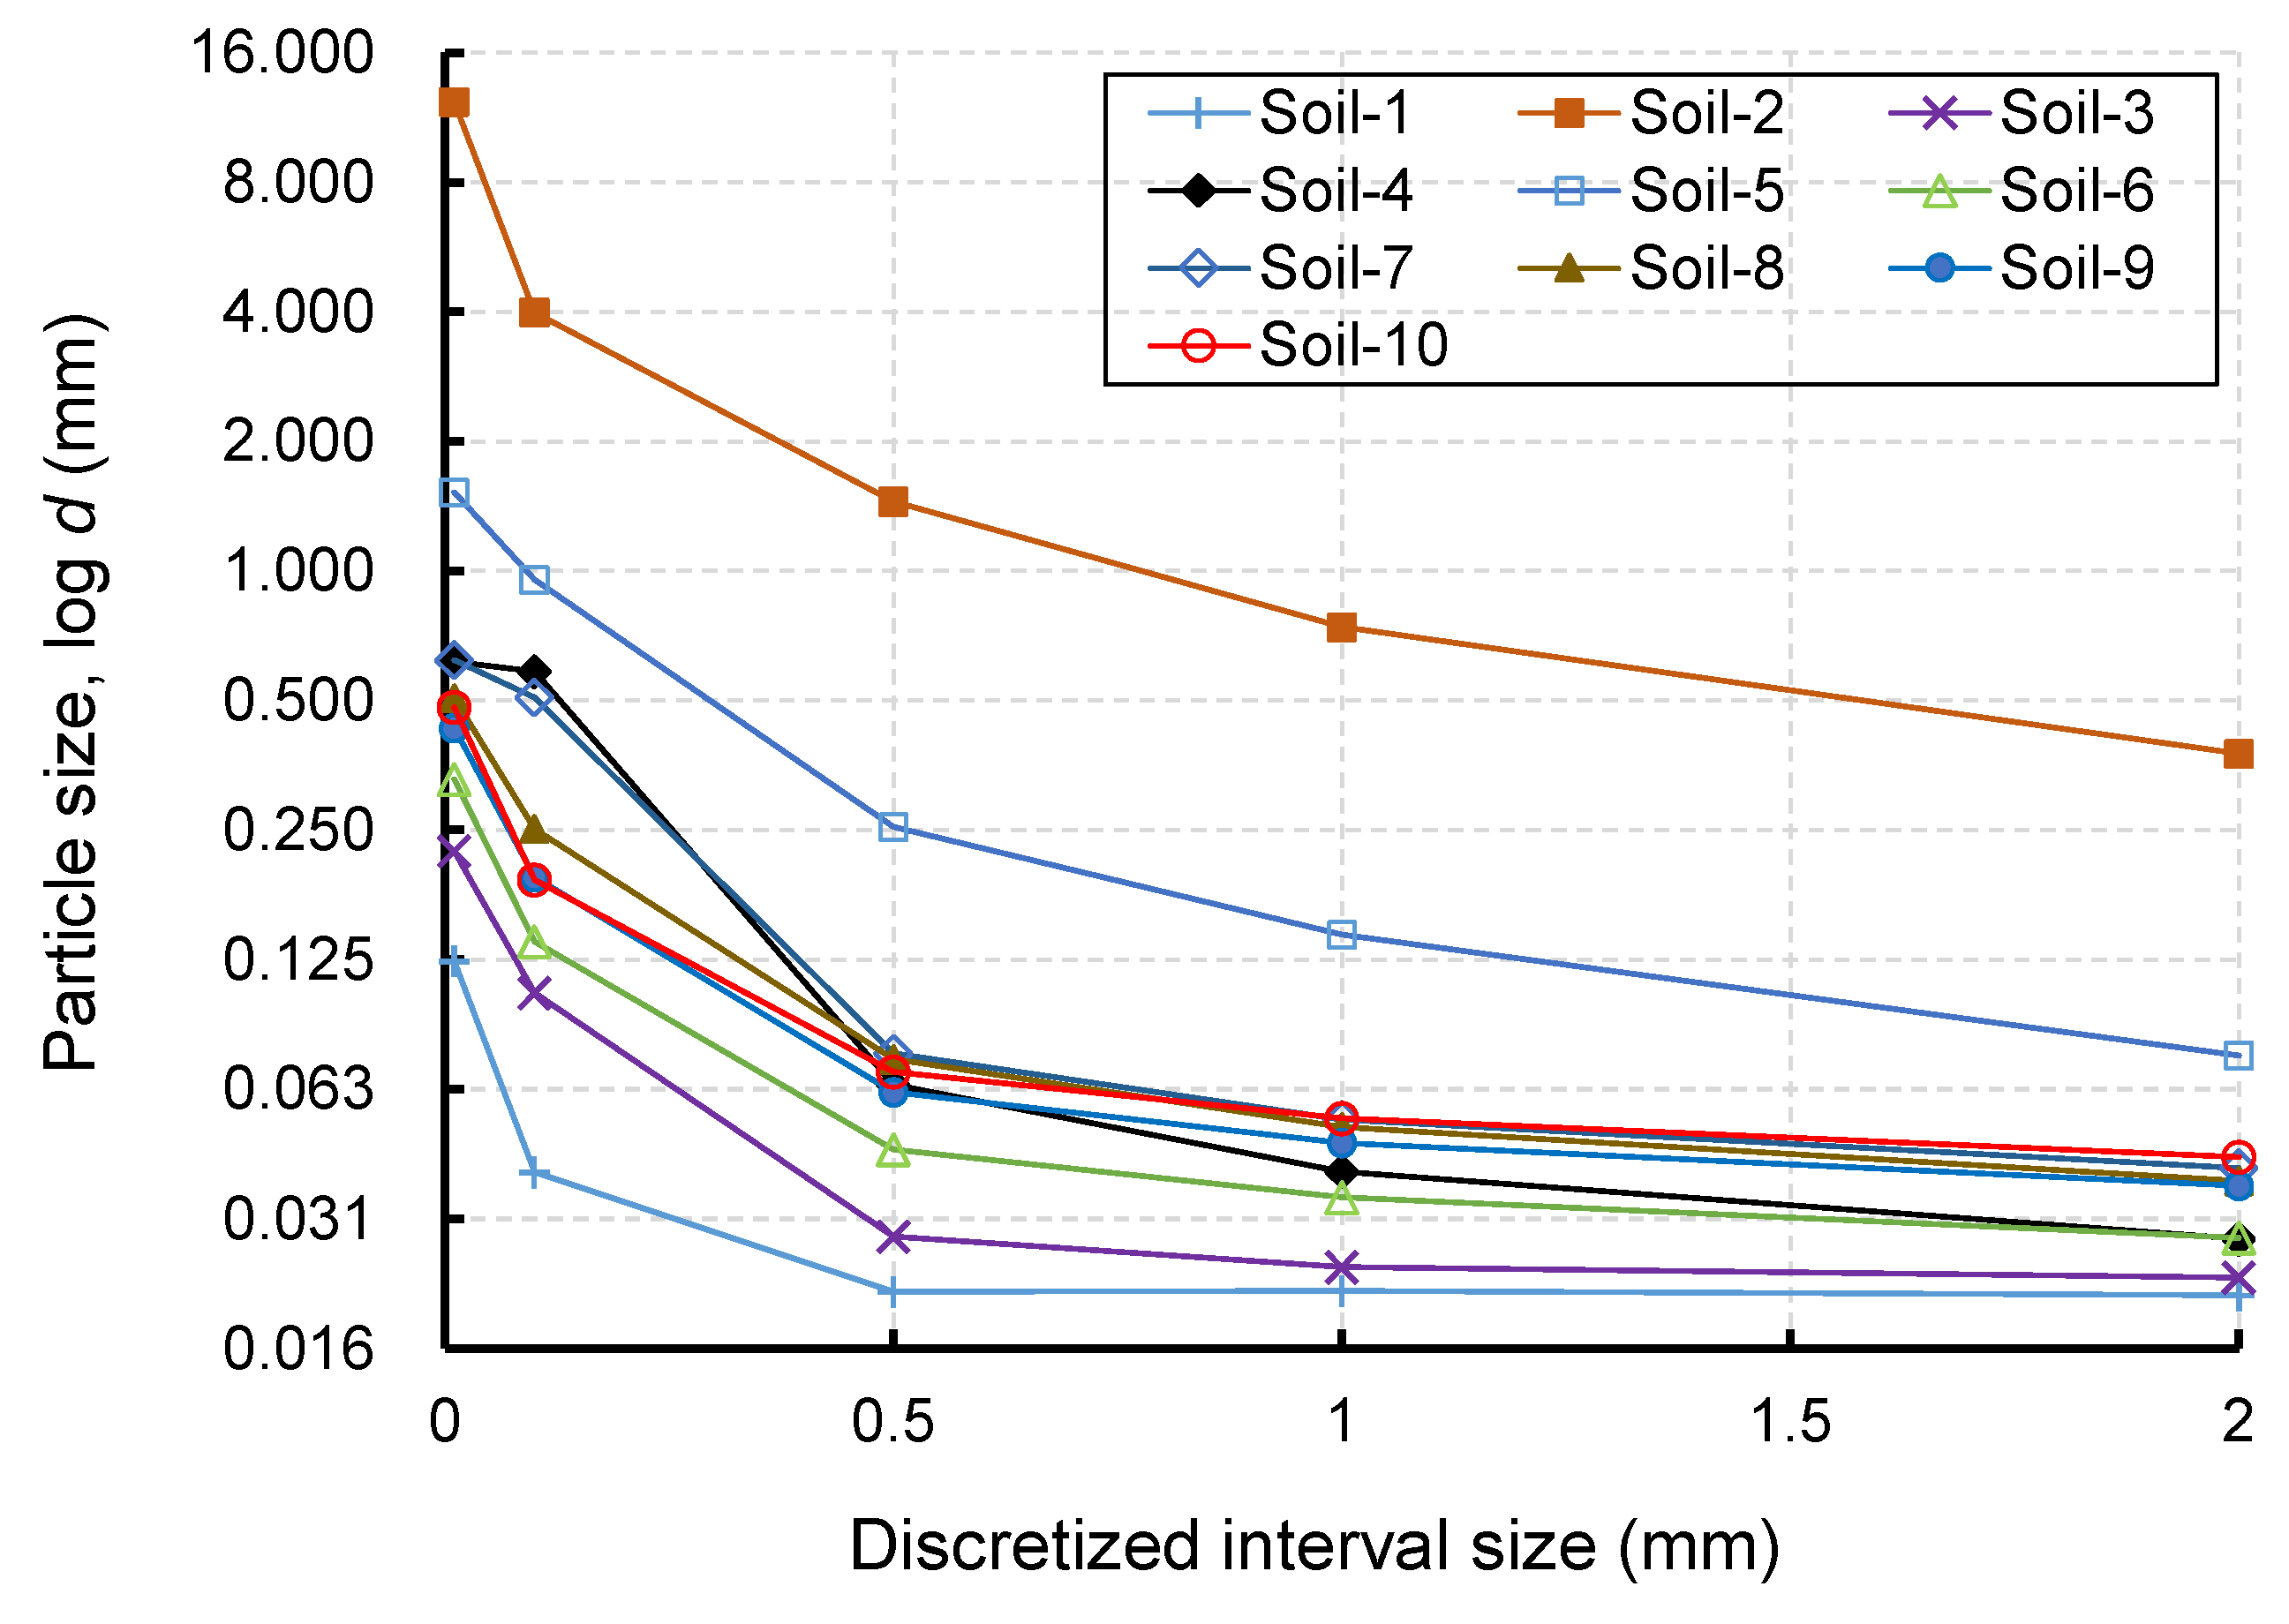
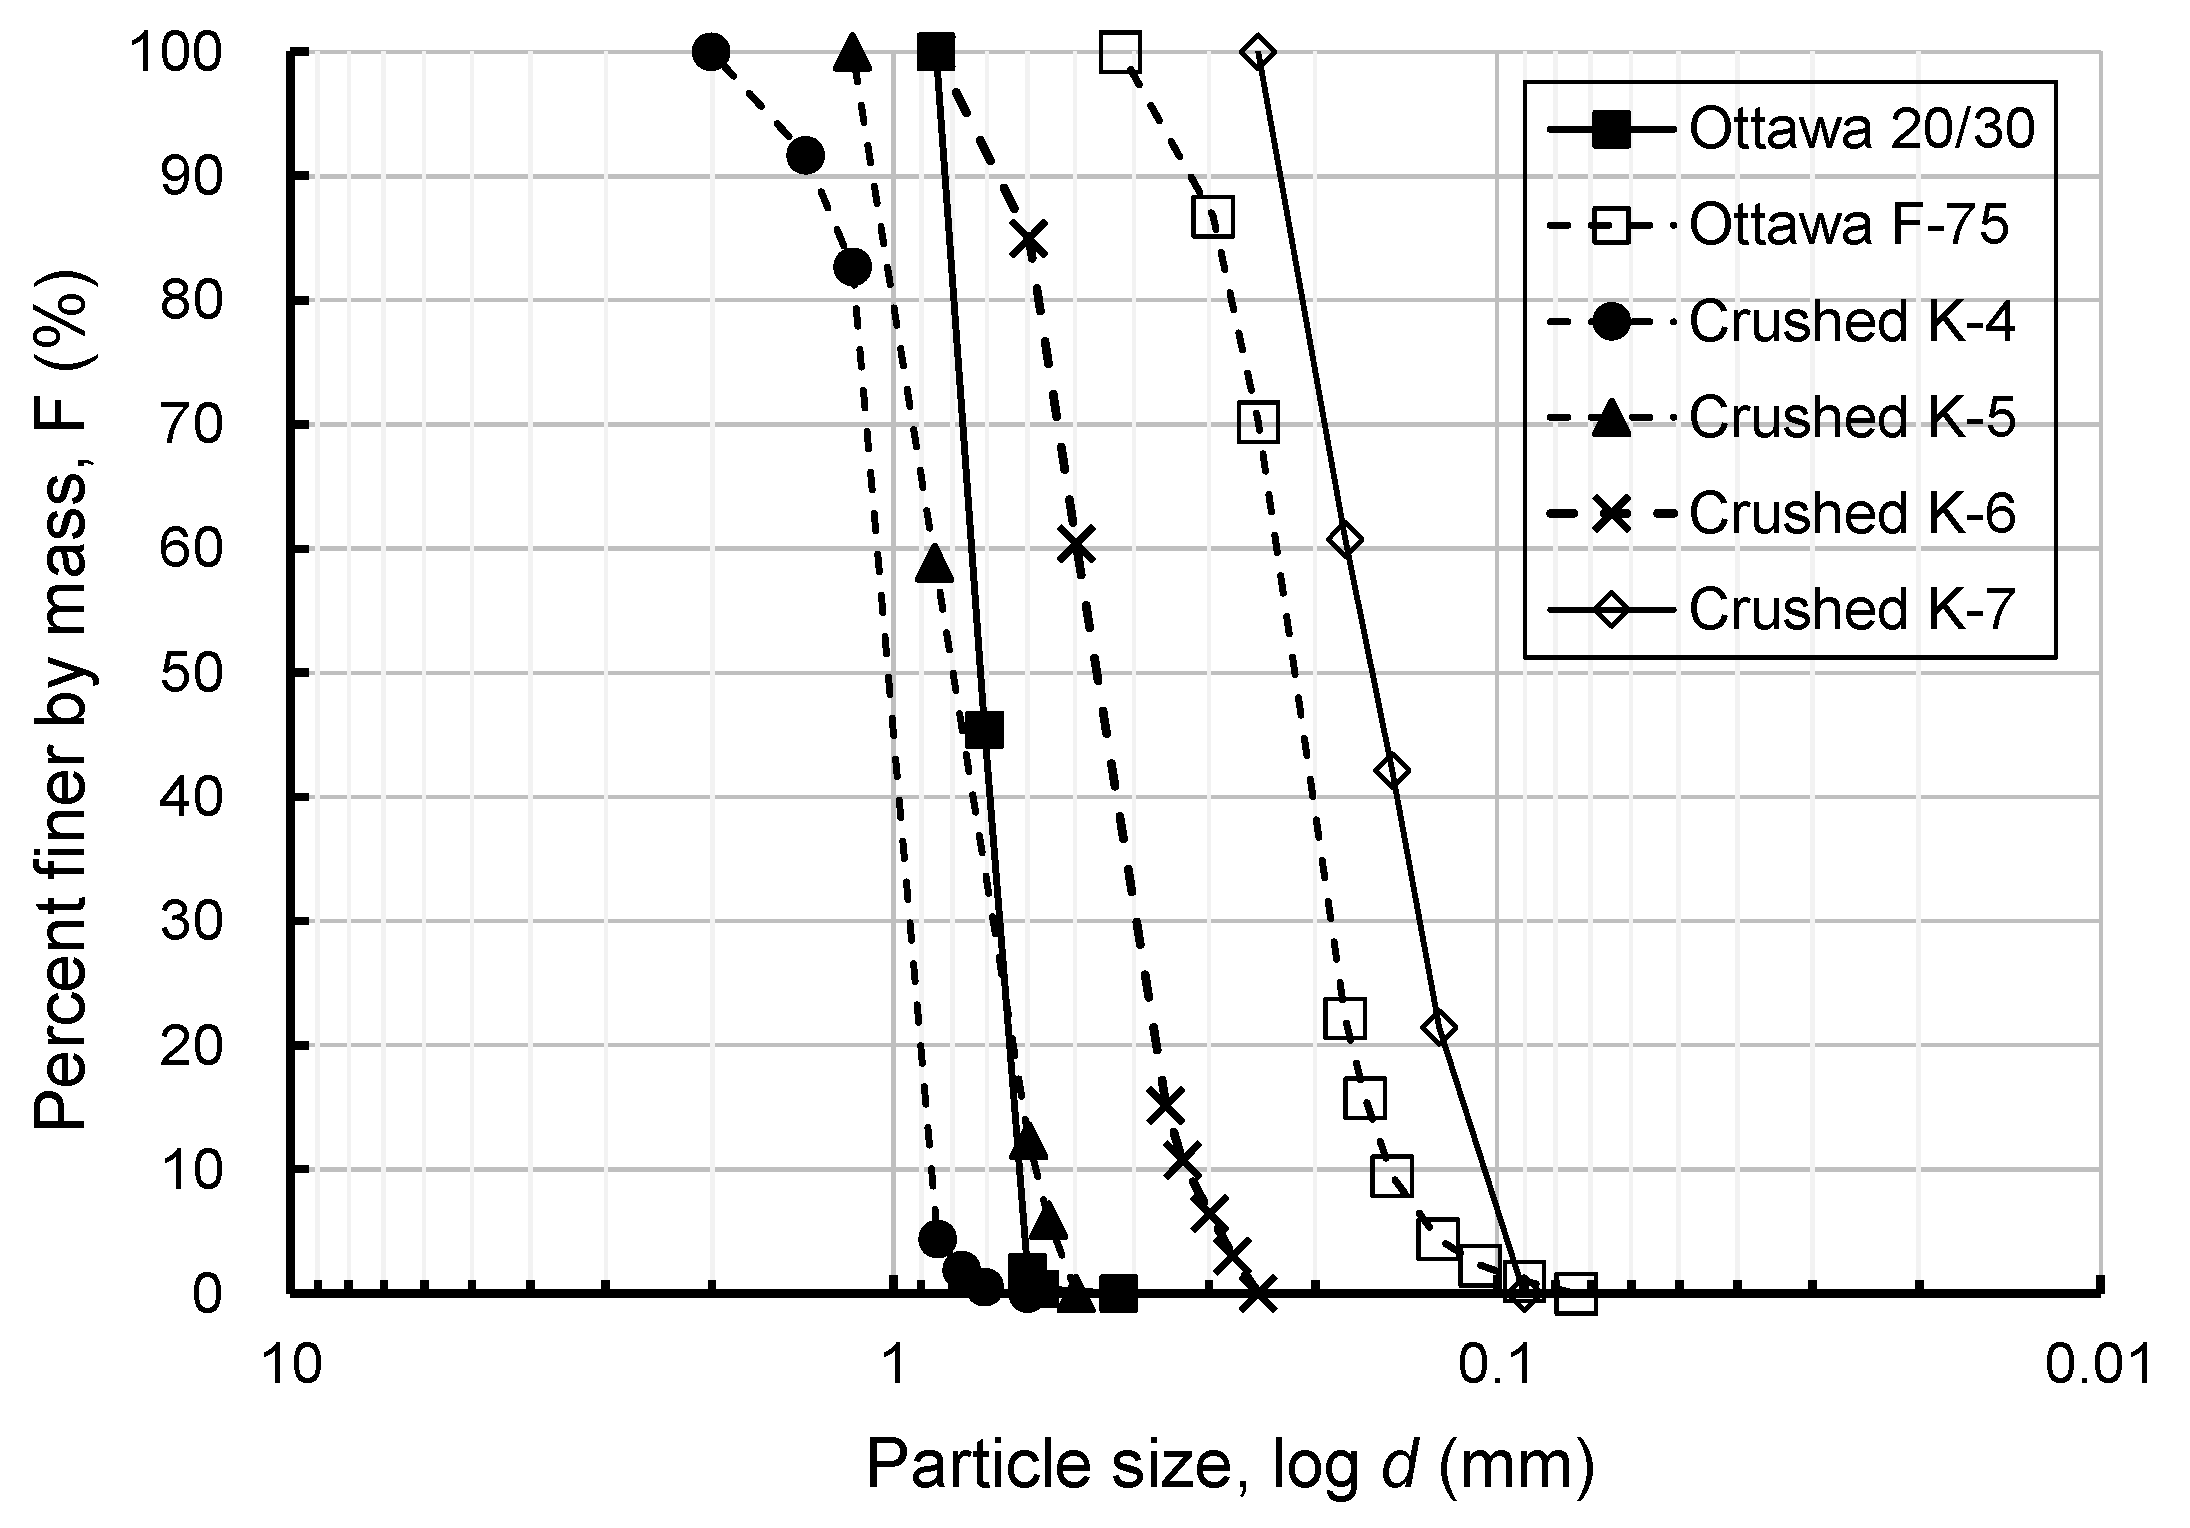
3. Effective Particle Diameters for Different Soils

Considering the large variability of the non-uniformity coefficient and characteristic particle size distribution (PSD) parameters of non-uniform soils, the effective particle size of both widely graded PSDs and gap-graded PSDs have been analyzed in the following section:

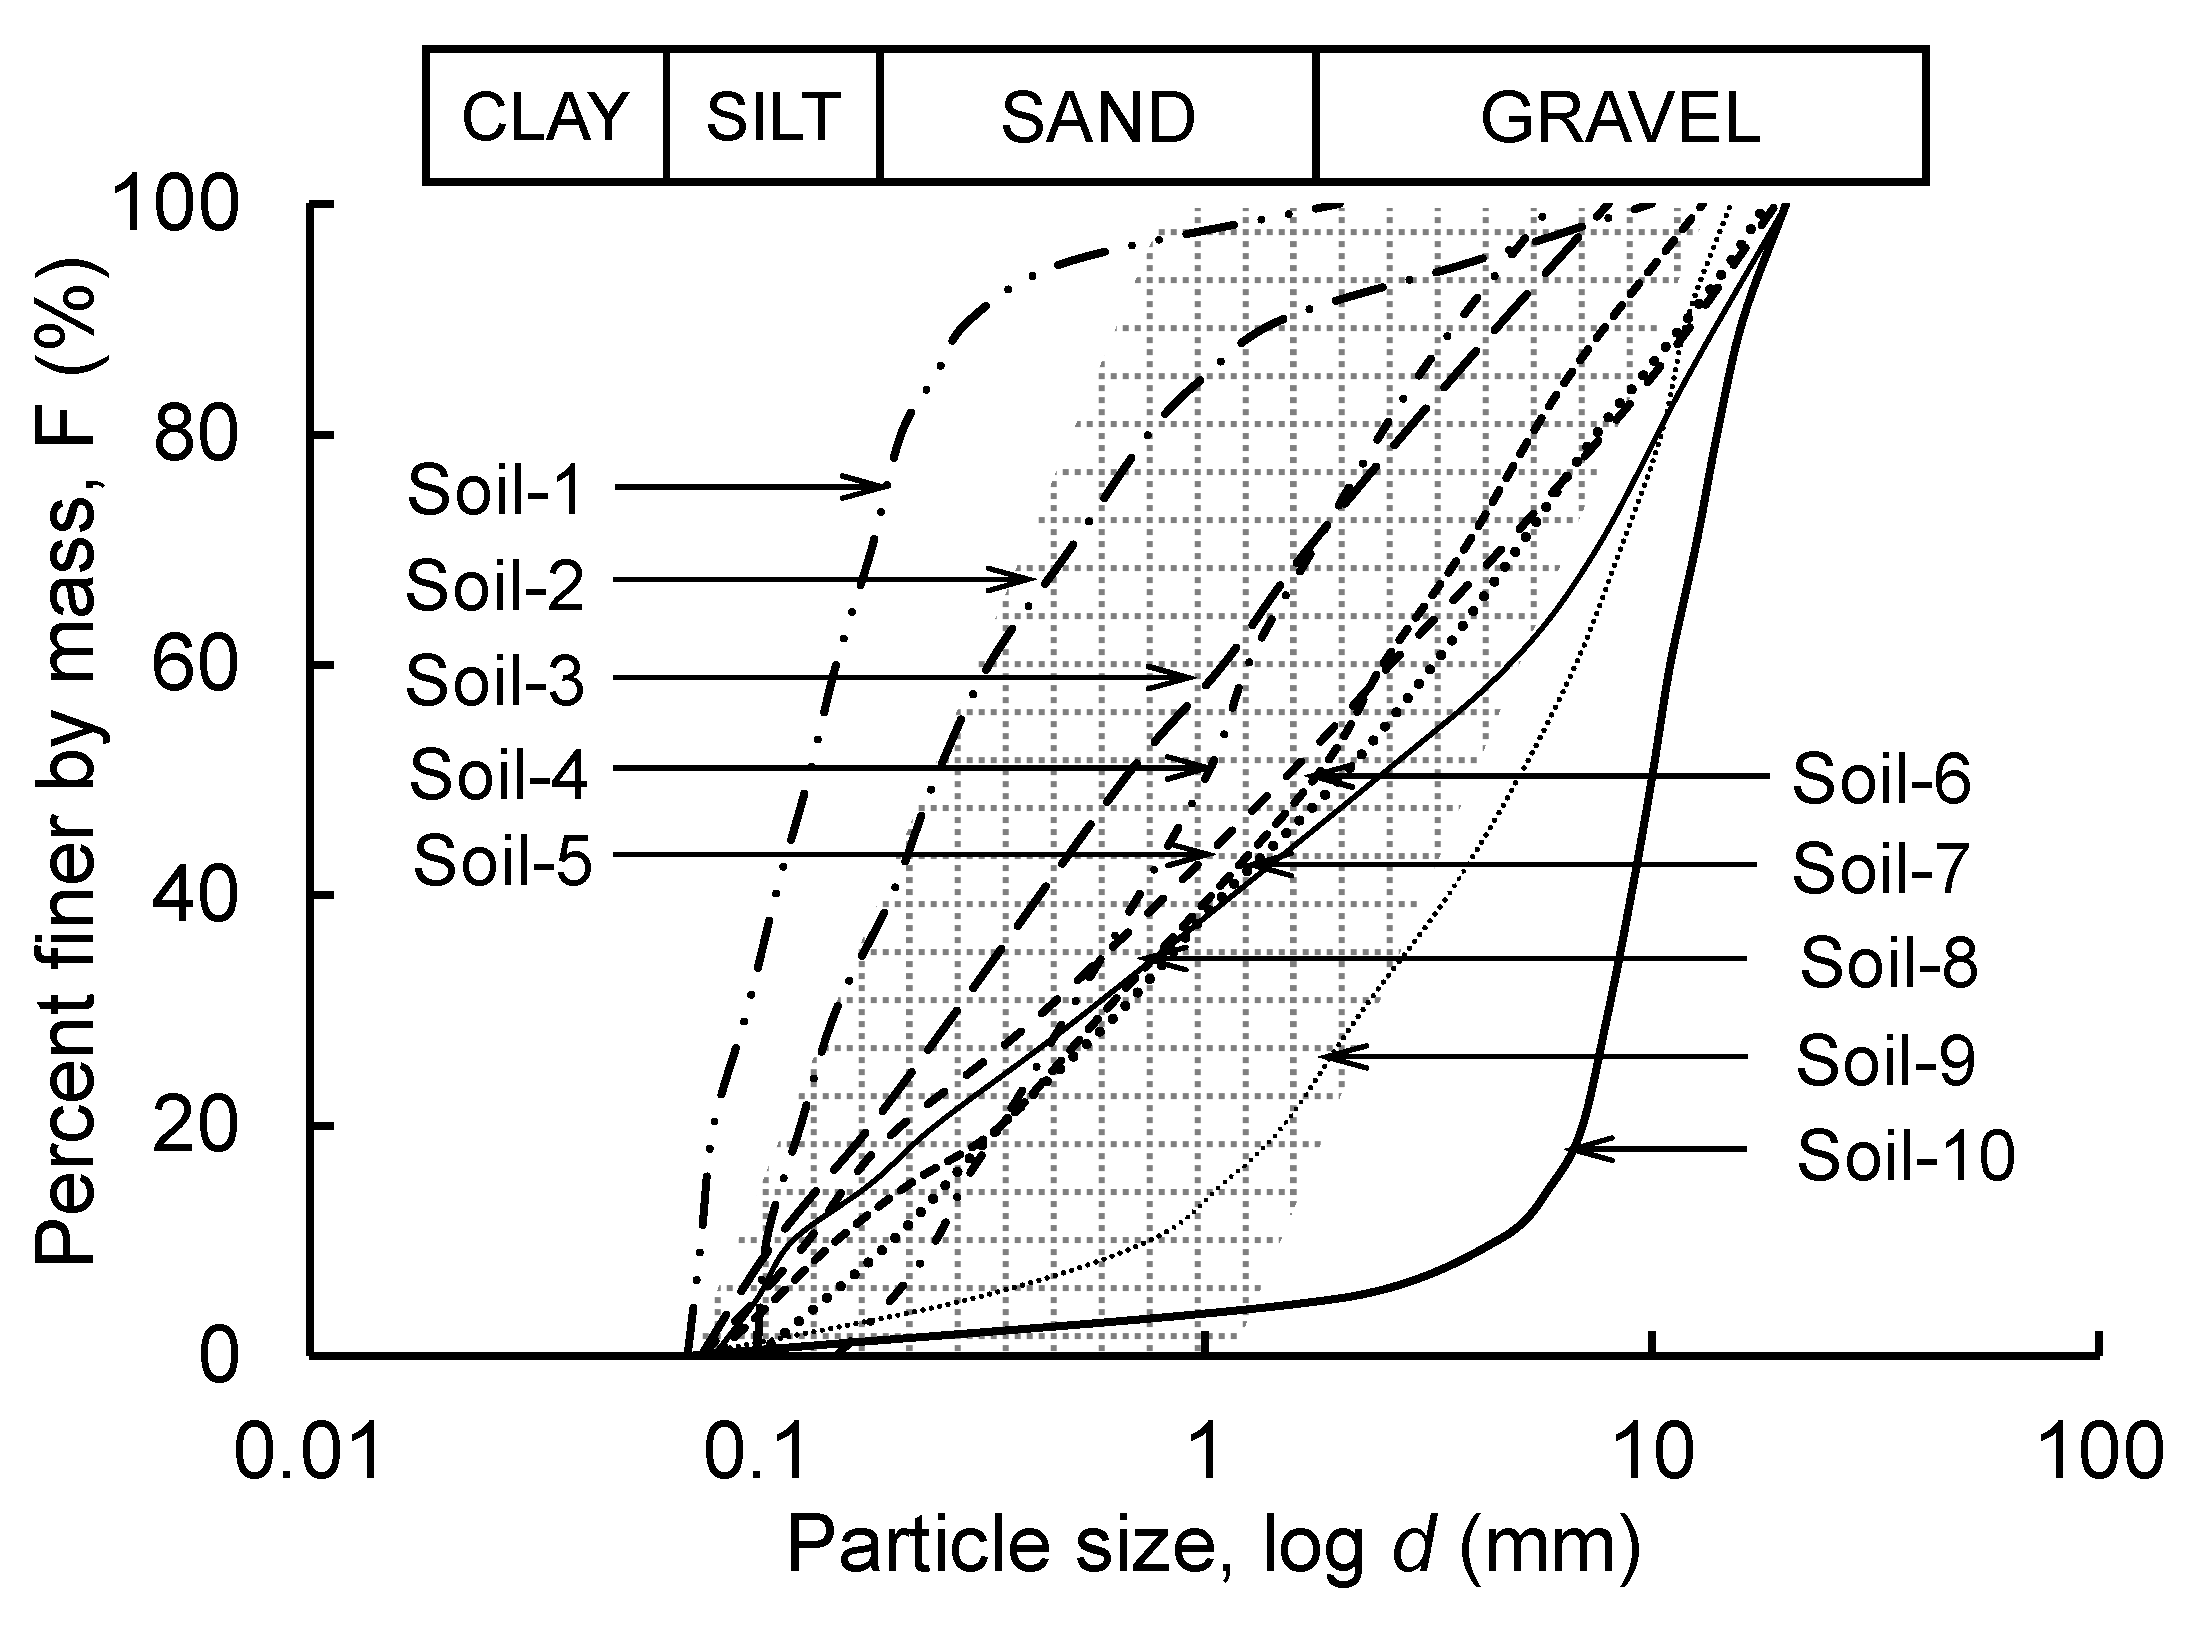
3.1. Widely Graded Soils

As Figure 3 shows, a total of ten widely graded PSDs from Israr and Zhang [16] were selected for analysis, and consist of various proportions of clay, silt, sand, and gravel. The conventional grading parameters, such as D10, D50, and Cu, were used for the analysis in this paper.
Figure 4 presents the relative deviation data for 10 soils shown previously in Figure 3, whereby two characteristic particle sizes D10 (Hazen’s effective particle size) and D50 (mean particle size on PSD curve) were plotted against their uniformity coefficients.
Apparently, there is no obvious correlation observed between either of the characteristic particle sizes and the uniformity coefficient. However, with the increase in Cu values of soils, a larger relative deviation is apparent in D50 values than D10; thus, the latter seems to be a relatively more reasonable option to represent uniform soils bearing low uniformity coefficients. Nevertheless, the relative deviation increases proportionally with the width of the PSD curve, thus indicating that neither of these sizes would effectively represent the statistical distribution of a large number of particles in a wider PSD curve. It is noteworthy that the particles finer than D10 and those coarser than D50 do not significantly influence the flow through porous media [43]. Thus, there may exist a corresponding particle size between D10 and D50 that can effectively represent and characterize both non-uniform PSD curves and can be chosen as an optimum effective particle diameter.
Figure 5 shows effective particle diameters computed from different existing methods, including the currently proposed approach in Equation (4), and plotted against the uniformity coefficients of soils shown previously in Figure 3. Notably, the range between D10 and D50 is marked with a blue area for the reader’s convenience. The column height is the grading entropy-based effective particle diameter, while other effective particle diameters are marked with different markers. As shown, the grading entropy-based effective particle diameters are all located in the middle of the blue area between D10 and D50. A total of three effective particle diameters computed from the method of Carrier [8] were plotted out of the blue region, whereas the rest were plotted inside but closer to the D10 size. This shows that Carrier’s method exhibits a large variability and cannot reasonably represent the widely graded PSD curves. Similarly, all values calculated from Fedorenko’s model were plotted in the lower half of the blue region but closer to D10. Notably, the difference between Fedorenko’s effective particle diameter and D10 gradually increases with the increase in Cu, indicating that Fedorenko’s effective particle diameter can only represent the PSD curve within a certain grading width. Nevertheless, Kozeny’s effective particle diameter calculation method lacks a description of the discretization scheme and the size of the interval class. Therefore, the calculated effective particle diameters obtained through different size intervals vary significantly, while the size interval is not specified in the literature [39]. For brevity, Figure 5 also shows the Kozeny’s effective particle diameter computed with different interval sizes, where interval sizes of 2 mm and 0.01 mm are marked with Kozeny-2 and Kozeny-0.01, respectively. The value of Kozeny’s effective particle diameter with a large interval size (e.g., 2 mm) is too small, whereas that with a small interval size (e.g., 0.01 mm) is close to the value of the entropy-based effective particle diameter, with an exception (see soil with Cu = 2.4).
Figure 6 presents the values of Kozeny’s effective particle diameters computed for the same 10 PSD curves shown previously in Figure 3 using different class interval sizes. As shown, the calculated values of the Kozeny’s effective particle diameters decrease with the increase in the discretized interval size, thus indicating that the interval size has a great influence on the value of Kozeny’s effective particle diameter. In general, the value of Kozeny’s effective particle diameter has large variability when its interval size is large, which cannot represent the grading information of a PSD curve with reasonable confidence. Nonetheless, it can effectively represent the information of the PSD of soil when its interval size is small enough that it would consequently increase the computational costs by manifolds. Furthermore, there is the same problem of Carrier’s effective particle diameter in the discretization of the interval class.
As Figure 7 shows, both Kozeny’s and Carrier’s methods are greatly affected by the class interval size. For instance, with the increase in interval size, the value of Kozeny’s effective diameter decreases gradually. This indicates that some grading information could not be extracted due to larger interval classes, thus resulting in reduced accuracy. Similarly, Carrier’s effective diameter initially increases and then decreases with the increase in interval size. Likewise, Feorenko’s method obtains relatively consistent values of effective diameter sizes; however, this method is limited to relying on soil’s Cu values, which do not apply to gap-graded soils. However, the values of grading entropy-based effective particle diameter are not affected by the interval size and soil’s Cu values, owing to its abstract interval system, which can transverse all of the grading size ranges to comprehensively extract and consider grading information. Nevertheless, the values of entropy-based effective particle diameter are stably located in the region between D10 and D50, which is more reasonable than other methods.

3.2. Gap-Graded Soils

Gap-graded soils exhibit a markedly higher potential of internal instability due to the absence of certain particle sizes in their PSD curves, which distinguishes them from other soils in terms of geo-mechanical and hydraulic properties [3,16,44]. It will induce large computational errors when some characteristic particle sizes and information, such as D10, D50, and Cu, are used to delineate hydraulic properties of gap-graded soils. For instance, two gap-graded PSDs (Gap30, Gap50) and one continuous PSD (Con100) were considered for analysis in this study (Figure 8). Notably, all three PSD curves have the same D50, but different grading shapes. It is obvious that there will be a large error when using D50 as a single characteristic diameter to deduce hydraulic conductivity or to assess the potential for seepage failure. In addition, continuous PSD Con100 and gap-graded PSD Gap50 have the same value of D10; therefore, should Hazen’s approach be used to mimic the hydraulic conductivity of these two graded soils, the same value would be returned. This would not be the case when hydraulic conductivity is determined through a laboratory experiment.
In this study, six gap-graded soils from Andrianatrehina et al. [45] and Li [46] were selected for determining their effective particle diameter using existing and proposed models. Figure 9 shows that the median particle size (D50) of gap-graded soils increases exponentially with Cu; however, no obvious correlation was observed with the gap ratio Gr (= coarser particle size of the gap/finer particle size of the gap). In addition, the values of other effective particle diameter methods do not have any obvious regularity with both Cu and Gr values, which is consistent with the results of widely graded soils discussed in the previous section. Apparently, values of effective diameter from all four methods (i.e., Kozeny, Carrier, Fedorenko, and grading entropy) are plotted inside the region between D10 and D50 (see Figure 9a).
However, a closer look at this plot in Figure 9b shows that the values of both the Carrier and Fedorenko plot closer to D10, whereas that of Kozeny is higher than both D10 and D50. This may be attributed to the fact that the discretized interval sizes of Carrier and Kozeny are 2 mm and 0.01 mm, respectively. the larger the interval size, the lesser the grading information extracted, thus resulting in smaller values from Carrier’s method and relatively higher values from Kozeny’s method. Similarly, Fedorenko’s method depends on Cu, which may be significantly affected by the width of the gap in gap-graded soils, thereby causing undesirably larger errors in computations. Not surprisingly, the results of the current method are closer to those from Kozeny’s method due to an enhanced accuracy of up to a 0.01 mm interval size, which shows that the current method may also be used for gap-graded soils with enhanced confidence.

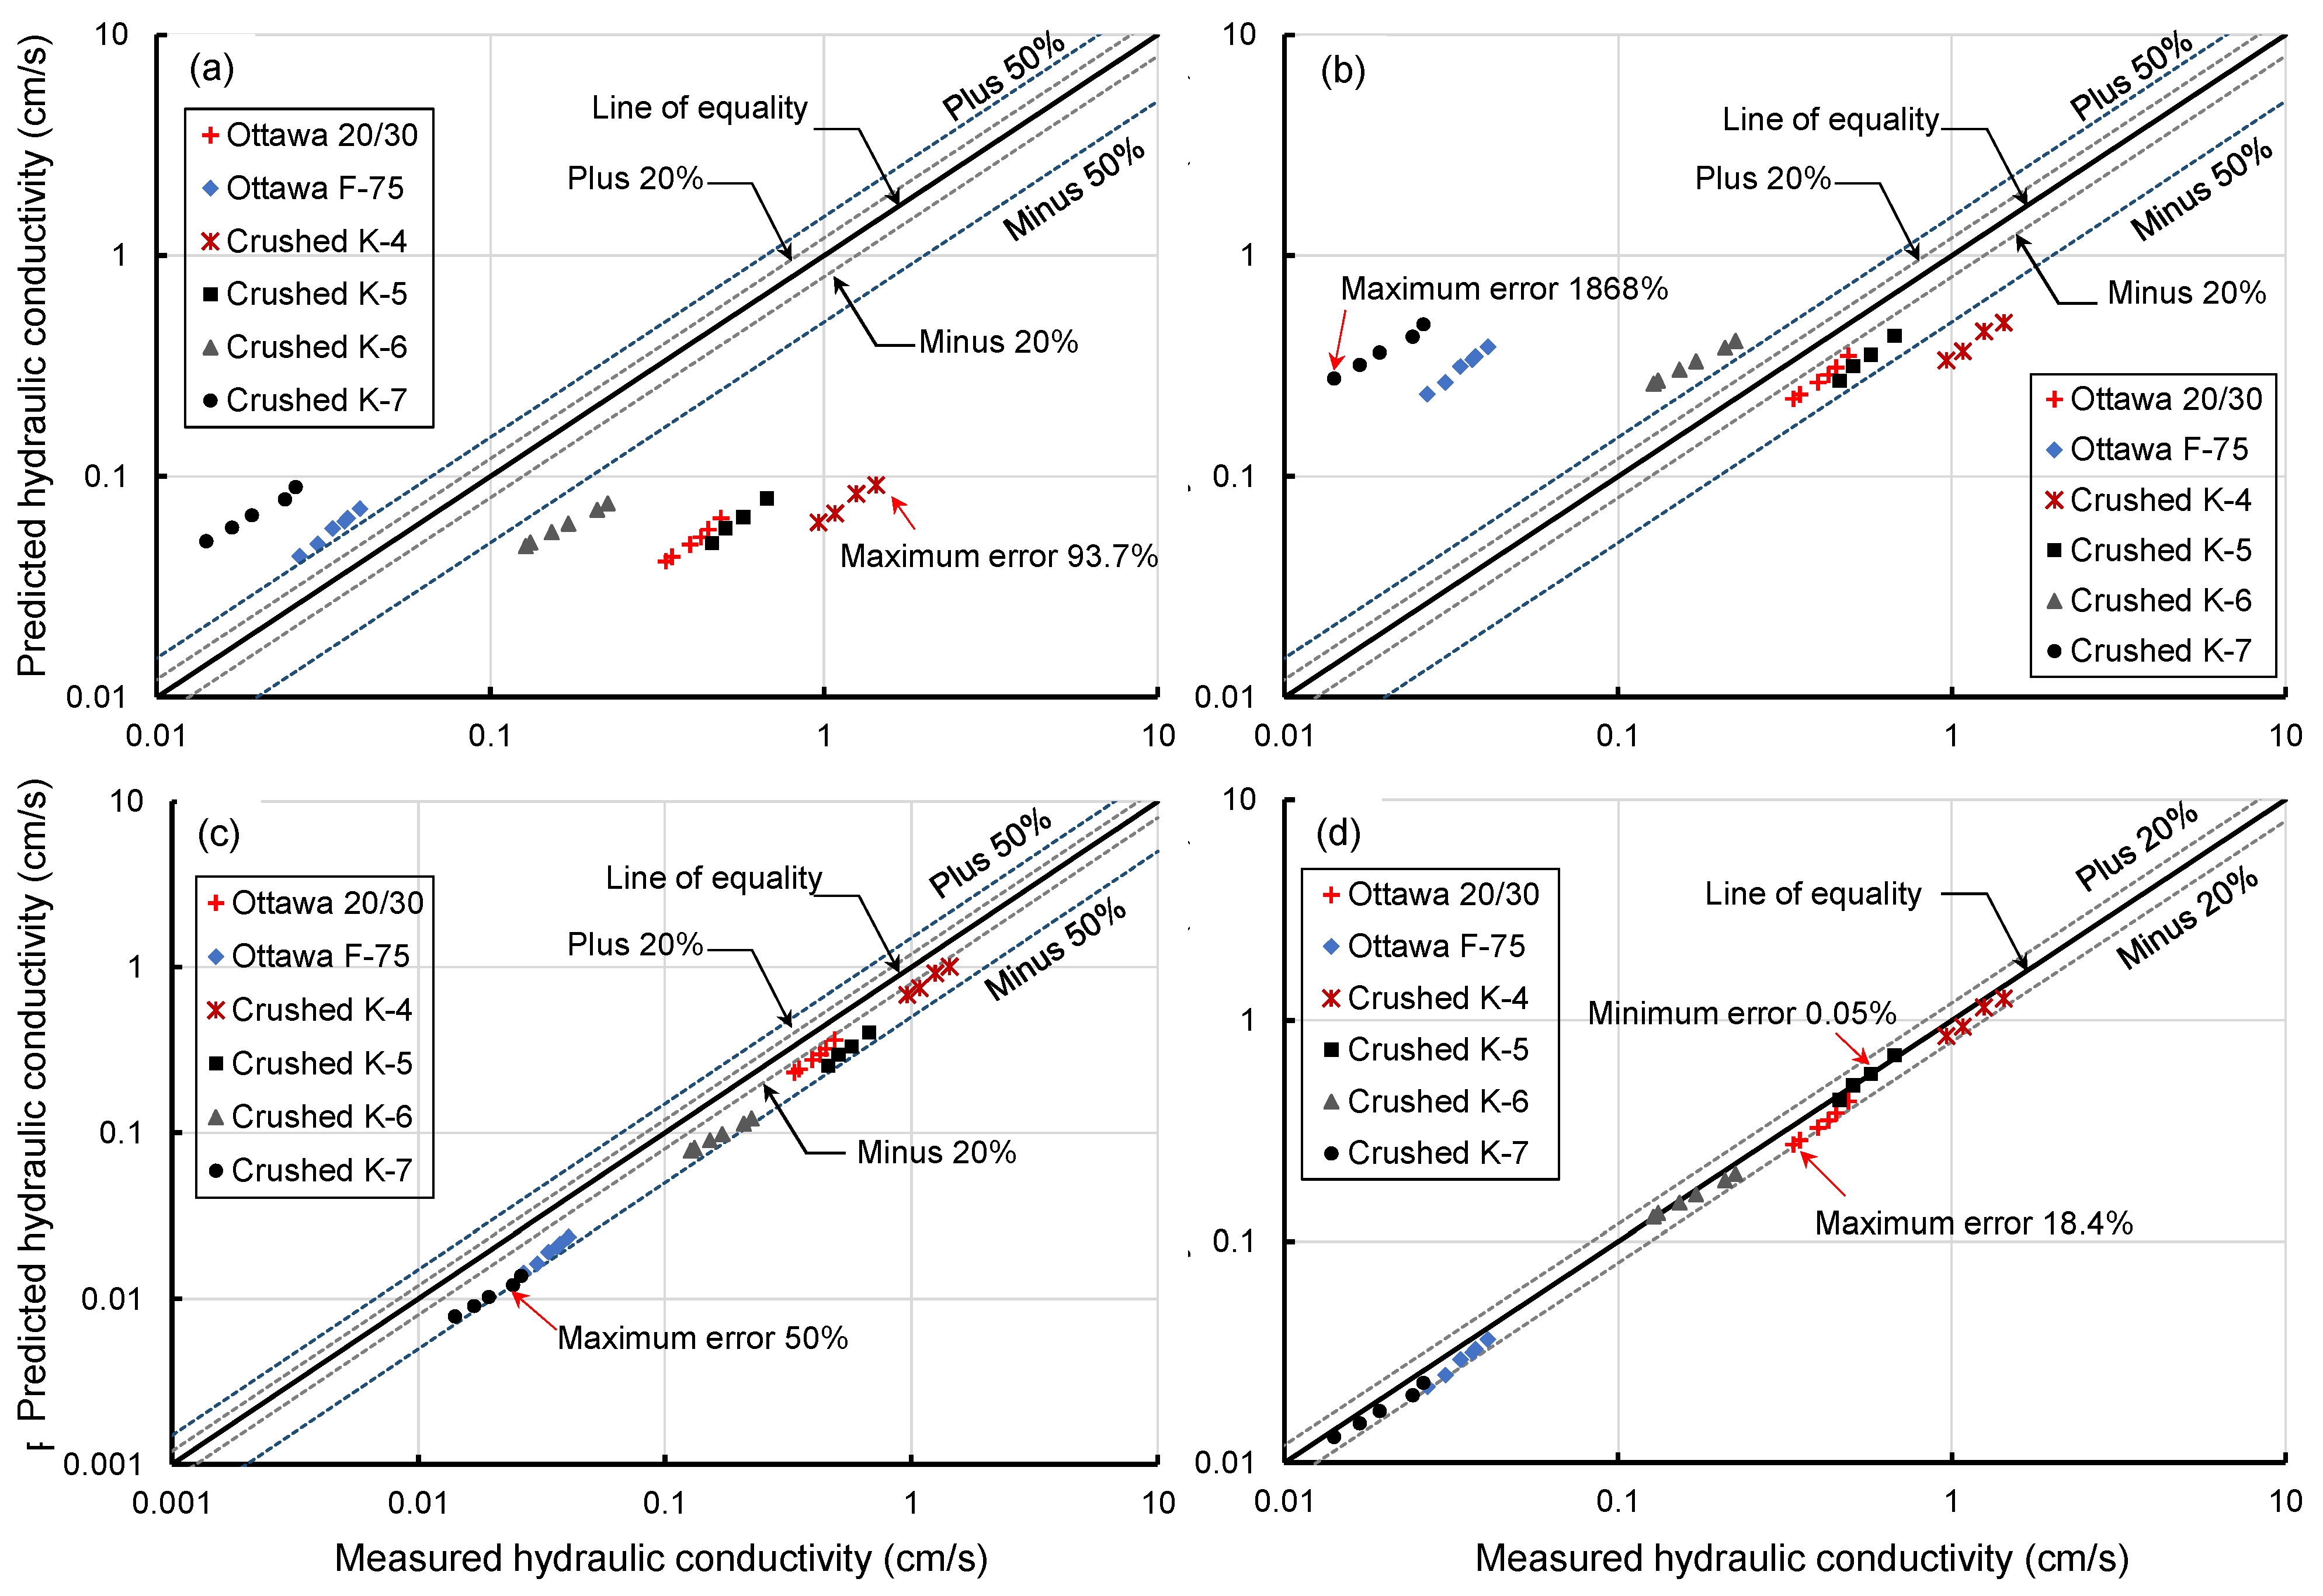
4. Implication of Proposed Model into K-C Formula

4.1. Modified K-C Formula Based on Grading Entropy Effective Diameter

The K-C formula is a semi empirical model for estimating the saturated hydraulic conductivity of granular soils, and is given by [8,47]:
k = ( γ μ ) ( 1 C K C ) ( 1 S 0 2 ) e 3 1 + e
where γ is the unit weight of liquid; μ is the dynamic viscosity of liquid;   C K C is Kozeny–Carman’s empirical coefficient [8]; S 0 is the specific surface area per unit volume of soil particles; e is the void ratio. For uniform sphere particles, C K C = 4.8 ± 0.3, whereas, in other conditions, C K C is equal to 5. The calculation of the specific surface area S 0 is very important for the K-C formula. This study adopted the method of Chapuis and Aubertin [48], which assumes that the specific surface area per unit volume of approximately spherical and cubical soil particles [8,39] is:
S 0 = 6 / D E
Substituting Equation (7) into (6) yields:
k = 1 36 ( γ μ ) ( 1 C K C ) D E 2 e 3 1 + e
Notably, the above formula does not take the particle shape factor into consideration. Therefore, when considering the influence of the shape factor on k , Equation (7) can take the following form:
S 0 = S F / D E
where S F is the shape coefficient, where a different shape has a different S F value. The S F value is suggested as: spherical, S F = 6.0; rounded, S F   = 6.1; worn, S F   = 6.4; sharp, S F   = 7.4; angular, S F   = 7.7. Now, substituting Equation (9) into (8), the K-C formula modified based on grading entropy and the particle shape can be given by:
k = ( γ μ ) ( 1 S F 2 C K C ) D E 2 e 3 1 + e

4.2. Determination of Saturated Hydraulic Conductivity and Comparisons

Figure 10 shows that six soil PSD curves were used in this study for determining their saturated hydraulic conductivity using the K-C formula with effective particle diameters from four different methods, including the proposed approach. Adopted from Choo et al. [49], the test parameters, including hydraulic conductivity results, could be used for verification. For completeness, ASTM D2434 was adopted to deduce the hydraulic conductivity of soils at room temperature to minimize losses in soil properties. The flow was introduced against the gravity under constant head conditions, while the head drop was temporally monitored through a series of manometers. The hydraulic conductivity was quantified as the slopes of flow velocity versus hydraulic gradient curves (i.e., Darcy’s law) [49].
As Figure 11 shows, the calculated values of hydraulic conductivity using Kozeny’s effective particle diameter have a relatively larger error for all six soils (above 50%), while some individual errors are even closer to 100%, as shown in Figure 11a. The errors between the measured value and predicted values using Carrier’s method are also large, and the maximum error even exceeds 200%, although there are two errors within 20% to 50%, as shown in Figure 11b. These results may be because both Kozeny’s and Carrier’s effective diameter have a relatively higher error caused by their uncertain discretized interval sizes when used for calculating the hydraulic conductivity of soils. Likewise, the errors between predicted values from Fedorenko’s method and the measured values remain between 20% and 50% (see Figure 11c). Fedorenko’s effective particle diameter can be used to calculate the hydraulic conductivity for uniform soils; however, caution must be exercised when used for widely graded and gap-graded soils. It can be seen from Figure 11d that the errors of the K-C formula based on the effective particle diameter proposed in this study are much smaller (i.e., under 20%), such that the maximum error is 18.4%, whereas the minimum error is only 0.05%. This clearly establishes that the prediction accuracy of the proposed method is markedly higher than others.
For further verification, a larger experimental dataset of 30 laboratory results of hydraulic conductivity tests were adopted from Feng et al. [50]. The proposed entropy-based effective diameter was incorporated into the K-C formula and the hydraulic conductivity was estimated, which was then plotted against the experimental results, as shown in Figure 12. It is noteworthy that there are only three points plotted beyond the ±50% error line from the line of equality. For additional comparison, predictions from other methods that exceed a ±50% error have been summarized elsewhere by Feng et al. [50].
For brevity, out of 30 predictions, Hazen’s [8] model results in 12 plotted beyond the ±50% error line, 9 for Shepherd’s model, 7 for Kozeny–Carman’s [8] model, 9 for Chapuis’ model [1], and 6 for Feng et al.’s [50] model. Not surprisingly, the prediction accuracy of the hydraulic conductivity for the current model within the ±50% error range reaches 90%, which is higher than all five methods. Through further comparison, it was found that 17 out of the 30 calculated results of the current method are within the ± 20% error line, which means that the prediction accuracy within a 20% error range of this method exceeds 56%, which further shows that the current K-C formula has a higher prediction accuracy.
Given that the proposed effective particle diameter based on grading entropy could reasonably consider the grading information and particle shape of the soil, it could be conveniently integrated into existing K-C formula for estimating the hydraulic conductivity of a larger dataset of natural soils, thus showing a higher prediction accuracy than several well-accepted existing criteria tested in this study. While the authors still believe that the standard laboratory procedures remain the most reliable approaches, the proposed model may be conveniently adopted for only a prompt and preliminary measurement of the hydraulic conductivity of a soil.

5. Conclusions

Based on the discretization method of an abstract interval system of grading entropy, a novel approach for determining effective particle diameter was proposed. It was then compared with the existing effective diameter methods, such as Kozeny’s, Carrier’s, and Fedorenko’s methods. In addition, the grading entropy-based effective particle diameter was integrated into Kozeny–Carman’s formula for predicting the saturated hydraulic conductivity of soils. The specific findings from this study are as follows.
Although both Kozeny’s and Carrier’s effective particle diameters could be applied to non-uniform soils with an acceptable accuracy, they are sensitive to the discretized interval size, as the calculation error will become higher with the increase in interval size. While effective particle sizes from Hazen (D10), Fedorenko (depending on C u ), and the median diameter (D50) are easy to compute, they cannot reasonably represent the grading information of widely and gap-graded soils, thus resulting in large errors. In contrast, the effective particle size proposed here is based on the grading entropy theory, which can more accurately represent the grading information of a soil’s PSD than others.
The proposed entropy-based effective particle size was successfully implicated into the K-C model for determining the saturated hydraulic conductivity of granular soils. This proposed implication could be comprehensively demonstrated through the analysis of a large dataset from published studies, thereby showing above 90% and 56% accuracies with standard errors of up to 50% and 20%, respectively. Nevertheless, the proposed grading entropy-based effective particle size is expected to have broader implications in other geo-hydraulic problems, such as internal erosion, where the authors envisage extending this work further.

Author Contributions

Conceptualization, G.Z. and J.I.; methodology, G.Z.; software, J.I.; validation, J.I., W.M., Y.Y., and H.W.; formal analysis, G.Z.; investigation, J.I.; resources, H.W., K.R.; data curation, W.M.; writing—original draft preparation, J.I.; writing—review and editing, G.Z. and H.W.; visualization, W.M.; supervision, J.I.; project administration, G.Z.; funding acquisition, G.Z., W.M., Y.Y., K.R., and H.W. All authors have read and agreed to the published version of the manuscript.

Funding

This research was funded by National Natural Science Foundation of China (No. 41962016 and No. 51768059).

Institutional Review Board Statement

Not Applicable.

Informed Consent Statement

Not Applicable.

Data Availability Statement

All relevant supplementary material has already been reported in the main manuscript in the form of data in two tables and governing equations in both main manuscript and an Appendix A.

Acknowledgments

Financial supports from National Natural Science Foundation of China (No. 41962016 and No. 51768059) are appreciated. The corresponding author acknowledges financial support of Helan Mountain research scholarship program.

Conflicts of Interest

The authors declare no conflict of interest. The funders had no role in the design of the study; in the collection, analyses, or interpretation of data; in the writing of the manuscript, or in the decision to publish the results.

Appendix A. Review of Existing Methods of Effective Diameter Computations

A particle size distribution (PSD) curve is a group of data with continuous characteristics, wherein data are discretized into different groups. However, different discretization methods may yield different analysis results. Notably, the existing data discretization methods mainly include the equal width method [50], equal frequency method [51,52], entropy-based discretization method [53,54,55], clustering-based method [56], etc. Full et al. [57] pointed out that a more rigorous approach for analyzing a PSD curve could be through its discretization using interval classes. Nevertheless, discretization using variable size interval classes can make up for the defect of equal size discretization, such as sparse data. Not surprisingly, the existing approaches adopt characteristic methods based on discrete data with equal size intervals, which may not capture the grading information fully for the widely and gap-graded PSD curves.
Hazen [28] pioneered the empirical determination of saturated hydraulic conductivity based on the soil’s particle size corresponding to a 10 percent finer by mass on the PSD curve (D10). Assuming that the flow through soil is analogous to the pipe flow, it was proposed that the finer fraction of a soil bears a close relationship with the pore sizes governing the flow, and hence hydraulic conductivity. Consequently, the particle size D10 was presented as being an approximate representative of soil’s finer fraction and thus the hydraulic conductivity, while the contributing physical characteristics of soil was given by an empirical shape factor C, which varies with the soil type. For instance, it varies between 120 to 150 and 40 to 80 for well-graded coarse sand and very fine sand, respectively. Later, Fedorenko proposed an effective particle size based on Hazen’s D10 and soil’s uniformity coefficient, given by Equation (A1):
D F = 1 / 2 ( D 10 + D 60 ) D 10 / D 60
Kozeny [40] discretized the PSD curve into several uniform-sized intervals given by the number n, with an average diameter of the i-th interval given by D i and the mass percentage of this interval given by Δ S i . Assuming that all particles have same surface area and volume ratio:
N π D h 2 N π D h 3 / 6 = G i γ s 6 D i G i γ s = Δ S i 6 D i Δ S i
D h = 1 Δ S i D i
where D h is the effective particle diameter, N is the number of spherical particles in the soil sample, γ s is the unit weight of soil solids, G i is the specific gravity of soil, and D i is the mean particle size for adjacent intervals:
D i = 3 1 D i 1 + 2 D i 1 + D i 2 + 1 D i 2
Bear [37] proposed an effective particle diameter based on the harmonic mean value of select particle sizes from the soil’s PSD curve:
D eff = m i / ( m i / D i )
Subsequently, Koltermann and Gorelick [38] observed that the harmonic mean value only bears a good relationship with the finer fraction of a PSD rather than the coarser fraction. For instance, it may not represent the PSD curves with less fine contents rationally. However, the geometric mean bears a stronger correlation with the PSD curves that have larger coarse contents. Similarly, Vienken and Dietrich [41] presented the following formula for the effective particle size:
d e = 0.1 3 Δ g m 2 d m + i = 2 i = n Δ g i d i
where Δ g m is the weight of the finer fraction, Δ g i is the weight of the i-th class interval, d m is the diameter of the last fraction, 1 d i = 1 2 × ( 1 d u + 1 d l ) , d u is the upper fraction limit, and d l   is the lower fraction limit.
More recently, Carrier [8] proposed an effective particle diameter for non-uniform spherical particles from soil’s PSD as follows:
D eff = 100 % / ( f i / D ave , i )
where f i is the mass percentage (%) of particles between adjacent interval sizes; D ave , i = D l i 0.5 · D s i 0.5 , D l i , and D s i is the larger and smaller fraction size in the i-th interval, and D ave , i becomes the geometric average particle size of the i-th interval. Notably, Carrier’s calculation procedure is like that presented by Kozney, with the only difference being in the choice of the size of calculation intervals. In essence, considering the PSD curve as log-linear in each interval size range, Carrier [8] corrected the calculation of the geometric average particle size of each interval as follows [46,48]:
D ave , i = D l i 0.404 · D s i 0.595

References

  1. Chapuis, R.P. Predicting the saturated hydraulic conductivity of sand and gravel using effective diameter and void ratio. Can. Geotech. J. 2004, 41, 787–795. [Google Scholar] [CrossRef]
  2. Dyka, I.; Srokosz, P.E.; Bujko, M. Influence of grain size distribution on dynamic shear modulus of sands. Open Eng. 2017, 7, 317–329. [Google Scholar] [CrossRef]
  3. Kenney, T.; Lau, D. Internal stability of granular filters. Can. Geotech. J. 1985, 22, 215–225. [Google Scholar] [CrossRef]
  4. Tong, C.-X.; Burton, G.J.; Zhang, S.; Sheng, D. A simple particle-size distribution model for granular materials. Can. Geotech. J. 2018, 55, 246–257. [Google Scholar] [CrossRef]
  5. Tsuda, A.; Henry, F.S.; Butler, J.P. Particle transport and deposition: Basic physics of particle kinetics. Compr. Physiol. 2013, 3, 1437–1471. [Google Scholar] [PubMed]
  6. Seelheim, F. Methoden zur bestimmung der durchlassigkeit des bodens. Z. Anal. Chem. 1880, 19, 387–402. [Google Scholar] [CrossRef]
  7. Hazen, A. Some Physical Properties of Sands and Gravels, with Special Reference to Their Use in Filtration; 24th Annual Report; Massachusetts State Board of Health: Boston, MA, USA, 1892; pp. 539–555. [Google Scholar]
  8. Carrier, W.D. Goodbye, Hazen; Hello, Kozeny-Carman. J. Geotech. Geoenviron. Eng. 2003, 129, 1054–1056. [Google Scholar] [CrossRef]
  9. Chen, H.; Lv, X.; Qiao, Y. Fitting four-modal sedimentary grain-size distribution with gradient descent method. In Proceedings of the 2011 International Conference on Remote Sensing, Environment and Transportation Engineering, Nanjing, China, 24–26 June 2011; IEEE: Piscataway, NJ, USA, 2011; pp. 5987–5990. [Google Scholar]
  10. Wichtmann, T.; Triantafyllidis, T. Influence of the Grain-Size Distribution Curve of Quartz Sand on the Small Strain Shear Modulus Gmax. J. Geotech. Geoenviron. Eng. 2009, 135, 1404–1418. [Google Scholar] [CrossRef]
  11. Burenkova, V. Assessment of suffusion in non-cohesive and graded soils. In Proceedings of the 1st International Conference “Geo-Filters”, Filters in geotechnical and hydraulic engineering, Karlsruhe, Germany, 20–22 October 1992; pp. 357–360. [Google Scholar]
  12. Chapuis, R.P. Similarity of internal stability criteria for granular soils. Can. Geotech. J. 1992, 29, 711–713. [Google Scholar] [CrossRef]
  13. Kezdi, A. Soil Physics: Selected Topics; Elsevier Science: Amsterdam, The Netherlands, 1979. [Google Scholar]
  14. Lőrincz, J. Relationship between grading entropy and dry bulk density of granular soils. Period. Polytech. Civ. Eng. 1990, 34, 255–263. [Google Scholar]
  15. Indraratna, B.; Israr, J.; Rujikiatkamjorn, C. Geometrical method for evaluating the internal instability of granular filters based on constriction size distribution. J. Geotech. Geoenviron. Eng. 2015, 141, 4015045. [Google Scholar] [CrossRef] [Green Version]
  16. Israr, J.; Zhang, G. Geometrical assessment of internal instability potential of granular soils based on grading entropy. Acta Geotech. 2021, 16, 1961–1970. [Google Scholar] [CrossRef]
  17. Lőrincz, J.; Imre, E.; Fityus, S.; Trang, P.Q.; Tarnai, T.; Talata, I.; Singh, V.P. The grading entropy-based criteria for structural stability of granular materials and filters. Entropy 2015, 17, 2781–2811. [Google Scholar] [CrossRef]
  18. Hateren, J.A.; Prins, M.A.; van Balen, R.T. On the genetically meaningful decomposition of grain-size distributions: A comparison of different end-member modelling algorithms. Sediment. Geol. 2018, 375, 49–71. [Google Scholar] [CrossRef]
  19. Varga, G.; Újvári, G.; Kovács, J. Interpretation of sedimentary (sub) populations extracted from grain size distributions of Central European loess-paleosol series. Quat. Int. 2019, 502, 60–70. [Google Scholar] [CrossRef]
  20. Chapuis, R.P.; Saucier, A. Assessing internal erosion with the modal decomposition method for grain size distribution curves. Acta Geotech. 2020, 15, 1595–1605. [Google Scholar] [CrossRef]
  21. Fredlund, M.D.; Fredlund, D.; Wilson, G.W. An equation to represent grain-size distribution. Can. Geotech. J. 2000, 37, 817–827. [Google Scholar] [CrossRef]
  22. Foster, M.; Fell, R. Assessing embankment dam filters that do not satisfy design criteria. J. Geotech. Geoenviron. Eng. 2001, 127, 398–407. [Google Scholar] [CrossRef]
  23. Indraratna, B.; Raut, A.K.; Khabbaz, H. Constriction-based retention criterion for granular filter design. J. Geotech. Geoenviron. Eng. 2007, 133, 266–276. [Google Scholar] [CrossRef]
  24. Khor, C.H.; Woo, H.K. Investigation of crushed rock filters for dam embankment. J. Geotech. Eng. 1989, 115, 399–412. [Google Scholar] [CrossRef]
  25. Lafleur, J. Filter testing of broadly graded cohesionless tills. Can. Geotech. J. 1984, 21, 634–643. [Google Scholar] [CrossRef]
  26. Sherard, J.; Dunnigan, L. Critical filters for impervious soils. J. Geotech. Eng. 1989, 115, 927–947. [Google Scholar] [CrossRef]
  27. Terzaghi, K. Der grundgruch an stauwerken und seine verhutung (The failure of dams by piping and Its prevention). Die Wasserkraft 1922, 17, 445–449. [Google Scholar]
  28. Trani, L.D.O.; Indraratna, B. The use of particle size distribution by surface area method in predicting the saturated hydraulic conductivity of graded granular soils. Géotechnique 2010, 60, 957–962. [Google Scholar] [CrossRef]
  29. Beyer, W. On the determination of hydraulic conductivity of gravels and sands from grain-size distribution. Wasserwirtsch. Wassertech. 1964, 14, 165–169. [Google Scholar]
  30. Harleman, D.R.F.; Melhorn, P.F.; Rumer, R.R. Dispersion-permeability correlation in porous media. J. Hydraul. Div. 1963, 89, 67–85. [Google Scholar] [CrossRef]
  31. Terzaghi, C. Principles of soil mechanics: III—Determination of permeability of clay. Eng. News Rec. 1925, 95, 832–836. [Google Scholar]
  32. Kozeny, J. Ueber kapillare Leitung des Wassers im Boden. Sitzungsber Akad. Wiss. 1927, 136, 271–306. [Google Scholar]
  33. Vukovic, M.; Soro, A. Determination of Hydraulic Conductivity of Porous Media from Grain-Size Composition; Water Resources Publications: Littleton, CO, USA, 1992. [Google Scholar]
  34. Koenders, M.A.; Williams, A.F. Flow equations of particle fluid mixtures. Acta Mech. 1992, 92, 91–116. [Google Scholar] [CrossRef]
  35. Waters, T.J. A study of water infiltration through ASPHALT road surface materials. In Proceedings of the International Symposium on Subdrainage in Roadway Pavements and Subgrades, Granada, Spain, 11–13 November 1998; pp. 311–317. [Google Scholar]
  36. Vardanega, P.J.; Waters, T.J. Analysis of Asphalt Concrete Permeability Data Using Representative Pore Size. J. Mater. Civ. Eng. 2011, 23, 169–176. [Google Scholar] [CrossRef]
  37. Bear, J. Dynamics of Fluids in Porous Media; Dover Publications, Inc.: New York, NY, USA, 1972. [Google Scholar]
  38. Koltermann, C.E.; Gorelick, S.M. Fractional packing model for hydraulic conductivity derived from sediment mixtures. Water Resour. Res. 1995, 31, 3283–3297. [Google Scholar] [CrossRef]
  39. Kovács, G. Seepage Hydraulics; Akadénmiai Kiadó: Budapest, Hungary, 1981. [Google Scholar]
  40. Kozeny, J. Das Wasser im Boden. Grundwasserbewegung. In Hydraulik; Springer: Vienna, Austria, 1953; pp. 380–445. [Google Scholar]
  41. Vienken, T.; Dietrich, P. Field evaluation of methods for determining hydraulic conductivity from grain size data. J. Hydrol. 2011, 400, 58–71. [Google Scholar] [CrossRef]
  42. Lőrincz, J.; Imre, E.; Gálos, M.; Trang, Q.P.; Rajkai, K.; Fityus, S.; Telekes, G. Grading entropy variation due to Soil crushing. Int. J. Geomech. 2005, 5, 311–319. [Google Scholar] [CrossRef]
  43. Zunker, F. Fertilization and soil science. J. Plant Nutr. A 1932, 25. [Google Scholar]
  44. Israr, J. Internal Instability of Granular Filters under Cyclic Loading. Ph.D Thesis, University of Wollongong, Wollongong, Australia, 2016. [Google Scholar]
  45. Andrianatrehina, L.; Souli, H.; Fry, J.-J.; Phan, Q.; Fleureau, J.-M. Internal stability of granular materials in triaxial tests. In Proceedings of the 6th International Conference on Scour and Erosion, France, Paris, 27–31 August 2012. ISSMGE. [Google Scholar]
  46. Li, M. Seepage Induced Instability in Widely Graded Soils. Ph.D. Thesis, University of British Columbia, Vancouver, BC, Canada, 2008. [Google Scholar]
  47. Das, B.M. Advanced Soil Mechanics; Tayor & Francis Group: New York, NY, USA, 2008. [Google Scholar]
  48. Chapuis, R.P.; Aubertin, M. On the use of the Kozeny—Carman equation to predict the hydraulic conductivity of soils. Can. Geotech. J. 2003, 40, 616–627. [Google Scholar] [CrossRef]
  49. Choo, H.; Kim, J.; Lee, W.; Lee, C. Relationship between hydraulic conductivity and formation factor of coarse-grained soils as a function of particle size. J. Appl. Geophys. 2016, 127, 91–101. [Google Scholar] [CrossRef]
  50. Feng, S.; Vardanega, P.J.; Ibraim, E.; Widyatmoko, I.; Ojum, C.; O’Kelly, B.C.; Nogal, M. Permeability assessment of some granular mixtures. Géotechnique 2019, 70, 845–847. [Google Scholar] [CrossRef]
  51. Saleh, A.; Puspita, K.; Sanjaya, A. Implementation of equal width interval discretization on smarter method for selecting computer laboratory assistant. In Proceedings of the 2018 6th International Conference on Cyber and IT Service Management (CITSM), Parapat, Indonesia, 7–9 August 2018; pp. 1–4. [Google Scholar]
  52. Hacibeyoglu, M.; Ibrahim, M.H. EF_Unique: An improved version of unsupervised equal frequency discretization method. Arab. J. Sci. Eng. 2018, 43, 7695–7704. [Google Scholar] [CrossRef]
  53. McDougall, J.R.; Imre, E.; Barreto, D.; Kelly, D. Volumetric consequences of particle loss by grading entropy. Géotechnique 2013, 63, 262–266. [Google Scholar] [CrossRef]
  54. Imre, E.; Lőrincz, J.; Szendefy, J.; Trang, P.Q.; Nagy, L.; Singh, V.P.; Fityus, S. Case studies and benchmark examples for the use of grading entropy in geotechnics. Entropy 2012, 14, 1079–1102. [Google Scholar] [CrossRef]
  55. Singh, V.P. Entropy Theory in Hydraulic Engineering: An Introduction; ASCE Press: Reston, VA, USA; ProQuest Ebook Central: Ann Arbor, MI, USA, 2014. [Google Scholar]
  56. Henry, D.; Dymnicki, A.B.; Mohatt, N.; Allen, J.; Kelly, J.G. Clustering methods with qualitative data: A mixed-methods approach for prevention research with small samples. Prev. Sci. 2015, 16, 1007–1016. [Google Scholar] [CrossRef]
  57. Full, W.E.; Ehrlich, R.; Kennedy, S.K. Optimal definition of class intervals for frequency tables. Part. Sci. Technol. 1983, 1, 281–293. [Google Scholar] [CrossRef]
Figure 1. Discretization method of (a) Kozeny’s effective diameter; and (b) abstract interval system based on grading entropy.
Fractalfract 06 00474 g001
Figure 2. (a) Schematic diagram of grading entropy-based discretization method; and (b) PSD curve discretized by using entropy-based method in semi logarithmic coordinate system (where C1–C10 and p1–p10 represent abstract fractions and relevant percentages, respectively).
Fractalfract 06 00474 g002
Figure 3. PSD curves of ten widely graded soils (adopted with permissions from Israr and Zhang [16], 2021).
Fractalfract 06 00474 g003
Figure 4. Relative deviation data of two characteristic particle sizes D10 (Hazen’s effective particle size) and D50 (mean particle size on PSD curve) versus uniformity coefficients for 10 soils shown previously in Figure 3.
Fractalfract 06 00474 g004
Figure 5. Calculated effective particle diameter of 10 PSDs using different effective particle diameter methods.
Fractalfract 06 00474 g005
Figure 6. Values of Kozeny’s effective particle diameter of 10 PSDs in different interval sizes.
Fractalfract 06 00474 g006
Figure 7. Values of different effective particle diameters computed from different methods for Soil-1 using different discretized interval sizes.
Fractalfract 06 00474 g007
Figure 8. Two gap-graded and a continuous PSD curves for effective particle size computations using existing plus methods.
Fractalfract 06 00474 g008
Figure 9. (a) Variations in gap ratio (Gr) and uniformity coefficient (Cu) versus soil particle sizes, and (b) enlarged view of highlighted inset of Figure 9a.
Fractalfract 06 00474 g009
Figure 10. PSD curves adopted with permission from Choo et al. [49] used for permeability testing.
Fractalfract 06 00474 g010
Figure 11. Comparison of the calculated values using four different effective particle diameter methods: (a) Kozeny’s effective particle diameter method, (b) Carrier’s method, (c) Fedorenko’s method, and (d) current method proposed in this study.
Fractalfract 06 00474 g011
Figure 12. Verification of entropy-based effective particle diameter implications into K-C model through permeability test data from literature.
Fractalfract 06 00474 g012
Publisher’s Note: MDPI stays neutral with regard to jurisdictional claims in published maps and institutional affiliations.

