Next Article in Journal
Solving Two-Sided Fractional Super-Diffusive Partial Differential Equations with Variable Coefficients in a Class of New Reproducing Kernel Spaces
Next Article in Special Issue
Fractal Quasi-Coulomb Crystals in Ion Trap with Cantor Dust Electrode Configuration
Previous Article in Journal
A New Approach Using Integral Transform to Solve Cancer Models
 
 
Correction published on 4 January 2024, see Fractal Fract. 2024, 8(1), 36.
Article

3D FEM Simulation and Analysis of Fractal Electrode-Based FBAR Resonator for Tetrachloroethene (PCE) Gas Detection

by
Bhargav Panchal
1,2,*,
Avanish Bhadauria
1,* and
Soney Varghese
2
1
Council of Scientific and Industrial Research–Central Electronics Engineering Research Institute (CSIR–CEERI), Pilani 333031, India
2
Nanomaterials & Devices Research Laboratory, National Institute of Technology, Calicut 673601, India
*
Authors to whom correspondence should be addressed.
Fractal Fract. 2022, 6(9), 491; https://doi.org/10.3390/fractalfract6090491
Submission received: 25 July 2022 / Revised: 17 August 2022 / Accepted: 19 August 2022 / Published: 1 September 2022 / Corrected: 4 January 2024
(This article belongs to the Special Issue Fractal Geometries with Applications in Materials)

Abstract

:
This paper presents the FEM modeling and simulation of a thin-film bulk acoustic resonator (FBAR) for a tetrachloroethene (PCE) gas-sensing application. A zinc oxide layer is used as a piezoelectric material; an aluminum layer is used as the electrode material in the structure of the FBAR. Polyisobutylene (PIB) is used as the sensitive layer for PCE gas detection. The study was carried out in commercially available FEM-based COMSOL software. The proposed structure was exposed to six different organic gases with concentrations ranging from 0 to 1000 ppm. The structure showed high selectivity for PCE gas. Incorporating the 3rd-order Hilbert fractal geometry in the top electrode of the FBAR increased the sensitivity of the sensor which showed high selectivity for PCE gas detection. A sensitivity enhancement of 66% was obtained using fractal geometry on the top electrode of the FBAR without alteration in size or cost. In addition, a reduction in the cross-sensitivity was achieved. Further, the PIB layer thickness and active area of the FBAR were optimized to obtain high sensitivity. The equivalent circuit was also analyzed to understand the behavior of the sensing effect and mechanism.

1. Introduction

Fast, cheap, accurate and highly sensitive gas sensors are critical for detecting and monitoring hazardous gases and ensuring the safety and quality of the environment in medical, industrial, and commercial fields [1]. Acoustic wave devices have been used in medical, industrial and commercial sensor applications for more than 60 years [2]. Acoustic wave devices, such as surface acoustic waves (SAW) and bulk acoustic waves (BAW), are widely used in gas, temperature, mass, pressure, humidity, bio, magnetic and UV sensors [3,4,5,6,7,8,9,10,11,12,13,14,15]. BAW resonators, such as thin-film bulk acoustic wave resonators (FBAR), offer high sensitivity, high frequency, ppb level detection, label-free sensing capability, CMOS compatibility and small size compared to surface acoustic wave resonators [16,17,18].
Chlorinated hydrocarbons, such as tetrachloroethene, are primarily used as industrial solvents, degreasing agents for automotive industries and consumer products, such as shoe polish, dry cleaning agent, etc. [19,20]. The US Environmental Protection Agency (EPA) has classified PCE as hazardous waste and long-time exposure can lead to cancer, neurotoxicity, colour blindness, loss of appetite, and nausea [21,22]. Current studies for detecting VOC involve the laboratory analysis of samples collected off-site which is both time-consuming and costly. These methods can be compromised during transportation and storage and as a result of human errors [23]. The proposed method is based on in situ sampling, adsorption and desorption of volatile organic compound gases by a polymer; the density of the polymer changes accordingly, and the resonance frequency of the polymer-coated acoustic sensor shifts according to the mass-loading on the resonator.
Recently, many researchers have been working in the field of gas sensors. Guang Zeng et al. fabricated a multiparameter virtual sensor array (VSA) using a temperature-compensated FBAR with 20-bilayer self-assembled PSS/PDDA thin films to improve molecule absorption efficiency [24]. The authors used a DC heater for temperature control and VOC discrimination. The FBAR VSA could distinguish between six different VOCs with a higher than 97% discrimination rate for each gas. Mengying Zhang et al. fabricated an FBAR-based VOC gas sensor driven by a Colpitts oscillator. They built micro-holes into the top electrode to improve sensitivity. The results indicated that the FBAR sensor had high accuracy, sensitivity and resolution [7]. Potyrailo Radislav A. et al. fabricated four SAW sensor arrays for chlorinated organic vapour detection, including PCE. The sensor array detected a minimum of 0.2 ppm (parts per million) PCE gas [25].

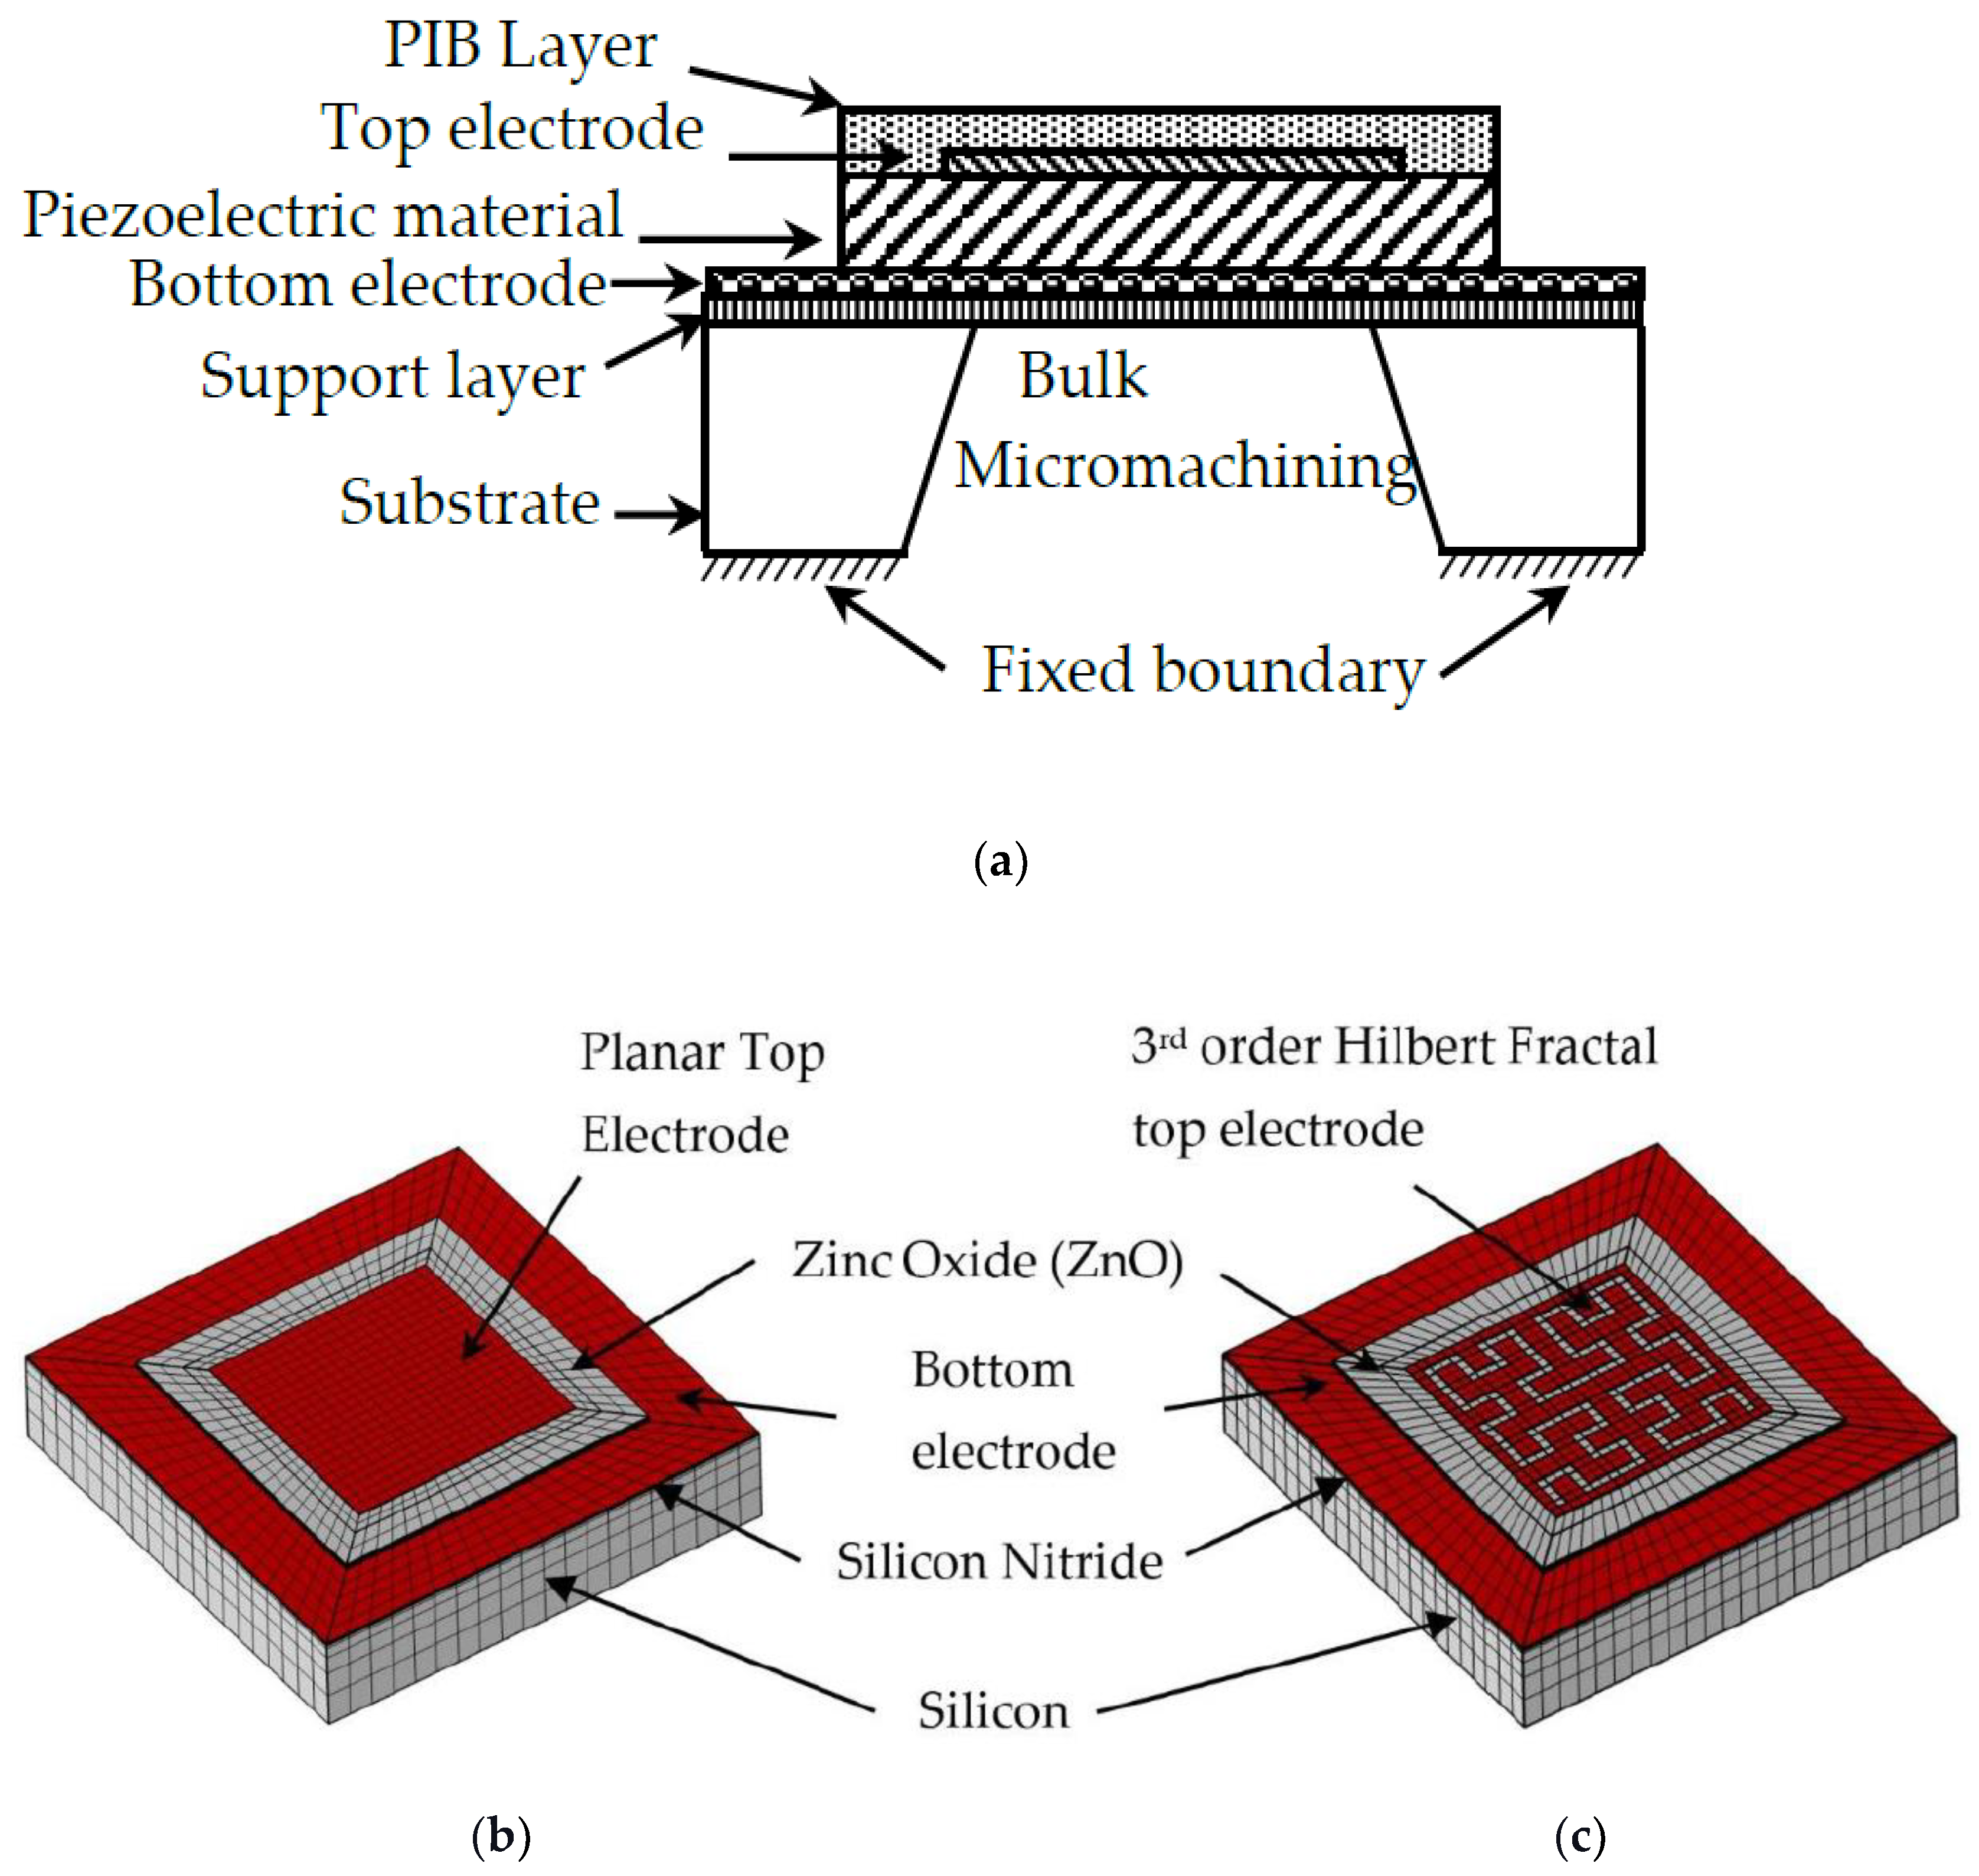
2. Materials and Methods

Piezoelectricity is the ability of a material to accumulate charge when subjected to mechanical stress, while reverse piezoelectricity refers to the effect of mechanical stress generated by the electric polarization of material [26]. FBARs contain a piezoelectric layer sandwiched between a top and bottom electrode. The sandwich structure is supported on silicon nitride and a bulk micro-machined silicon substrate to reduce acoustic losses. When an alternating voltage is supplied to a piezoelectric material, an acoustic wave is generated in the FBAR. The schematic of a typical FBAR, and its meshed model for planar and fractal electrode geometry, is shown in Figure 1a–c, respectively. The resonance frequency of the FBAR can be given by
f r = v 2 d
where v is the longitudinal velocity and d is the thickness of the piezoelectric material. Conventionally the planar geometry of electrodes is used. The use of fractal geometry in the top electrode of the FBAR improves the quality factor, as previously shown [27].
The FBAR converts the applied electrical energy into mechanical energy. The conversion efficiency between the electrical to mechanical energy is called the coupling coefficient. The effective coupling coefficient can be given by the resonance (fr) and anti-resonance frequency (fa). It is given by
k t 2 e f f = π 2 4 f r f a f a f r f a
The quality factor represents a device loss mechanism including acoustic path losses, electrode losses and viscoelastic losses. The quality factor is defined as the ratio of the energy stored and the energy loss over one period cycle. It can be defined in terms of the phase of the impedance by the following equation.
Q s / p = f r / a 2 d Z i n d f r / a
where Z i n is the phase angle of the input impedance.

Gas Sensing Mechanism

Jay W Grate et al. first determined the linear energy solvation relationship (LSER) to model the adsorption of gas on the polymer layers [28]. A polyisobutylene (PIB) layer was selected as the gas-sensing layer. The physical properties of PIB are shown in Table 1. The PIB polymer is a suitable polymer for gas detection since it has high selectivity to gases and is penetrable; it allows quicker adsorption and desorption and reversibility of the post-vapor analyte exposure, which creates the ideal conditions for gas sensors [29]. The primary objective of this paper was to increase the sensitivity performance of the FBAR for PCE gas detection.
It is known that the response of an acoustic wave sensor coated with polymer is proportional to the partition coefficient and is given by
k = C s C v
where C s is the concentration of the absorbed vapor in the polymer material and C v is the total concentration of the vapor in gas phase. The absorbed gas reduces the density of the polymer and is given by
ρ p o l y m e r + g a s = ρ p o l y m e r + Δ ρ
where ρ p o l y m e r + g a s is the total density of the polymer with absorbed gas, ρ p o l y m e r is the density of the polymer and Δ ρ is the change in density in the polymer. It is given by
Δ ρ = k C v M g a s
where M g a s is the molecular mass of the gas. C v is the total volumetric concentration of the gas and is given by
C v = N p p m ρ a i r R T a i r
where N p p m is the gas concentration, R is the gas constant, and   ρ a i r and T a i r are the density and temperature of the air, respectively.
The relationship between the frequency shift ( Δ f ) and loaded mass ( Δ m ) was determined by Sauerbrey in 1958 and is given by
Δ f = 2 f r 2 µ ρ Δ m A
where µ is the elastic constant of the piezoelectric material, ρ is the density of the piezoelectric material, and A is the active area of the FBAR. The additional mass loaded on the surface of the FBAR results in a shift in the resonance frequency, and its related mass sensitivity can be given by
S = Δ f Δ m
The Mason and Butterworth Vandyke models are popular models for analyzing the response of FBARs [30]. The Mason model can be simplified as four electrical elements by assuming the electrodes are thin compared to the thickness of the piezoelectric layer, as shown in Figure 2.
The Butterworth Vandyke model consist of a series motional resonator (Rm), motional inductance (Lm), motional capacitance (Cm) and parallel static capacitance (C0). The equivalent circuit parameters can be determined using the following equation.
R m   = 1 Q r L m C m
L m   = 1 2 π f r 2 C m
C m   = C 0 f a f r 2 1

3. Results

The layout was constructed using layout editor software to build a 3D model for FEM simulation. ZnO was used as the piezoelectric layer with dimensions 70 µm × 70 µm and 1.24 µm thickness. The electrode material was aluminum material with top electrode dimensions of 50 µm × 50 µm × 0.32 µm and bottom electrode dimensions of 100 µm × 100 µm × 0.4 µm. A silicon nitride layer of 0.25 µm thickness was used as the support layer. Finally, the polyisobutylene (PIB) polymer layer was placed on the top electrode layer of the FBAR.

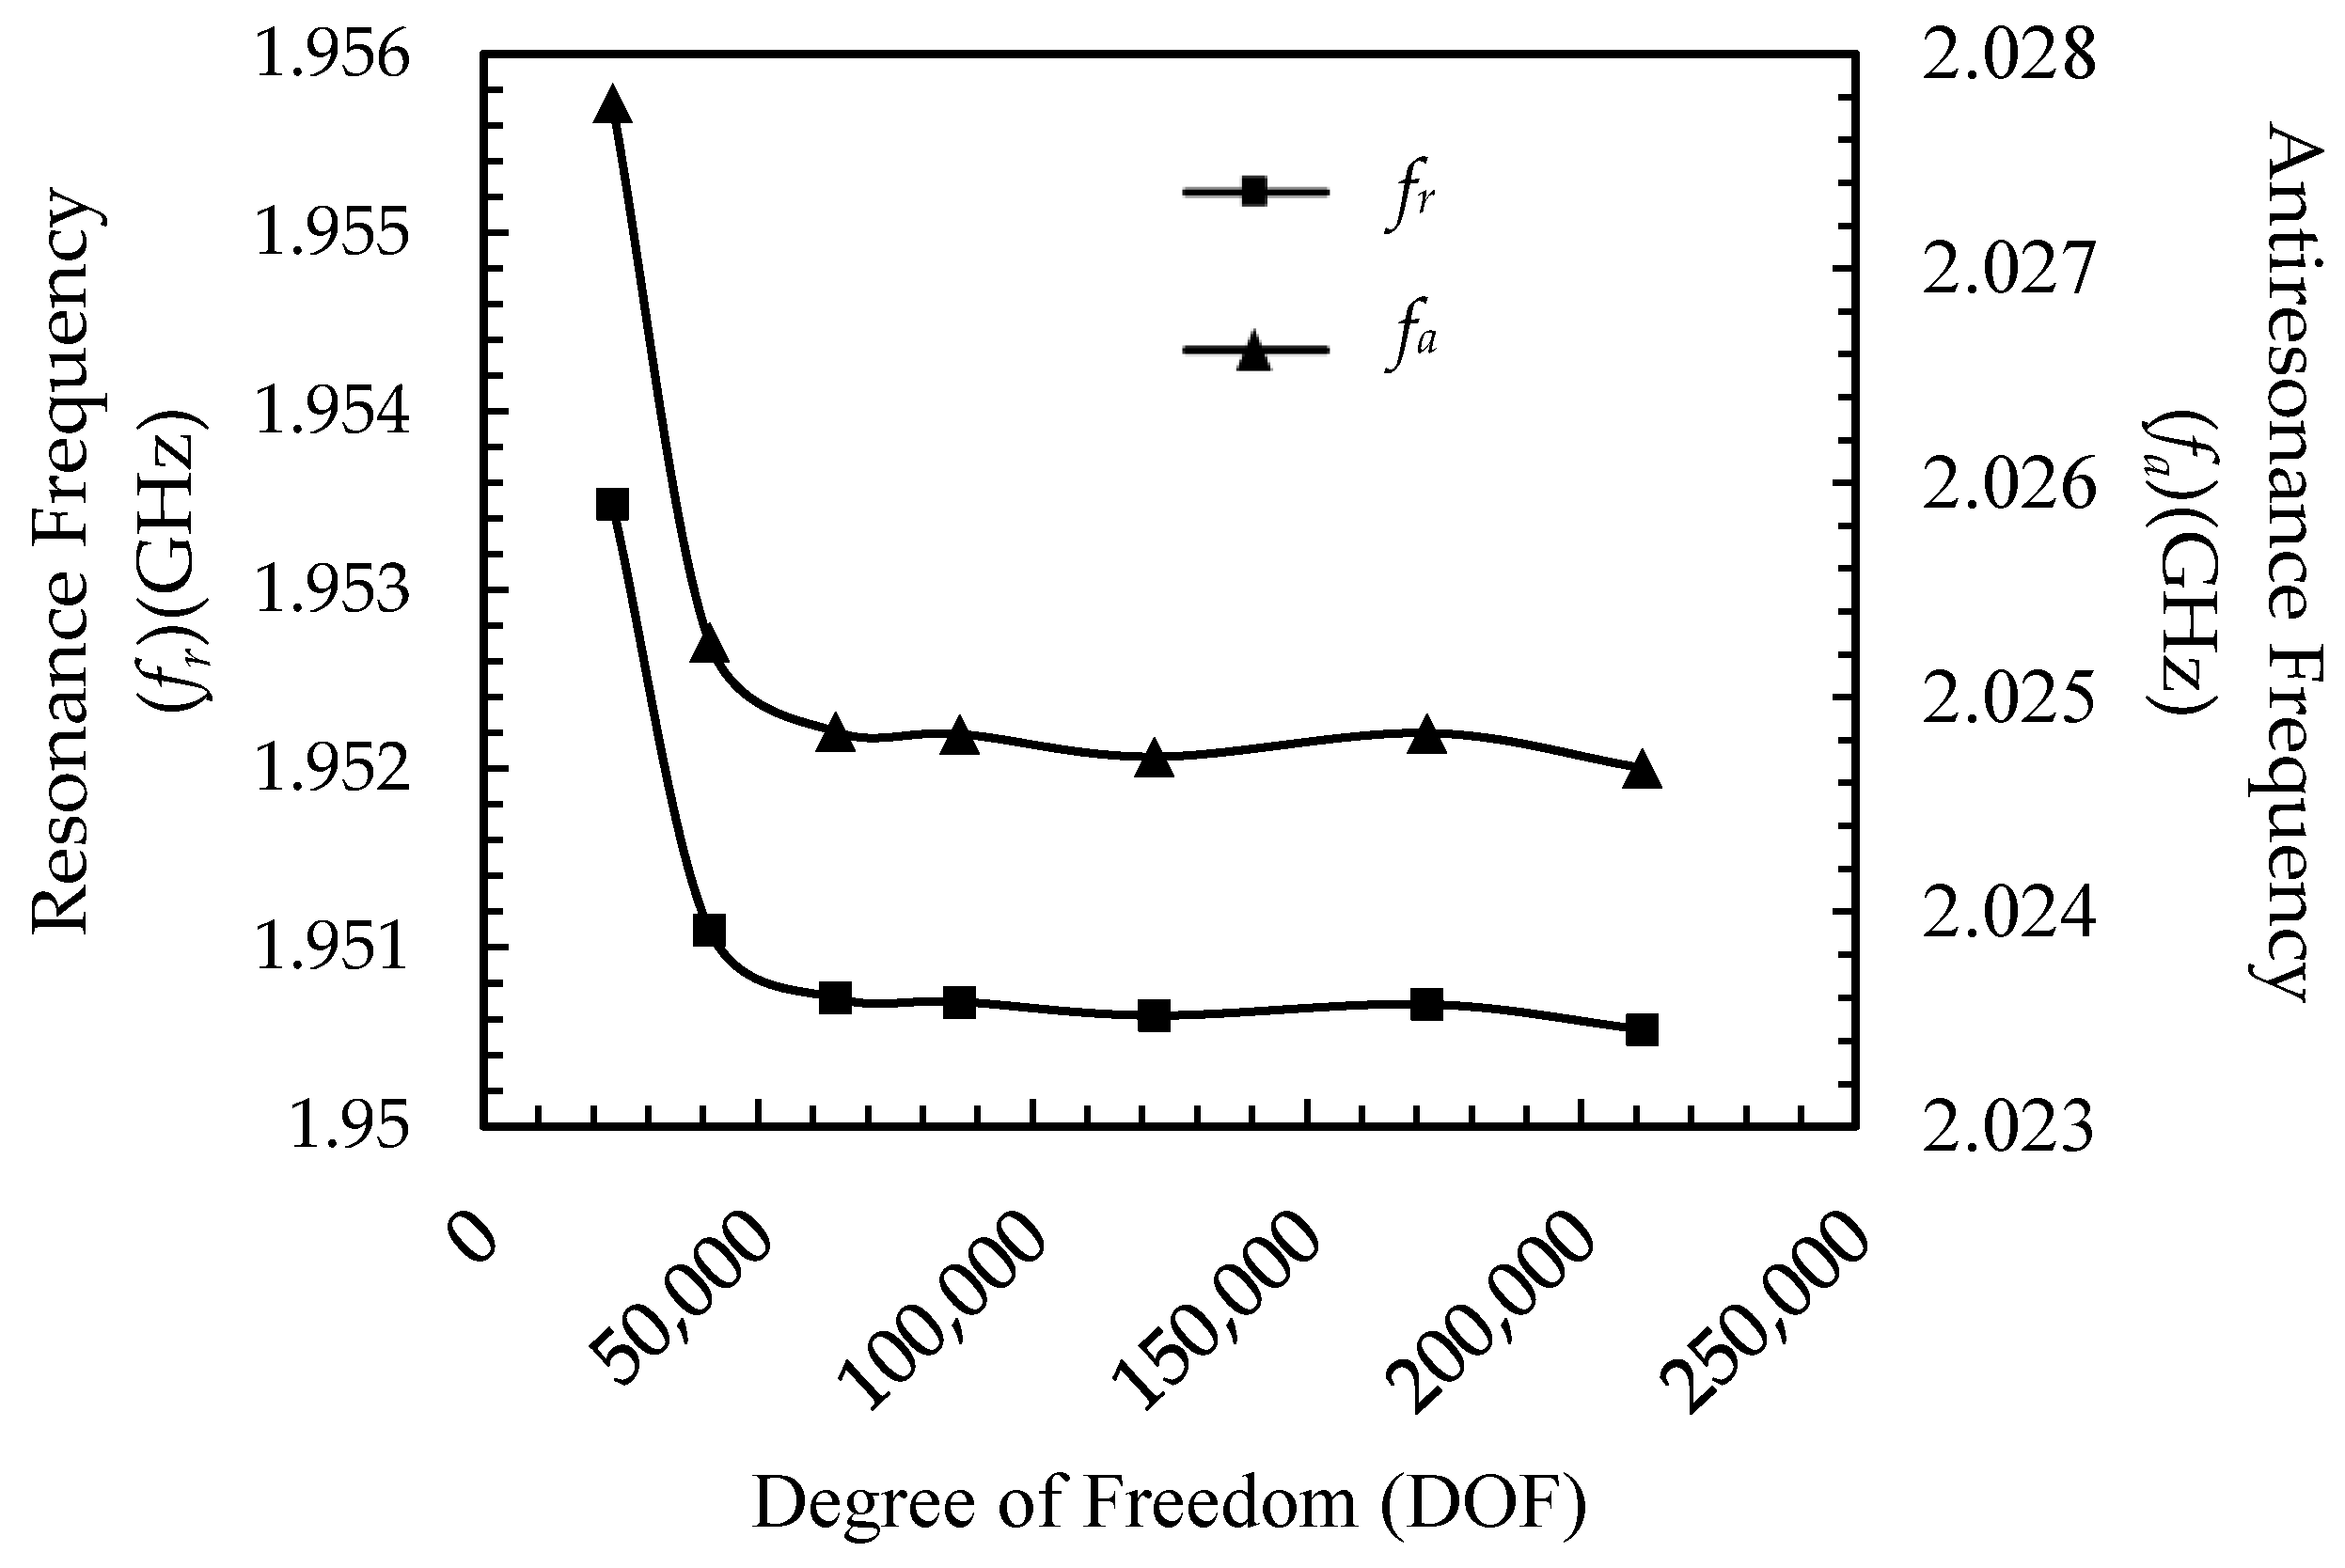
3.1. Convergence Study

A convergence study of the model was carried out to obtain an accurate analysis with minimum solution time. A model’s solution time is directly related to the degrees of freedom (DOFs). The degrees of freedom are the product of the mesh nodes and the dependent variables [31,32]. An efficient model should not have too low a DOF since it produces inaccurate results; at the same time, it should not have an excessive DOF since this requires more solution time. Figure 3 shows the resonance and anti-resonance frequency as reference parameters to optimize the DOF. The optimized value of DOF can be derived from the graph as 64,000 value.
Figure 4 shows the visualization of displacement by means of FEM simulation of a planar and fractal electrode FBAR.

3.2. Optimization of Parameter

The FBAR was exposed to six different VOC gases, as depicted in Table 2. The performance of the sensor was optimized with various parameter variations.

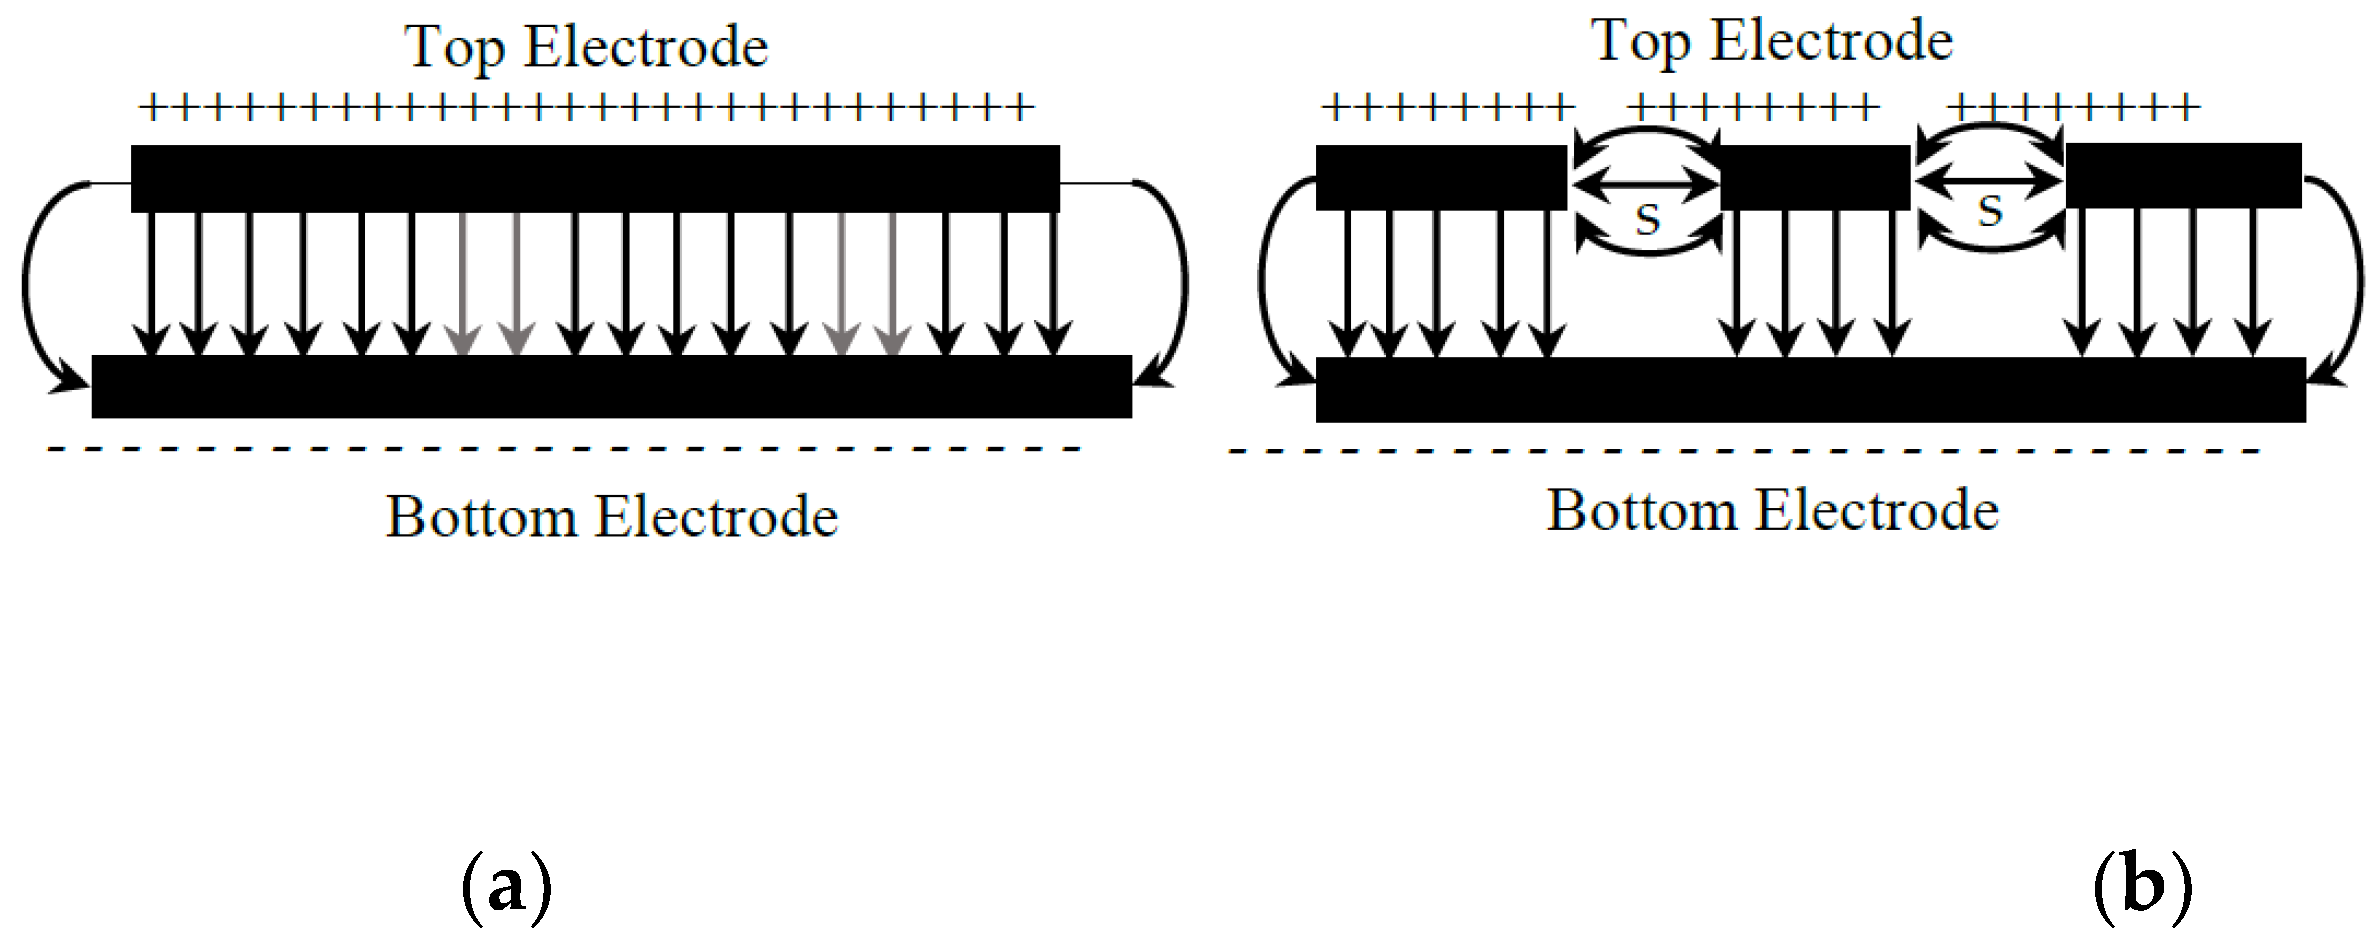
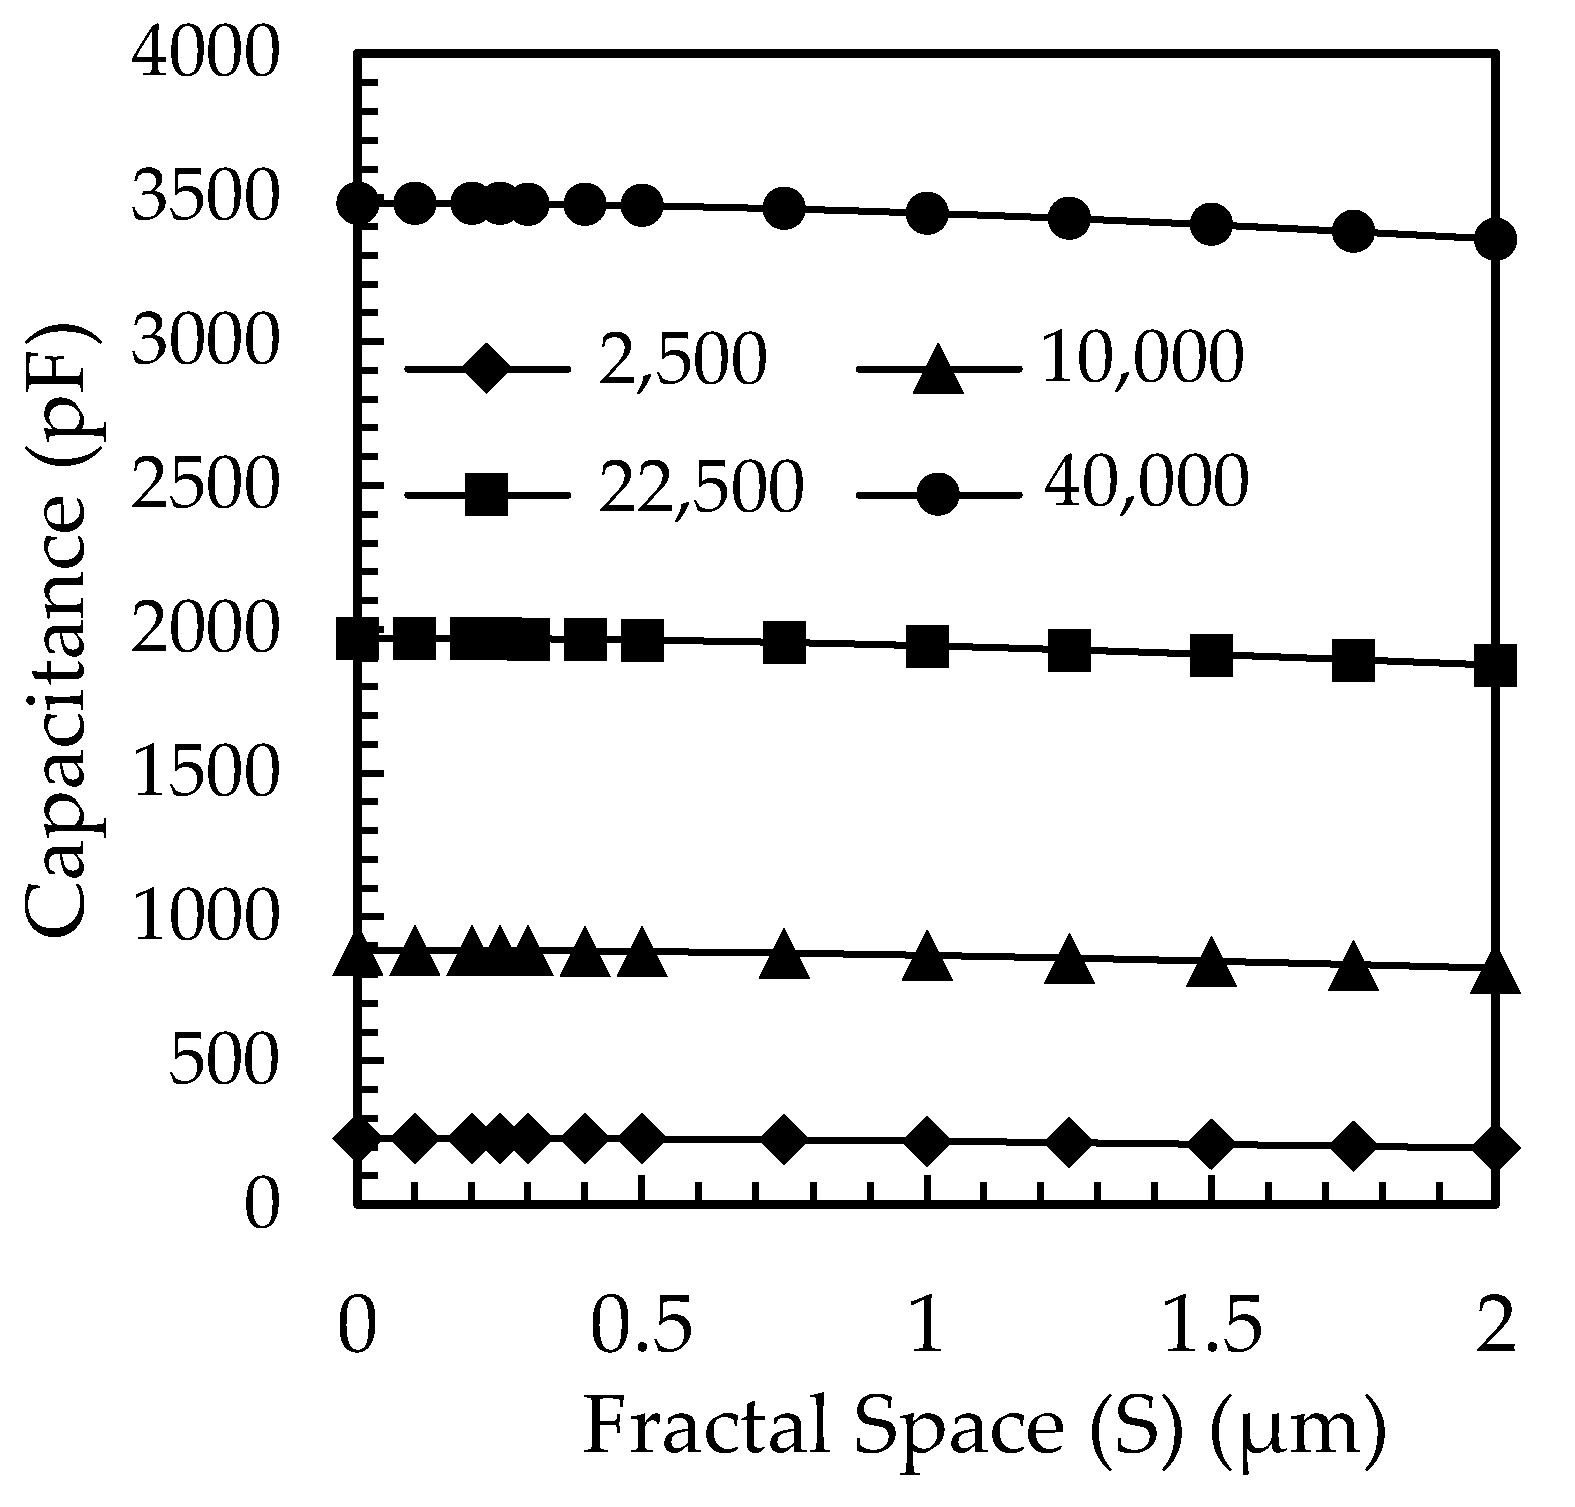
3.2.1. Optimization of Hilbert Fractal Gap

The top electrode of the FBAR was optimized as a high-quality factor. The electrode fractal gap (S) was varied from 0.1 to 1.5 µm in steps of 0.1 µm to analyze the performance. The quality factors for the resonance and anti-resonance frequencies is depicted in Table 3. The total capacitance of the FBAR with the fractal electrode is given by the lateral-flux and longitudinal-flux capacitance.
C t o t a l = C l a t e r a l f l u x + C l o n g i t u d i n a l f l u x
Figure 5a,b illustrate the electric field lines for the planar and fractal electrodes, respectively. Lateral flux is caused by an asymmetric distribution of the electric field in the fractal electrode. The capacitance of the lateral flux is very weak, and the longitudinal flux dominates the total capacitance. The capacitance of the FBAR fractal electrode for different fractal spaces and the area of the top electrode is shown in Figure 6.
The fractal space in the top electrode of the FBAR decreases the effective active area of the FBAR, so the capacitance decreases, and the resonance frequency increases, as is evident from Equation (11). A fractal gap of 1 µm was selected since it has the highest quality factor of 348 and coupling coefficient of 9.54%.

3.2.2. Effect of Polyisobutylene Layer (PIB) Thickness Variation

The polyisobutylene (PIB) thickness increased from 0 µm to 2.5 µm with a 0.5 µm interval. The figure shows the resonance and anti-resonance frequency for different polyisobutylene (PIB) thicknesses of the FBAR. The resonance and anti-resonance frequency variation of the fractal electrode FBAR with PIB thickness are nonlinear, as shown in Figure 7a. The PIB thickness was chosen as 1 µm since it shows high sensitivity to tetrachloroethene (PCE) gas. The resonance frequency was high, around 2.51 GHz, and the quality factor was 816 at this thickness.

3.2.3. Effect of FBAR Area Variation

The area is scaled from two to four times in step 1 to analyze the performance of the FBAR. The parallel plate capacitance increases exponentially with the active area of the FBAR, as shown in Figure 7b, and the resonance frequency decreases according to Equation (11). The resonance frequency decreased from 2.51 to 2.48 GHz. A 49 µm × 49 µm area was selected for its high resonance frequency of 2.52 GHz and maximum sensitivity of 4.83 kHz/ppm.

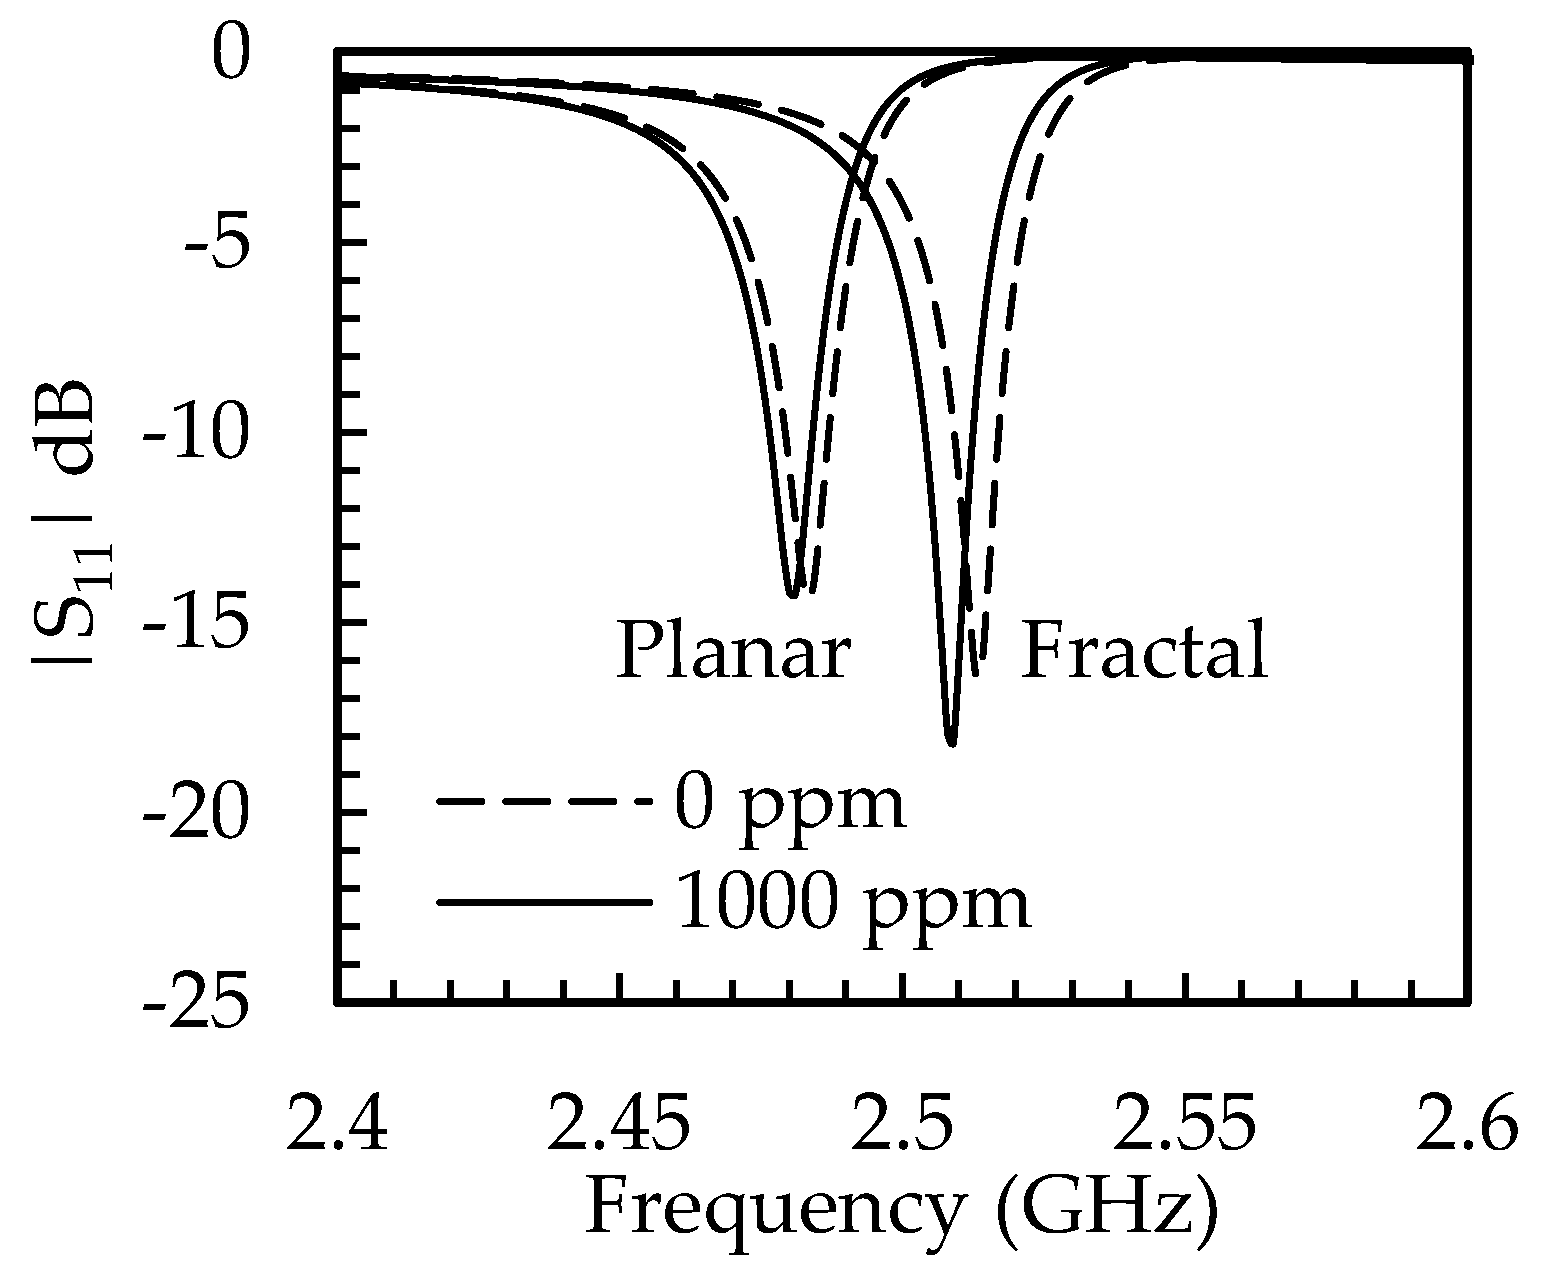
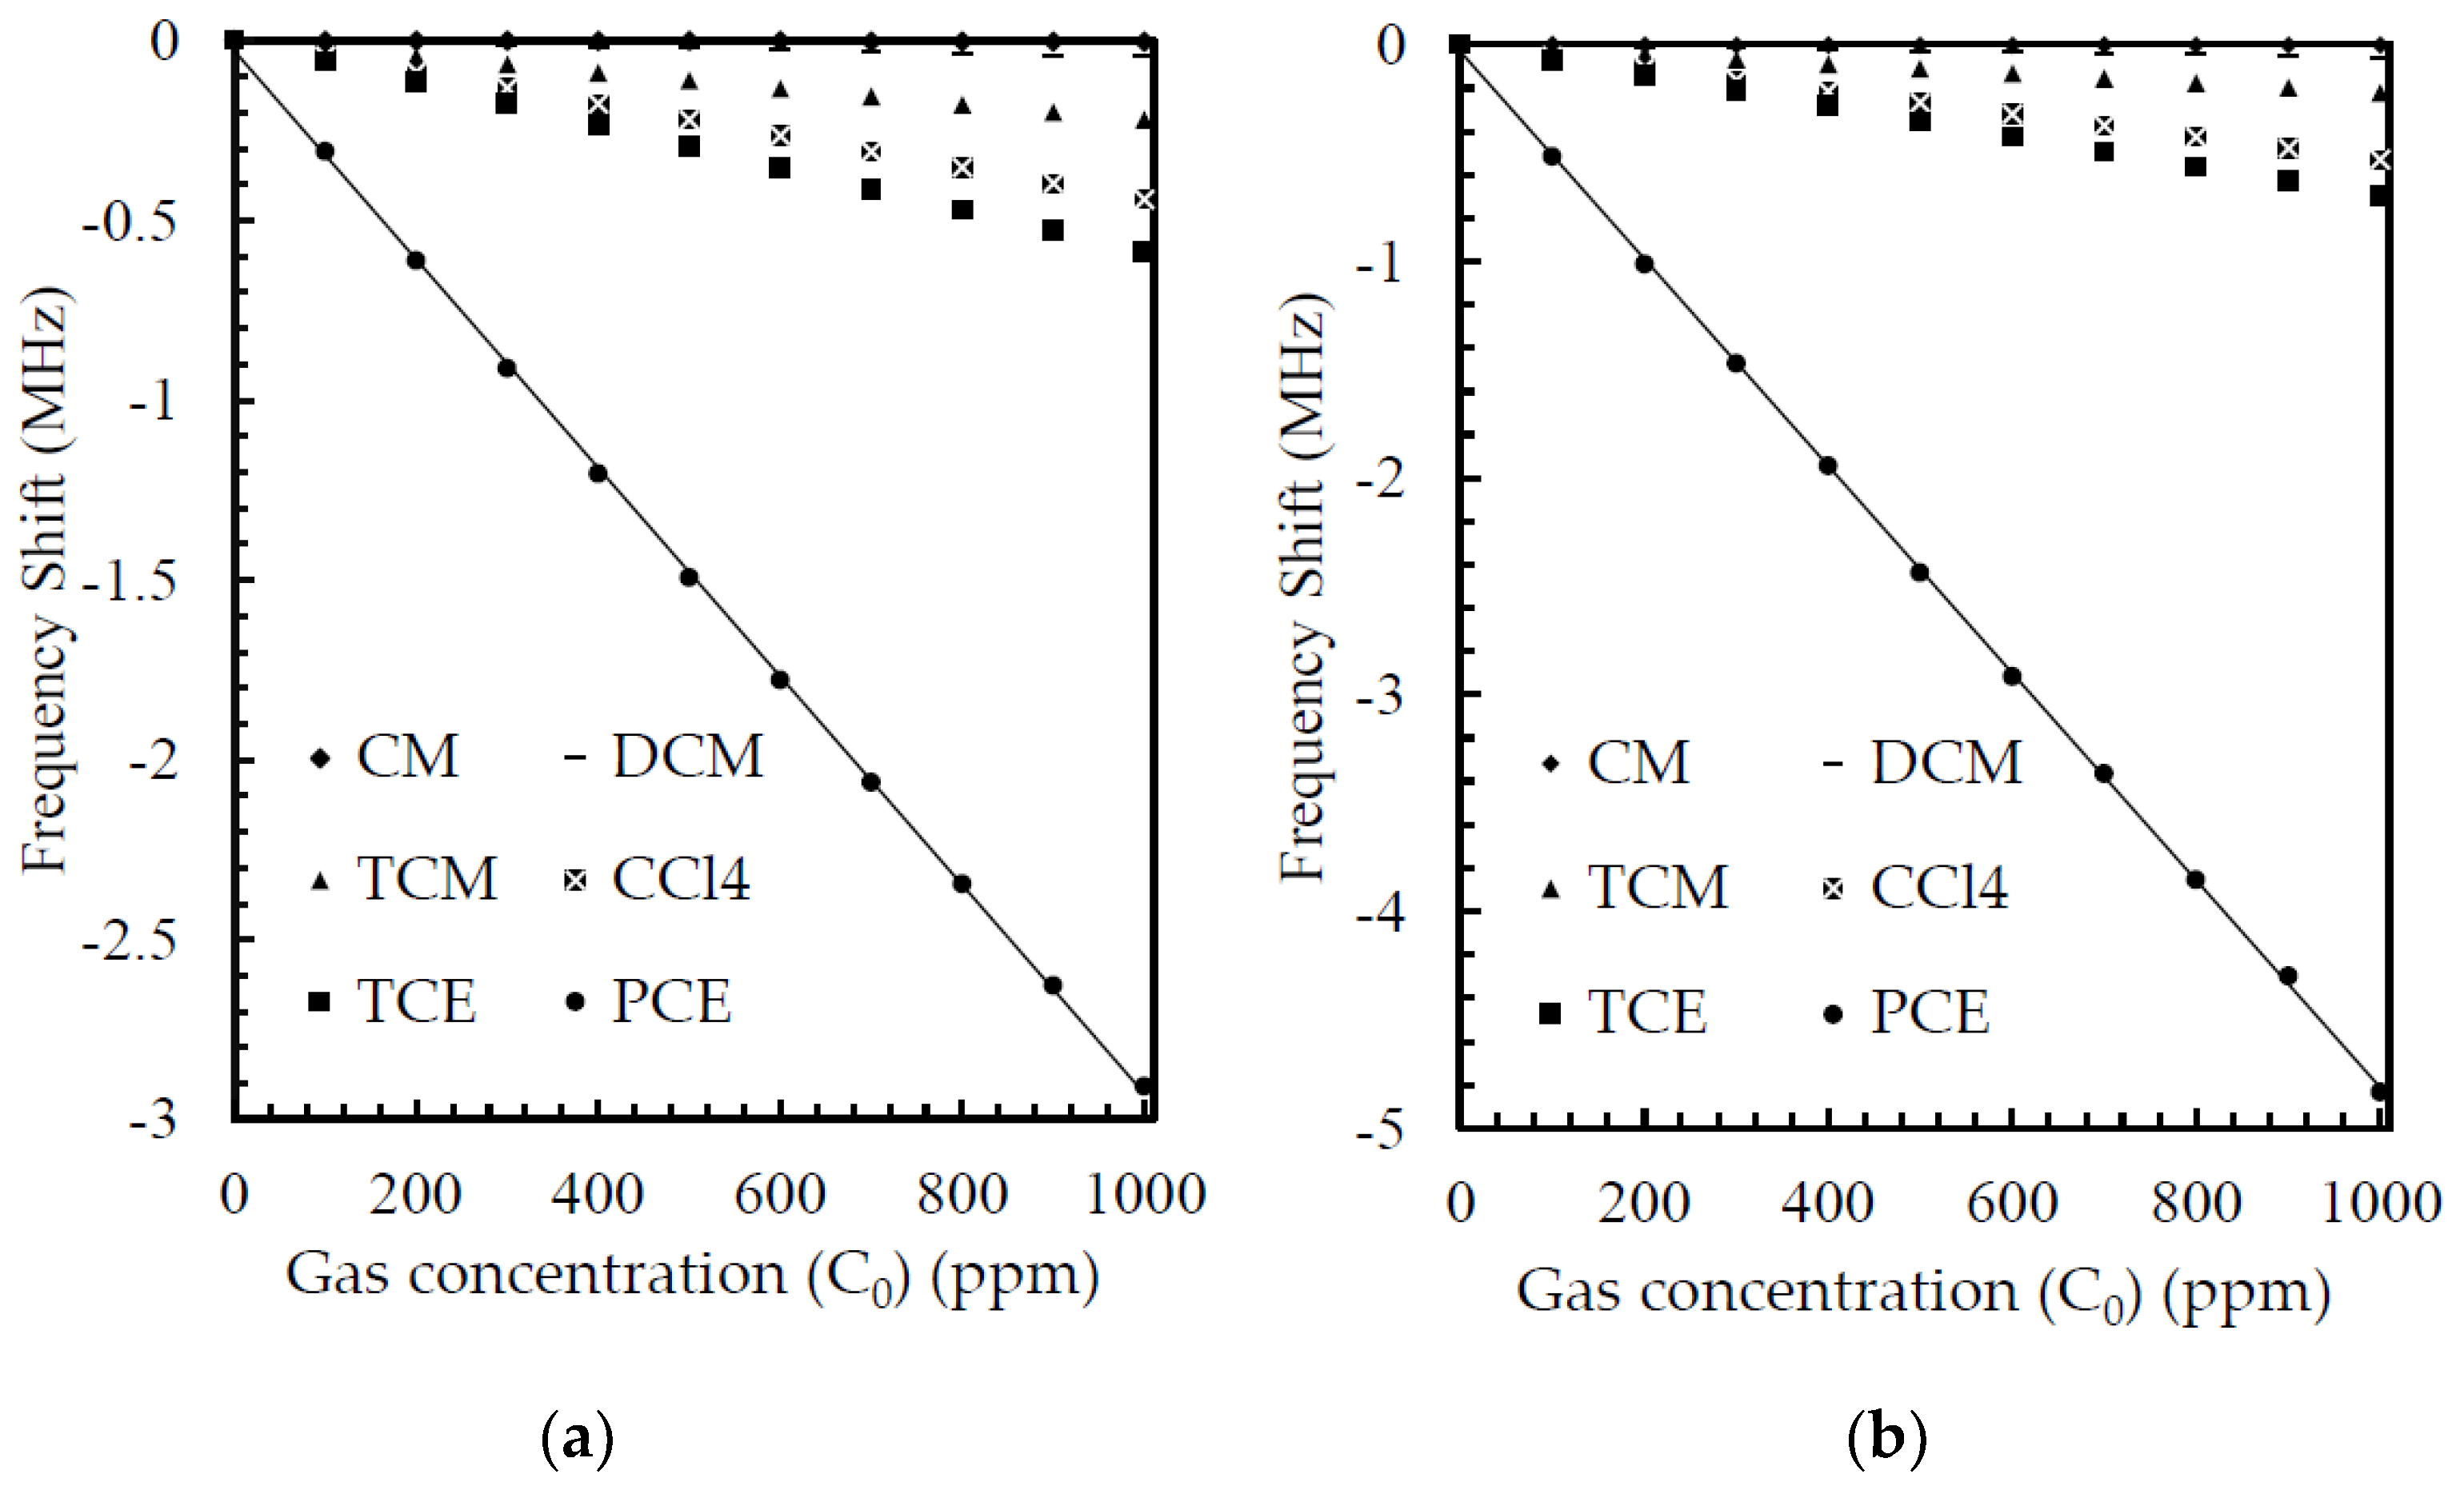
3.2.4. Effect of Gas Exposure on the Parameters

The PIB layer was exposed to six different gases using a COMSOL Multiphysics model. The polymer adsorbs different gases according to their segregation coefficient. The resonance frequency of the FBAR is changed due to density changes in the polymer. Figure 8 shows the frequency changes in the resonance frequency shift of the FBAR due to the planar electrode and fractal electrode, respectively. It is noted that the sensitivity for the planar electrode was 2.909 kHz/ppm, while, in the case of the fractal electrode, the sensitivity was increased to 4.833 kHz/ppm, as shown in Table 4.

4. Discussion

To assess the performance of the gas sensor, the equivalent circuit was extracted from the FEM simulation, as depicted in Table 5, and the return loss was simulated using the Quite Universal Circuit Simulator. Figure 7 depicts the return losses of the planar and fractal electrode-based FBAR for gas concentrations of 0 and 1000 ppm. It is noted that the return loss of the planar electrode was −14.3 dB for gas concentrations of 0 and 1000 ppm whereas the return losses of the fractal electrode were −16.4 dB and −18.2 dB for gas concentrations of 0 and 1000 ppm, respectively. The cross-sensitivity is the sensor’s response to the other gases when the target gas is not present [33]. The FBAR-based gas sensor showed a reduced response or negative cross-sensitivity to other gases. Table 4 shows the highest sensitivity for tetrachloroethene (PCE) gas. The sensitivity of PCE was at least five times more than the sensitivity of the remaining gas in the planar electrode-based FBAR, whereas it was seven times more sensitive in the case of the fractal electrode-based FBAR. Thus, the fractal electrode-based FBAR demonstrated low cross-sensitivity, as can be seen in Figure 9a,b.
The use of different types of filter to reduce cross-sensitivity has been reported [34,35,36]. The fractal geometry in the top electrode of the FBAR sensor reduces the cross-sensitivity without size and cost modification, and may remove the filter requirements in the sensor; in particular, it may reduce the size and cost of the sensor. The results show that the fractal electrode-based FBAR gas sensor shows high frequency shift and low cross-sensitivity. Table 6 shows a comparison of gas sensors from the literature.
In this paper, the performed analysis is limited to a few fractals due to their large availability. In future, further fractals need to be explored to improve the design and new fractals can be incorporated in the top electrode as well as the bottom electrode.

5. Conclusions

In this paper, a finite element method study was conducted to analyze the sensitivity of planar and fractal electrode-based FBARs for six different gases including: (1) chloromethane (CM), (2) dichloromethane (DCM), (3) trichloromethane (TCM), (4) carbon tetrachloride (CCl4), (5) trichloroethylene (TCE), and (6) tetrachloroethene (PCE). Further, the fractal gap, thickness, and active area of the FBARs were optimized for high sensitivity. The equivalent circuit was extracted to analyze the behavioral performance. The circuit parameters assessed confirmed the role of various parameters, including the quality factor, resonance frequency and coupling coefficient, on the sensitivity of the fractal and planar electrode-based FBARs. The study evidenced the significant enhancement of sensitivity in a fractal electrode-based FBAR compared to a planar electrode-based FBAR, without size and cost modification.

Author Contributions

Conceptualization, B.P., A.B. and S.V.; methodology, B.P.; software, B.P.; validation, S.V., A.B. and B.P.; formal analysis, B.P., A.B. and S.V.; investigation, B.P., A.B. and S.V.; resources, B.P. and A.B.; data curation, B.P.; writing—original draft, B.P.; writing—review and editing, A.B. and S.V.; visualization, B.P.; supervision, A.B. and S.V.; project administration, A.B. and S.V. All authors have read and agreed to the published version of the manuscript.

Funding

This research received no external funding.

Data Availability Statement

Not applicable.

Acknowledgments

The authors want to acknowledge the support received from Director, National Institute of Technology, Calicut, India and Indian Science Technology and Engineering Facilities Map (I-STEM), a program supported by the office of the Principal Scientific Adviser to the Govt. of India, for enabling access to the COMSOL Multiphysics 5.6 software suite which was used to carry out this work.

Conflicts of Interest

The authors declare no conflict of interest.

References

  1. Awang, Z. Gas sensors: A review. Sens. Transducers 2014, 168, 61–75. [Google Scholar]
  2. Fu, Y.Q.; Cherng, J.S.; Luo, J.K.; Desmulliez, M.P.Y.; Li, Y.; Walton, A.J.; Placido, F. Aluminium Nitride Thin Film Acoustic Wave Device for Microfluidic and Biosensing Applications. Acoustic Waves. 2010, 466. [Google Scholar]
  3. Chiu, K.-H.; Chen, H.-R.; Huang, S.R.-S. High-performance film bulk acoustic wave pressure and temperature sensors. Jpn. J. Appl. Phys. 2007, 46, 1392. [Google Scholar] [CrossRef]
  4. Qiu, X.; Zhu, J.; Oiler, J.; Yu, C.; Wang, Z.; Yu, H. Film bulk acoustic-wave resonator based ultraviolet sensor. Appl. Phys. Lett. 2009, 94, 151917. [Google Scholar] [CrossRef]
  5. Zhao, X.; Zhao, Z.; Wang, B.; Qian, Z.; Ma, T. The Design of a Frame-Like ZnO FBAR Sensor for Achieving Uniform Mass Sensitivity Distributions. Sensors 2020, 20, 2408. [Google Scholar] [CrossRef] [PubMed]
  6. Xuan, W.; Cole, M.; Gardner, J.W.; Thomas, S.; Villa-López, F.-H.; Wang, X.; Dong, S.; Luo, J. A film bulk acoustic resonator oscillator based humidity sensor with graphene oxide as the sensitive layer. J. Micromech. Microeng. 2017, 27, 055017. [Google Scholar] [CrossRef]
  7. Zhang, M.; Du, L.; Fang, Z.; Zhao, Z. A sensitivity-enhanced film bulk acoustic resonator gas sensor with an oscillator circuit and its detection application. Micromachines 2017, 8, 25. [Google Scholar] [CrossRef]
  8. Chen, Y.-C.; Shih, W.-C.; Chang, W.-T.; Yang, C.-H.; Kao, K.-S.; Cheng, C.-C. Biosensor for human IgE detection using shear-mode FBAR devices. Nanoscale Res. Lett. 2015, 10, 69. [Google Scholar] [CrossRef]
  9. Wu, Y.; Dong, S.; Jin, H.; Wang, X.; Chen, G. Flexible magnetic sensor based on FBAR. In Proceedings of the 2016 IEEE International Nanoelectronics Conference (INEC), Chengdu, China, 9–11 May 2016. [Google Scholar]
  10. Howe, E.; Harding, G. A comparison of protocols for the optimisation of detection of bacteria using a surface acoustic wave (SAW) biosensor. Biosens. Bioelectron. 2000, 15, 641–649. [Google Scholar] [CrossRef]
  11. Buff, W.; Klett, S.; Rusko, M.; Ehrenpfordt, J.; Goroli, M. Passive remote sensing for temperature and pressure using SAW resonator devices. IEEE Trans. Ultrason. Ferroelectr. Freq. Control. 1998, 45, 1388–1392. [Google Scholar] [CrossRef]
  12. Kittmann, A.; Müller, C.; Durdaut, P.; Thormählen, L.; Schell, V.; Niekiel, F.; Lofink, F.; Meyners, D.; Knöchel, R.; Höft, M.; et al. Sensitivity and noise analysis of SAW magnetic field sensors with varied magnetostrictive layer thicknesses. Sens. Actuators A Phys. 2020, 311, 111998. [Google Scholar] [CrossRef]
  13. Chivukula, V.; Ciplys, D.; Shur, M.; Dutta, P. ZnO nanoparticle surface acoustic wave UV sensor. Appl. Phys. Lett. 2010, 96, 233512. [Google Scholar] [CrossRef]
  14. Lee, Y.; Kim, H.; Roh, Y.; Cho, H.; Baik, S. Development of a SAW gas sensor for monitoring SO2 gas. Sens. Actuators A Phys. 1998, 64, 173–178. [Google Scholar] [CrossRef]
  15. Wu, T.-T.; Chen, Y.-Y.; Chou, T.-H. A high sensitivity nanomaterial based SAW humidity sensor. J. Phys. D Appl. Phys. 2008, 41, 085101. [Google Scholar] [CrossRef]
  16. Colon-Berrios, A.R.; Edrees, H.; McGinn, C.; Cavallari, M.R.; Kinget, P.; Kymissis, I. CMOS integrated ZnO thin film bulk acoustic resonator with Si3N4 susceptor layer for improved IR sensitivity. In Proceedings of the 2017 75th Annual Device Research Conference (DRC), IEEE, South Bend, IN, USA, 25–28 June 2017. [Google Scholar]
  17. Yan, X.; Qu, H.; Chang, Y.; Pang, W.; Duan, X. A prototype portable instrument employing micro-preconcentrator and FBAR sensor for the detection of chemical warfare agents. Nanotechnol. Precis. Eng. 2022, 5, 013005. [Google Scholar] [CrossRef]
  18. Campanella Pineda, H. Thin-Film Bulk Acoustic Wave Resonators-FBAR: Fabrication, Heterogeneous Integration with CMOS Technologies and Sensor Applications. Ph.D. Thesis, Universitat Autònoma de Barcelona, Bellaterra, Spain, 2008. Available online: https://www.tdx.cat/handle/10803/5357 (accessed on 23 July 2022).
  19. Hesari, N.; Francis, C.M.; Halden, R.U. Evaluation of glycol ether as an alternative to perchloroethylene in dry cleaning. Toxics 2014, 2, 115–133. [Google Scholar] [CrossRef]
  20. Guyton, K.Z.; Hogan, K.A.; Scott, C.S.; Cooper, G.S.; Bale, A.S.; Kopylev, L.; Barone, S.; Makris, S.L.; Glenn, B.; Subramaniam, R.P.; et al. Human health effects of tetrachloroethylene: Key findings and scientific issues. Environ. Health Perspect. 2014, 122, 325–334. [Google Scholar] [CrossRef]
  21. Modenese, A.; Gioia, T.C.; Chiesi, A.; Abbacchini, C.; Borsari, L.; Ferrari, D.; De Pasquale, F.; Di Rico, R.; Ricci, R.; Sala, A.; et al. Evaluation of occupational exposure to perchlorethylene in a group of Italian dry cleaners using noninvasive exposure indices. Int. J. Environ. Res. Public Health 2019, 16, 2832. [Google Scholar] [CrossRef]
  22. Aschengrau, A.; Winter, M.R.; Gallagher, L.G.; Vieira, V.M.; Butler, L.J.; Fabian, M.P.; Carwile, J.L.; Wesselink, A.K.; Mahalingaiah, S.; Janulewicz, P.A.; et al. Reproductive and developmental health effects of prenatal exposure to tetrachloroethylene-contaminated drinking water. Environ. Sci. Processes Impacts 2020, 22, 555–566. [Google Scholar] [CrossRef]
  23. Ho, C.K.; Lindgren, E.R.; Rawlinson, K.S.; McGrath, L.K.; Wright, J.L. Development of a surface acoustic wave sensor for in-situ monitoring of volatile organic compounds. Sensors 2003, 3, 236–247. [Google Scholar] [CrossRef]
  24. Zeng, G.; Wu, C.; Chang, Y.; Zhou, C.; Chen, B.; Zhang, M.; Li, J.; Duan, X.; Yang, Q.; Pang, W. Detection and discrimination of volatile organic compounds using a single film bulk acoustic wave resonator with temperature modulation as a multiparameter virtual sensor array. ACS Sens. 2019, 4, 1524–1533. [Google Scholar] [CrossRef]
  25. Potyrailo, R.A.; May, R.J.; Sivavec, T.M. Recognition and quantitation of closely related chlorinated organic vapors with acoustic-wave chemical sensor arrays. Intern. Stand. Calibration Archit. Chem. Sens. SPIE 1999, 3856, 80–87. [Google Scholar]
  26. Poplavko, Y.M.; Yakimenko, Y. Functional Dielectrics for Electronics: Fundamentals of Conversion Properties; Woodhead Publishing: Sawston Cambridge, UK, 2020. [Google Scholar]
  27. Bhadauria, A.; Panchal, B.; Varghese, S. Enhancing Q-factor using fractal electrodes in Film Bulk Acoustic Resonator for wireless applications. In Proceedings of the IEEE 2016 Asia-Pacific Microwave Conference (APMC), New Delhi, India, 5–9 December 2016. [Google Scholar]
  28. Grate, J.W.; Patrash, S.J.; Abraham, M.H. Abraham. Method for estimating polymer-coated acoustic wave vapor sensor responses. Anal. Chem. 1995, 67, 2162–2169. [Google Scholar] [CrossRef]
  29. Ralib, A.A.; Omar, A.S.S. An Investigation of The Sensitivity Of Polymer-Coated Surface Acoustic Wave-Based Gas Sensors In The Detection Of Volatile Organic Compounds. IIUM Eng. J. 2021, 22, 168–177. [Google Scholar] [CrossRef]
  30. Sayago, I.; Fernández, M.; Fontecha, J.; Horrillo, M.; Vera, C.; Obieta, I.; Bustero, I. Surface acoustic wave gas sensors based on polyisobutylene and carbon nanotube composites. Sens. Actuators B Chem. 2011, 156, 1–5. [Google Scholar] [CrossRef]
  31. COMSOL Multiphysics. Available online: https://www.comsol.com/support/knowledgebase/875 (accessed on 16 August 2022).
  32. COMSOL Multiphysics. Available online: https://www.comsol.com/blogs/much-memory-needed-solve-large-comsol-models/ (accessed on 16 August 2022).
  33. Liu, C.-Y.; Deb, M.; Sadhu, A.S.; Karmakar, R.; Huang, P.-T.; Lin, Y.-N.; Chu, C.-S.; Pal, B.N.; Chang, S.-H.; Biring, S. Resolving cross-sensitivity effect in fluorescence quenching for simultaneously sensing oxygen and ammonia concentrations by an optical dual gas sensor. Sensors 2021, 21, 6940. [Google Scholar] [CrossRef]
  34. Kim, K.; Lee, T.H.; Kang, D.H.; Kwon, H.B.; Lee, S.M.; Yoo, S.J.; Hong, U.S.; Kim, Y.J. Ammonia Cross-Sensitivity Eliminatin Method of NOx Sensor for UREA-SCR (Selective Catalytic Reduction) System. In Proceedings of the 20th International Conference on Solid-State Sensors, Actuators and Microsystems & Eurosensors XXXIII (TRANSDUCERS & EUROSENSORS XXXIII), IEEE, Berlin, Germany, 23–27 June 2019. [Google Scholar]
  35. Hsieh, M.F.; Wang, J. An extended Kalman filter for NO x sensor ammonia cross-sensitivity elimination in selective catalytic reduction applications. In Proceedings of the 2010 American Control Conference, IEEE, Baltimore, MD, USA, 30 June–2 July 2010. [Google Scholar]
  36. Hong, H.S.; Kim, J.W.; Jung, S.J.; Park, C.O. Suppression of NO and SO2 cross-sensitivity in electrochemical CO2 sensors with filter layers. Sens. Actuators B Chem. 2006, 113, 71–79. [Google Scholar] [CrossRef]
  37. Chen, D.; Yang, L.; Yu, W.; Wu, M.; Wang, W.; Wang, H. Micro-electromechanical acoustic resonator coated with polyethyleneimine nanofibers for the detection of formaldehyde vapor. Micromachines 2018, 9, 62. [Google Scholar] [CrossRef]
  38. Penza, M.; Aversa, P.; Cassano, G.; Suriano, D.; Wlodarski, W.; Benetti, M.; Cannata, D.; Di Pietrantonio, F.; Verona, E. Thin-film bulk-acoustic-resonator gas sensor functionalized with a nanocomposite Langmuir–Blodgett layer of carbon nanotubes. IEEE Trans. Electron Devices 2008, 55, 1237–1243. [Google Scholar] [CrossRef]
  39. Xu, S.; Zhang, R.; Cui, J.; Liu, T.; Sui, X.; Han, M.; Zheng, F.; Hu, X. Surface Acoustic Wave DMMP Gas Sensor with a Porous Graphene/PVDF Molecularly Imprinted Sensing Membrane. Micromachines 2021, 12, 552. [Google Scholar] [CrossRef]
  40. Lee, S.; Lee, J. Gas-Phase Nitroaromatic Detection Based on Sulfonated Tetrafluoroethylene and Its Field Application. Sens. Mater. 2014, 26, 753–762. [Google Scholar]
Figure 1. (a) Schematic of FBAR structure with Polyisobutylene (PIB) layer. Meshed COMSOL model of FBAR with (b) planar electrode, and (c) 3rd-order Hilbert fractal electrode.
Fractalfract 06 00491 g001
Figure 2. Butterworth-Vandyke (BVD) Equivalent circuit of FBAR.
Fractalfract 06 00491 g002
Figure 3. Convergence study of COMSOL FBAR FEM model.
Fractalfract 06 00491 g003
Figure 4. The eigen−mode of FBAR at resonance with (a) planar electrode and (b) fractal electrode. (The unit of displacement in the legend is µm).
Fractalfract 06 00491 g004
Figure 5. Electric field lines of (a) planar electrode and (b) fractal electrode.
Fractalfract 06 00491 g005
Figure 6. The capacitance of fractal electrode-based FBAR with different fractal space (S) for different active areas (the unit of area in the legend is µm2).
Fractalfract 06 00491 g006
Figure 7. (a) Thickness optimization and (b) area optimization of fractal electrode-based FBAR with PIB layer in order to obtain high sensitivity.
Fractalfract 06 00491 g007
Figure 8. Reflection |S11| parameter of the 1 µm PIB−coated planar and fractal electrode-based FBAR for 0 and 1000 ppm PCE gas exposure.
Fractalfract 06 00491 g008
Figure 9. The frequency shifts of 1µm polyisobutylene-coated FBAR resonator exposed to various gas concentrations ranging from 1 to 1000 ppm, (a) without fractal electrode geometry, and (b) with fractal electrode geometry.
Fractalfract 06 00491 g009
Table 1. Parameters of PIB used for simulation.
ParameterValue for PIB
Relative permittivity of PIB2.2
Density (kg/m3)918
Young modulus (GPa)10
Poisson’s Ratio of PIB0.48
Table 2. The parameters of the organic gas used for simulation.
GasPartition Coefficient
(k) for PIB/Gas
Molar Mass of Gas
(g/mol)
CM3.5750.4
DCM30.3485.0
TCM84.58119.5
CCl4160.69153.8
TCE250.84131.4
PCE954.77165.83
Table 3. Optimization of the fractal gap of the FBAR.
Fractal Spacing
S (µm)
FrequenciesQuality FactorsCoupling Coefficient
(%)
fr (GHz)fa (GHz)QrQa
0.11.9522.030280.042274.6379.12
0.21.9542.032278.446274.4869.11
0.31.9562.034294.282288.4369.10
0.41.9582.038298.014304.3759.31
0.51.962.038305.834301.8029.08
0.61.962.038322.804309.9409.08
0.71.962.044328.194325.9529.72
0.81.9562.064344.206310.51912.24
0.91.9722.060342.295316.40110.09
1.01.9762.059348.082325.2799.55
1.11.9842.066329.847311.5699.40
1.21.9862.062317.600310.9928.76
1.31.9882.066319.286312.4688.96
1.41.992.066322.459311.0978.74
1.51.9922.068329.048317.4608.73
Table 4. Sensitivity to different gas exposure.
Gas
Exposure
Sensitivity (S) (kHz/ppm)
PlanarFractal
CM0.0030.004
DCM0.0460.057
TCM0.1810.220
CCl40.4420.529
TCE0.5890.700
PCE2.9094.833
Table 5. Equivalent circuit parameters for PIB-coated FBAR.
TypeGas
Concentration (ppm)
Rm (Ohm)Lm (µH)Cm (fF)C0 (pF)
Planar023.470.6865.9840.201
100023.640.6885.9750.201
Fractal014.360.7055.6830.192
100013.630.6626.0790.192
Table 6. Comparison of VOC gas sensors reported in the literature.
ReferenceVolatile Organic Compound (VOC) GasType of DeviceResonance Frequency (fr)Sensitivity (S)
Present WorkTetrachloroethene (PCE)FBAR2.5 GHz4.833 kHz/ppm
[37]FormaldehydeFBAR4.4 GHz1.216 kHz/ppb
[38]AcetoneFBAR1.045 GHz12 kHz/ppm
[38]EthylacetateFBAR1.045 GHz17.3 kHz/ppm
[39]Dimethyl methyl phosphonate (DMMP)SAW delay line433 MHz1.407 kHz/ppm
[40]2,4-dinitrotoluene (DNT)QCM5 MHz33.52 Hz/ppb
Note: ppm = parts per million, ppb = parts per billion.
Publisher’s Note: MDPI stays neutral with regard to jurisdictional claims in published maps and institutional affiliations.

