Article

Study on Uniaxial Compression Deformation and Fracture Development Characteristics of Weak Interlayer Coal–Rock Combination

1
School of Energy and Mining Engineering, China University of Mining and Technology (Beijing), Beijing 100083, China
2
Coal Mining Branch, China Coal Research Institute, Beijing 100013, China
3
CCTEG Coal Mining Research Institute, Beijing 100013, China
4
School of Safety Science and Engineering, Anhui University of Science & Technology, Huainan 232001, China
*
Author to whom correspondence should be addressed.
Fractal Fract. 2023, 7(10), 731; https://doi.org/10.3390/fractalfract7100731
Submission received: 24 August 2023 / Revised: 29 September 2023 / Accepted: 29 September 2023 / Published: 2 October 2023
(This article belongs to the Special Issue Applications of Fractal Analysis in Underground Engineering)

Abstract

:
With increases in mining depth and intensity, disasters such as stress concentration, slab failure, and coal body dynamic outbursts at the coal–rock interface have become more serious. Therefore, it is important to analyze the stress–strain behavior of coal–rock combinations to explore the deterioration process and failure characteristics of coal–rock combinations. In this study, we used field survey, theoretical analysis, and numerical simulation methods to explore the microstructure characteristics of the coal–rock interface and the influence of interlayer thickness on the composite body. The results show that with the increase in interlayer thickness, the compressive strength of the composite body gradually decreases. This reduction is mainly due to the interlayer dividing the coal sample, resulting in a decrease in the equivalent elastic modulus of the composite body, weakening of the overall integrity, and a decrease in carrying capacity. In addition, the failure mode and mechanical properties of the coal–rock combination are influenced by the interlayer position. Different “soft layer” positions can lead to changes in the overall carrying and failure modes of the coal–rock composite. The position of the interlayer also has a significant influence on the failure mode and fracture propagation of the composite body. This study provides an important theoretical reference for the control of coal–rock deformation and instability and regional rock mass modification in underground engineering.

1. Introduction

In recent years, there has been a significant increase in the development of large mining heights and ultra-thick coal seams, leading to a corresponding rise in mining intensity. This has resulted in a higher frequency of coal–rock strata collapse, damage, and instability, particularly at the coal–rock interface. Both national and local regulatory departments have recognized the paramount importance of addressing dynamic disasters primarily caused by coal–rock interface damage and coal pillar instability. Notably, severe roof corner damage in roadways has resulted in support failure, while coal–rock strata bearing structures have experienced varying degrees of damage, including roof collapse at the corner of roadways during coal mine development. Such occurrences pose concealed risks to the overall structural stability of coal–rock formations.
Regarding the combination mode of coal and rock, Zhao Guangming et al. [1] studied the dynamic impact compression characteristics of granitic rock under the condition of a difference in the height–diameter ratio, and analyzed the absorbed energy of the fractured rock samples. Chen Guangbo et al. [2,3,4] observed the influence of rock strength and the coal–rock height ratio on the strength characteristics and failure mechanism of a coal–rock assemblage. Song Hongqiang et al. [5] compared the generalized Poisson ratio of materials at different positions with the generalized Poisson ratio of standard coal and sandstone samples, analyzed the ultimate compressive strength of materials at different positions in the combined model and concluded that the mechanical properties of soft rock–coal combined samples are primarily affected by coal. Moreover, the interface constraint reduces the strength of sandstone near the interface, while it enhances the strength of coal near the interface. Gao Fuqiang et al. [6] explored the brittle failure of composite materials with interactions and energy feedback between different materials and studied the brittle failure mode of coal–rock composite materials under uniaxial compression through laboratory tests and numerical simulation. Zhang Heng et al. [7] introduced the failure form of coal and gangue composite structures and explored the precursor signal characteristics of failure and instability of coal and gangue composite structures under an unloading path. Guo Weiyao et al. [8,9,10] simulated uniaxial and biaxial compression tests of a coal–rock composite specimen with different coal–rock strength ratios and height–diameter ratios by using PFC2D 5.0 particle flow software. Wu Genshui et al. [11] carried out research on the influence of coal–rock mass structure and fracture on the stability of a coal–bolt composite system and carried out experimental analysis and theoretical verification on the RCB composite system at different angles. Zhang Zetian et al. [12,13] analyzed the influence of a combination mode and inclination effect on the mechanical properties and failure characteristics of a coal–rock combination.
Regarding the failure mechanism of the combination, Xiao Xiaochun et al. [14] studied the damage characteristics and mutation failure mechanism of coal and rock using experimental and theoretical methods, and established the relationship between the fractal dimension and coal and rock damage, the release energy density change rate, and the acoustic emission energy change rate. Yu Weijian et al. [15] analyzed the loading failure law of a coal–rock combination with different height ratios through a uniaxial loading test of a “rock–coal–rock” combination with different height ratios and analyzed the whole process of fracture development of the combination through indoor uniaxial loading and particle flow. Yang Ke et al. [16] compared and analyzed the progressive failure mechanism of a sandstone–coal pillar structure, and observed that the integrity failure of the combination was caused by the expansion of fractures inside the coal sample to the sandstone. Dou Linming et al. [17,18,19,20,21,22] conducted in-depth research on the impact tendency of the assemblage, noting that the impact tendency index of the coal–rock assemblage was greater than that of the pure coal sample. Yang Lei et al. [23,24] studied the energy evolution law and failure mechanism of a coal–rock assemblage under cyclic loading and unloading. Zhao Zenghui et al. [25] established an equivalent model of the coal–soft rock interface bonding strength and analyzed the influence of the interface cohesion, rock thickness, and stress level of the coal mudstone sample on the failure behavior of the combined model. Wang Zhengyi et al. [26,27] studied the failure characteristics and failure forms of composite coal and rock mass under static and dynamic loads. Hasan et al. [28,29] used non-destructive acoustic emission and ultrasonic technology to characterize the deformation stages of weathered sandstone, composite sandstone (sandstone-shale-sandstone), and shale samples under the action of uniaxial compressive stress, and based on advanced Non-destructive technology to reflect the deformation process of composite rock materials. In order to achieve effective early warning of uniaxial compression failure of coal samples, Xiong Yu et al. [30,31] used digital speckle technology to analyze the evolution process of the crack field and strain field of coal samples from both global and local aspects and clarified the development of coal sample cracks. Laws and strain evolution characteristics. Precursor information and early warning indicators of coal sample damage were obtained. The above teams have carried out different degrees of experimental research and analysis on the aspects of coal and rock height–diameter ratios, coal, and rock combination forms, sample prefabricated fractures or holes, fracture inclination, and so on, as well as analyzing the failure characteristics of different forms of combinations.
In respect of modification research, Kang Hongpu et al. [32,33,34] observed that current roadway modification mainly refers to grouting technology, which is used for reinforcing the surrounding rock of roadways. From grouting reinforcement theory to the detection effect, the grouting reinforcement effect is determined to guide the design of grouting parameters. Li Wenzhou et al. [35] analyzed and studied the influencing factors of the deformation and failure of a coal–rock mass and the strengthening mechanism of modification. In order to improve the grouting reinforcement effect of a fractured rock mass, Zhang Jinpeng et al. [36] first proposed the self–stress grouting reinforcement theory and developed a material for self–stress grouting. The expansion stress of the self–stress grouting material was tested using a self–developed test device, and the relationship between the expansion stress and the content of the expansion agent was analyzed. Wang Zhi et al. [37,38] studied the mechanical properties of grouting reinforcements in rock under static and cyclic impact loads and used a drop hammer impact test device to study a failure mechanism and damage evolution model of red sandstone samples with different grouting types.
The aforementioned research demonstrates that the deformation characteristics of coal and rock assemblages are of guiding significance for theoretical and field research. However, the deformation and failure of coal and rock assemblages are affected by the geometric parameters and mechanical properties of the assemblage. In particular, the deformation and failure of assemblages need to be carefully studied from the perspective of their stress–strain behavior and the bearing characteristics of the assemblages. At present, the stress–strain behavior characteristics of a weak interlayer combination have not been studied. Such studies can be used to provide a theoretical basis and effective measures for strengthening and improving coal and rock combinations, and improving roadways, working face walls, failure, and instability.

2. Preparation and Microscopic Analysis of Weak Interlayer Coal–Rock Combination

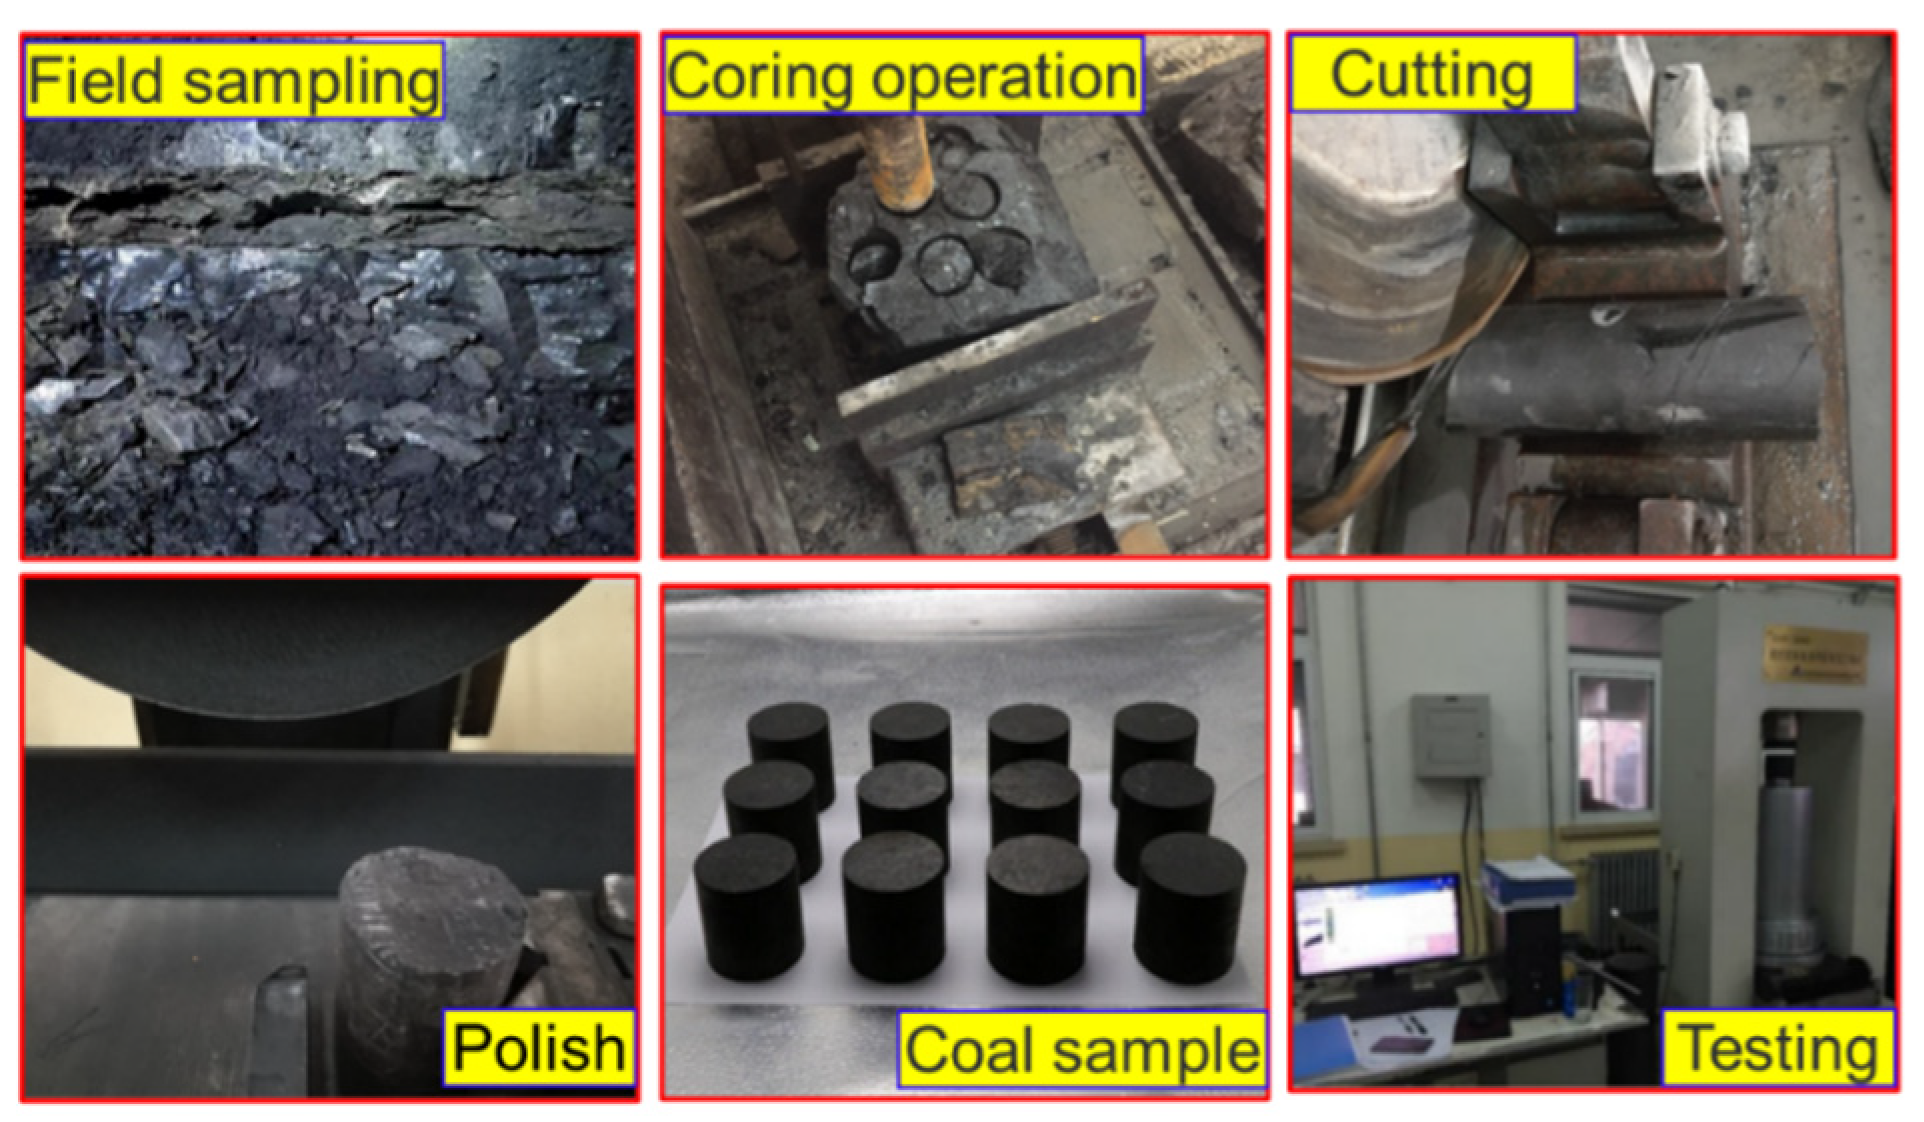
2.1. Weak Interlayer Coal–Rock Combination Sample Preparation

In the process of roadway excavation, due to the existence of weak mudstone binder, mudstone deformation, and failure occur under the condition of water, resulting in deformation, failure, and fracture development at the interface of the roadway side and the dirt binder, especially coal wall failure at the interface, as shown in Figure 1. The test samples were obtained from the 5−2 coal seam of a mine located in Shaanxi Province, China. As per the standards set by the International Society of Rock Mechanics, a cylindrical coal specimen with a diameter of 50 mm was initially drilled from the coal block using a core drilling rig. Subsequently, the specimen was cut to the desired height using a rock saw and then ground with a surface grinder at both ends. It was necessary to ensure that the non-parallelism at both ends of each sample did not exceed 0.03 mm and that the diameter deviation at both ends did not exceed 0.02 mm. This process resulted in the creation of a test piece measuring φ 50 mm × 50 mm, as shown in Figure 1.
To study the damage characteristics of the interlayer thickness on the assemblage and explore the influence of the energy evolution law of the assemblage, cement was selected according to the thickness distribution of the interlayer layer in the coal mine site. Fly ash with a 1:3 ratio was used to make the interlayer material; the fly ash was grade II ash, and the cement was grade 42.5 ordinary Portland cement. By comparing the maintenance after 1, 7, and 14 days, the sample strength after 14 days was stable according to the test results. The test data are shown in Table 1.
The thickness of the interlayer was determined based on the thickness distribution and proportion of the coal body in the site. An amount of 1/10 of the standard coal sample height was taken as the benchmark; that is, the interlayer thickness was 10 mm. The variation range of the interlayer thickness was controlled between 0.6 and 1.5, so the minimum value was 6 mm and the maximum value was 15 mm. The test objects were classified into four groups. Group A consisted of pure coal composite specimens, Group B comprised coal and 6 mm interlayer composite specimens, Group C consisted of coal and 10 mm interlayer composite specimens, and Group D included coal and 15 mm interlayer composite specimens. Both the pure coal and the coal used in the composite test pieces were obtained from the same large briquette. Each group consisted of three samples: pure coal, 6 mm interlayer or 10 mm interlayer, and 15 mm interlayer sandwich assemblies. Mechanical tests were conducted on the composite samples to determine their mechanical parameters, as shown in Figure 2.

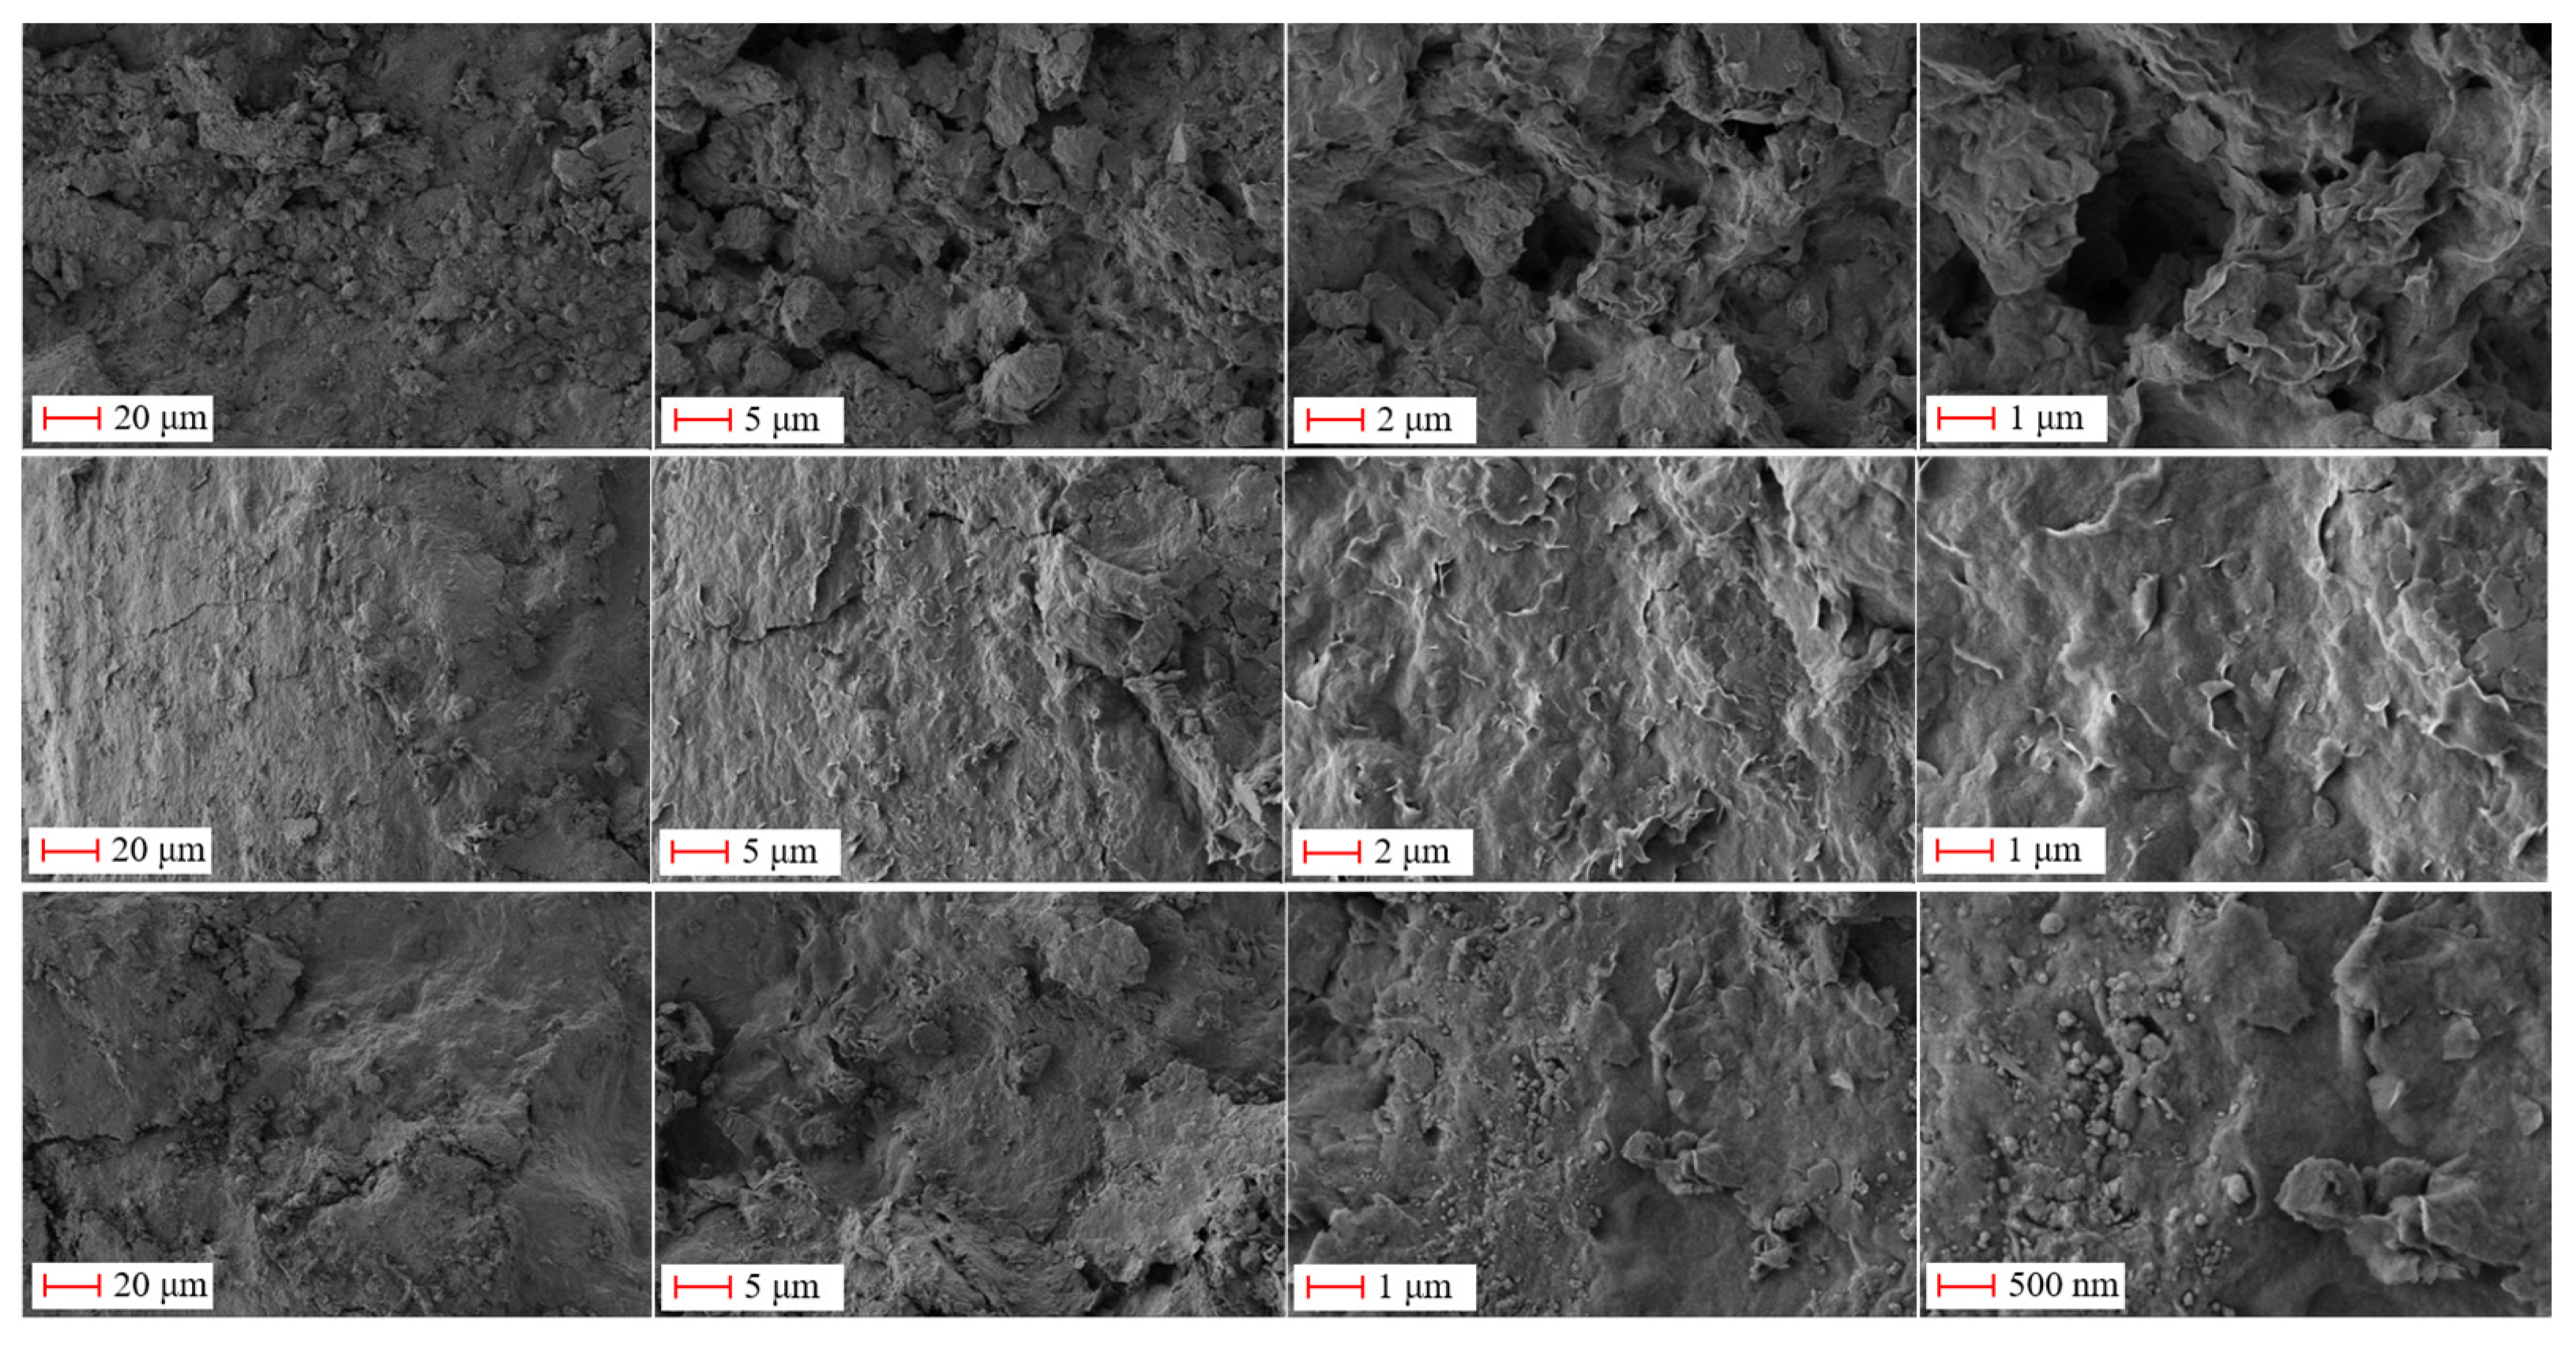
2.2. Microscopic Analysis of Weak Interlayer Coal–Rock Combination

The relationship between coal deformation characteristics and strength does not adhere strictly to a direct correspondence. This is primarily because other factors come into play, such as the presence of coal inclusions within coal seams, the anisotropy of the coal structure, and the existence of potential internal defects [18]. Following the formation of underground roadways and the surrounding rock in a coal mine, the coal and rock mass undergo deformation, and in certain cases, lamination occurs due to the influence of in–situ stress from various directions. The extent of deformation and lamination in the coal and rock mass ultimately contribute to its eventual failure. In this study, the combination of microscopic scanning, laboratory tests, and analysis of the coal seam and interlayer composite allowed for the examination of the evolution characteristics between the two. This analysis was conducted in conjunction with an assessment of the distribution patterns of failure fractures within the coal and interlayer.
The on-site coal seam exhibits a heterogeneous and porous structure, with its mechanical properties often closely linked to its microstructure. To further analyze the microstructural characteristics of the interface between the coal body and the gangue combination, scanning electron microscope (SEM) tests were conducted on parallel slices using ZEISS Genmini360 (Germany) field emission electron microscopy. The test findings are presented in Figure 3. The results reveal the prominent presence of flaky structures on the surface of the gangue, aligned parallel to the arrangement of minerals. Additionally, a small quantity of flaky minerals and granular minerals are distributed alternately. Moreover, extensively developed micro–fractures, primarily schistosity planes, appear parallel to the schistosity direction. However, there are relatively few micro–fractures in the vertical splitting direction, predominantly occurring at mineral edges. The surface of the coal body exhibits distinct differences from that of the gangue. Spherical particles with gradually rounded irregular edges comprise the microstructure of the coal body surface. Numerous fissures exist among the mineral particles, and intergranular pores are abundant, with small particles filling these pores. The presence of the schistosity plane and the micro–fractures parallel to it contribute to the relatively loose structure of the coal.

3. Uniaxial Compression of Weak Interlayer Coal–Rock Combination

3.1. Laboratory Experiments

Firstly, uniaxial compression tests were conducted on various samples: a standard coal sample (φ 50 mm × 100 mm), pure coal combinations (two at φ 50 mm × 50 mm each), and combinations with interlayer thicknesses of 6 mm, 10 mm, and 15 mm. A TAW–3000 electro–hydraulic servo testing machine (China) was used for the tests. We initially examined the basic physical and mechanical parameters of a single standard coal sample and pure coal composite specimens. Subsequently, we performed uniaxial loading tests on interlayer composites with different thicknesses. The loading method used was displacement–controlled, with a loading speed of 0.005 mm/s, until the sample became unstable and was destroyed. Table 2 presents the measured physical and mechanical parameters of the sample. An analysis was conducted of the fracture evolution and macroscopic failure characteristics of the composite.
The strain monitoring system adopts Digital image correlation (DIC). It is a non-contact measurement method for the deformation and displacement field of the research object based on the random distribution of spots on the specimen surface and the correlation before and after image deformation. The strain field cloud images obtained through the speckle test primarily captured the rectangular region situated above the fractures near the gangue and the coal seam. One image was selected every 3 ms, specifically highlighting different loading stages to document the deformation and growth of fractures within the analyzed sample. Throughout this process, the change in strain field data was determined by utilizing the first cloud image collected at a high speed as the reference value. Figure 4 displays the evolution of the main strain field as the fracture penetrates through the collection area at the point of partial failure of the composite coal sample.
The deformation characteristics of the coal–interbed composite are influenced by various factors, including the characteristics of the structural surface at the interface, the composition of the filling material, and the degree of cementation. When the filling material on the structural surface lacks cementation, the strength of the structural surface is lower than that of the coal body, resulting in a weak structural surface. Conversely, if the filling material on the structural surface exhibits rock erosion or calcareous cementation, the strength of the structural surface becomes higher than that of the upper and lower coal bodies, indicating a non–weak structural surface. The deformation behavior of the composite is further determined by the interlayer strength and magnitude of deformation. When the interlayer possesses high strength and undergoes minimal deformation, the primary strain energy is concentrated within the coal body itself and near the interlayer interface. However, when the interlayer exhibits low strength and experiences significant deformation, the main damage occurs at the interlayer, focusing on the coal adjacent to the interlayer contact interface. Moreover, the mechanical properties of the composite are closely associated with the bearing capacity of the interlayer itself. Therefore, 1–5# monitoring points were strategically positioned near the interlayer, as illustrated in Figure 5. In this study, we define the displacement pull of the monitoring points as positive and pressure as negative. By analyzing the strain evolution curves corresponding to the fixed monitoring points, we can gain insights into the deformation characteristics of the interlayer as well as the upper and lower coal bodies within the composite.

3.2. Analysis of Experimental Results

3.2.1. Deformation and Failure Characteristics of Coal–Rock Combination

Through comparison of the experimental data (shown in Table 2), it was observed that the compressive strength of the composite decreases as the interlayer thickness increases. At an interlayer thickness of 15 mm, this constitutes 13% of the composite, leading to an overall compressive strength reduction of 5.74 MPa, which is 77.2% lower than that of the standard coal sample. The composite’s resistance to deformation is primarily influenced by the individual bearing capacity of the coal sample and the interlayer, as well as their coordinated deformation capability. The presence of the interlayer causes a decrease in its equivalent elastic modulus, compromising the composite’s integrity and overall bearing capacity.
The load–bearing structure of the coal–interlayer combination is not only dependent on the mechanical properties of the coal sample and the interlayer itself but also closely related to the interlayer’s position and thickness. DIC was utilized to analyze the overall stress–strain characteristics of the coal sample during the composite’s bearing process, uncovering deformation incompatibility and strain concentration within the composite. To illustrate the evolution of the overall strain field during uniaxial compression, a typical representative composite with an interlayer thickness of 6 mm was selected for analysis, as depicted in Figure 6. During stage 1, when the external load is low, noticeable strain concentration occurs at the interlayer, particularly at the interface between the edges of both sides of the coal sample and the interlayer. At this stage, the composite bears a relatively low-stress level. In stage 2, as the load increases, the location of strain concentration shifts and adjusts to a weaker point. The composite specimen exhibits a gradual increase in strain at the “coal sample–interlayer” interface, indicating a certain degree of strain concentration. The strain at the interface between the middle and lower coal samples and the interlayer is greater than that at the interface between the upper coal sample and the interlayer, resulting in an increase in bearing strength for the lower coal sample. Stage 3 is characterized by a further increase in the degree of strain concentration at the interface between the coal sample in the lower part of the composite and the interlayer, while the degree of strain concentration in the coal sample in the upper part of the interlayer decreases. With the increasing load, fractures at stress concentration points expand and develop. Lastly, in stage 4, as the bearing stress reaches the ultimate strength of the composite, prominent fractures emerge in the coal sample within the composite. Additionally, small coal particles may be ejected, and even larger coal masses may detach from the combination. Beyond this stage, the combination is unable to sustain further load–bearing.
To examine the impact of various interlayer thicknesses and positions on the initiation and propagation of fractures in composites, a strain monitoring analysis was conducted at the key fracture point of each interlayer composite sample. This analysis aimed to quantify the fracture and its surrounding strain values. Figure 7 shows the curve depicting the vertical displacement of monitoring points 1–5# as a function of time during the loading process of the samples with different interlayer thickness combinations.
Under the condition of no interlayer, the displacement changes in the monitoring points at different positions of the combination were consistent. When the interlayer thickness was 6 mm, the vertical displacement of the combination under load was consistent. The vertical displacement changes in the five monitoring points remained consistent before the loading time of 57 s. After 57 s of loading, the vertical displacement of the monitoring points began to diverge. The growth rate of the vertical displacement of monitoring points 1# and 2# located in the upper part of the interlayer decreased. The trend of vertical displacement of monitoring points 3#, 4#, and 5# located in the lower part of the interlayer remained similar. The maximum vertical displacement of monitoring point 3# was 1.73 mm. The vertical displacement changes in monitoring points 1# and 2# located in the upper part of the interlayer were smaller compared to monitoring points 3#, 4#, and 5#. The maximum displacement change was 0.87 mm.
For the case where the interlayer thickness was 10 mm, the vertical displacement of each monitoring point of the combination gradually increased with the loading time during the loading process. The vertical displacement changes in each monitoring point were similar during the first 0–13 s of loading. After 13 s, the displacement of monitoring point 3# started to differ compared to the other monitoring points. When the loading time reached 34 s, the displacements of monitoring points 1# and 2# in the upper part of the interlayer, and monitoring points 4# and 5# in the lower part of the interlayer, began to diverge. At this time, the vertical displacement change rate of monitoring point 3# in the center of the interlayer increased, with a maximum displacement change of 1.24 mm. The minimum vertical displacement change in monitoring points 1# and 2# located in the upper part of the interlayer was 0.96 mm, while the maximum change in monitoring points 4# and 5# located in the lower part of the interlayer was 7.56 mm.
In the case of an interlayer thickness of 15 mm, the vertical displacement of each monitoring point of the combination changed during the loading process. The displacement of monitoring point 3# in the center of the interlayer started to change after 8 s of loading. When the loading time reached 31 s, the displacements of monitoring points 1# and 2# in the upper part of the interlayer, and monitoring points 4# and 5# in the lower part of the interlayer, began to diverge. However, the rate of change in vertical displacement of monitoring point 3# in the center of the interlayer increased, with a maximum displacement change of 1.89 mm. The minimum vertical displacement change in monitoring points 1# and 2# located in the upper part of the interlayer was 1.21 mm, while the maximum change in monitoring points 4# and 5# located in the lower part of the interlayer was 10.97 mm.

3.2.2. Deformation and Failure Characteristics of Weak Interlayer

In conjunction with the DIC non–contact stress–strain measurement system, the primary focus is to analyze the evolution of fracture growth within the interlayer itself. Throughout the entire process of composite sample failure, the phenomenon of micro–fracture nucleation caused by stress concentration results in the formation of a localized strain zone at the tip of the fracture in the lower part of the interlayer, eventually leading to the formation of a macro–fracture. Figure 8 shows the maximum principal strain evolution cloud maps of fractures at different stages in the composite with interlayer thicknesses of 6, 10, and 15 mm. The cloud maps identify key fractures. Fractures of the three thicknesses all spread from the bottom to the top, and fractures preferentially appear in the middle and then extend to both sides. Compared with the thickness of 6 mm, the fracture development at the same stage at 10 and 15 mm is more significant. From the perspective of the final fracture formation effect, the number of penetrating fractures with a thickness of 15 mm is significantly higher than that of interlayers with a thickness of 6 mm. Key fractures are identified within the cloud diagram, and the strain evolution process is divided into three distinct stages based on the fracture growth characteristics exhibited by the sample. Stage I corresponds to the fracture nucleation stage, during which the initial fracture development is not yet fully mature, and varying degrees of strain concentration occurs at the edges of the interlayer. In stage II, macroscopic fractures appear and expand in a stable manner. The primary strain zone encompasses the entire fracture, which propagates from the bottom to the top. Initially, fractures concentrate at the bottom of the interlayer, with the fracture initiation process dominated by tensile effects. At this stage, edge fractures emerge on the interlayer surface, and the accumulation of maximum principal strain is influenced by the primary fractures. Stage III signifies the stage when the sample approaches failure, marked by the initiation of secondary fractures exhibiting similar trends around the primary fractures in the interlayer. The development of these fractures is accompanied by varying degrees of principal strain and shear strain concentration. The secondary fractures gradually enlarge towards the edge of the interlayer and ultimately penetrate through, resulting in damage.
By analyzing the vertical displacement and time curves during the loading process of interlayer composites with different thicknesses at monitoring points 1#, 3#, and 4# (as shown in Figure 9), it can be observed that the vertical displacement of monitoring point 1#, located on the upper part of the interlayer, is at least 0.87 mm when the interlayer thickness is 6 mm. The maximum vertical displacement of monitoring point 4#, located in the lower part of the interlayer, is 10.97 mm when the interlayer thickness is 15 mm. The vertical displacements at different monitoring points increase as the interlayer thickness increases. Additionally, the vertical displacement change in the lower part of the interlayer becomes more significant compared to the upper part of the interlayer and the interlayer itself as the interlayer thickness increases.

4. Numerical Simulation under Uniaxial Compression of Weak Interlayer Coal–Rock Combination

4.1. Model Building

Particle flow code 2D (PFC2D) software was utilized to construct two–dimensional numerical models with varying positions and thicknesses of the interlayer. The interlayer positions were identified in the upper, middle, and lower sections of 1/4 of the model (Figure 10). The model dimensions were 0.05 m × 0.1 m (width × height), and the interlayer thicknesses were 6 mm, 10 mm, and 15 mm. The model parameters can be found in Table 1. The model without an interlayer exhibited a uniaxial compressive strength of 27.8 MPa, an elastic modulus of 1.25 GPa, and a Poisson ratio of 0.12. Loading plates were positioned at the upper and lower boundaries of the model. The loading mode of the model adopts the loading rate of the upper and lower walls as 0.001 m/s. The calculated stopping condition is that the residual strength of the sample reaches 70% of the peak strength.
According to the mechanical parameters obtained in the laboratory test, a numerical model with parallel bonding of the coal and interlayer with ϕ 50 mm × 100 mm was established. The minimum radius of the coal particle was 0.35 mm, the diameter ratio was 1.5, the minimum radius of the interlayer particle was 0.25 mm, the diameter ratio was 2.0, and the particle size was evenly distributed. The composite model with an interlayer thickness of 6 mm generated 8628 particles. Through continuous debugging of mechanical parameters and stress–strain curves, the mesoscopic parameters of each model and their numerical calculation results are finally determined in Table 3.

4.2. Evolution Characteristics of Fractures in Coal–Rock Combinations with Weak Interlayers

According to the fracture evolution characteristics observed in interlayer composites with varying positions and thicknesses, the curves depicting the fracture number and stress–loading steps can be divided into four distinct stages. These stages are as follows: (I) initial fluctuating growth stage; (II) relatively stable growth stage; (III) rapid growth stage; and (IV) decreased–fluctuation stable stage.
To investigate the impact of the interlayer position in the composite on the failure patterns of coal and rock, different positions of the interlayer were examined. The results show significant differences in the failure mode and fracture propagation of the composite sample, as illustrated in Figure 11. When the interlayer position transitioned from the upper part to the lower part, the morphology of the composite under the same strain rate loading exhibited variations. In the scenario where the interlayer was in the middle, the shear failure of the composite sample predominantly occurred in the diagonal direction between the interlayer and the lower coal sample. The shear zone of the upper coal sample was severed by the interlayer, and fracture penetration occurred between the interlayer and the lower coal sample. When the interlayer was positioned in the upper 1/4, the failure surface morphology at the upper end of the interlayer displayed a 45° oblique section, and tensile fractures parallel to the loading direction were observed. Some fractures penetrated the coal sample at its upper end. Alternatively, when the interlayer was located in the lower 3/4 position, the failure mode of the composite sample shifted from shear failure to comprehensive dilatancy failure. The coal sample was uplifted at the interlayer and interface, with fractures in the lower half of the sample penetrating down to the bottom. Additionally, the interlayer collapsed into multiple pieces.

4.2.1. Influence of the Interlayer Position on the Bearing Characteristics of Combinations

When the interlayer has a thickness of 6 mm, its positions are respectively situated in the upper 1/4, middle, and lower 3/4 of the combined sample, as depicted by the corresponding stress–strain curves in Figure 12. The test curve reveals that the interlayer positioned in the upper 1/4 has a more pronounced influence on the stress of the composite sample compared to when it is located in the middle or lower 3/4. Moreover, when the interlayer thickness is 6 mm and it is positioned in the middle or lower 3/4, the stress peak value of the composite remains relatively constant, implying consistent resistance to deformation and failure across the combination.
For the composite with a 6 mm interlayer thickness and the interlayer positioned in the middle, fracture propagation initiates with a jump, followed by similar behavior exhibited by the interlayer located in the lower part. Conversely, when the interlayer is positioned in the upper part of the composite, the fracture jump occurs at a later stage. The rates of fracture generation in the middle and lower parts of the interlayer are practically identical. However, when the interlayer is situated in the upper part, the rate of composite failure experiences a significant delay.
When the interlayer has a thickness of 10 mm, its positions are situated in the upper 1/4, middle, and lower 3/4 of the combined sample, as depicted by the corresponding stress–strain curves in Figure 13. The test curves reveal that the interlayer located in the lower 3/4 exerts a greater influence on the stress of the composite sample compared to when it is located in the middle or upper 1/4. Additionally, the peak stress of the composite in the middle of the interlayer is lower than that in the upper 1/4. As the interlayer transitions from the upper part to the lower part of the composite, the overall resistance to deformation and failure gradually weakens.
For the composite with a 10 mm interlayer thickness, when the interlayer is positioned in the upper part, fracture growth initiates with a jump, followed by similar behavior observed in the interlayer located in the lower part. Conversely, when the interlayer is positioned in the middle of the composite, the fracture jump occurs at a later stage, and the rate of fracture generation is smaller compared to the upper part of the interlayer. Furthermore, the presence of the interlayer significantly delays the final formation of fractures.
The interlayer thickness is 15 mm in the combined sample, positioned at the upper 1/4, middle, and lower 3/4. Stress–strain curves for each position are depicted in Figure 14. The test curves indicate that the interlayer positioned in the lower 3/4 weakens the strength of the composite sample. The middle and upper 1/4 positions of the interlayer have a minimal impact on the composite’s peak performance. Gradually weakening, the interlayer’s movement from the upper to the lower part of the composite reduces the overall resistance to deformation and damage.
In the 15 mm interlayer thickness combination, the fracture first appears in the upper part before progressing to the lower part of the interlayer. In the middle of the composite, the fracture appears last when the interlayer is present, and the fracture generation rate is smaller compared to the upper part of the interlayer. Additionally, the presence of the interlayer substantially delays the formation of the final fracture.

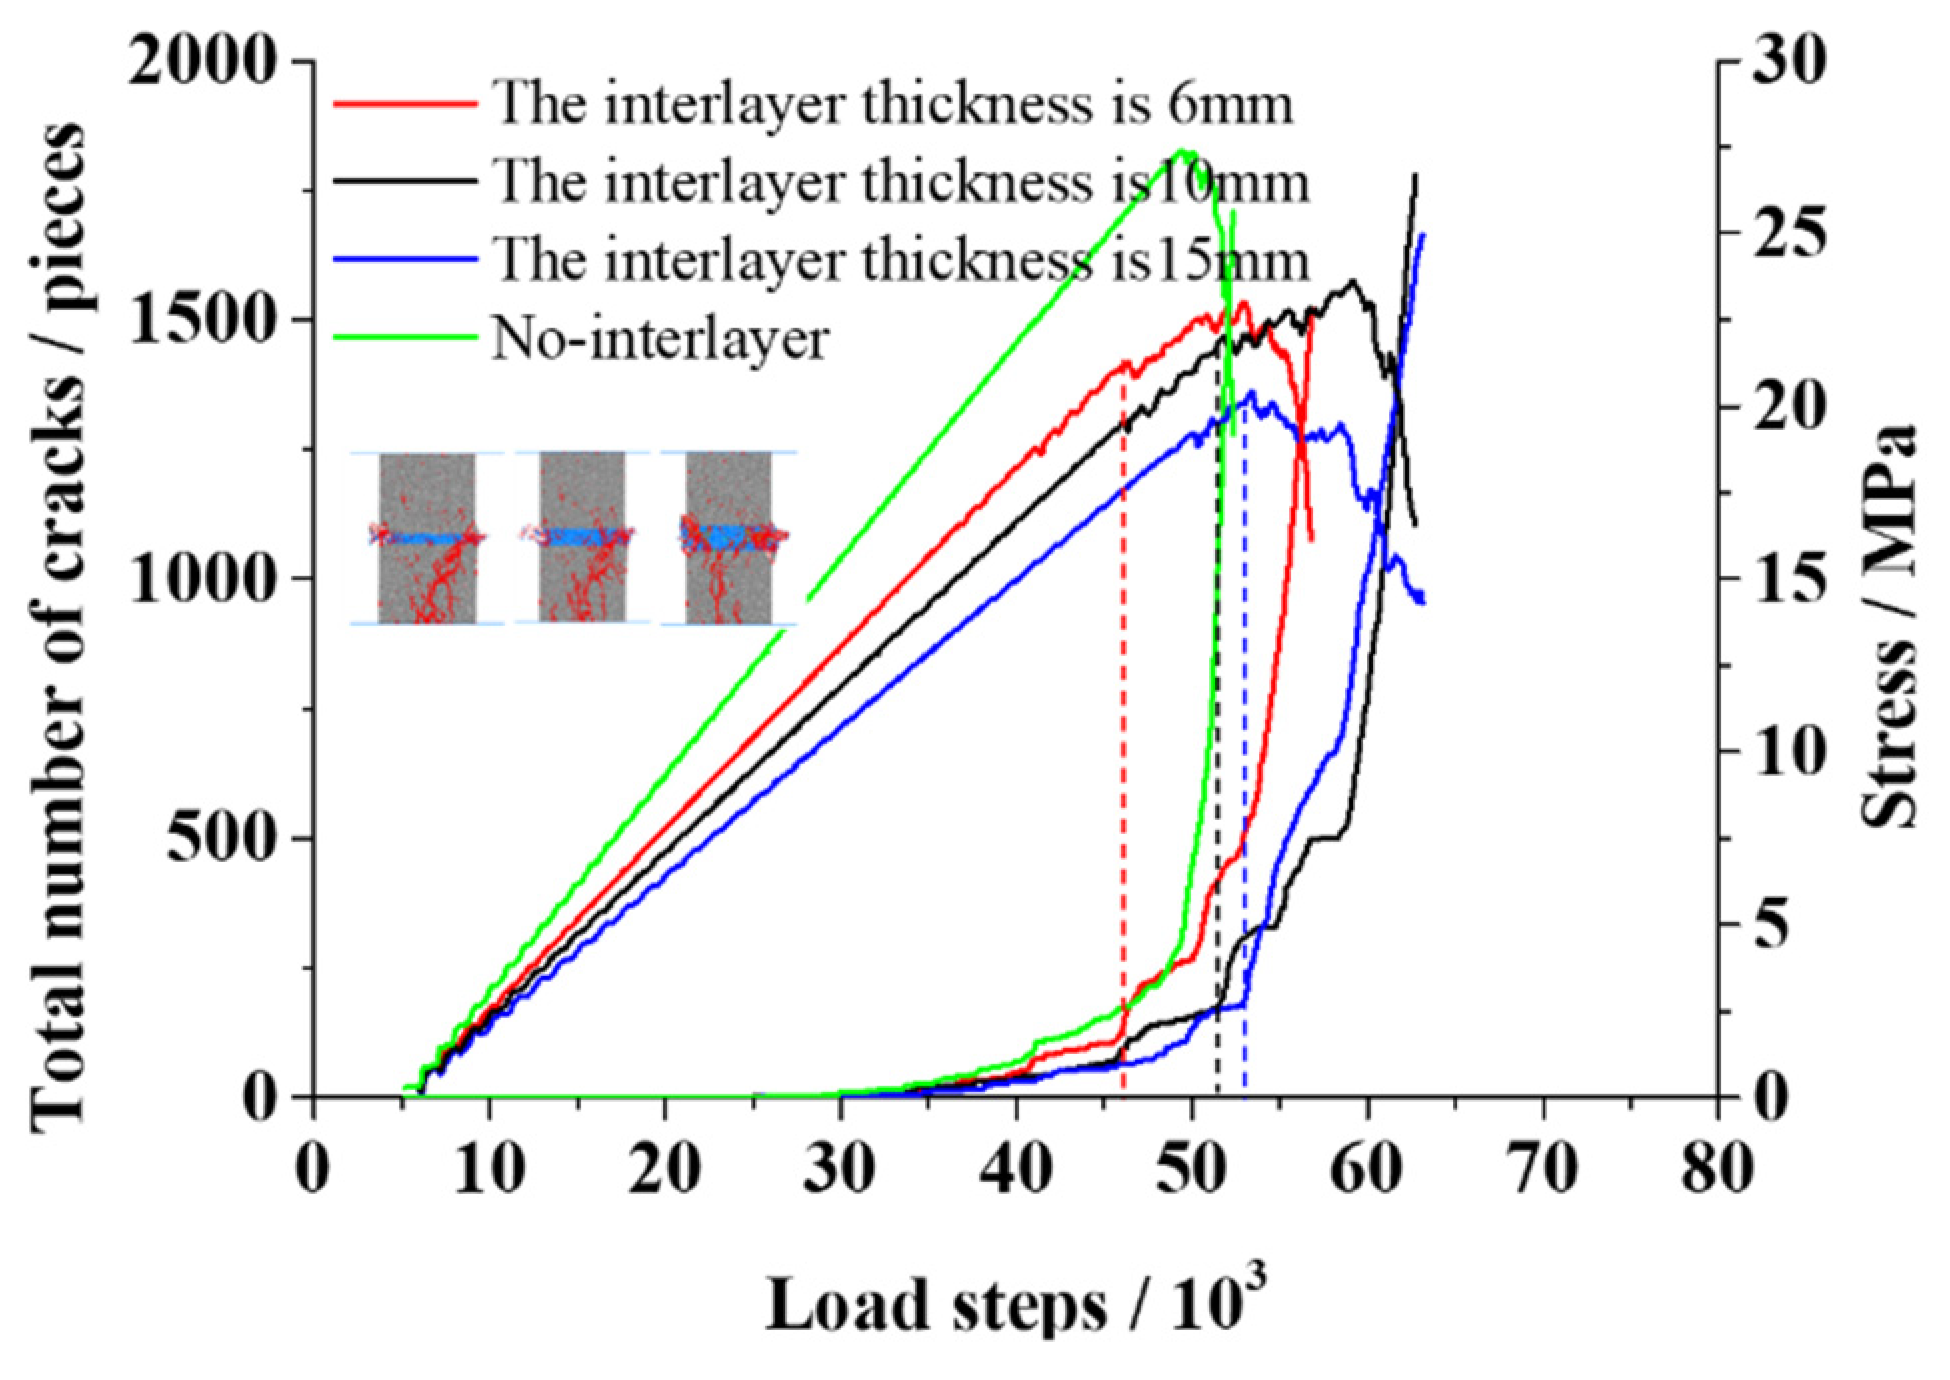
4.2.2. Influence of the Interlayer Thickness on the Bearing Characteristics of Combinations

When the interlayer is positioned in the middle of the composite, the strength of the composite sample remains relatively unaffected by changes in the interlayer thickness. However, the interlayer thickness significantly influences the strain before the combination reaches its peak value. With the increasing interlayer thickness, the strain before the composite reaches its peak value lags behind, as depicted in Figure 15, which illustrates the relationship between composite stress and fracture development. The combination with a 15 mm interlayer thickness experiences the first fracture, resulting in the most significant strength reduction of 7.31 MPa. The second case involves the fracture appearing in combination with a 6 mm interlayer thickness. Compared to the case without an interlayer, the stress peak of the composite with an interlayer lags behind, and the variation in the number of fractures reflects the composite’s strength and deformation characteristics. With varying interlayer thicknesses, the composite body undergoes four stages during compression: compaction, elasticity, yield, and failure. As the interlayer thickness increases from thin to thick, the number of fractures corresponding to the composite’s peak stress gradually increases.

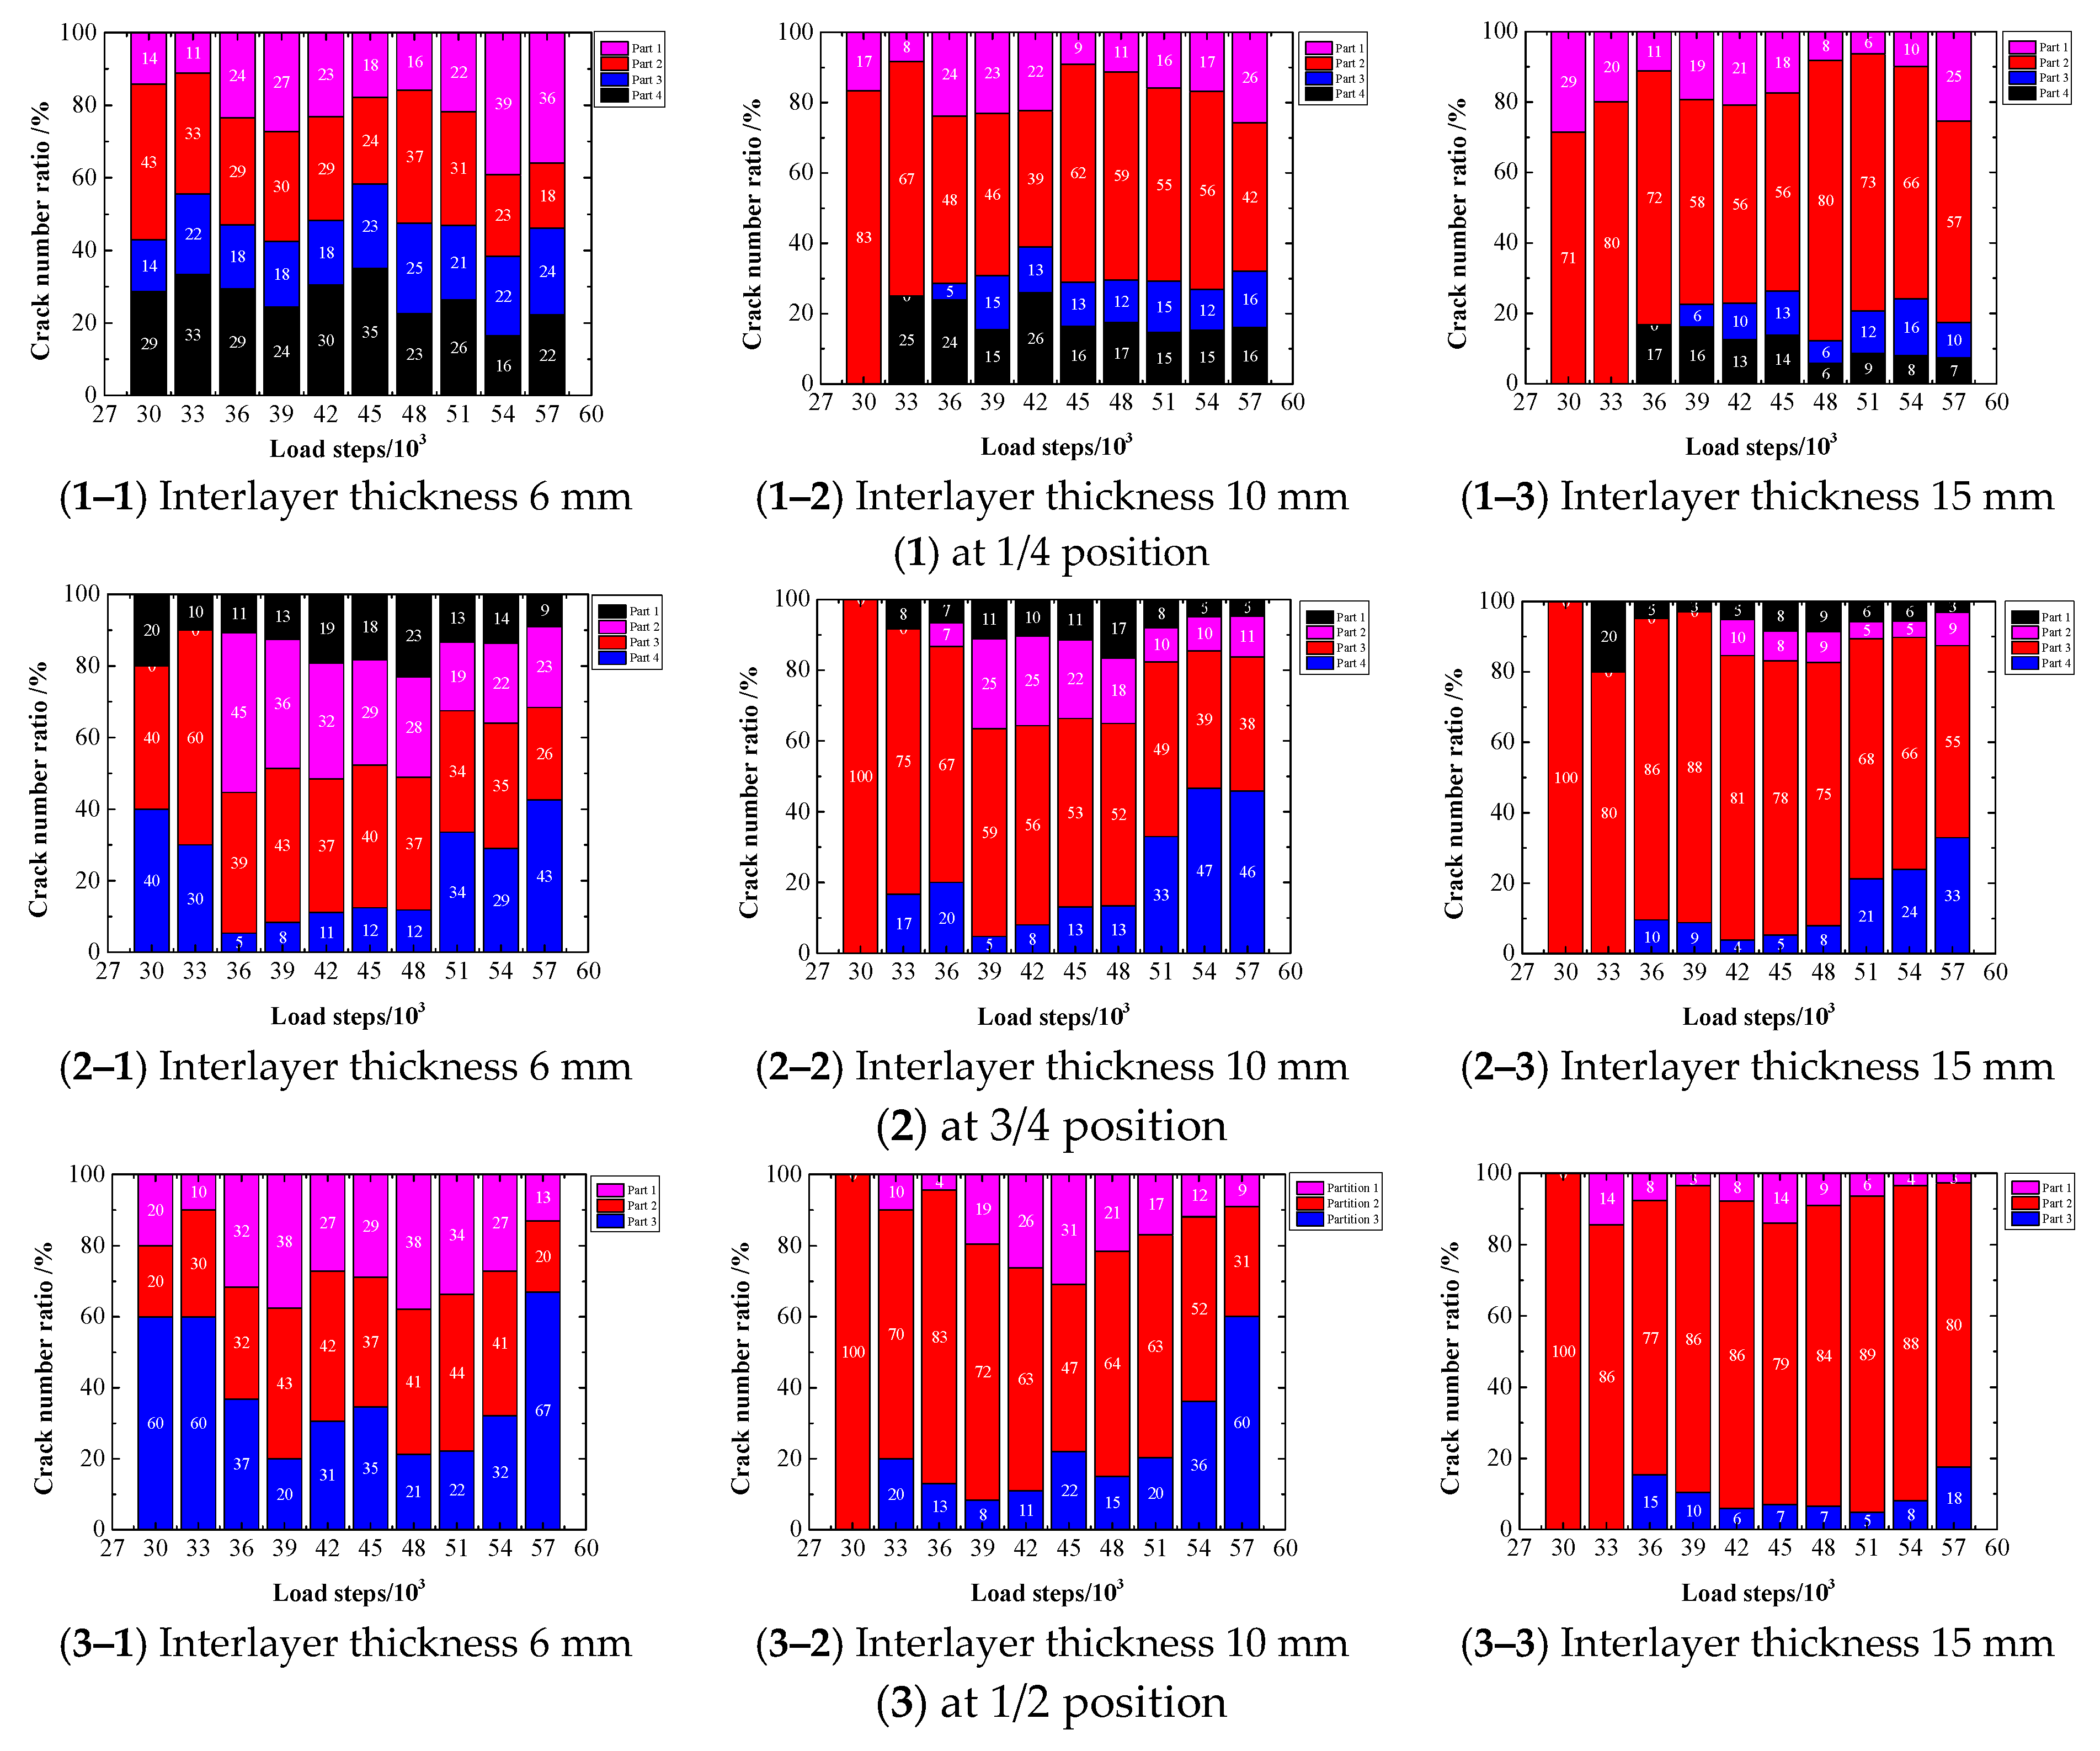
4.2.3. Influence of the Interlayer Position on the Development of Fractures in Combinations

The fracture evolution of composite specimens at different loading stages was further studied by partitioning the interlayer–upper and lower coal sample composites, as illustrated in Figure 16. The percentage of fractures in the upper and lower parts of the interlayer and its own region under various loading stages was analyzed, as shown in Figure 17.
Prior to reaching the peak stress, the interlayer fracture propagation accounted for a higher proportion compared to the number of fractures in the upper and lower coal samples. The overall trend exhibited a “decreasing–rising–decreasing” pattern. During the initial loading stage (loading steps 3~3.3 × 10⁴), the majority of fractures in the composite were generated in the interlayer itself; specifically, in Region 2. This indicates that the interlayer part of the composite specimen played the primary load–bearing role at this stage. As the loading process continued (loading steps 3.6~4.5 × 10⁴), the composite body gradually became more compacted, and the upper and lower parts of the interlayer, which constituted the filling body, began to assume a load–bearing role and give rise to a small number of microfractures. The proportion of fractures in Areas 1 and 3 began to increase. With increasing stress, microfractures in the coal sample away from the interlayer, i.e., in Area 4, gradually initiated and expanded, resulting in the formation of fractures. At this stage, the interlayer (filling body) remained compacted, and only a limited number of fractures were formed. Upon reaching the peak loading value (4.8~5.1 × 10⁴ loading steps), the coal samples in the lower part of the composite experienced significant damage. The load–bearing effect of the interlayer (filling body) increased rapidly, internal microfractures continuously appeared and expanded, and the distribution of fractures in the upper and lower regions of the interlayer changed. Specifically, the proportion of fractures in Area 1 was lower than that in Area 3. After reaching the peak loading value (loading steps 5.4~5.7 × 10⁴), a substantial number of longitudinal penetrating fractures began to appear from the interlayer, penetrating through the upper and lower coal samples of the composite. This observation indicates that the composite was on the verge of failure.
Figure 17 shows that as the position of the interlayer moves from top to bottom, the percentage of fractures in the interlayer increases from 29.7% to 35% when the interlayer thickness is 6 mm. However, when the interlayer thickness is 10 mm, the percentage of fractures in the interlayer initially increases and then decreases. The coal sample located in the lower part of the interlayer demonstrates a stronger load–bearing effect, with the number of fractures increasing from 10% to 20.2%. For a composite interlayer thickness of 15 mm, the percentage of fractures in the interlayer positioned at 1/4, the middle, and 3/4 of the composite is greater than 60%, with a maximum proportion of 85.5% when located in the middle of the composite. Among these positions, the percentage of fractures in zone 4 undergoes the most significant change, decreasing from 26.8% for a 6 mm interlayer to 8.9% for a 15 mm interlayer, representing a decrease of 3.01 times. When the interlayer is located at 3/4, the percentage of fractures in the upper part of the interlayer, i.e., zone 1, shows the greatest change, decreasing from 23.4% for a 6 mm interlayer to 4.6% for a 15 mm interlayer, representing a decrease of 5.08 times. When the interlayer is positioned in the middle, the percentages of fractures in the upper and lower parts of the interlayer display a gradual decreasing trend. Based on the evolution characteristics of interlayers with different thicknesses in the middle of the composite, it can be inferred that the composite undergoes layered compaction and fragmentation during the gradual compaction process. In terms of bearing pressure, failure initially occurs in the middle layer of the composite. As the compression level increases, the failure phenomenon gradually shifts to the upper and lower layers of the interlayer, with the percentage of fractures in the upper layer gradually increasing during the initial stage of loading as fracture development and expansion take priority. Once the composite reaches its peak loading value, the percentage of fractures in the lower layer increases, leading to gradual damage and escalation.

4.2.4. Influence of Interlayer Thickness and Position on the Fractal Dimension of Combination Fractures

The fracture image processing and quantitative analysis system (CIAS) developed by the Tang Chaosheng research group of Nanjing University (located in Nanjing, China) was used to perform fractal dimension analysis on the fractures in combination with different interlayer thicknesses and positions obtained from numerical simulation [39,40,41]. Set the threshold to 93 and the denoising intensity to 100. The influence of different interlayer thicknesses and positions on the fractal dimension of the combination fractures was obtained (as shown in Figure 18). From Figure 18, it can be seen that as the interlayer thickness increases, the fractal dimension of the fractures gradually increases. As the interlayer position moves downwards, the fractal dimension gradually decreases.

5. Conclusions

(1)
According to the results of this study, as the interlayer thickness increased, the microstructure characteristics at the interface between the coal body and gangue resulted in a gradual decrease in the compressive strength of the composite. When the interlayer thickness reached 15 mm, this accounted for 13% of the composite, and the overall compressive strength decreased to 5.74 MPa, which was 77.2% lower than that of the standard coal sample. The deformation resistance of the composite primarily depends on the bearing capacity of the coal sample and the interlayer, as well as their coordinated deformation capability. Due to the separation caused by the interlayer, the equivalent elastic modulus of the composite decreased, its integrity weakened, and its bearing capacity diminished.
(2)
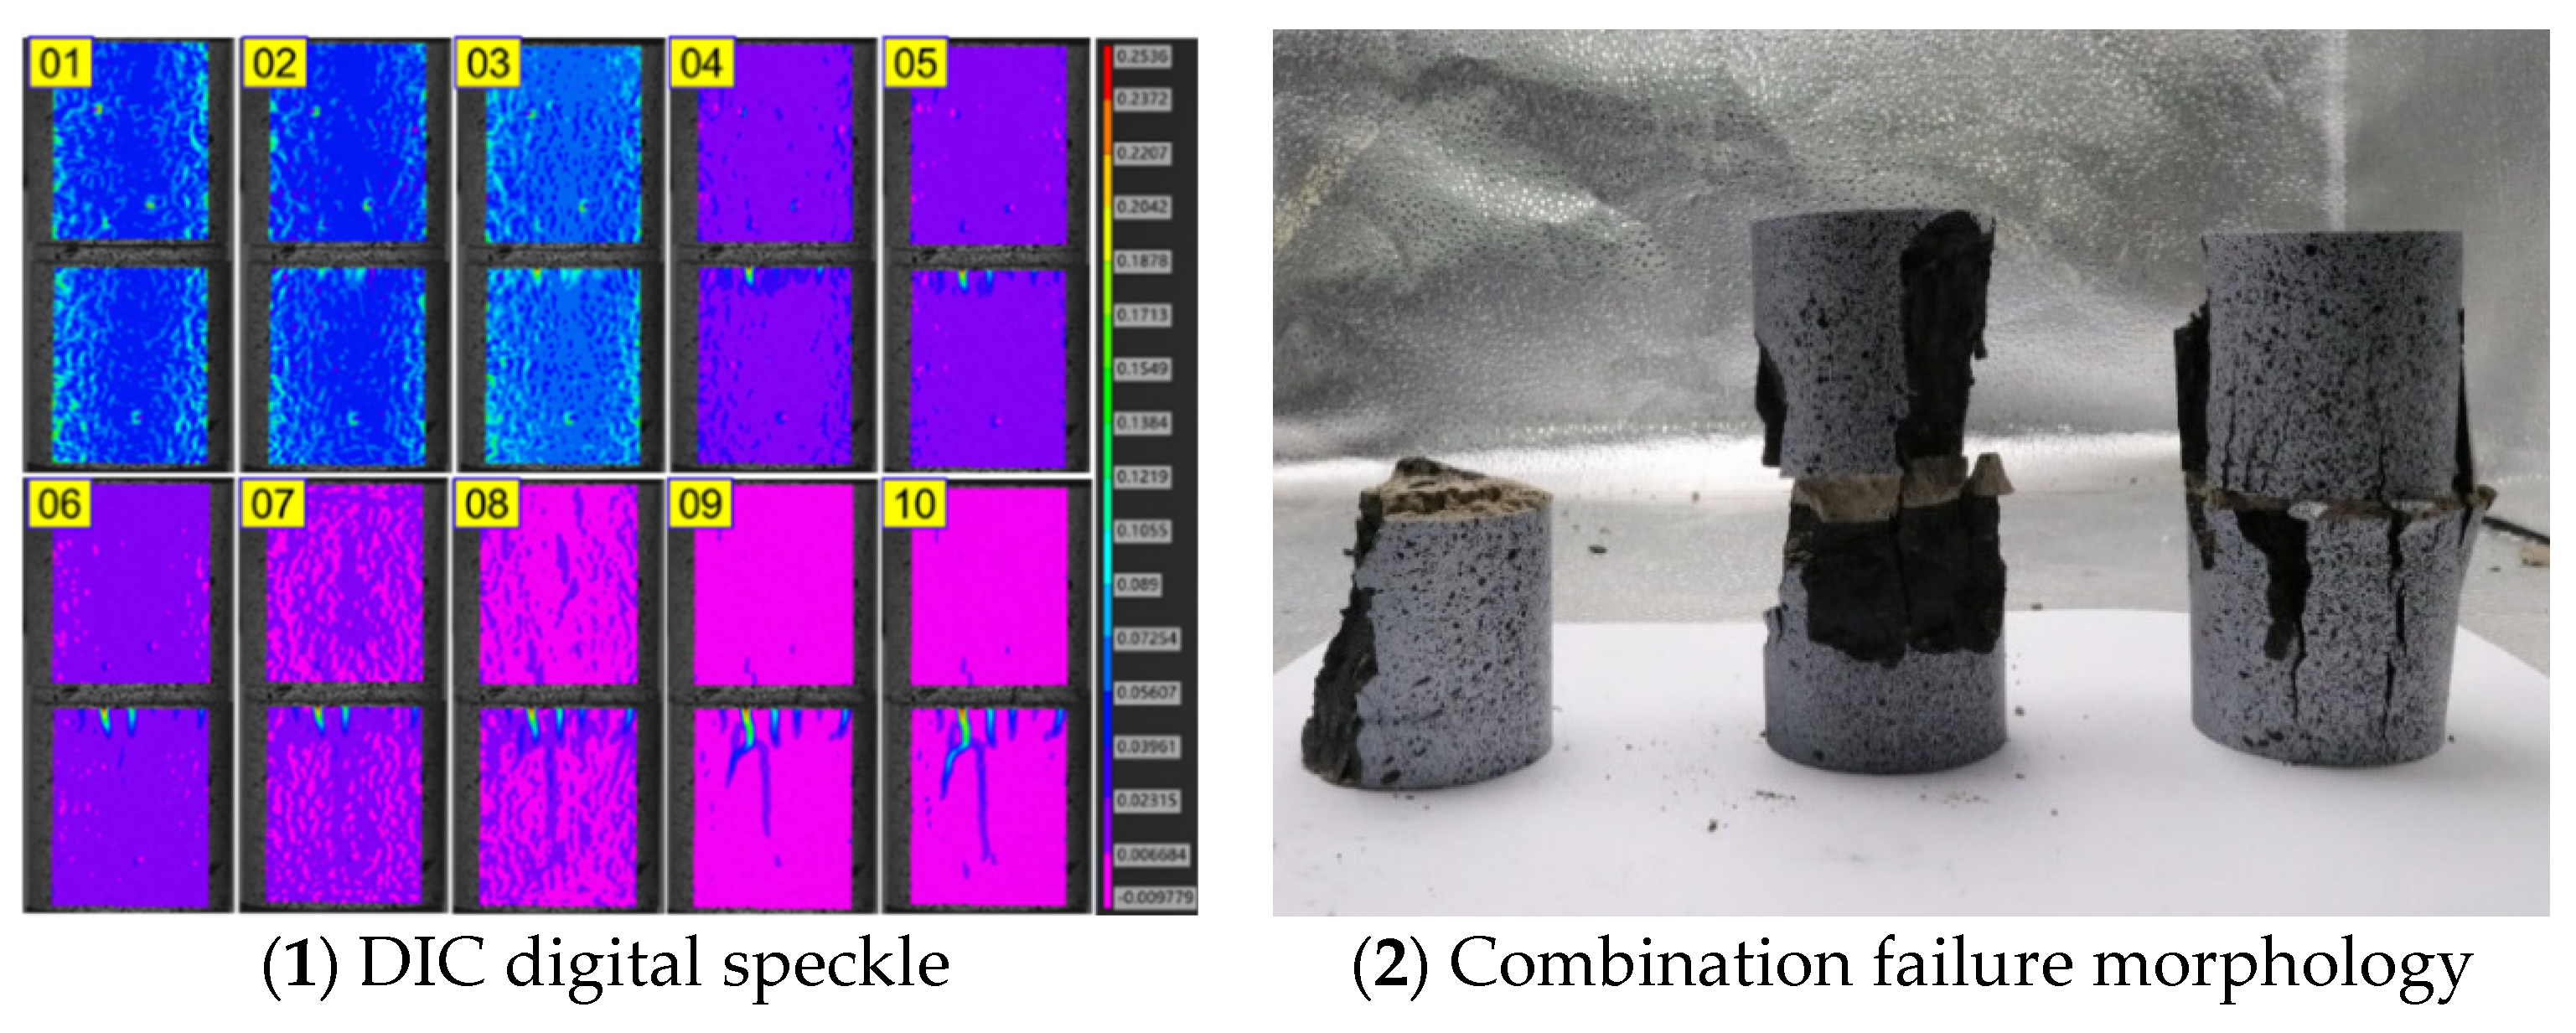
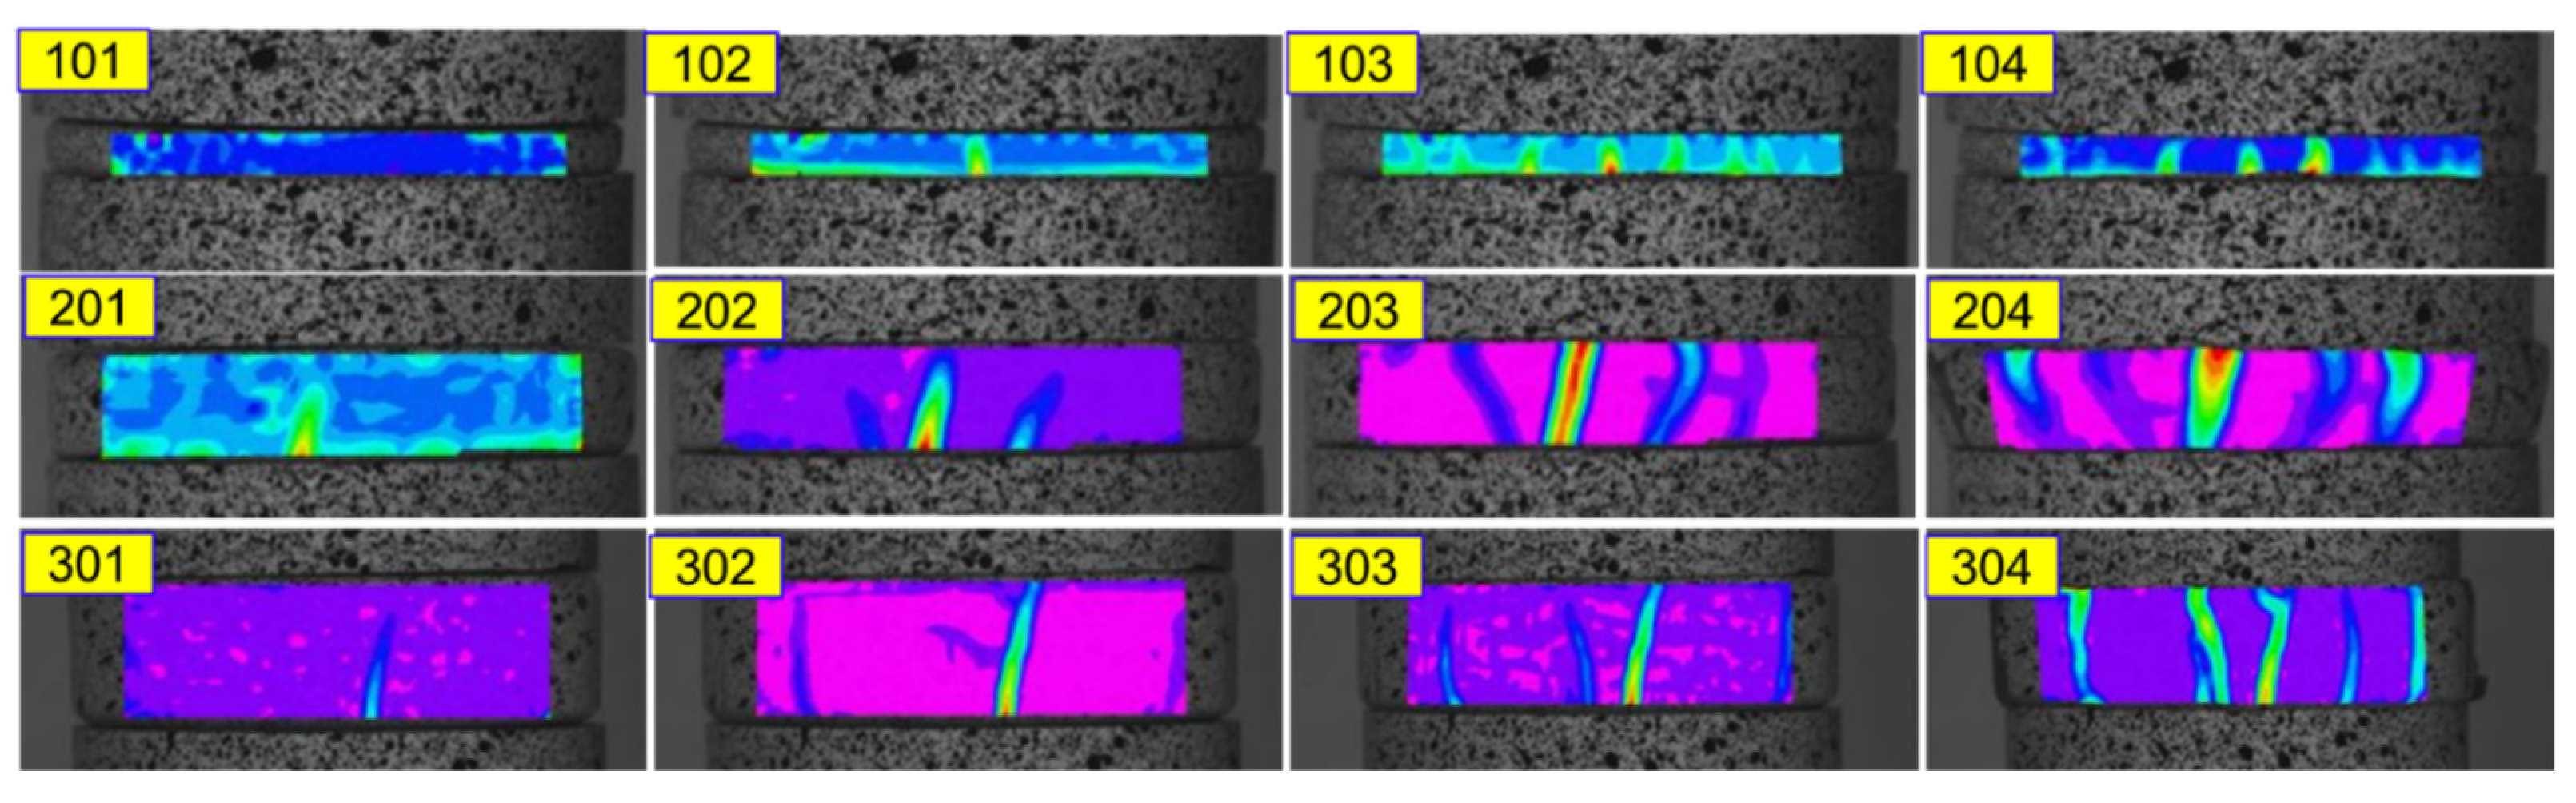
In this study, the mechanical properties of in–situ sampled coal–rock combinations were tested by varying the proportion of cement fly ash, which included the proportion and mechanical properties of the layer-filling materials. The failure of the coal–rock combination demonstrates that different “soft bed” layers lead to changes in both the overall bearing capacity and failure mode of the combination. By analyzing the overall strain field evolution of the composite through uniaxial compression tests, it was observed that the coal interbed composite underwent four distinct failure stages: Stage 1, where strain concentration occurred at the edge of the coal sample and the interlayer contact; Stage 2, where strain concentration positions adjusted and strain at the coal sample–interlayer interface gradually increased; Stage 3, where strain concentration in the lower coal sample increased while decreasing in the upper part, and fractures expanded; and Stage 4, where ultimate strength was reached and fractures and failures emerged in the coal sample.
(3)
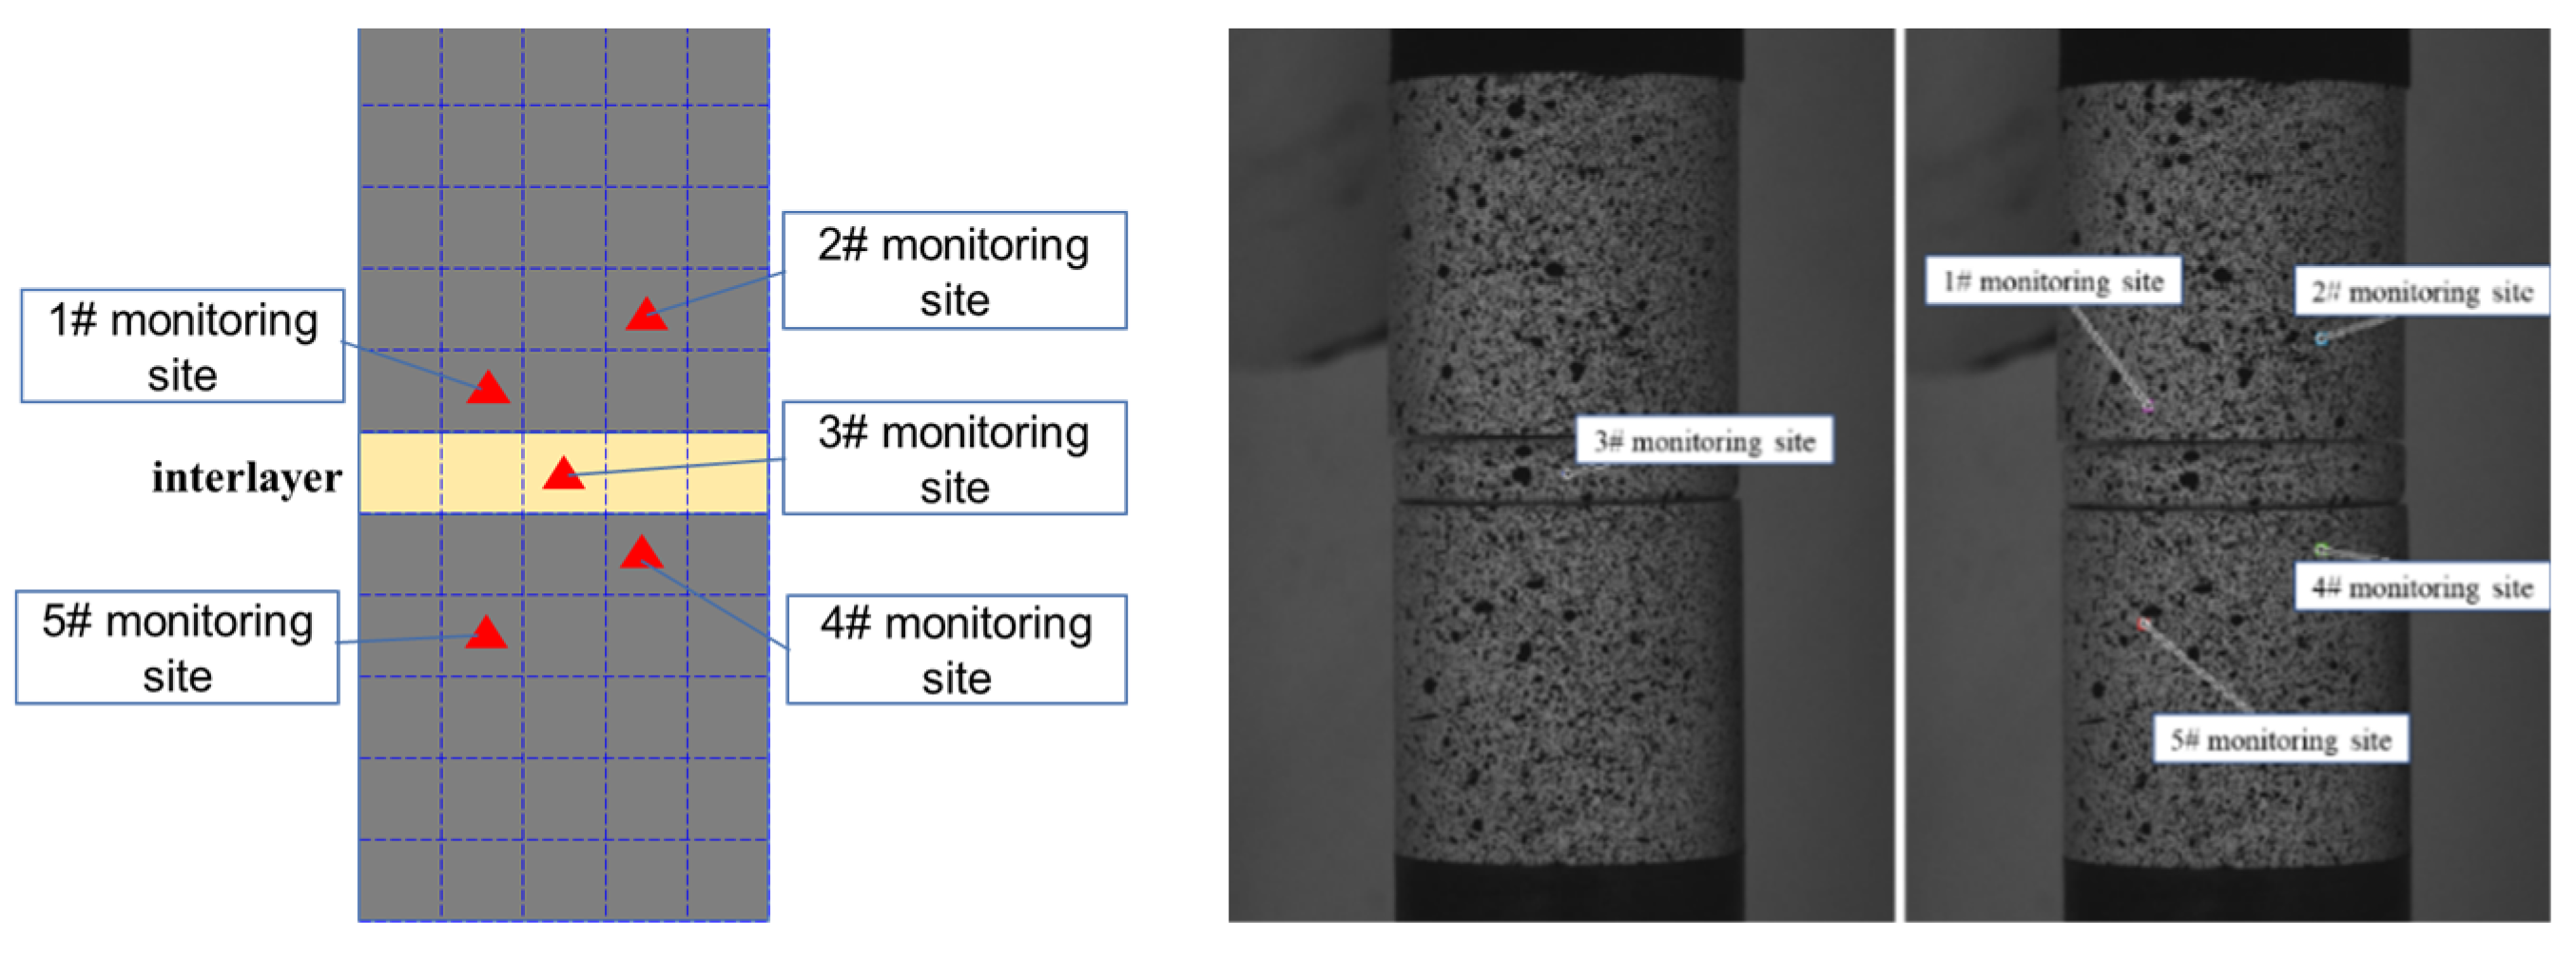
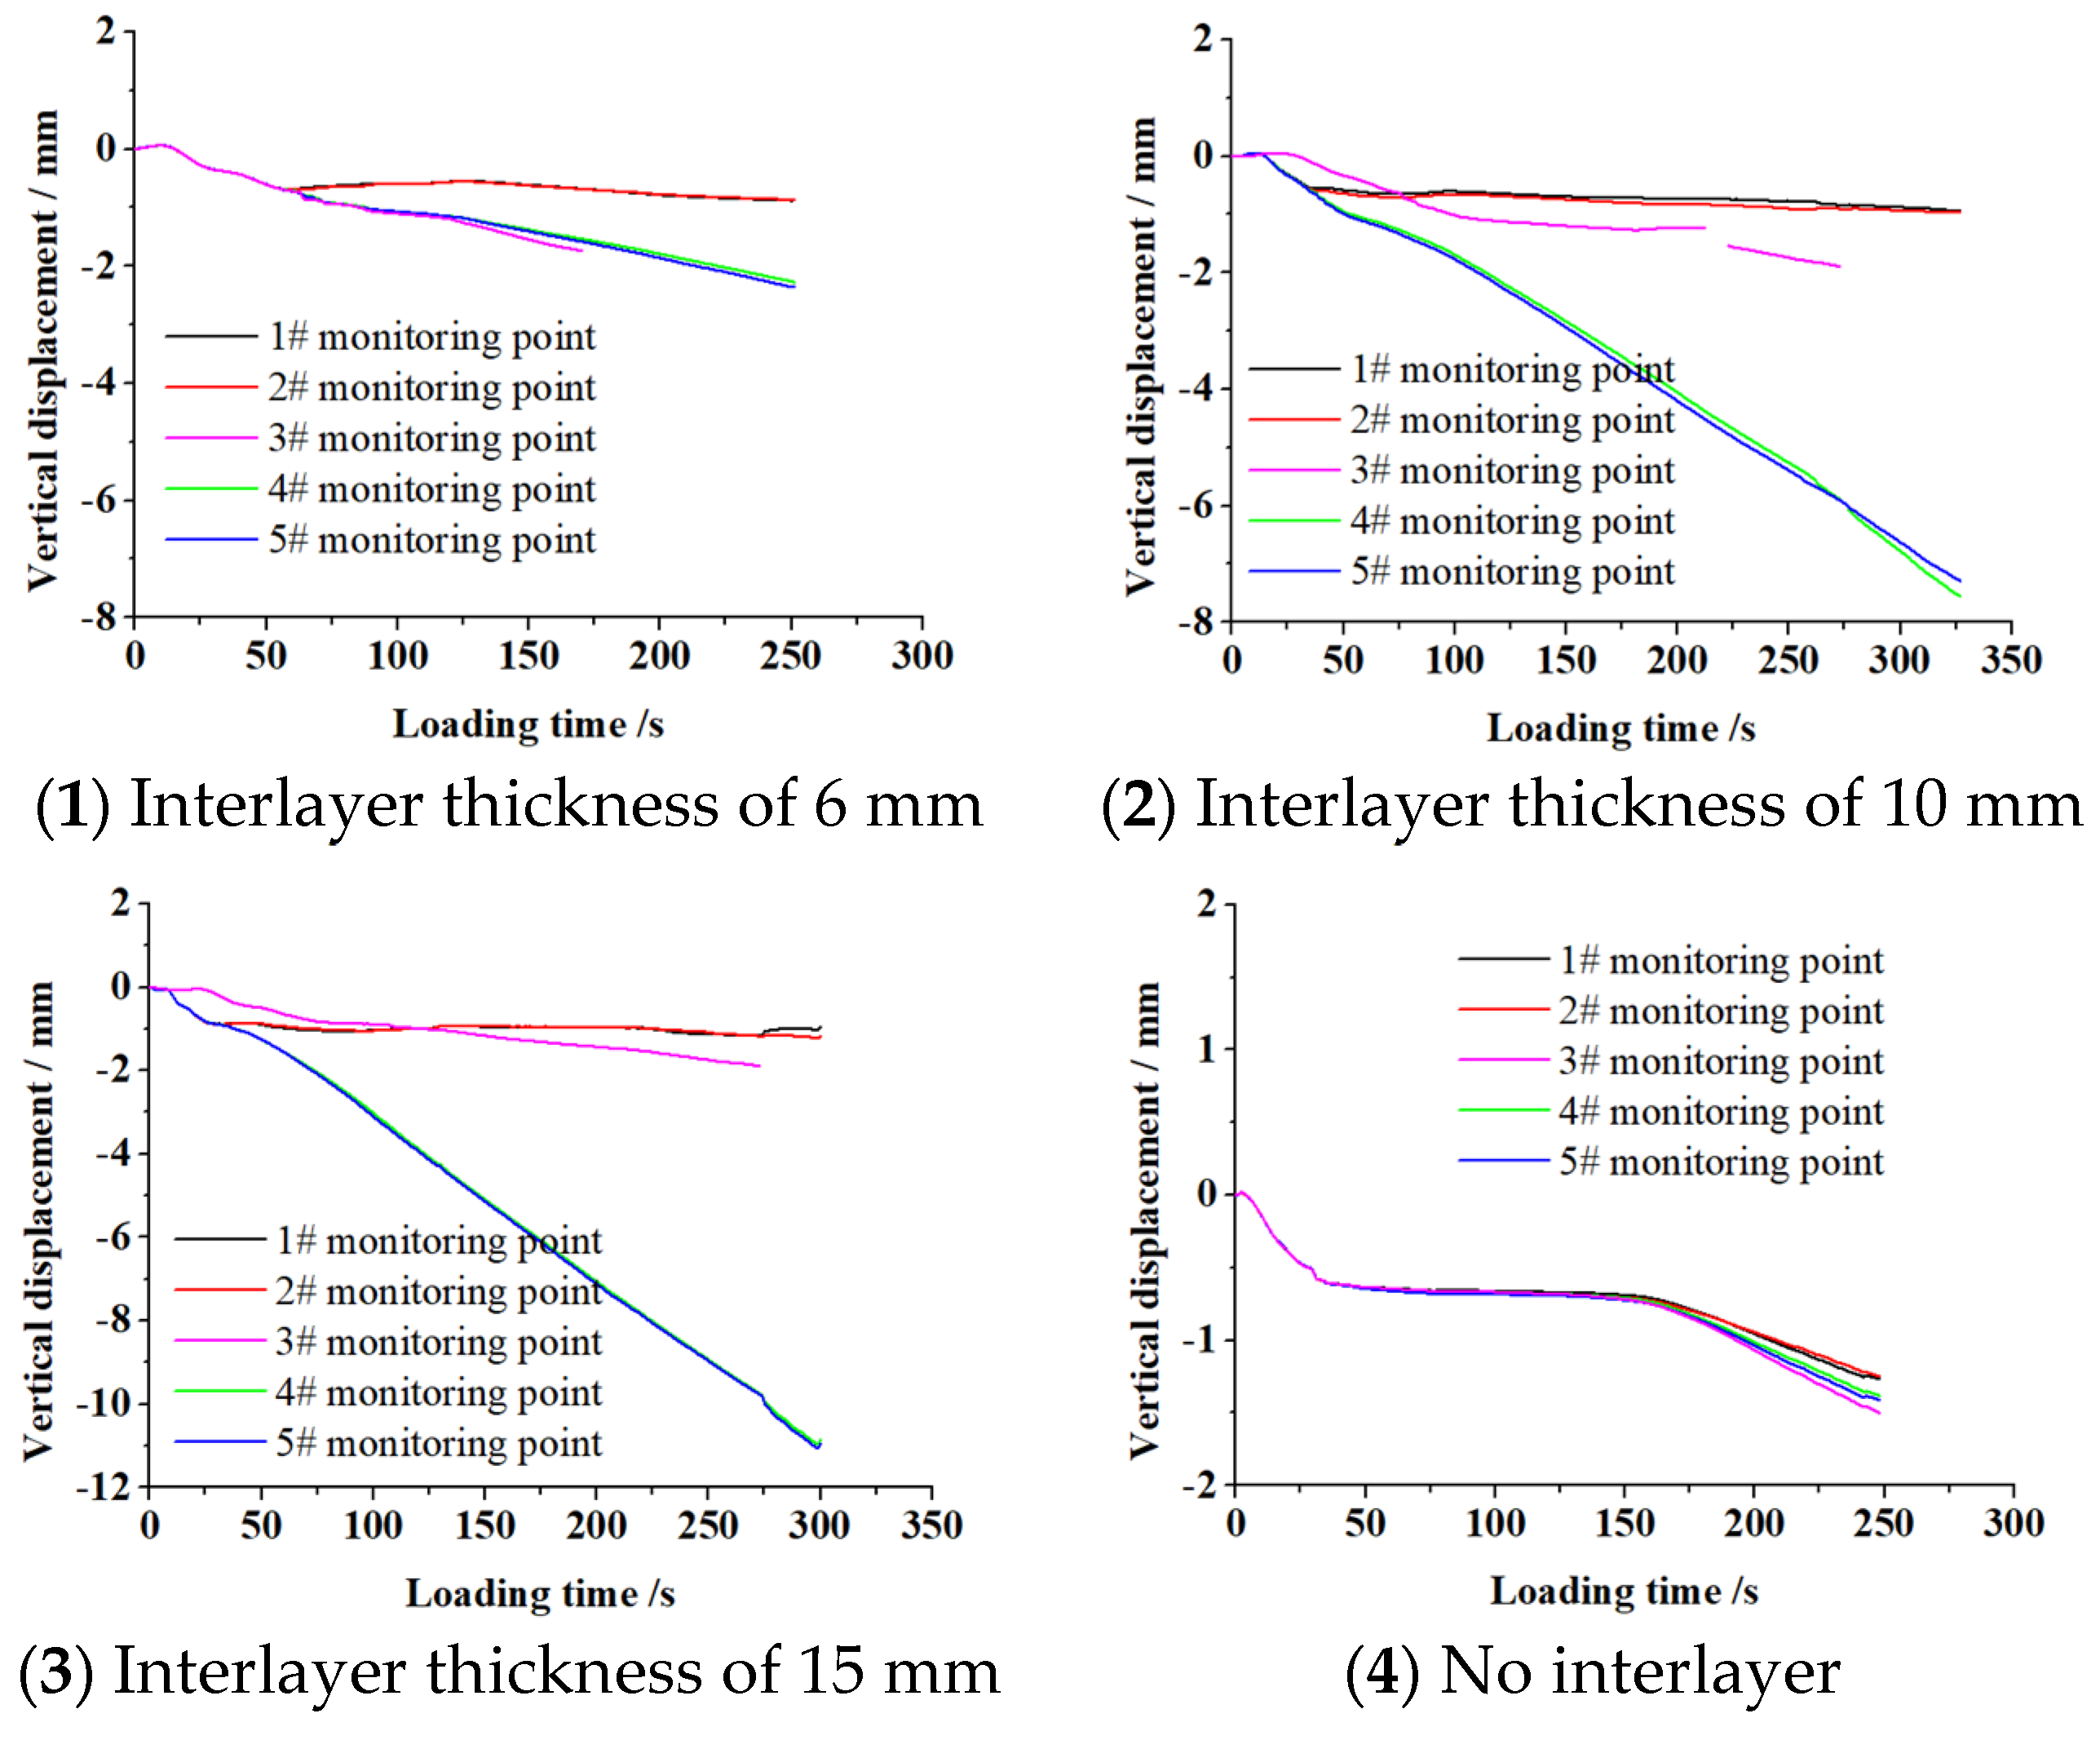
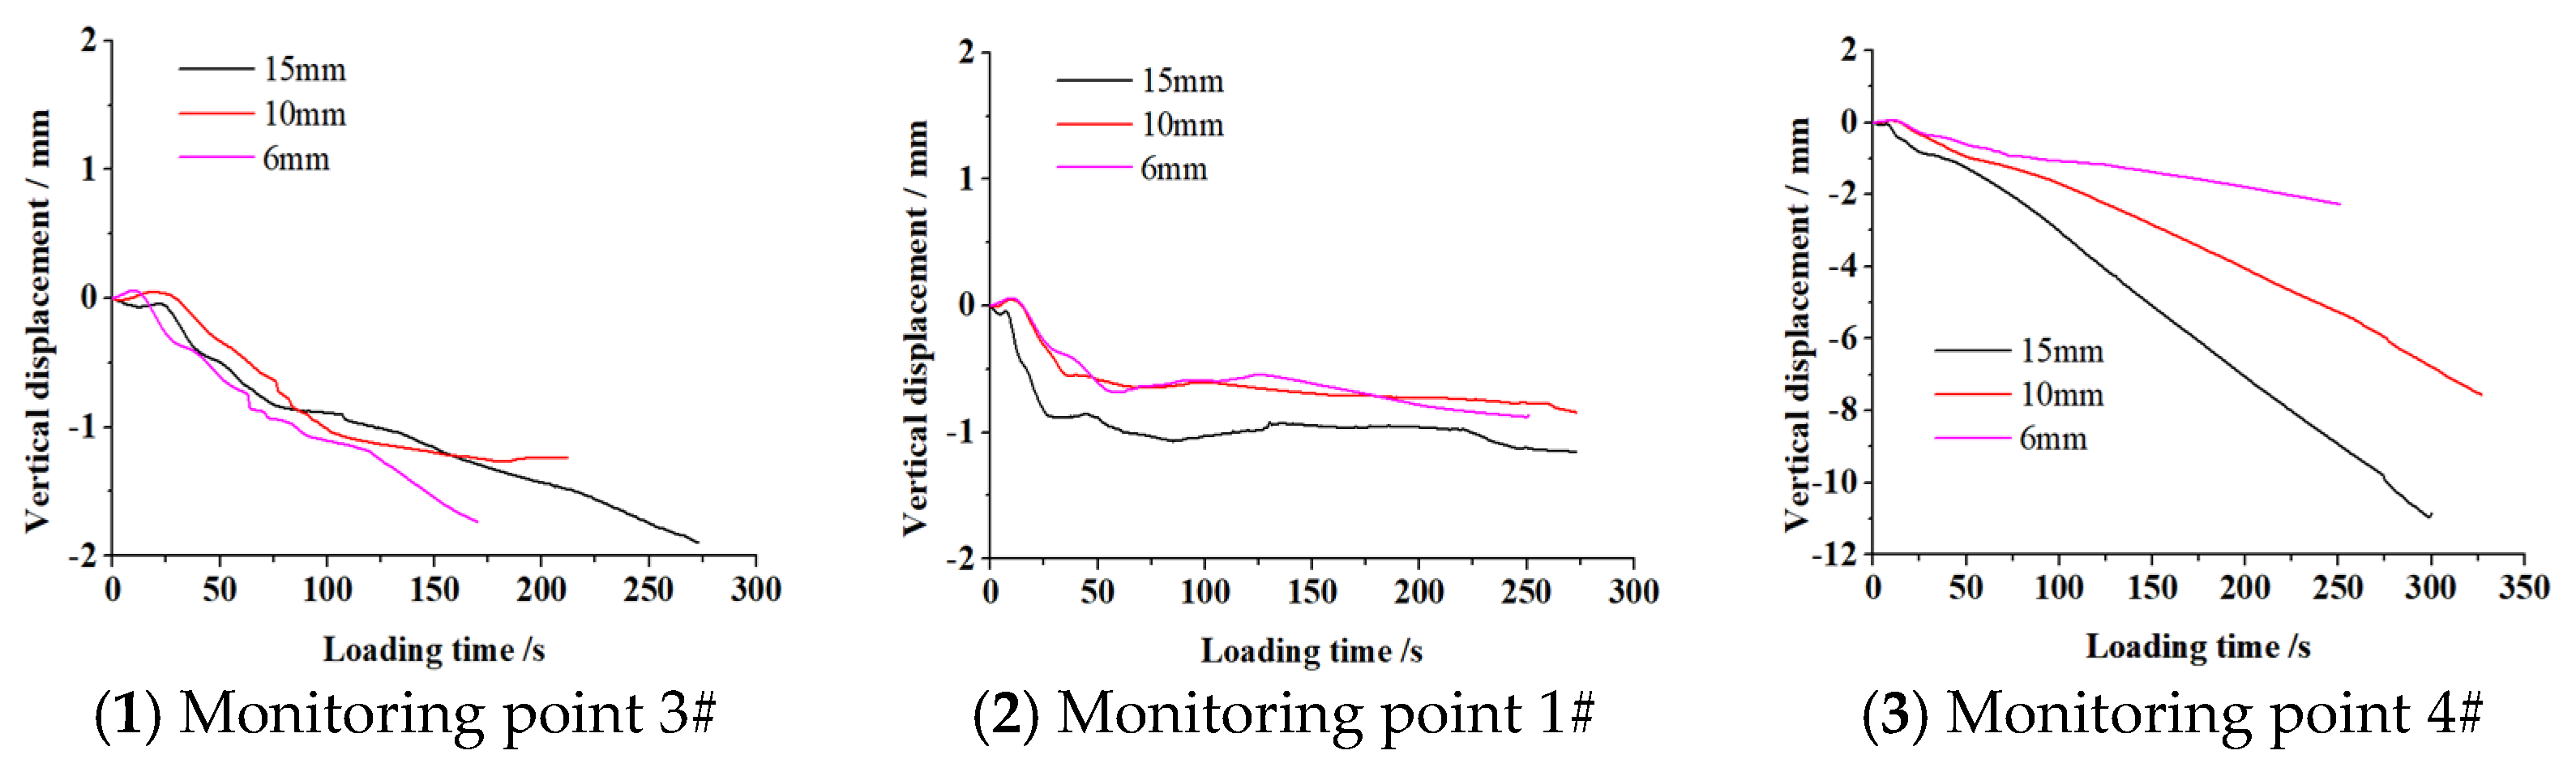
The deformation and failure characteristics of coal and interlayers, as well as maximum principal strain evolution cloud diagrams of fractures at different stages in interlayers, were examined. The key fractures in the cloud diagram were marked. At an interlayer thickness of 6 mm, the 1# monitoring point, located on the upper part of the interlayer, experienced a vertical displacement of at least 0.87 mm. At an interlayer thickness of 15 mm, the 4# monitoring point, located in the lower part of the interlayer, experienced a vertical displacement of up to 10.97 mm. The presence of the interlayer significantly affected the vertical displacement of the composite. With increasing interlayer thickness, the vertical displacement at the lower part of the interlayer increases significantly. Therefore, the interlayer served to restrain the load–bearing process of the combination, and increasing its thickness resulted in greater displacement changes in the combination. From the perspective of vertical displacement changes, the vertical displacements at different monitoring points also increase with increasing interlayer thickness. Additionally, the vertical displacement change was more significant in the lower part of the interlayer compared to the upper part and the interlayer itself as it became thicker.
(4)
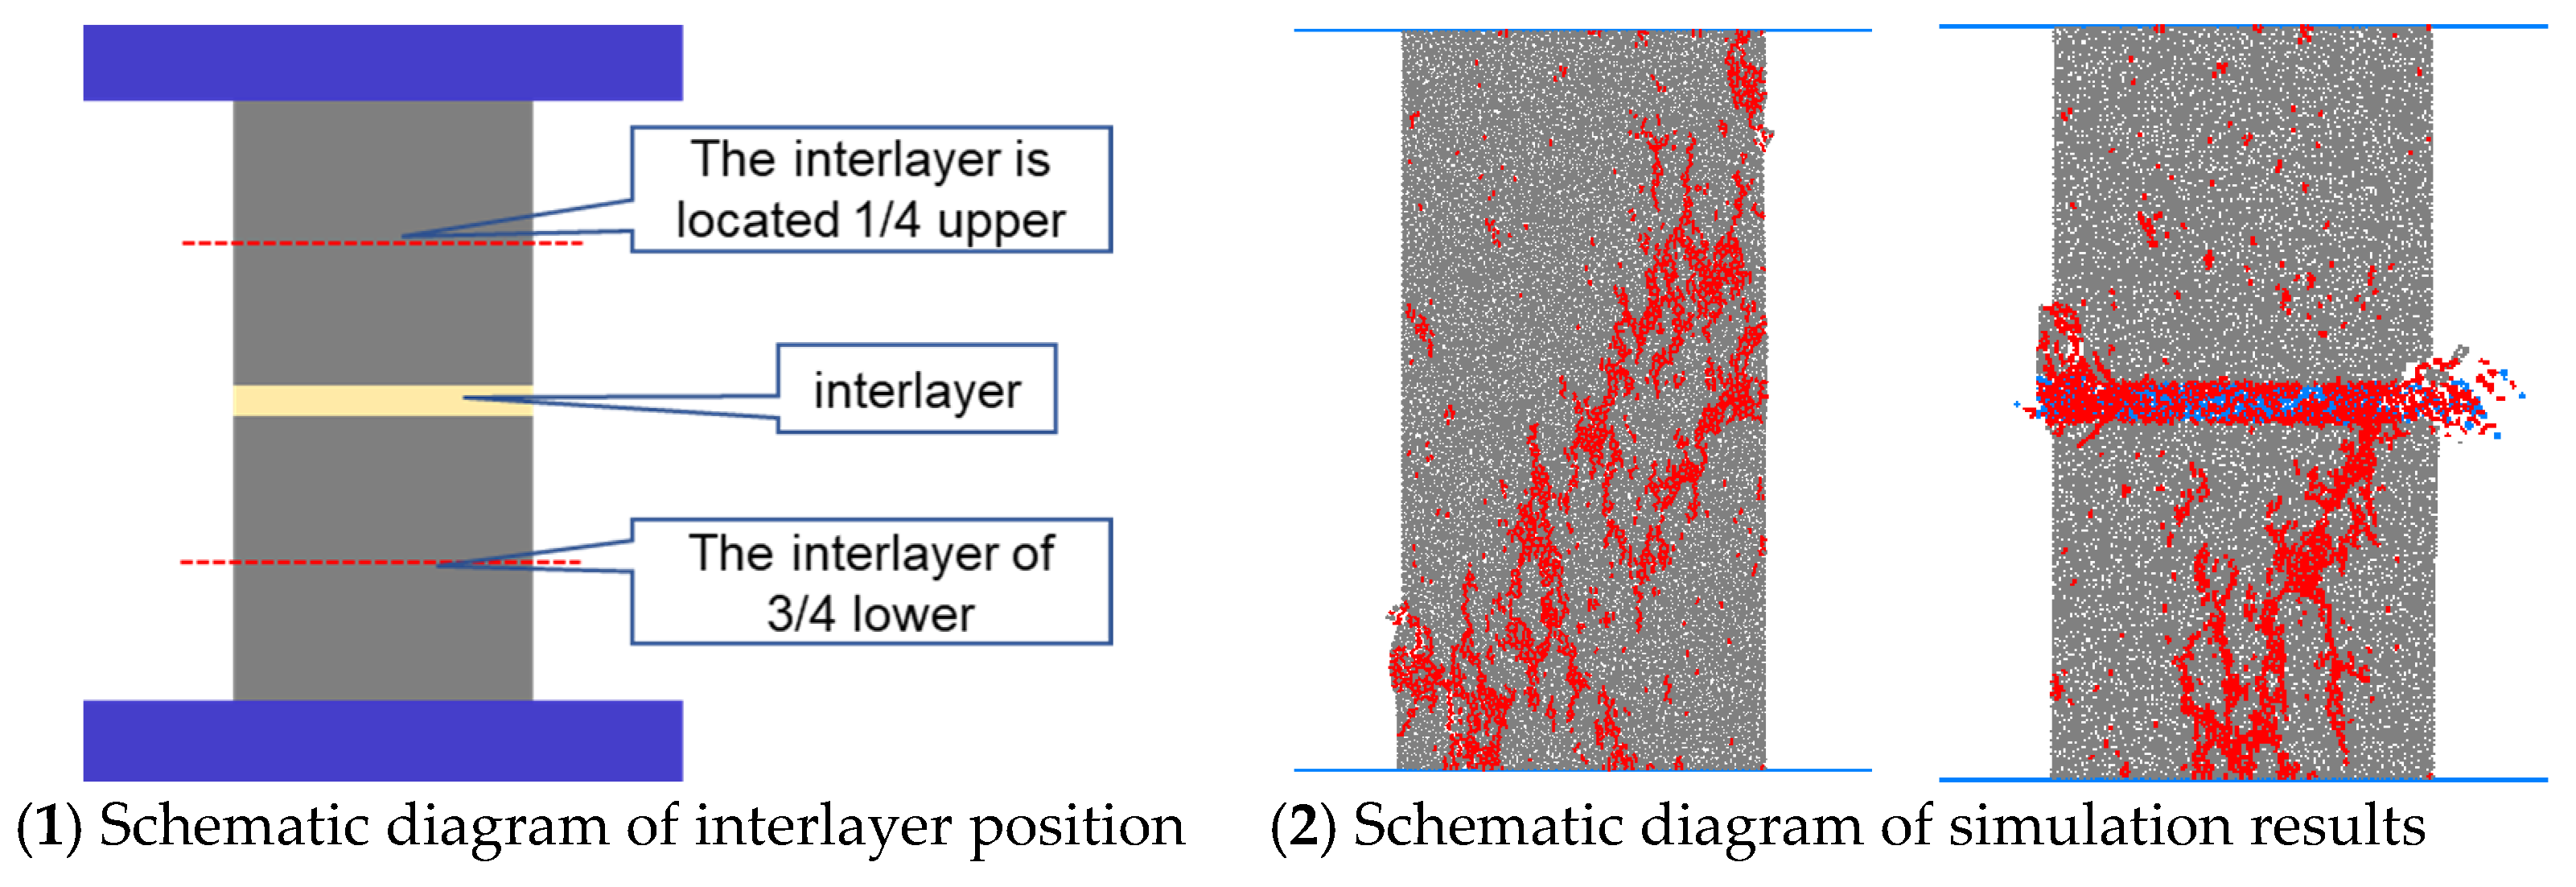
The location and thickness of the interlayer greatly influenced the failure mode and fracture propagation of the composite sample. Therefore, it is necessary to consider the location and thickness of the interlayer when designing composite specimens to avoid undesirable failure modes and fracture propagation. Furthermore, our numerical simulation results indicate that the failure of the composite initially occurred in the middle layer during the compaction process, and subsequently propagated to the upper and lower layers. Hence, it is essential to pay attention to controlling the compaction quality of the middle layer during the production and application of the composite in order to prevent damage. In conclusion, the location and thickness of the interlayer significantly influence the failure distribution of composites. Therefore, they should be carefully considered and controlled during the design, production, and application of composite specimens.

Author Contributions

Methodology, S.L.; formal analysis, S.C.; resources, D.H.; writing—original draft preparation, S.L.; writing—review and editing, D.H. All authors have read and agreed to the published version of the manuscript.

Funding

This research was funded by the CCTEG Coal Mining Research Institute, grant number TDKC–2022–QN–05, and the National Natural Science Foundation of China, grant number 52204123, 51774185.

Data Availability Statement

The data generated and/or analyzed during this study are available from the corresponding author on reasonable request.

Conflicts of Interest

The authors declare no conflict of interest.

References

  1. Zhao, G.; Zhou, J.; Meng, X.; Kao, S.; Zhang, R.; Huang, S. Dynamic impact compression characteristics of granite rocks with different length–diameter ratios. Chin. J. Rock Mech. Eng. 2021, 40, 1392–1402. [Google Scholar]
  2. Chen, G.; Zhang, S.; Li, T.; Zhang, G.; Lv, P. Influence of properties and proportion of coal–rock combined body on the law of mechanical properties. J. Liaoning Tech. Univ. 2021, 40, 198–205. [Google Scholar]
  3. Chen, G.; Li, T.; Yang, L.; Zhang, G.; Li, J.; Dong, H. Mechanical properties and failure mechanism of combined bodies with different coal–rock ratios and combinations. J. Min. Strat. Control Eng. 2021, 3, 023522. [Google Scholar]
  4. Fan, Y.; Xiao, X.; Xu, J.; Wu, D.; Ding, X.; Wang, L.; Lv, X. Mechanical properties of coal rock combinations and evaluation of impact tendency considering effects of the height portion of coal. J. China Coal Soc. 2020, 45, 649–659. [Google Scholar]
  5. Song, H.; Zuo, J.; Liu, H.; Zuo, S. The strength characteristics and progressive failure mechanism of soft rock–coal combination samples with consideration given to interface effects. Int. J. Rock Mech. Min. Sci. 2021, 138, 1–13. [Google Scholar] [CrossRef]
  6. Gao, F.; Kang, H.; Yang, L. Experimental and numerical investigations on the failure processes and mechanisms of composite coal–rock specimens. Sci. Rep. 2020, 10, 1–13. [Google Scholar]
  7. Zhang, H. Research on Unloading Mechanism and Precursory Laws of Failure and Instability of Coal–Rock Parting Compound Structure. Ph.D. Thesis, China University of Mining and Technology, Xuzhou, China, 2021. [Google Scholar]
  8. Gao, W.; Chen, X.; Hu, C. Study on interfacial fracture initiation of jointed rock mass based on interface fracture mechanics. Fractal Fract. 2022, 6, 510. [Google Scholar] [CrossRef]
  9. Dinç Göğüş, Ö.; Avşar, E.; Develi, K.; Çalık, A. Quantifying the rock damage intensity controlled by mineral compositions: Insights from fractal analyses. Fractal Fract. 2023, 7, 383. [Google Scholar] [CrossRef]
  10. Guo, W.; Zhou, H.; Xu, N.; Chen, W.; Wei, P. Simulation study of mechanical properties of coal rock combination. Saf. Coal Mines 2016, 47, 33–38. [Google Scholar]
  11. Wu, G.; Yu, W.; Zuo, J.; Du, S. Experimental and theoretical investigation on mechanisms performance of the rock–coal–bolt (RCB) composite system. Int. J. Min. Sci. Technol. 2020, 30, 18–27. [Google Scholar] [CrossRef]
  12. Zhang, Z.; Liu, J.; Wang, L.; Yang, H.; Zuo, J. Effects of combination mode on mechanical properties and failure characteristics of the coal–rock combinations. J. China Coal Soc. 2012, 37, 1676–1682. [Google Scholar]
  13. Guo, D.; Zuo, J.; Zhang, Y.; Yang, R. Research on strength and failure mechanism of deep coal–rock combination bodies of different inclined angles. Rock Soil Mech. 2011, 32, 1333–1340. [Google Scholar]
  14. Xiao, X.; Wang, L.; Xu, J.; Lv, X.; Guo, P.; Pan, Y. Damage characteristics and catastrophic failure mechanism of coal rock induced by gas adsorption under compression. J. Rock Mech. Geotech. Eng. 2020, 12, 587–595. [Google Scholar] [CrossRef]
  15. Yu, W.; Pan, B.; Li, K.; Shen, W. Mechanical properties and fracture evolution law of rock–coal–rock combination. J. China Coal Soc. 2022, 47, 1155–1167. [Google Scholar]
  16. Yang, K.; Liu, W.; Dou, L.; Chi, X.; Wei, Z.; Fu, Q. Experimental investigation into interface effect and progressive instability of coal–rock combined specimen. J. China Coal Soc. 2020, 45, 1691–1700. [Google Scholar]
  17. Dou, L.; He, X.; Ren, T.; He, J.; Wang, Z. Mechanism of coal–gas dynamic disasters caused by the superposition of static and dynamic loads and its control technology. J. China Univ. Min. Technol. 2018, 47, 48–59. [Google Scholar]
  18. Zuo, J.; Chen, Y.; Song, H. Study progress of failure behaviors and nonlinear model of deep coal–rock combined body. J. Cent. South Univ. 2021, 52, 2510–2521. [Google Scholar]
  19. Zuo, J.; Chen, Y.; Cui, F. Investigation on mechanical properties and rock burst tendency of different coal–rock combined bodies. J. China Univ. Min. Technol. 2018, 47, 81–87. [Google Scholar]
  20. Lu, C.; Dou, L.; Wu, X. Experimental research on rules of rockburst tendency evolution and acoustic–electromagnetic effects of compound coal–rock samples. Chin. J. Rock Mech. Eng. 2007, 26, 2549–2556. [Google Scholar]
  21. Li, C.; Xu, Y.; Ye, Z. Energy dissipation and crushing characteristics of coal–rock–like combined body under impact loading. Chin. J. Geotech. Eng. 2020, 42, 981–989. [Google Scholar]
  22. Wu, J. Experimental Study on Anomalously–Low Friction Effect of Interface between Combined Coal and Rock under Impact Loading. Master’s Thesis, Liaoning Technical University, Fuxin, China, 2021. [Google Scholar]
  23. Yang, L.; Gao, F.; Wang, X.; Li, J. Energy evolution law and failure mechanism of coal–rock combined specimen. J. China Coal Soc. 2019, 44, 3894–3902. [Google Scholar]
  24. Xu, J.; Zhang, X.; Liu, Z.; Sun, L.; Hou, S. Mechanical response and energy evolution law of coal–rock combined specimen under cyclic loading and unloading conditions. J. Yangtze River Sci. Res. Inst. 2022, 39, 89–94. [Google Scholar]
  25. Zhao, Z.; Wang, W.; Wang, L.; Dai, C. Compression–shear strength criterion of coal–rock combination model considering interface effect. Tunn. Undergr. Space Technol. 2015, 47, 193–199. [Google Scholar] [CrossRef]
  26. Wang, Z.; Dou, L.; He, J. Failure characteristics of rock bursts in steeply–inclined extra–thick coal seams under static–dynamic coupling loading. J. Min. Saf. Eng. 2021, 38, 886–895. [Google Scholar]
  27. Zhu, C.; Ma, C.; Zhou, J.; Ren, J.; Yu, Q. Mechanical properties and failure characteristics of composite coal and rock mass under dynamic and static loading. J. China Coal Soc. 2021, 46, 817–829. [Google Scholar]
  28. Abbas, H.; Mohamed, Z.; Kudus, S. Deformation behaviour, crack initiation and crack damage of weathered composite sandstone-shale by using the ultrasonic wave and the acoustic emission under uniaxial compressive stress. Int. J. Rock Mech. Min. Sci. 2023, 170, 105497. [Google Scholar] [CrossRef]
  29. Wang, Y.; Tang, P.; Li, P.; Xia, Y. Effect of disturbed frequency on rock failure and energy characteristics exposed to triaxial fatigue and multistage unloading confining pressure (TF-MSUCP) conditions. Eng. Fail. Anal. 2023, 145, 106997. [Google Scholar] [CrossRef]
  30. Xiong, Y.; Yang, S.; Kong, D.; Song, G.; Ma, Z.; Zuo, Y. Analysis on early warning of coal sample failure based on crack development law and strain evolution characteristics. Eng. Fail. Anal. 2023, 148, 107170. [Google Scholar] [CrossRef]
  31. Gu, X.; Guo, W.; Zhang, C.; Zhang, X.; Guo, C.; Wang, C. Effect of interfacial angle on the mechanical behaviour and acoustic emission characteristics of coal–rock composite specimens. J. Mater. Res. Technol. 2022, 21, 1933–1943. [Google Scholar] [CrossRef]
  32. Kang, H. Seventy years development and prospects of strata control technologies for coal mine roadways in China. Chin. J. Rock Mech. Eng. 2021, 40, 1–30. [Google Scholar]
  33. Kang, H.; Jiang, P.; Huang, B.; Guan, X.; Wang, Z.; Wu, Y.; Gao, F.; Yang, J.; Cheng, L.; Zheng, Y.; et al. Roadway strata control technology by means of bolting–modification–destressing in synergy in 1000 m deep coal mines. J. China Coal Soc. 2020, 45, 845–864. [Google Scholar]
  34. Kang, H.; Jiang, P.; Wu, Y.; Gao, F. A combined “ground support–rock modification–destressing” strategy for 1000m deep roadways in extreme squeezing ground condition. Int. J. Rock Mech. Min. Sci. 2021, 142, 1–12. [Google Scholar] [CrossRef]
  35. Li, W.; Kang, H.; Jiang, Z.; Cai, R.; Guo, G. Deformation failure mechanism of fractured deep coal–rock mass and high–pressure grouting modification strengthening testing. J. China Coal Soc. 2021, 46, 912–923. [Google Scholar]
  36. Zhang, J.; Liu, L.; Li, Q.; Peng, W.; Zhang, F.; Cao, J.; Wang, H. Development of cement–based self–stress composite grouting material for reinforcing rock mass and engineering application. Constr. Build. Mater. 2019, 201, 314–327. [Google Scholar] [CrossRef]
  37. Sui, L.; Wang, H.; Wu, J.; Zhang, J.; Yu, J.; Ma, X.; Sun, Q. Fractal description of rock fracture networks based on the space syntax metric. Fractal Fract. 2022, 6, 353. [Google Scholar] [CrossRef]
  38. Wang, Z.; Qin, W.; Zhang, L. Experimental study on static and dynamic mechanical properties of fractureed rock after grouting reinforcement. Chin. J. Rock Mech. Eng. 2020, 39, 2451–2460. [Google Scholar]
  39. Tang, C.; Shi, B.; Liu, C.; Zhao, L.; Wang, B. Influencing factors of geometrical structure of surface shrinkage cracks in clayey soils. Eng. Geol. 2008, 101, 204–217. [Google Scholar] [CrossRef]
  40. Zhu, D.; Ji, X.; Huo, Y.; Wang, Z.; Yu, B.; Wang, D. Numerical investigation of particles flow pattern and pressure distribution of coal bunker. J. Geophys. Eng. 2023, 20, 841–853. [Google Scholar] [CrossRef]
  41. Miao, K.; Tu, S.; Tu, H.; Liu, X.; Li, W.; Zhao, H.; Tang, L.; Ma, J.; Li, Y. Research on Fractal Evolution Characteristics and Safe Mining Technology of Overburden Fissures under Gully Water Body. Fractal Fract. 2022, 6, 486. [Google Scholar] [CrossRef]
Figure 1. Coal sample preparation flow chart.
Fractalfract 07 00731 g001
Figure 2. Preparation of composite specimens.
Fractalfract 07 00731 g002
Figure 3. Electron microscope scanning test at the interface between the coal body and the interlayer.
Fractalfract 07 00731 g003
Figure 4. Non-contact DIC loading test system diagram for the composite body.
Fractalfract 07 00731 g004
Figure 5. Distribution of monitoring points and strain evolution process of composite samples.
Fractalfract 07 00731 g005
Figure 6. Uniaxial compression test of coal sample and interlayer combination.
Fractalfract 07 00731 g006
Figure 7. Vertical displacement curve of monitoring points 1–5# for composite samples with different interlayer thicknesses.
Fractalfract 07 00731 g007
Figure 8. Maximum principal strain evolution cloud map of interlayer with different thicknesses.
Fractalfract 07 00731 g008
Figure 9. Vertical displacement and time evolution curve of the interlayer and the upper, and lower interlayer with different thickness.
Fractalfract 07 00731 g009
Figure 10. Schematic diagram of interlayer sample model.
Fractalfract 07 00731 g010
Figure 11. Typical image of fracture distribution in combinations.
Fractalfract 07 00731 g011
Figure 12. Curves of the fracture number and stress in the combination with 6 mm interlayers.
Fractalfract 07 00731 g012
Figure 13. Curves of the fracture number and stress in the combination with 10 mm interlayers.
Fractalfract 07 00731 g013
Figure 14. Curves of the fracture number and stress in the combination with 15 mm interlayers.
Fractalfract 07 00731 g014
Figure 15. Curves of the fracture number and stress of the combination with different interlayer thicknesses.
Fractalfract 07 00731 g015
Figure 16. Schematic diagram of fracture zoning in the combination of interlayer and upper and lower coal samples.
Fractalfract 07 00731 g016
Figure 17. Evolution of the fracture proportion of interlayer combinations with thicknesses of 6, 10, and 15 mm at different positions with loading steps.
Fractalfract 07 00731 g017
Figure 18. The influence of interlayer thickness and position on the fractal dimension of combination fractures.
Fractalfract 07 00731 g018
Table 1. Interlayer material test data.
SampleWater–Solid RatioSolid–Phase Comparison (Cement: Fly Ash)Maintenance Days/dTest Piece NumberUniaxial Compressive Strength/MPaAverage
/MPa
Interlayer0.81:314 d2–13.394.04
2–24.72
2–34.02
Table 2. Combination structure and physical-mechanical parameters.
SampleTest Piece NumberDiameter/mmHeight/mmProportion of Interlayer Materials/%Compressive Strength/MPaElastic Modulus/GPa
standard single axisS–150100.1025.152.37
pure coal combinationS–25099.8036.522.65
interlayer 6 mmS–350105.9622.051.31
interlayer 10 mmS–450109.7911.740.32
interlayer 15 mmS–550114.9135.740.43
Table 3. Mechanical parameters of the calculation model.
ParametersValues for Measured Parameters
CoalInterlayer
Minimum particle radius/mm0.350.25
Particle diameter ratio2.142.00
Particle density/(kg/m3)18001500
Coefficient of friction between particles0.550.55
Particle elastic modulus/GPa1.920.45
Parallel bond elastic modulus/GPa1.920.45
Normal-tangential stiffness ratio of particles2.051.85
Coefficient of parallel bond radius1.01.0
Parallel bond tensile strength/MPa9.854.98
Parallel bond cohesion/MPa19.859.98
Normal to tangential stiffness ratio of parallel bond3.052.85
Disclaimer/Publisher’s Note: The statements, opinions and data contained in all publications are solely those of the individual author(s) and contributor(s) and not of MDPI and/or the editor(s). MDPI and/or the editor(s) disclaim responsibility for any injury to people or property resulting from any ideas, methods, instructions or products referred to in the content.

