Article

Comparative Study on the Fractal and Fractal Dimension of the Vortex Structure of Hydrofoil’s Tip Leakage Flow

1
College of Water Resources and Civil Engineering, China Agricultural University, Beijing 100083, China
2
Beijing Engineering Research Center of Safety and Energy Saving Technology for Water Supply Network System, Beijing 100083, China
3
State Key Laboratory of Hydroscience and Engineering, Tsinghua University, Beijing 100084, China
*
Author to whom correspondence should be addressed.
Fractal Fract. 2023, 7(2), 123; https://doi.org/10.3390/fractalfract7020123
Submission received: 13 December 2022 / Revised: 17 January 2023 / Accepted: 26 January 2023 / Published: 28 January 2023
(This article belongs to the Special Issue Turbulence Structure and Fractal Characteristics in Turbomachinery)

Abstract

:
Axial-flow turbomachinery is widely used in low head water transfer and electricity generation projects. As there is a gap between the impeller and casing of the tubular flow unit, the fluid will cross the gap to form tip leakage flow, which may induce intense pressure pulsation, noise and mechanical vibration, and even threaten the safe operation of the unit. In order to ensure the efficient and stable operation of hydropower units, the influence factors of tip clearance flow and its formation and development mechanism have been deeply studied in this paper. In this paper, the impact of gap width, angle of attack and inlet velocity on tip leakage flow of hydrofoil with clearance are studied by orthogonal experiment method. The results suggest that the gap width has the greatest influence on tip clearance flow, the incidence angle takes the second place, and the inlet velocity has the least effect on tip clearance flow. Then the fractal characteristics of tip leakage vortices with different gap widths are studied. The results demonstrate that the fractal dimension of tip leakage vortices in large gaps was significantly larger than that in small gaps; The fractal dimension of the leakage vortex decreases gradually along the flow direction.

1. Introduction

Tip clearance refers to the clearance between vane tip and casing, which is widely found in various steam turbines, compressors and axial flow hydraulic machinery [1]. The fluid close to the tip clearance will flow from the pressure side to the suction side through the tip clearance under the pressure difference between the pressure side and the suction side, to form the tip leakage flow [2]. The flow near the tip clearance has a complex three-dimensional flow structure owing to the interaction between tip leakage flow and main flow, including tip leakage vortex (TLV), tip separation vortex (TSV), and induced vortex (IV) [3,4,5,6]. In general, the pressure at the center of the vortex core is often the lowest. When it is lower than the saturated steam pressure, cavitation will occur at the vortex core, forming cavitation flow [7,8]. The formation of cavitation will not only cause a significant decline in the performance of hydraulic machinery, but also strengthen the vibration, noise and cavitation erosion of hydraulic machinery [9,10,11,12,13].
In various vortex structures, the tip leakage vortex is dominant [14], which causes the largest total pressure drop and total pressure loss [15], and the mechanism of occurrence and development of TLV has become the focus of research. Due to the small structure of tip clearance in rotating machinery, it is very hard to research the mechanism of TLV. Muthanna et al. [16,17] pointed out that when the relative move between the end wall and the blade and when the blade spacing is large, the adjacent blades have little effect on TLV. Therefore, a large number of scholars have simplified the research object to hydrofoil with clearance in the study of TLV. Geng et al. [18] revealed the interaction between different eddies and the change of TLV core radius and velocity through the numerical simulation of hydrofoil tip clearance flow. Decaix et al. [19] analyzed the effect of clearance width on the TLV structure and strength. The results suggest that the TLV strength increases first and then decreases with the increase of gap width. Higashi et al. [20] studied the effect of incidence angle on TLV, by combining an experiment and numerical simulation. By comparing and analyzing the results, it is found that the incidence angle has a great effect on the size and position of TLV. Dreyer et al. [21] studied the influence of the Reynolds number on TLV at the tip of hydrofoil by changing the inlet velocity. The results suggest that when the inlet velocity increases, the vortex circulation increases linearly, but the inlet velocity has little influence on the structure or position of TLV. The current research mainly analyzes the impact of a single factor on TLV, and few studies comprehensively consider multiple factors. The evolution rules of the TLV structure and location under the combined action of multiple factors need to be further studied.
Fractal dimension is a measure of the irregularity of objects, which reflects the effectiveness of space occupied by complex objects. In the early 1980s, Lovejoy [22] believed that the edge line of tropical clouds could be described by fractal, and applied it to study the fractal dimension of cloud and rain regions. It was found that the fractal dimension of the region D = 1.35 ± 0.05. Since then, fractal dimension has been widely used to research the properties of clouds. Inspired by Lovejoy’s work, Batista et al. [23,24,25,26,27] conducted a lot of research on cloud morphology using fractal analysis, and found that fractal analysis can be used to predict cyclone movement, which is of great significance to weather prediction. At present, the fractal dimension analysis method has been widely used to analyze the cyclone movement in meteorology, but it is still less used in the water conservancy industry. Li et al. [28] applied the fractal dimension to study the development of vortex rope, and clarified the space-time evolution characteristics of the vortex rope. In this paper, the fractal analysis method is used to analyze the relationship between the development of TLV and fractal dimension, which can be used to analyze and forecast the evolution of TLV.
This study, takes a NACA0009 hydrofoil with clearance as the research object, a DES turbulence model is used to simulate the flow under different clearance widths, incidence angle, and inlet velocity. The effectiveness of the numerical simulation is verified by comparing the numerical simulation results with the experimental results. Then, we used the λ2 method [29] and the lowest pressure method to show the shape and the vortex center of the TLV, and analyzed the pressure coefficient, velocity coefficient, longitudinal position, length, and angle of the TLV center under different parameters, to clarify the specific effects of different parameters on TLV. Finally, we use image segmentation technology to extract the characteristics of TLV on a two-dimensional section with different gap widths. Then, the fractal dimension of TLV is calculated by using the characteristics of TLV, and it is used to quantitatively describe the spatial distribution and change of TLV. The fractal analysis method can also be used in the study of TLV of a tubular runner to clarify the impact of TLV and improve the operation stability of the unit. This research provides technical assistance for the optimization design of a tubular impeller and the scheduling operation of a tubular turbine unit.

2. Research Subject

According to the experiment of Dreyer et al. [21], the experimental section of this study is 150 mm × 150 mm overflow section, 750 mm long from inlet to outlet. The research object is NACA0009 hydrofoil, and the thickness yb of the hydrofoil varies with chord length c0, as follows:
{ 0 z c 0 0.5 y b c 0 = 0.1737 ( z c 0 ) 1 / 2 0.2422 ( z c 0 ) + 0.3046 ( z c 0 ) 2 0.2657 ( z c 0 ) 3 0.5 < z c 0 1.0 y b c 0 = 0.0004 + 0.1737 ( 1 z c 0 ) 0.1898 ( 1 z c 0 ) 2 + 0.0387 ( 1 z c 0 ) 3
The initial chord length c0 of the research object is 110 mm, and it is truncated at c = 100 mm, the maximum thickness hmax of NACA0009 is 9.9 mm, its total span length b is 150 mm, and its incidence angle is α. One side of the hydrofoil is installed on the fixed wall, and there is a clearance between the other side and the wall of the flume. The inflow velocity Vin is the average velocity on the inlet section of the flume, and its direction is perpendicular to the inlet section. The dimensionless clearance width τ is the ratio of the clearance width w and the maximum thickness of the hydrofoil hmax. The red arrow represents the coordinate system. The coordinate origin is located on the end wall of the experimental section, the corresponding plane is x = 0, and the center of the maximum thickness of the hydrofoil is at y = 0. The z-axis direction is along the incoming flow direction. The position of different flow direction planes is represented by the ratio z/c of z coordinate and hydrofoil chord length c. The geometric parameters of the fluid domain are shown in Figure 1.

3. Mathematical Methods

3.1. Turbulence Model

At present, the commonly used numerical simulation methods for solving turbulence mainly include the Reynolds-Averaged Navier–Stokes (RANS) method [30] and large eddy simulation (LES) [31]. The RANS method represents the physical quantities in turbulence as the sum of an average value and a fluctuating value, and predicts the average properties of the fluid by solving the RANS equations. The RANS method has a small amount of calculation, but its calculation accuracy is poor. The Large eddy simulation is a numerical calculation method between direct numerical simulation (DNS) and RANS. Compared with the RANS method, the LES requires a relatively high grid resolution in the near wall area, which leads to a large amount of calculation, although its calculation accuracy is higher.
For the sake of reducing the amount of calculation and ensure reliable accuracy, Strelets et al. [32] mixed the RANS and LES models and proposed a detached eddy simulation (DES). It adopts the RANS method in the boundary layer region and the LES method in other regions. The DES overcomes the problem of the large calculation amount of the LES method in the near wall area, at the same time, it gives full play to the advantages of the LES method in a better simulation accuracy of turbulent flow. The DES can retain more detailed flow field details, and is the most effective turbulence model to simulate turbulence at present and in the future. Su et al. [33] used the DES method to simulate the tip leakage vortex of the compressor rotor, and verified the feasibility of the DES simulation in the tip leakage vortex simulation by comparing it with the RANS results. Whether the RANS turbulence model or LES turbulence model is used in the DES, it is determined by the scale of dissipation term, and the formula is:
l = min { l R A N S , l L E S }
l R A N S = k 0.5 / C μ ω
l L E S = C D E S Δ
Δ = min { Δ x , Δ y , Δ z }

3.2. Orthogonal Experiment Method

Orthogonal experiment method [34] is a scientific method to deal with multifactor tests. The basic method is to select representative “uniformly dispersed, neat and comparable” test points from comprehensive tests, replace large-scale comprehensive tests with representative tests with fewer test times, and conduct a comprehensive analysis of tests with certain mathematical methods. The advantage of this method is that it can achieve the same mathematical accuracy as the overall test while reducing the number of tests, and provide efficient, fast and economic solutions for related problems.
In this study, the orthogonal experiment method is used to carry out the CFD orthogonal simulation analysis at three factors and four levels for four kinds of tip clearance widths (τ = 0.2, τ = 0.5, τ = 1, τ = 2), four kinds of incoming flow velocities (Vin =5 m/s, Vin =10 m/s, Vin = 15 m/s, Vin = 20 m/s), and four kinds of incidence angle (α = 5°, α = 7°, α = 10°, α = 12°). The orthogonal experiment scheme is designed using L16 (43) orthogonal table, and the orthogonal experiment design table is shown in Table 1.

3.3. Fractal Dimension

Dimension is an important characteristic quantity of an object. In Euclidean geometry, the dimension of an object is integer. Generally, the dimension of a line or curve is 1, the dimension of a plane or sphere is 2, and the dimension of an object with length, width, and height is 3. However, some complex graphics, such as coastline and Koch curve, are unable to be described by the number of dimensions equal to 1, 2, and 3. The Koch curve is an infinite and continuous loop, which will never intersect itself. The area enclosed by the loop is limited, and it is less than the area of a circumscribed circle. Therefore, the Koch curve is squeezed into a limited area with its infinite length, which really occupies space. Its dimension is more than 1-dimension, but less than a 2-dimension figure, that is, its dimension is between 1 and 2, and the dimension is a fraction, this is also called fractal dimension. Fractal dimension is a measure of the effectiveness and irregularity of the space occupied by complex objects. Generally speaking, the fractal dimension of the fractal curve is between 1 and 2. As the fractal dimension increases, the curve becomes more complex and the plane occupied is larger [35].
In fractal geometry, there are many ways to calculate the fractal dimension. In the study of a vortex, we often encounter irregular island graphics, which are called fractal islands. The edge line of the vortex is usually circular or elliptical, and its fractal dimension is suitable to be calculated by the area perimeter method. Therefore, this article uses perimeter fractal dimension, based on perimeter, to calculate the fractal dimension of TLV, its mathematical expression is as follows:
P = k A D 2
where P is the perimeter of the vortex, A is the area, D is the fractal dimension, and k is the scale constant. For a single vortex structure, the calculation formula of its perimeter fractal dimension is as follows:
D = 2 log P log A

4. Computational Fluid Dynamics Simulation

4.1. Computing Domain Grid Division

Grid generation is a key step in numerical simulation. The quality and quantity of grid generation have a significant impact on the results of numerical simulation. Owing to the simple structure of the hydrofoil model, and in order to improve the calculation accuracy and reduce calculation time, we use ICEMCFD software to generate hexahedral structured grids for the computational domain. First, the topological structure is divided according to the geometric structure of the computational domain, then the hexahedral structure grid is divided, meanwhile, the gap and boundary layer grids are locally densified. For the sake of reducing the effect of grid scale on the calculation results, this paper checks the grid independence of the three grid schemes with the hydrofoil lift coefficient Cl and drag coefficient Cd as the index. The calculation formula of lift coefficient Cl and drag coefficient Cd [36] is:
C l = L 1 2 ρ V i n 2 c
C d = D 1 2 ρ V i n 2 c
where L is the lift acting on the hydrofoil, D is the drag acting on the hydrofoil, ρ is the density of the fluid medium, Vin is the inlet velocity of the computational domain, and c is the chord length of the hydrofoil. The calculation of grid convergence index (GCI) [37] is shown in Table 2.
Table 2 shows that the grid convergence index of the three grid schemes is less than 3%, meeting the grid convergence standard. Considering the calculation accuracy and speed, Grid Scheme 2 is finally selected for hydrofoil grid generation. The grid generation diagram is shown in Figure 2.

4.2. Computational Fluid Dynamics Setups

In this article, the software ANSYS CFX is used for numerical simulation, and the turbulence model is the DES model. The fluid medium is water at 25 °C, and its density ρ = 1000 kg/m3, kinematic viscosity ν= 10−6 m2/s. The reference pressure is set to 1 standard atmospheric pressure. The boundary conditions are as follows:
(1)
The inlet is set as velocity inlet, the inflow velocity Vin is determined according to the orthogonal experiment table, and the turbulence intensity is set as 1%.
(2)
The outlet is pressure outlet, and the outlet pressure is set as 0 Pa.
(3)
The other walls are no-slip walls.
The solver time step is set as 0.1 s, RMS residual is set as 10−6, and the maximum iterative steps are 1000. Unsteady calculation is founded on the calculation results of 1000 step steady calculation. The total time of unsteady calculation is 0.2 s, each time step is 0.0001 s. Each time step can be iterated up to 10 times, and the convergence criterion is RMS = 1.0 × 10⁻⁵.

4.3. Comparison between the Experiment and Numerical Simulation

In this paper, the effects of different clearance widths, incidence angles, and inflow velocities on tip leakage flow are studied by a numerical simulation method. For the sake of verifying the effectiveness of the numerical simulation, we compare the numerical simulation results of test number 14 with the experimental results, and the experimental results are taken from the literature [21].
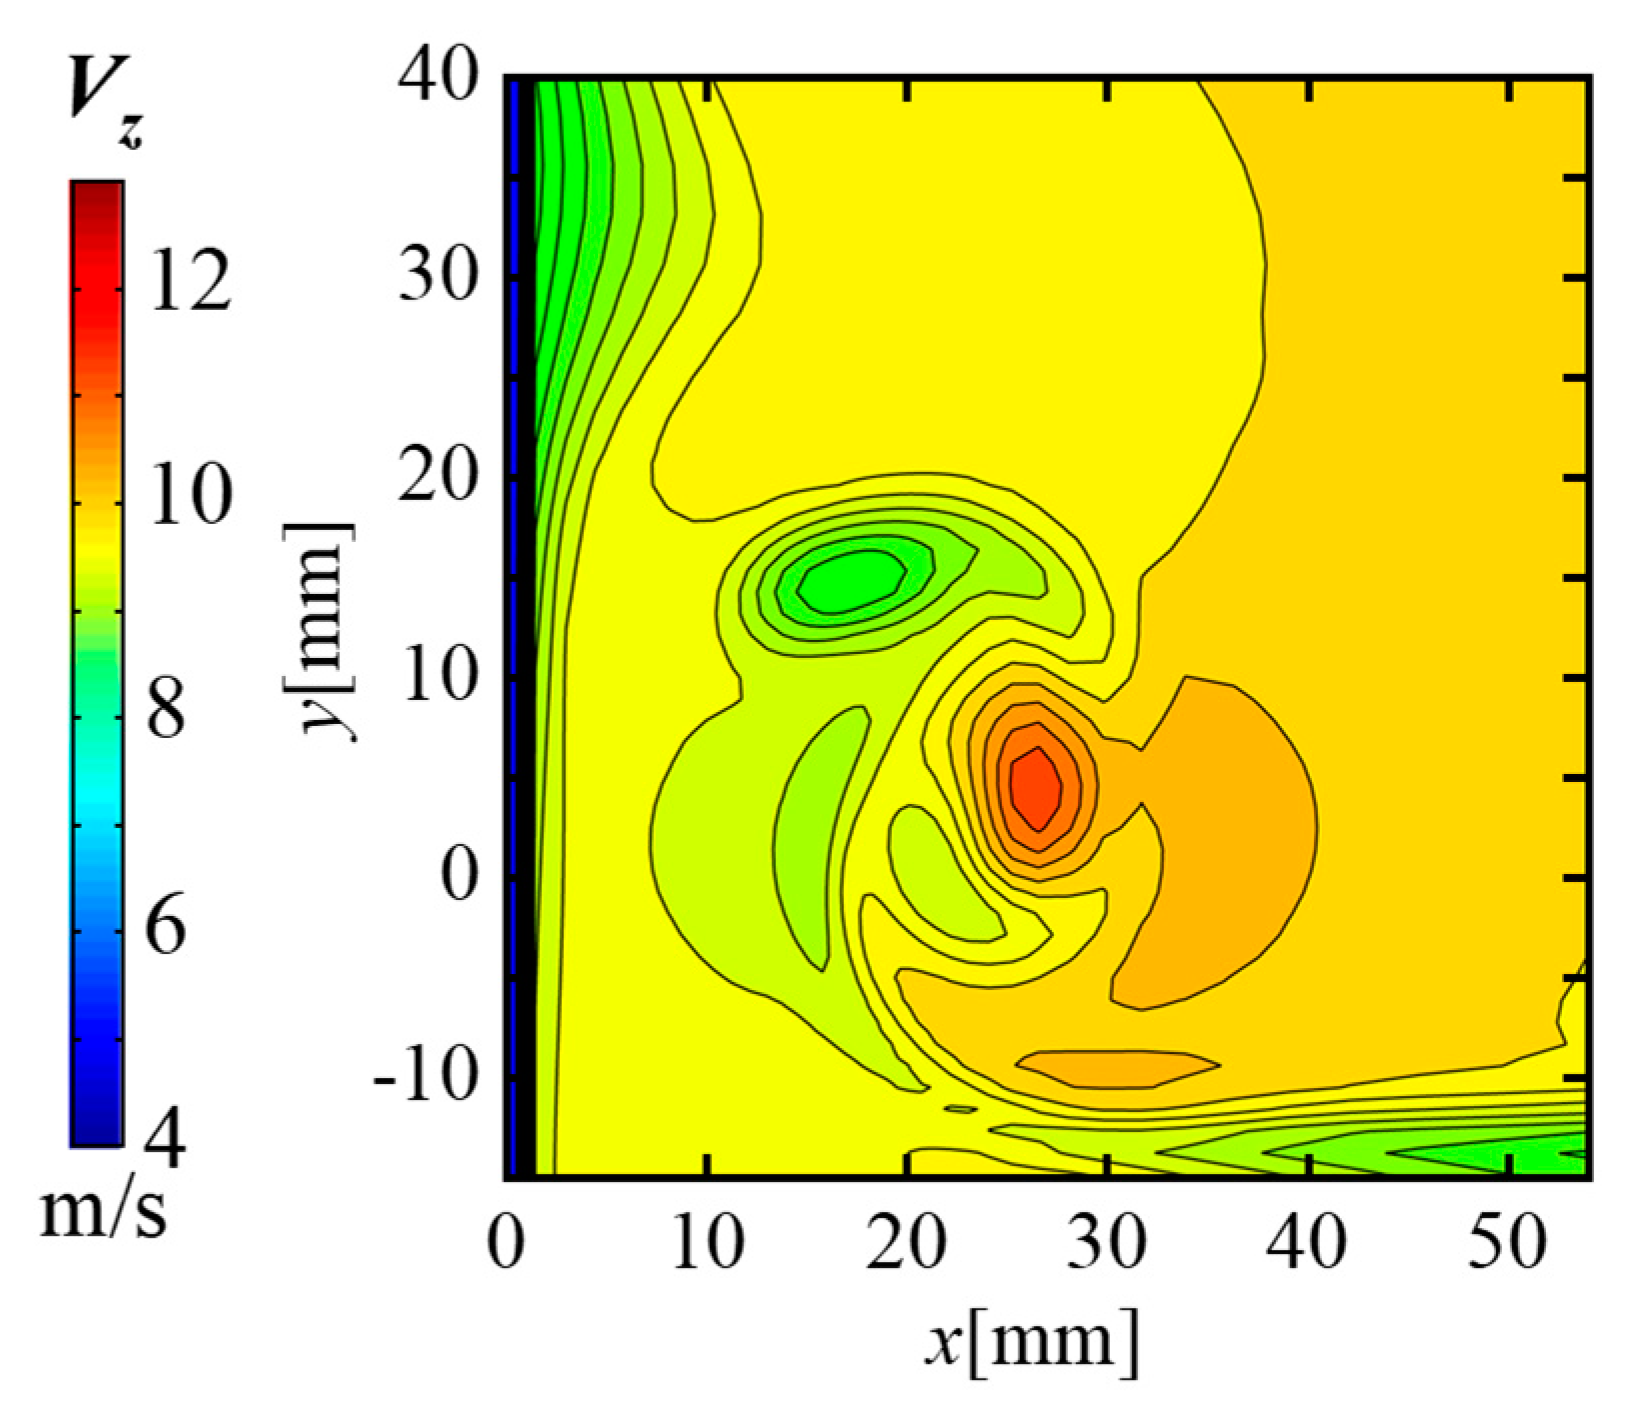
According to the axial velocity contour at the position z/c = 1 downstream of the hydrofoil obtained from the experiment, we take the axial velocity contour at the same condition from the numerical simulation results to compare with the experimental results. The comparison results are shown in Figure 3. From the figure, we can see that the axial velocity distribution at the position z/c = 1 obtained by numerical simulation is basically the same as the experimental results. The horizontal and vertical positions of the vortex center are about 25 mm and 5 mm, respectively. The fluid at the vortex center presents a “jet” state, and its axial velocity is larger than the axial velocity of the surrounding flow. Influenced by the side wall and leakage flow, the fluid velocity on the left and right sides of the vortex center shows obvious differences. Specifically, the fluid velocity on the left side is obviously lower than the right side. On the left side of the TLV, it can also be observed that a low-speed flow vortex cluster is generated, and the vortex cluster is in the shape of “C” to wrap the TLV.
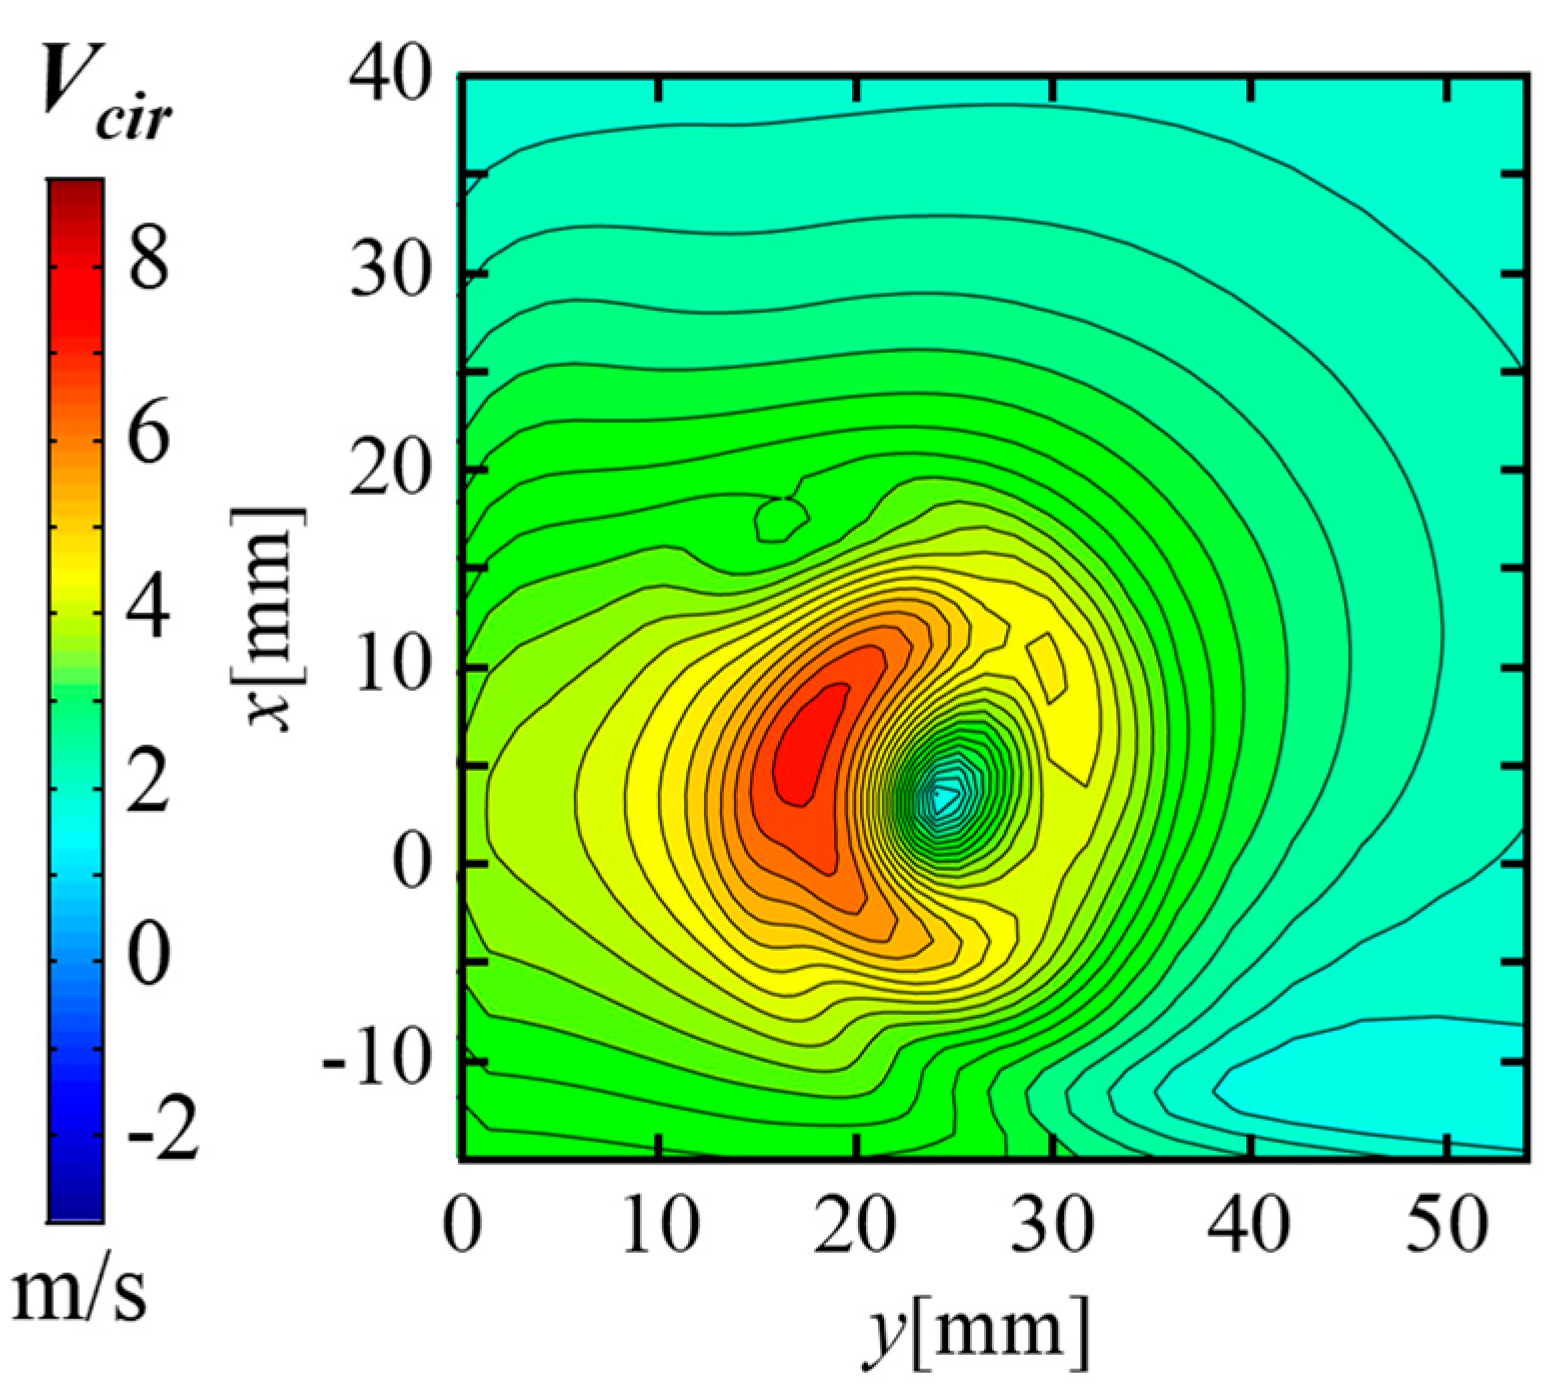
Figure 4 shows the contrast of the experimental results and numerical simulation results of the fluid circumferential velocity at the position z/c = 1. The calculation of the circumferential velocity Vcir is as follows:
V c i r = V x 2 + V y 2
where Vx and Vy are the velocity components of fluid velocity in x and y directions, respectively. From the figure, we can see that the CFD simulation results are highly consistent with the experimental results. The circumferential velocity of the fluid at the vortex center is lower than that of the surrounding flow field. On the left side of the vortex core, due to the pressure difference between the upper and lower sides of the hydrofoil, the fluid on the high-pressure side bypasses the tip clearance to reach the low-pressure side, resulting in the formation of a Vcir peak area between the TLV area and the wall. The CFD simulation can better capture the tip leakage vortex center and the high-speed flow area on the left side of the vortex center, and the global characteristics can be well predicted.

5. Analysis of the Orthogonal Experiment Results

5.1. Effect of Different Parameters on the Pressure Coefficient of the Vortex Core

To better analyze the effect of different factors, we cut three planes in the calculation domain: the tail section of the hydrofoil (z/c = 0.2), the trailing edge section of the hydrofoil (z/c = 0.5), and the downstream section of the hydrofoil (z/c = 0.8). Then, the range analysis of the pressure coefficient, longitudinal position, and velocity of the vortex core on the three planes are carried out. The position of the vortex core is determined by the lowest pressure position of the vortex. Prior to the range analysis, we first calculate the average value kij of the test index sum. The calculation of kij is as follows:
k i j = j = 1 j max I i j / j max
In this formula, I is the value of the analyzed test index, the subscript i represents the test factor at the i level, and the subscript j is the number of repeated tests of the test factor at the i level. The number of levels of each factor in this study is 4, so jmax = 4. Then we calculate the range Rij according to the average value. The calculation formula of Rij is as follows:
R i j = max ( k i j ) min ( k i j )
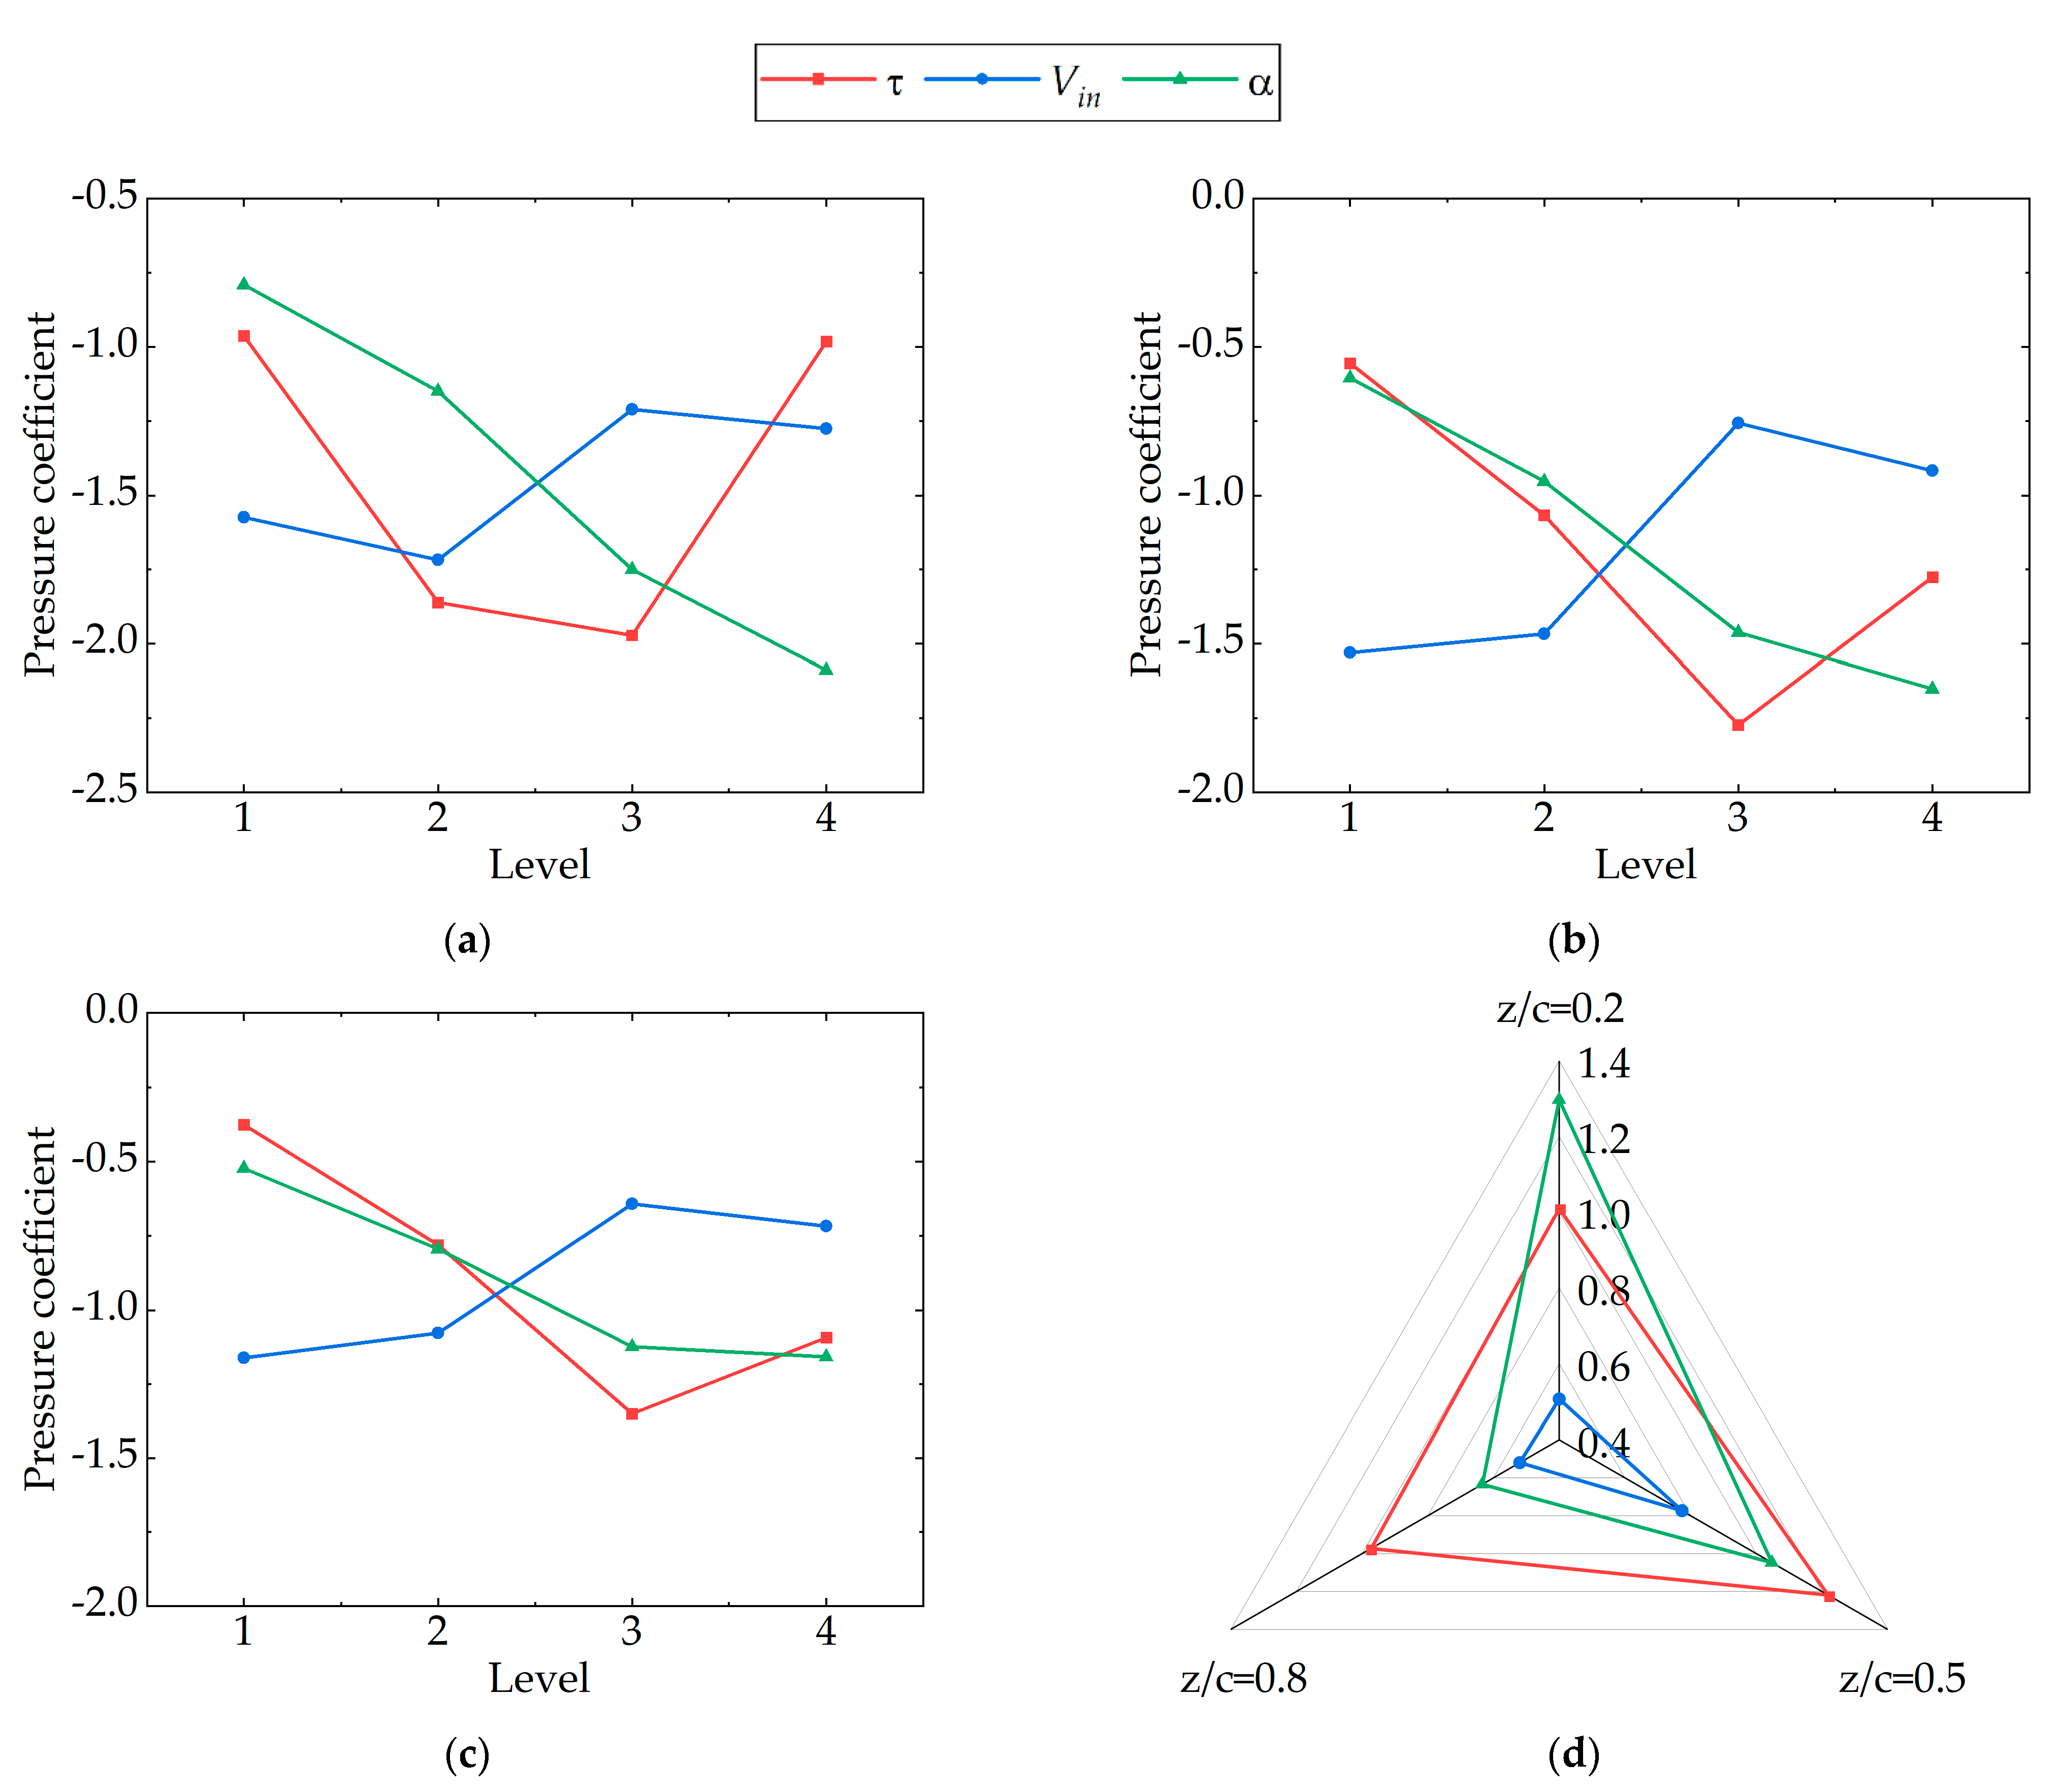
Then, we calculate the average value and range of different test indexes according to Formula 10 and Formula 11. Figure 5 shows the average and range changes of the pressure coefficient Cp of the TLV core at different flow directions under different influencing factors and levels. The calculation formula of the vortex core pressure coefficient Cp [38] is as follows.
C p = 2 ( p c p i n ) ρ V i n 2
where, pc is the vortex center pressure, pin and Vin is the average pressure and average velocity at the inlet of the calculation domain, respectively, ρ is the density of the fluid medium.
The average value and range change of pressure coefficient at different flow direction positions under different influencing factors and levels are shown in Figure 5. From the figure, we can see that the change rule of the pressure coefficient with a certain influencing factor is basically the same in different flow direction positions. The pressure coefficient falls first and then rises with the increase of the gap width, rises with the increase of the inlet velocity, and falls with the rise of the incidence angle. It can be seen from the range analysis results that the inlet velocity has the smallest effect on the vortex core pressure coefficient, and the incidence angle has the largest influence on the vortex core pressure coefficient at z/c = 0.2, with the range Rij about 1.3; at z/c = 0.5 and z/c = 0.8, the gap width has the greatest impact on the vortex core pressure coefficient. Compared with the trailing edge and downstream section of the hydrofoil, the Cp of the hydrofoil tail (z/c = 0.2) is the smallest under different influencing factors and levels, which is prone to cause cavitation. In a certain range, reducing the angle of attack of the hydrofoil and increasing the inlet velocity can cause the pressure coefficient to increase and reduce the cavitation hazard.

5.2. Effect of Different Parameters on the Vortex Core Velocity

To visually reflect the difference between the vortex core velocity and the mainstream velocity, the ratio Vy/Vin of the vortex core velocity component Vy and the average velocity Vin at the inlet of the fluid domain is defined as the vortex core velocity coefficient Cv. Figure 6 shows the average value and range change of the vortex core velocity coefficient at different positions under different influence factors and levels. It can be seen from the variation rule of the average velocity coefficient that the variation trend of the velocity coefficient and pressure coefficient with gap width and inlet velocity is basically opposite. When the velocity coefficient rises, the pressure coefficient decreases owing to the decrease of the pressure generated by the high-speed flow. However, the change trend of the velocity coefficient and pressure coefficient with the incidence angle is basically the same. Reducing the incidence angle can not only increase the velocity coefficient, but also increase the pressure coefficient. From the results of the range analysis, we can see that the influence of the gap width on the velocity coefficient is dominant. When the gap width is small, the velocity coefficient Cv < 1, the leakage vortex velocity is smaller than the mainstream velocity, and the leakage vortex is in a low-speed “wake” state; when the gap width is large, the velocity coefficient Cv > 1, the leakage vortex velocity is larger than the mainstream velocity, and the leakage vortex is in a high-speed “jet” state.

5.3. Effects of the Different Parameters on the Longitudinal Position of the Vortex Core

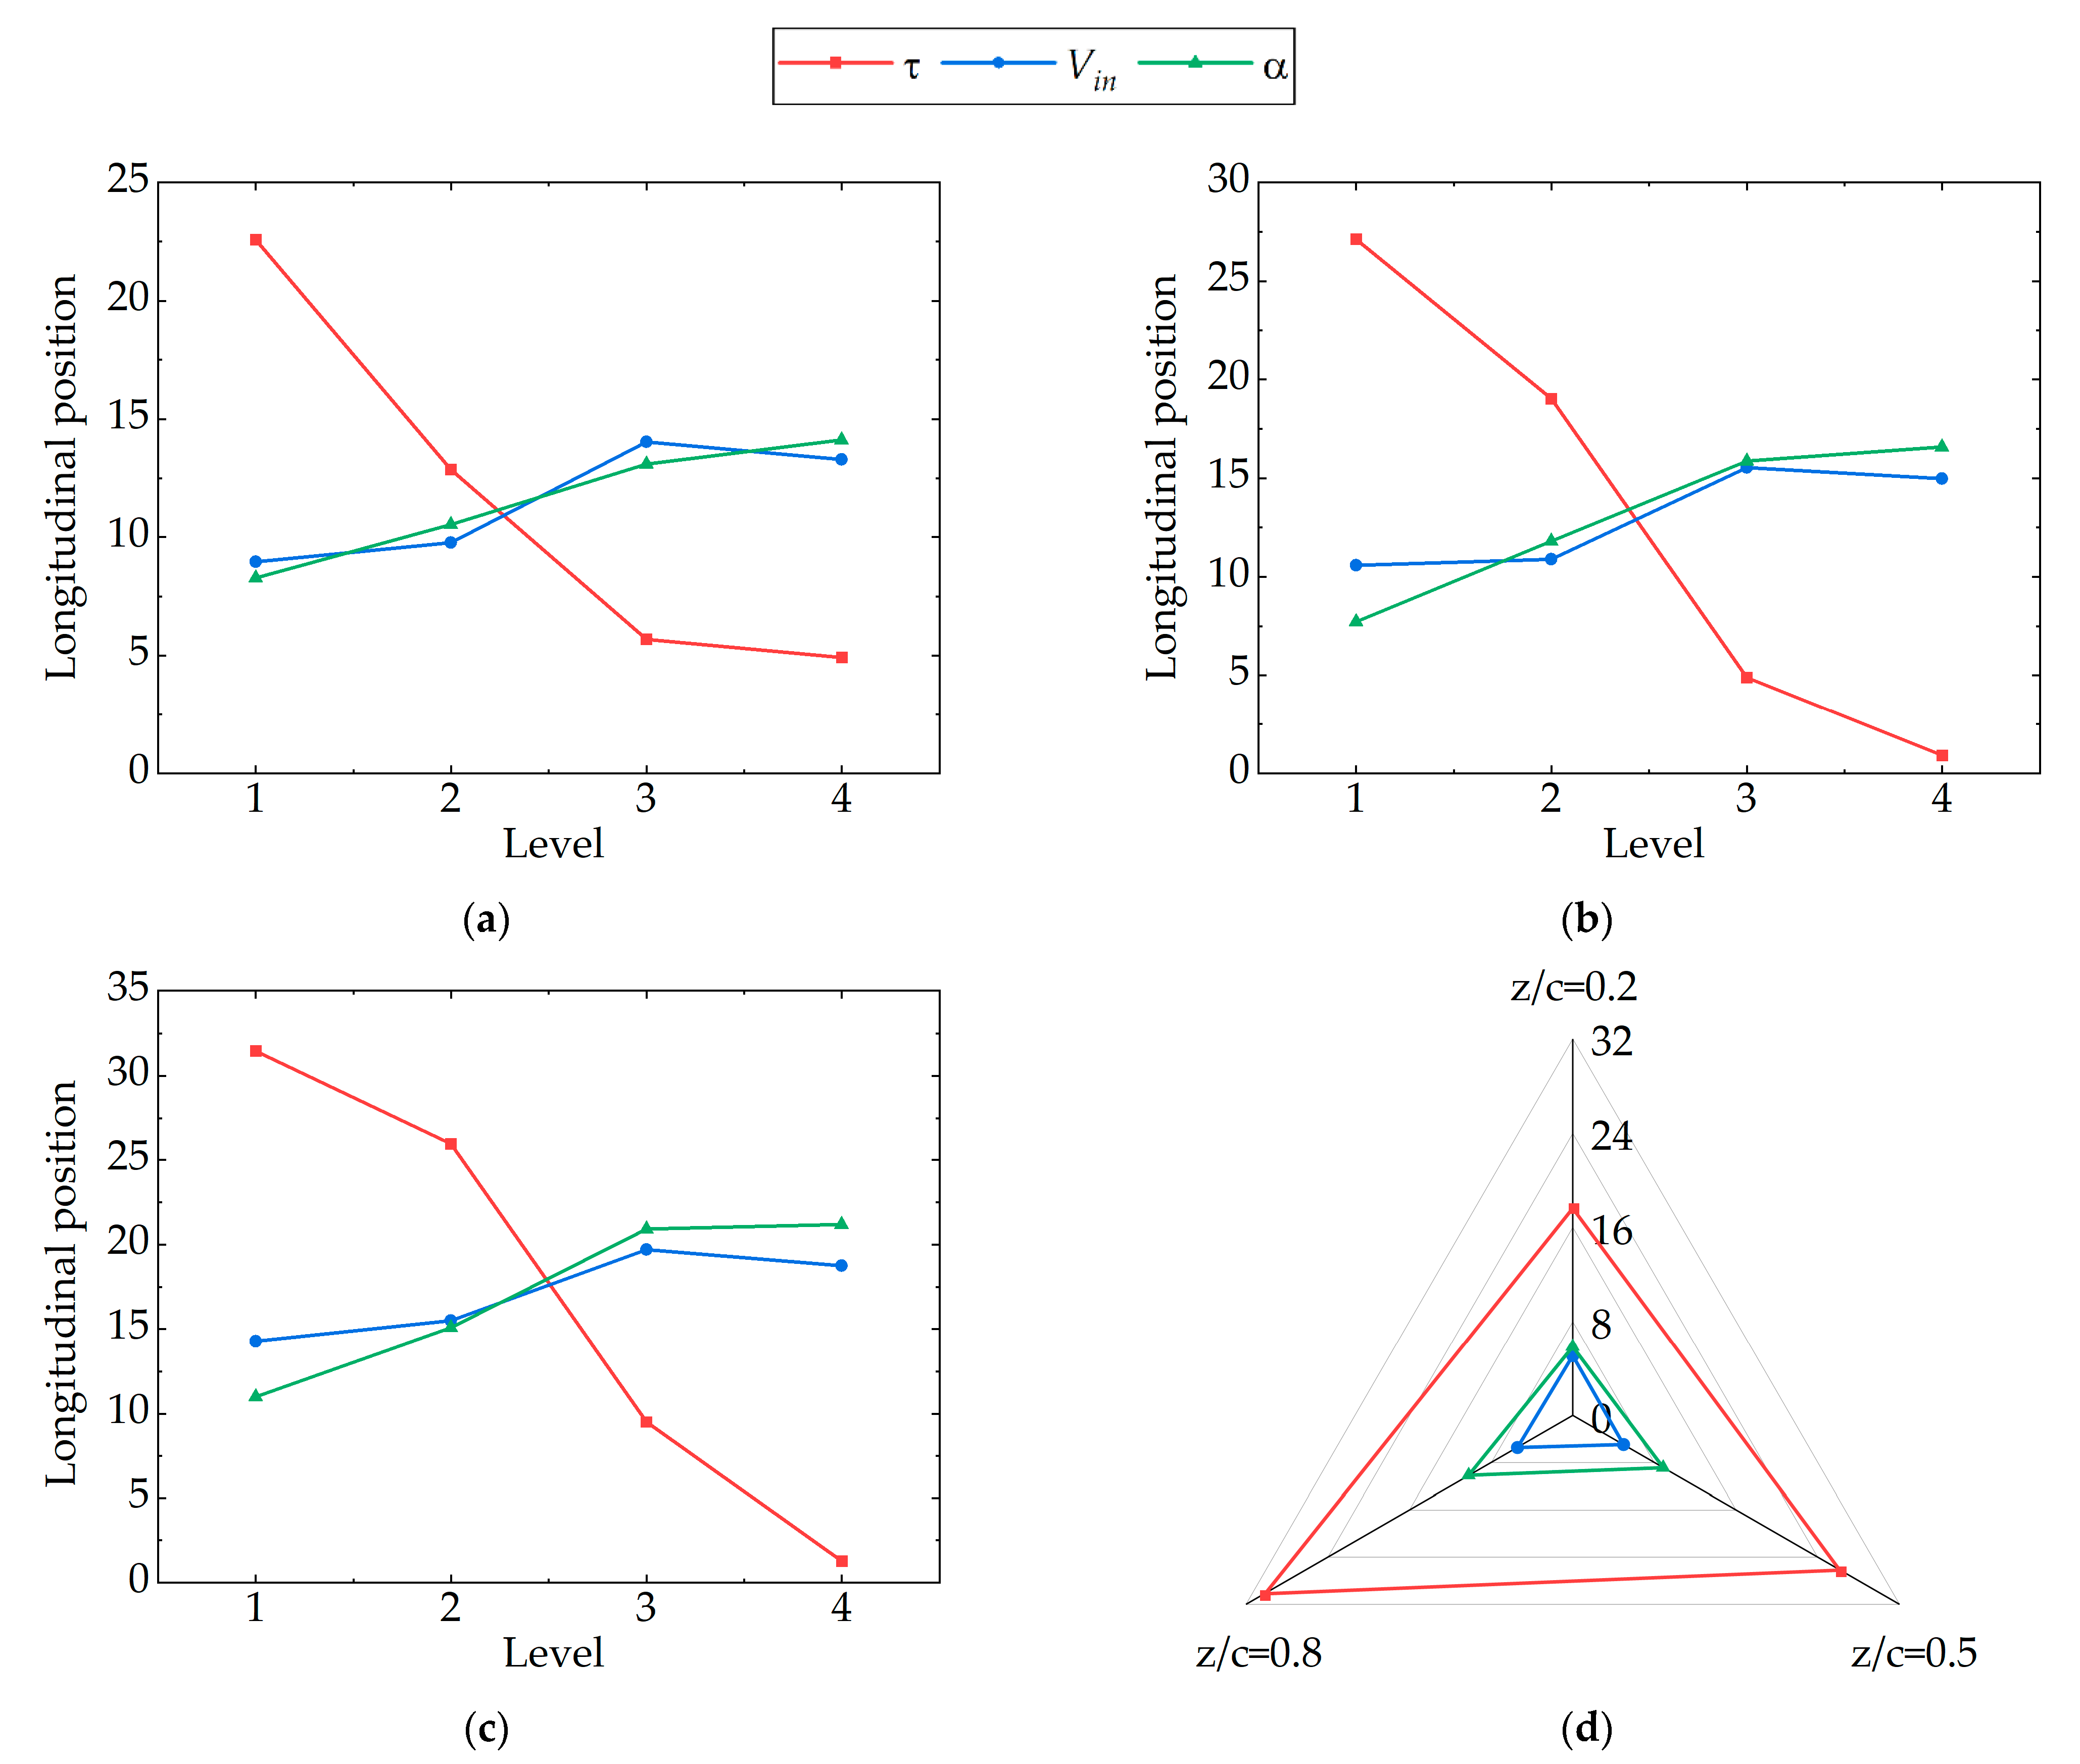
Figure 7 shows the average and range changes of the longitudinal positions of the vortex core in different flow directions under different influencing factors and levels. From the figure, we can see that on different flow direction planes, the longitudinal position of the vortex core changes in accordance with a certain influencing factor. The longitudinal position of the vortex core falls with the rise of the gap width, and rises with the rise of the inlet velocity and the incidence angle. From the range analysis results we can see that the inlet velocity has the least impact on the longitudinal position of the vortex core, followed by the angle of attack, and the clearance width has the greatest impact on the longitudinal position of the TLV core. When the clearance width is large, the longitudinal position of the vortex core is small; when the gap width is small, the longitudinal position of the vortex core is larger. This may be because when the gap width is small, the longitudinal velocity of the leakage flow affected by the pressure surface and suction surface is large, resulting in a larger longitudinal position of the tip leakage vortex.

5.4. Effects of the Different Parameters on the Length of Leakage Vortex

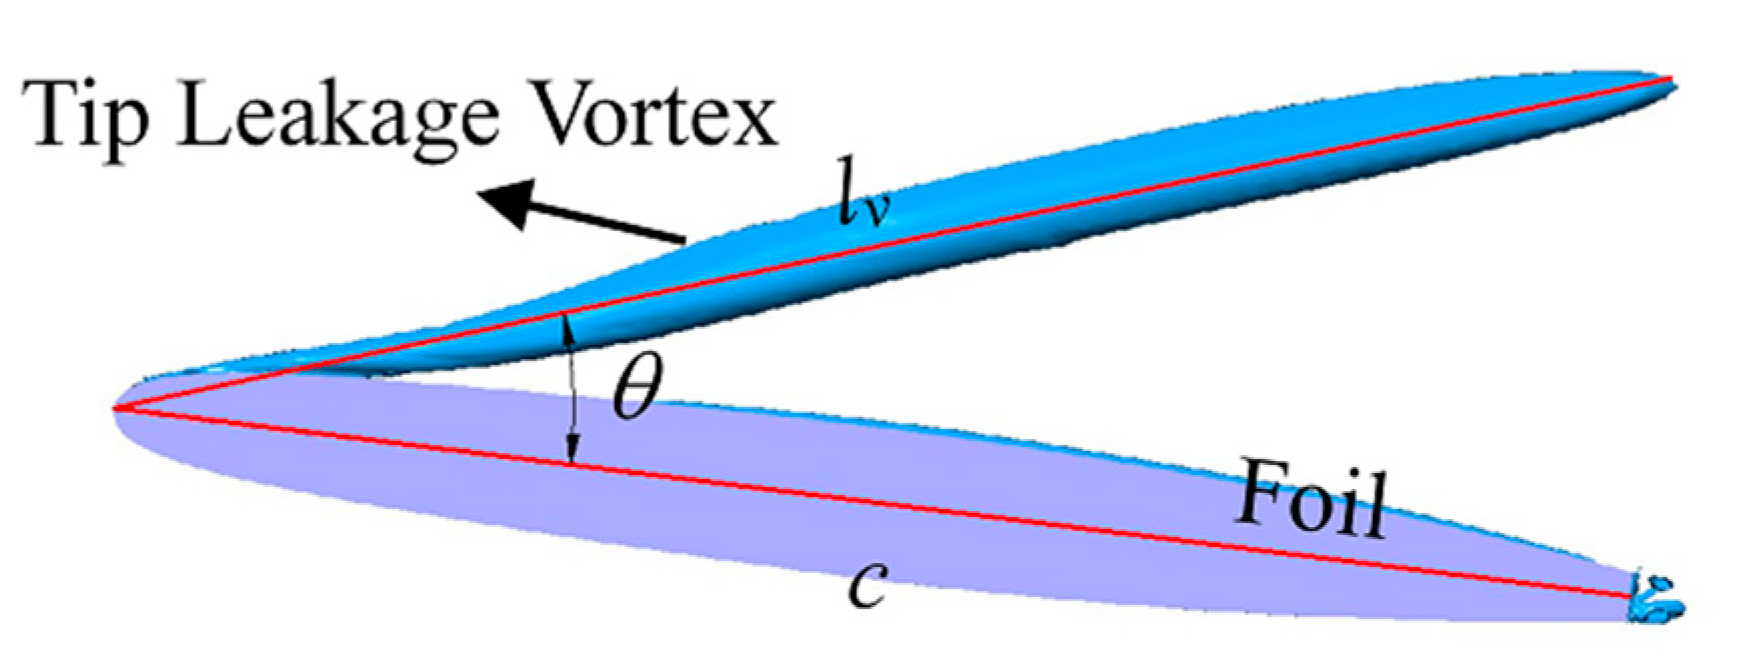
To further analyze the effect of different influencing factors on the TLV, we defined the length of TLV as lv and the angle of TLV as θ. The shadow of the hydrofoil and tip leakage vortex on the yz plane is shown in Figure 8, where c is the chord line of the hydrofoil. The line from the leading edge of the hydrofoil to the tail of TLV is defined as L, its length is the tip leakage vortex length lv, and the angle between the line L and the hydrofoil chord c is the tip leakage vortex angle θ.
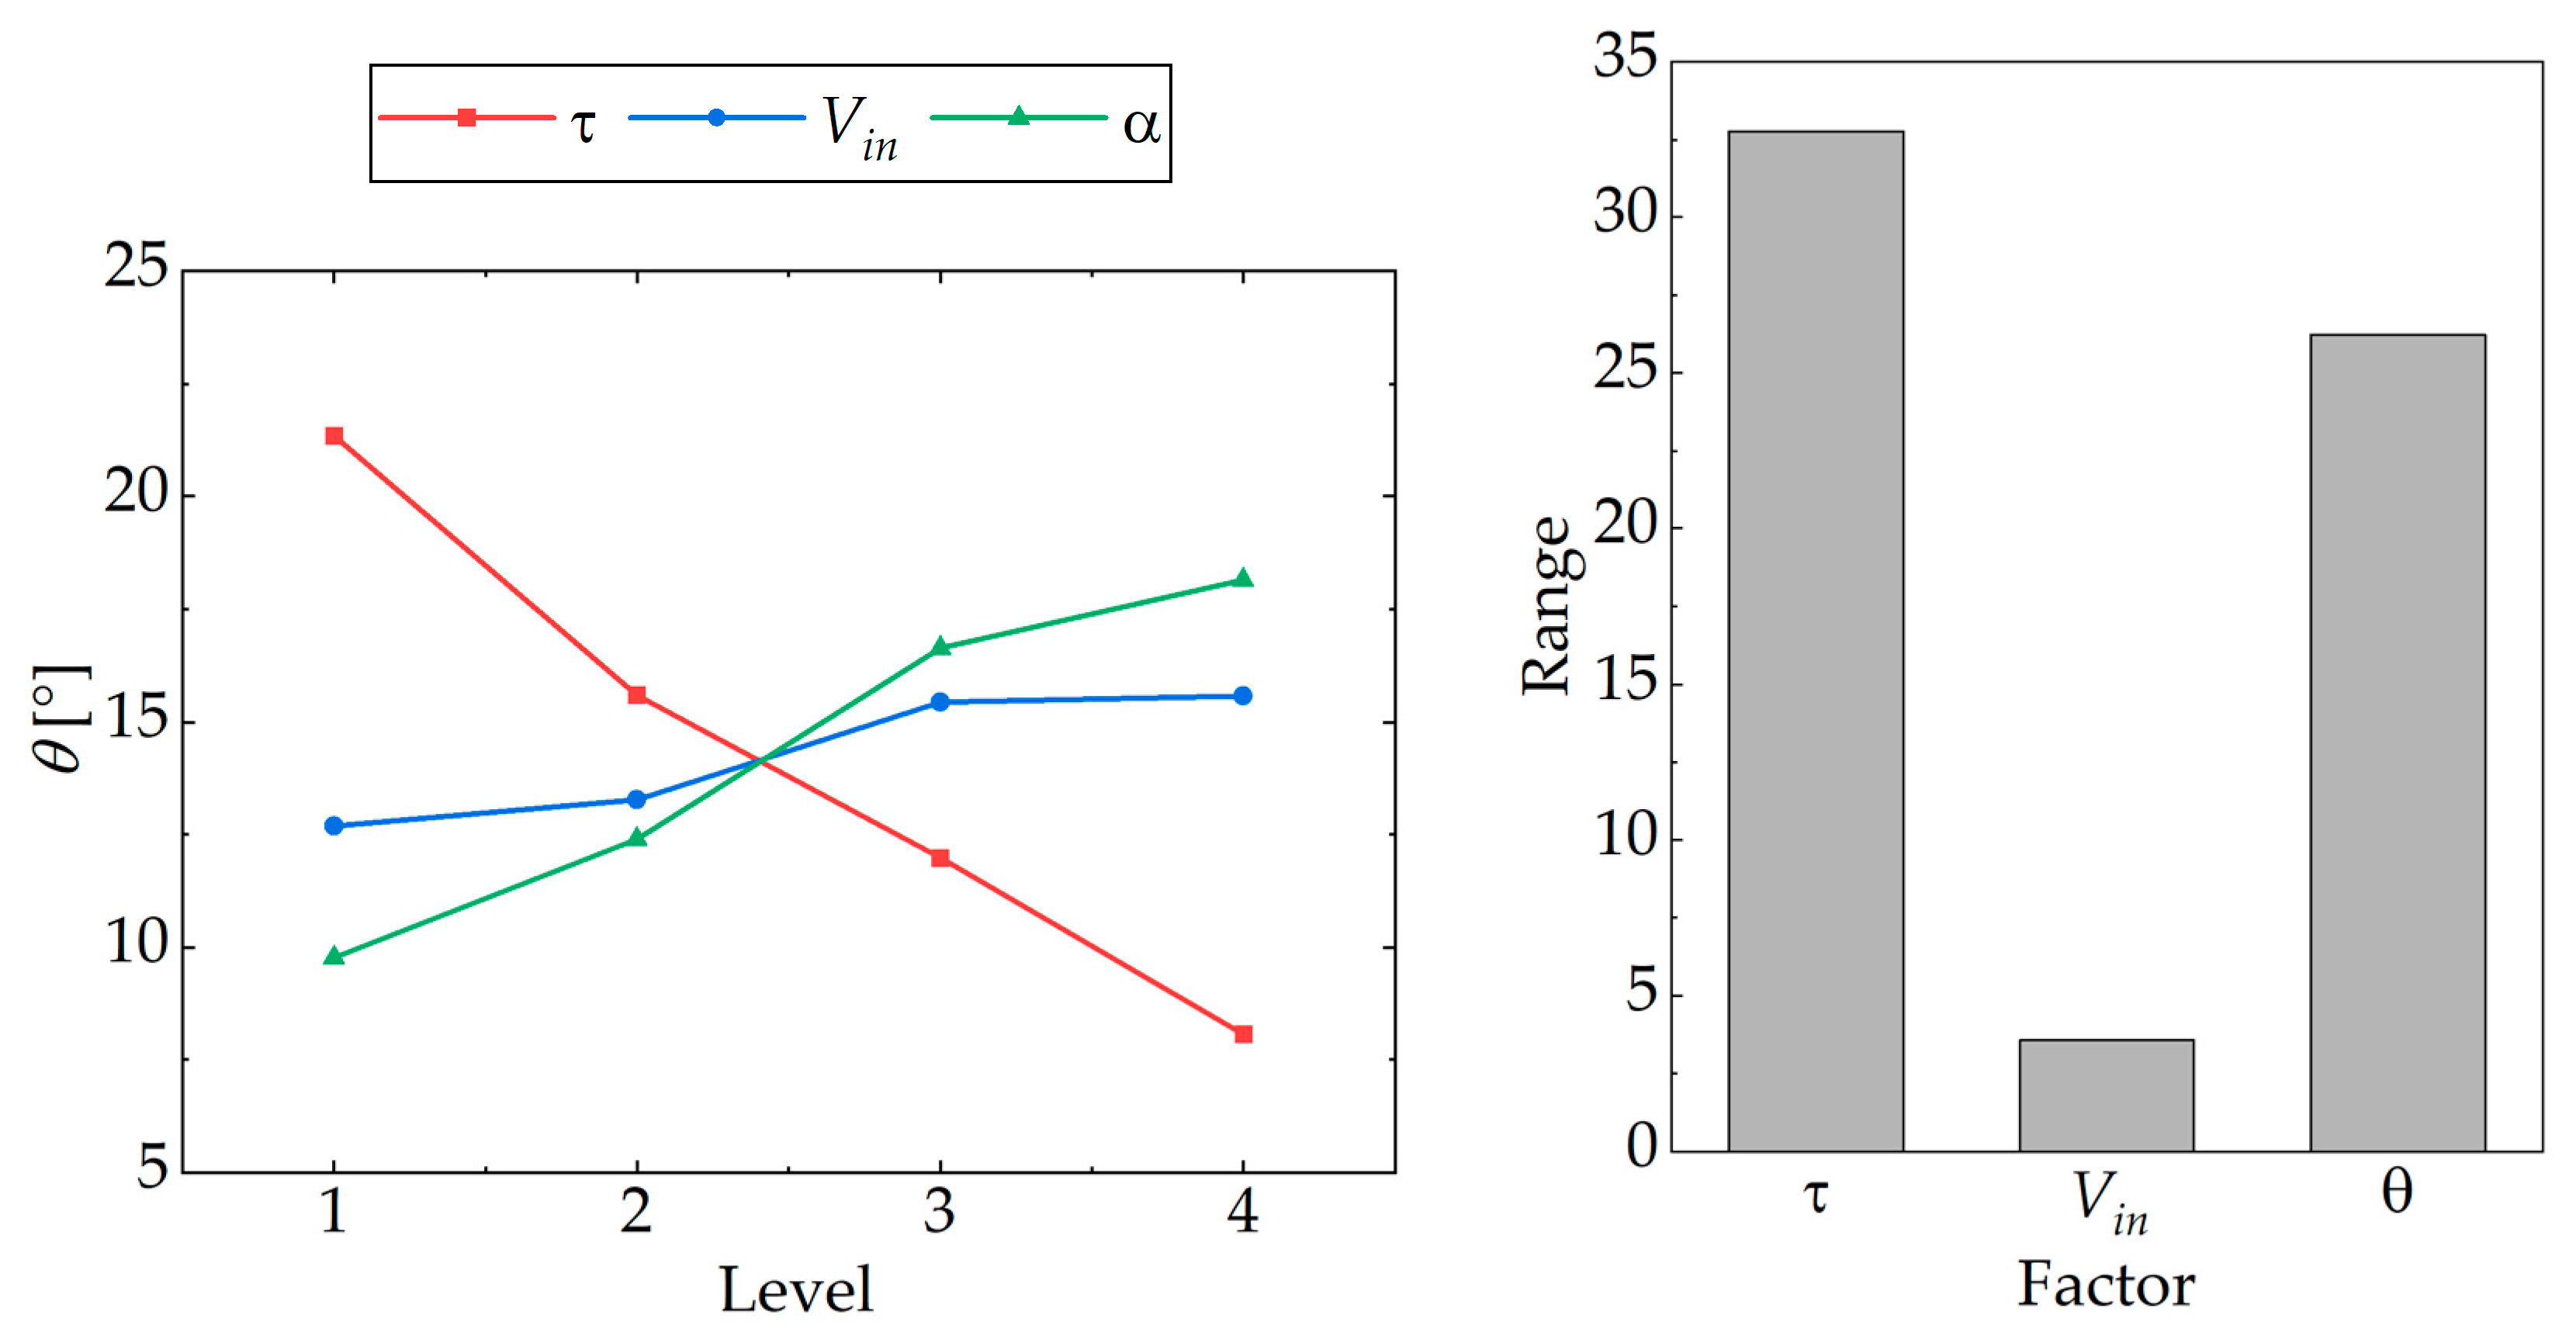
Figure 9 shows the average and range changes of the leakage vortex length under different influencing factors and levels. From the figure, we can see that the clearance width has the greatest impact on the tip leakage vortex length. When the clearance is small, the TLV length increases rapidly with the increase of the gap width; when the clearance is large, the TLV length rises slowly with the increase of the clearance width. The incidence angle has little effect on the TLV length. With the increase of the incidence angle, the TLV length decreases slowly. The inlet velocity has the least effect on the TLV length. With the increase of the inlet velocity, the TLV length is basically unchanged.

5.5. Effect of the Different Parameters on the Leakage Vortex Angle

Figure 10 shows the average value and range change of the leakage vortex angle under different influencing factors and levels. From the figure we can see that the influence of different factors on the tip leakage vortex angle is consistent with the influence on the TLV length. The gap width has the greatest effect on the TLV angle, the incidence angle has little effect on the TLV angle, and the inlet velocity has the least effect on the leakage vortex angle. The tip leakage vortex angle rises with the increase of the gap width, and falls with the increase of the inlet velocity and incidence angle.

6. Fractal Dimension Analysis

According to the average and range analysis of the TLV characteristics and movement trajectory of the above different influencing factors, the gap width has the most significant effect on the TLV characteristics and movement trajectory. For further understanding the specific impact of clearance width on TLV, we used the method of control variables to conduct an unsteady numerical simulation for hydrofoil models with four clearance widths, keeping the Vin at 10 m/s and the α at 10°.

6.1. Coarse Grained Analysis Method

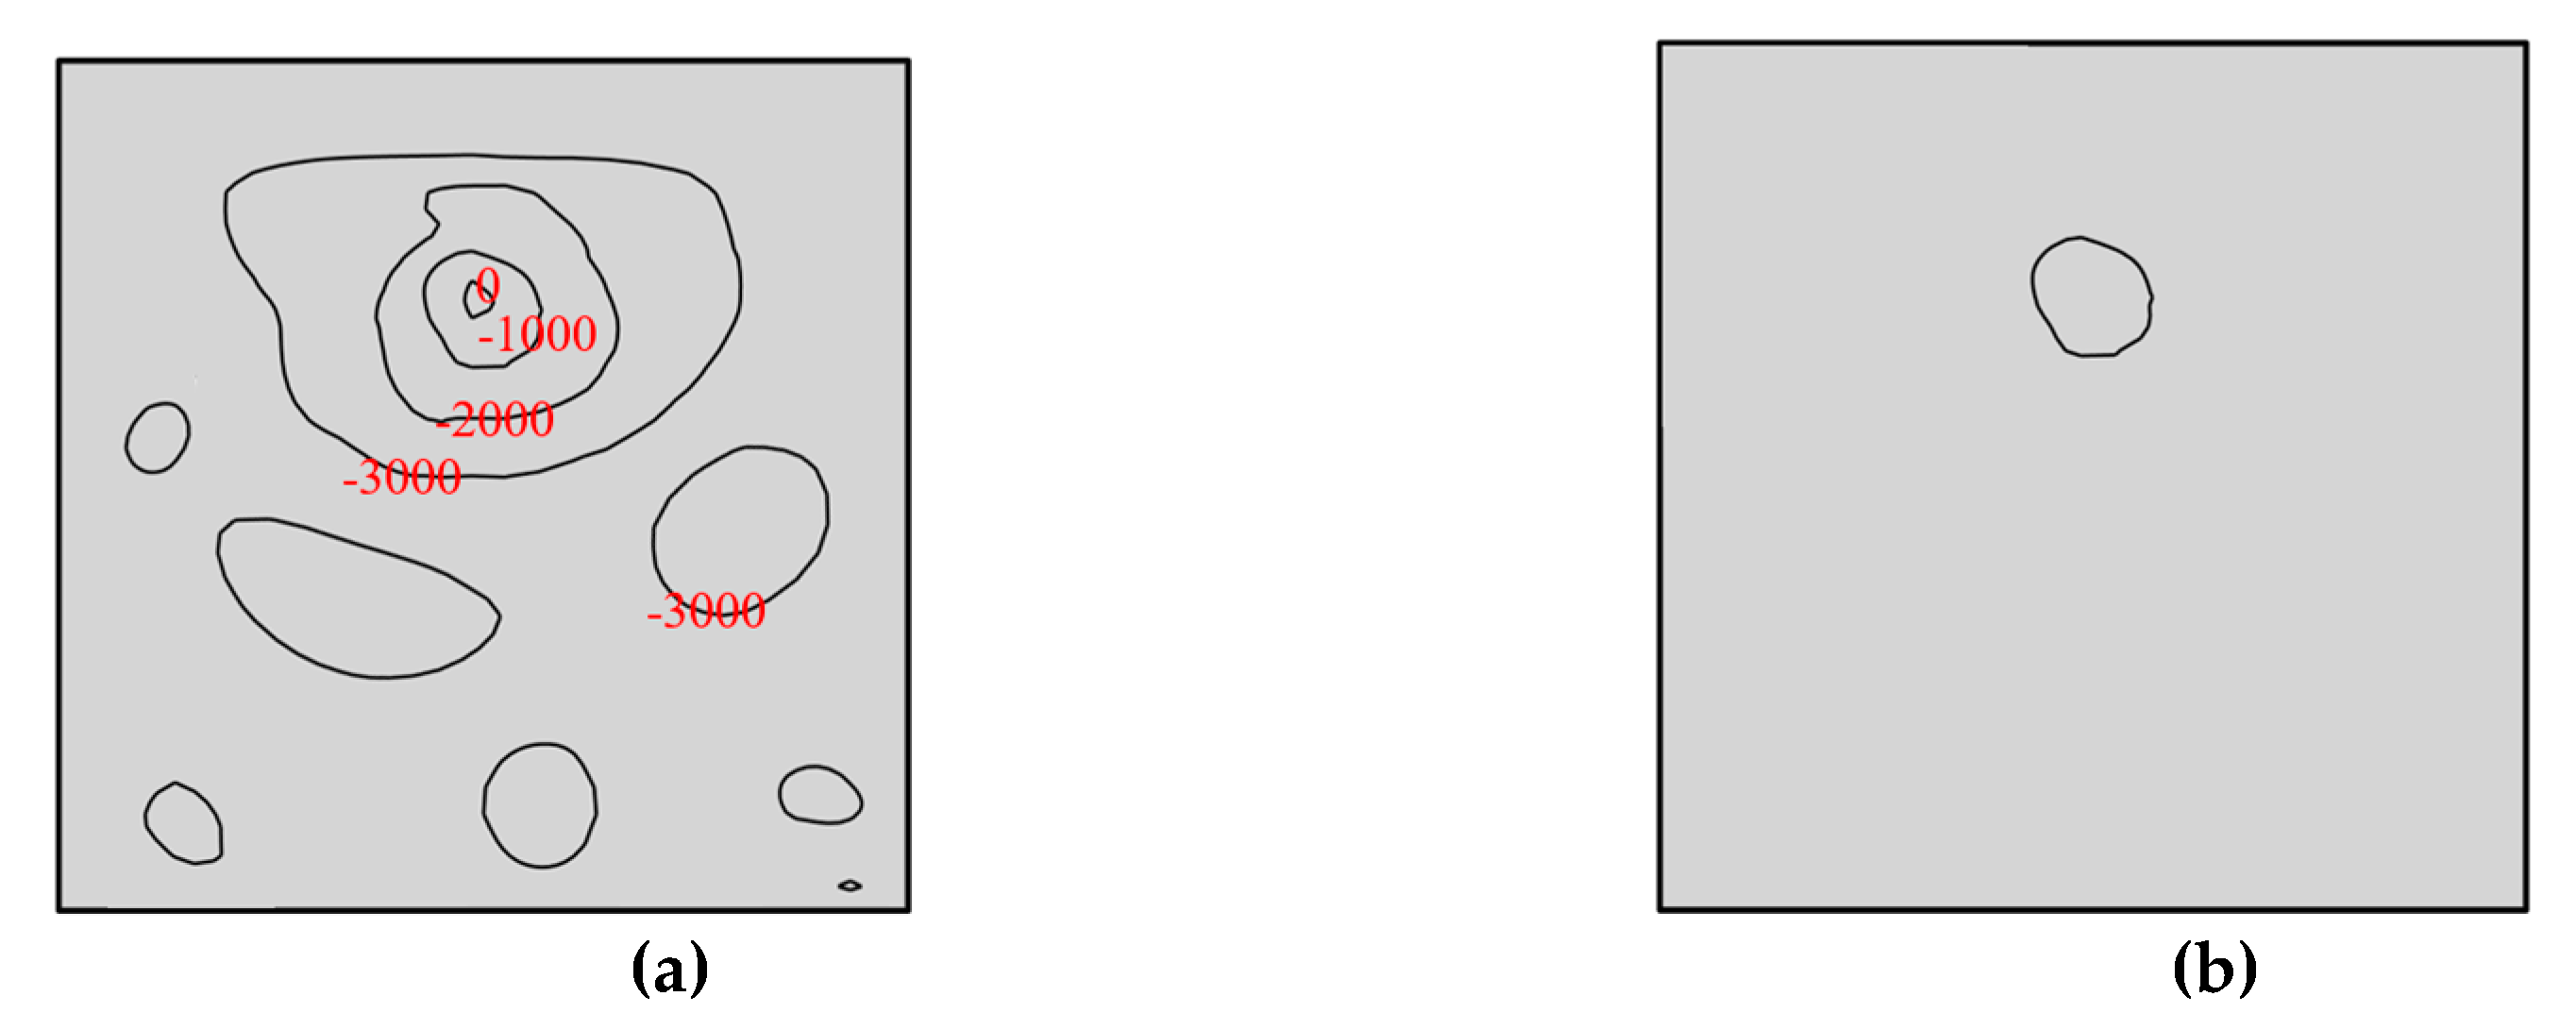
In this article, the λ2 method is applied to display the vortices generated by the flow of the hydrofoil. Figure 11a shows the λ2 contour map on a section downstream of the hydrofoil, where the red number is the value of the contour. This method of displaying the vortex structure can be considered as a description as “fine-grained”. Since the analysis in this section focuses on the fractal structure of the TLV edge line, we do not use the fine-grained analysis method, but use the coarse-grained analysis method. This method uses the contour line λ2 = −1000 to represent the edge line of the vortex without considering other contour lines. Figure 11b shows the coarse-grained description of Figure 11a. This method can highlight the key points and make the contour of the vortex clearer.
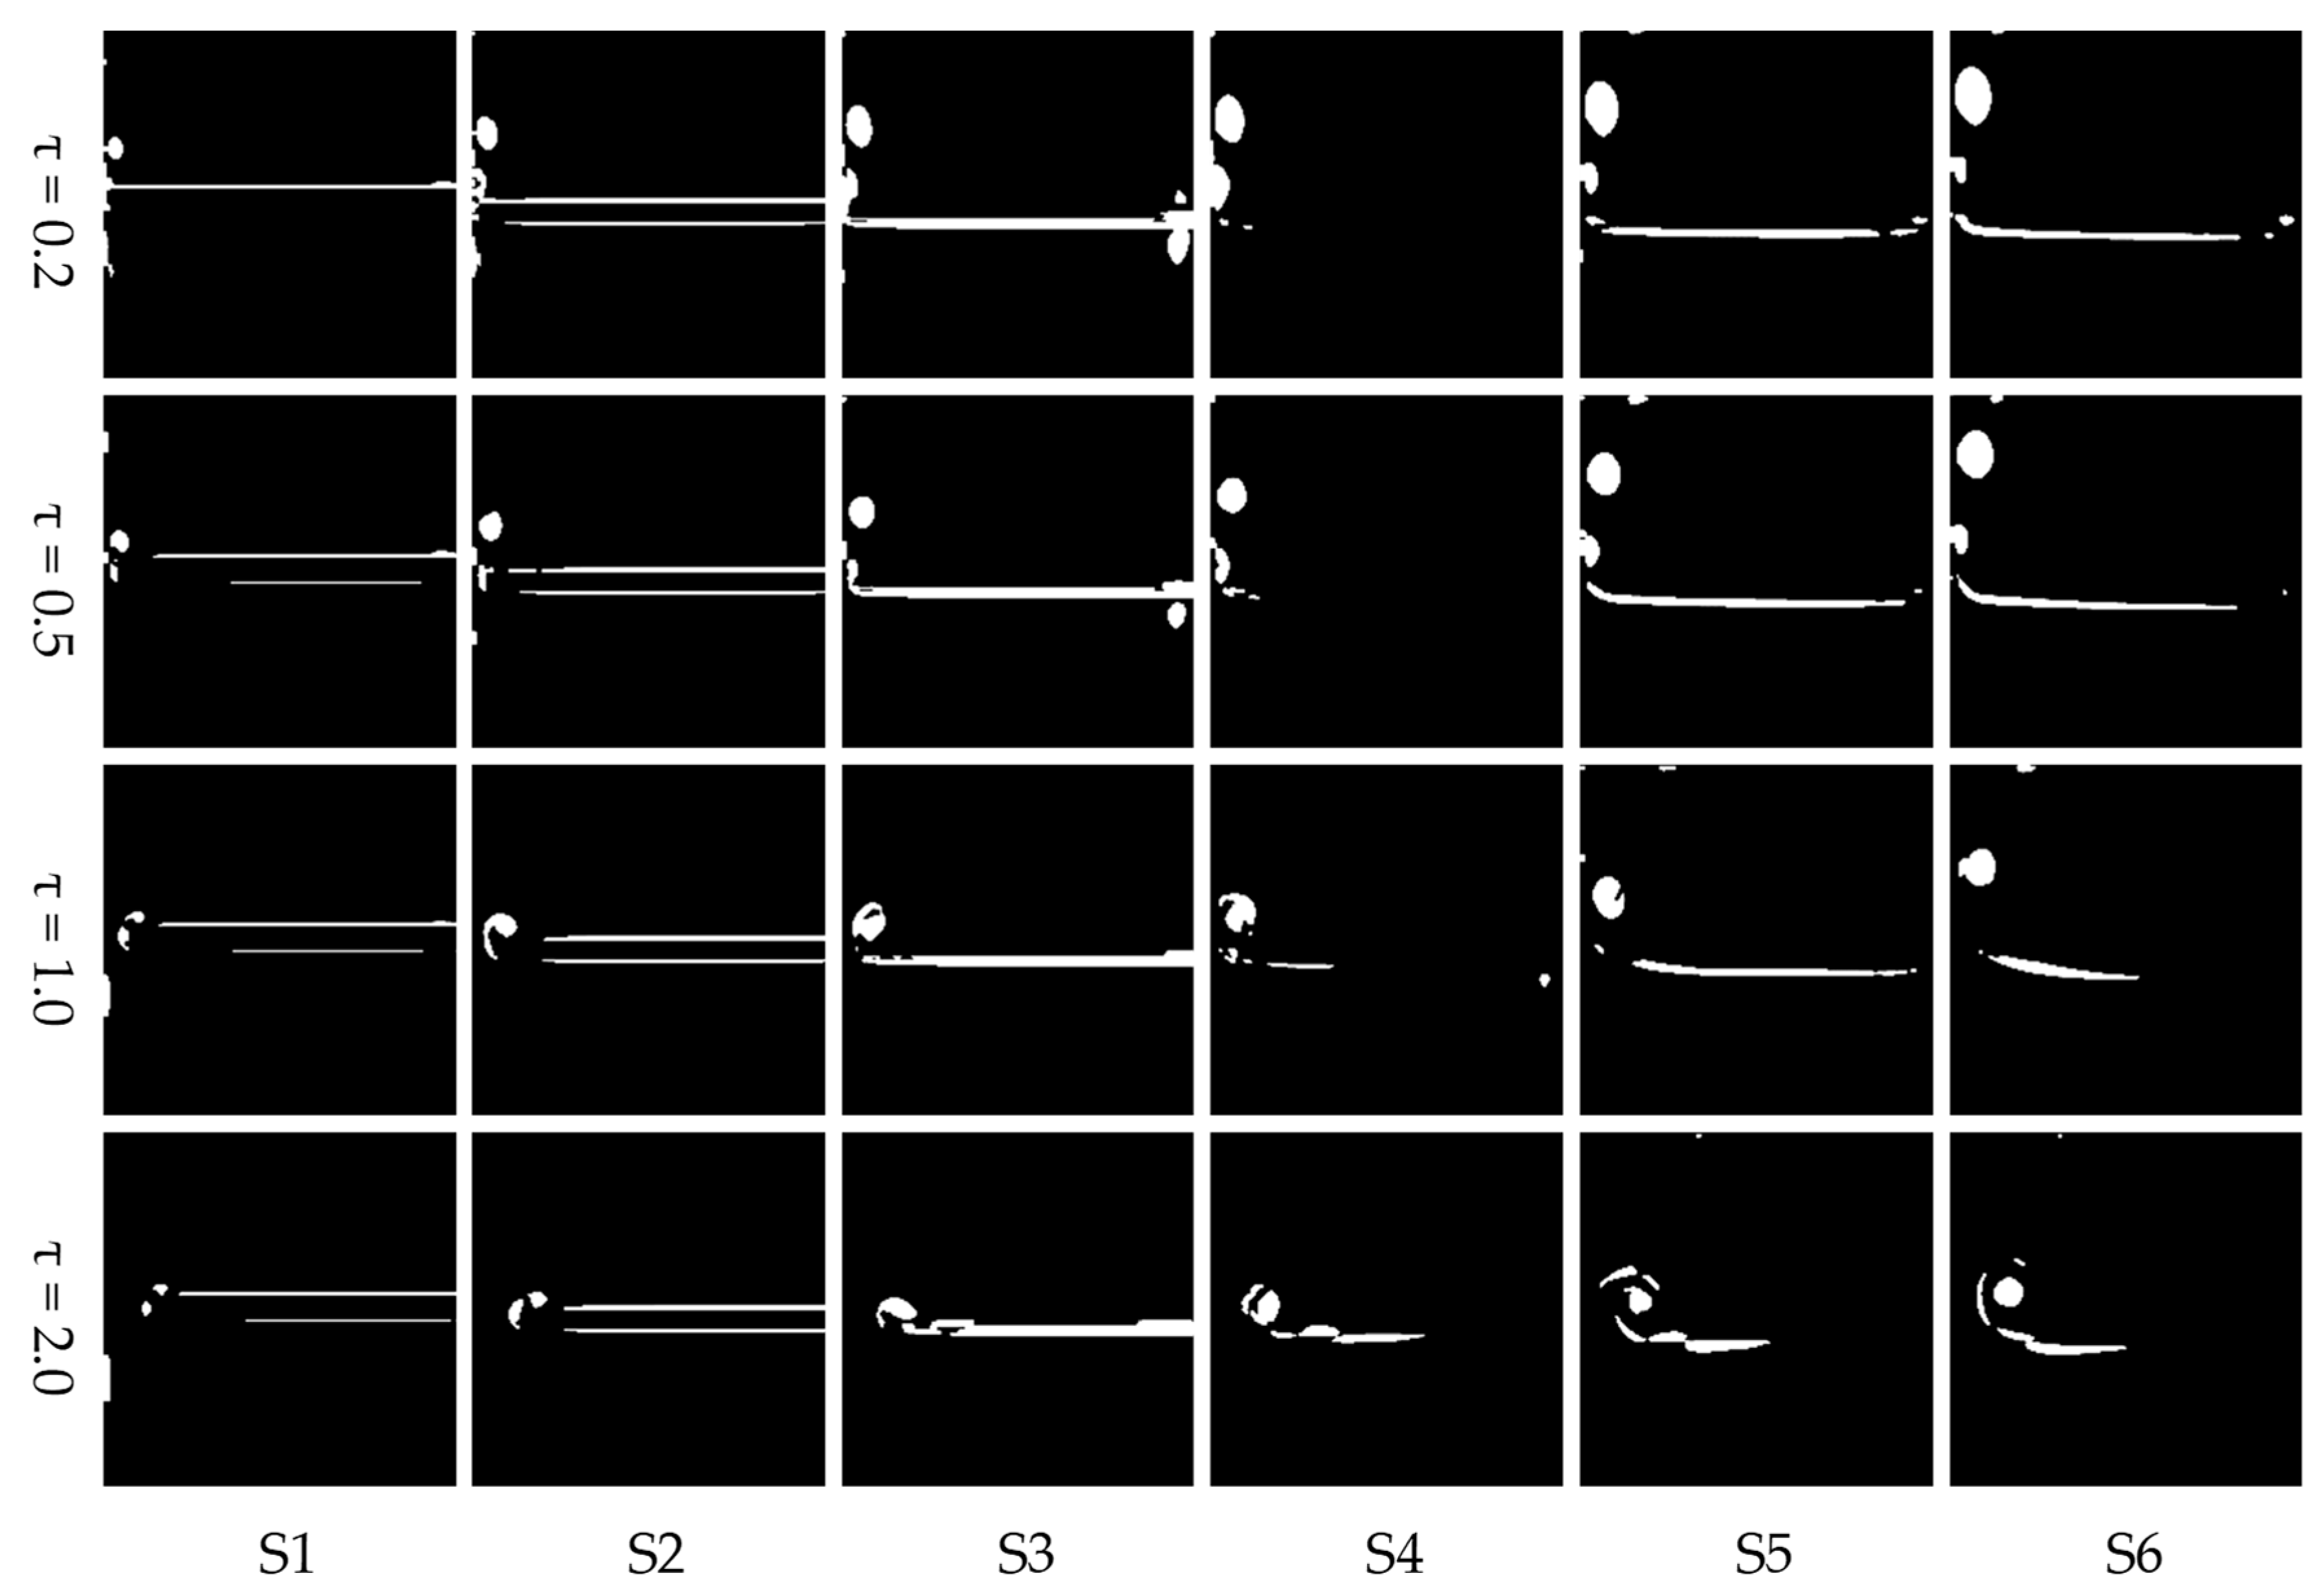
As shown in Figure 12, we define the flow area from the leading edge to the trailing edge of the hydrofoil as the hydrofoil flow region, and the flow area from the trailing edge of the hydrofoil to the outlet of the fluid domain as the downstream flow area of the hydrofoil. In order to observe the change of the vortex structure caused by the change of the tip clearance width, we have intercepted six flow direction planes in the hydrofoil flow region and the downstream flow area of the hydrofoil. The flow direction positions z/c are respectively 0, 0.3, 0.5, 0.7, 1, 1.3, and their names are S1–S6. The S3 section is located at the trailing edge of the hydrofoil, which is the interface between the hydrofoil flow region and the downstream flow area of the hydrofoil.

6.2. Image Processing Process

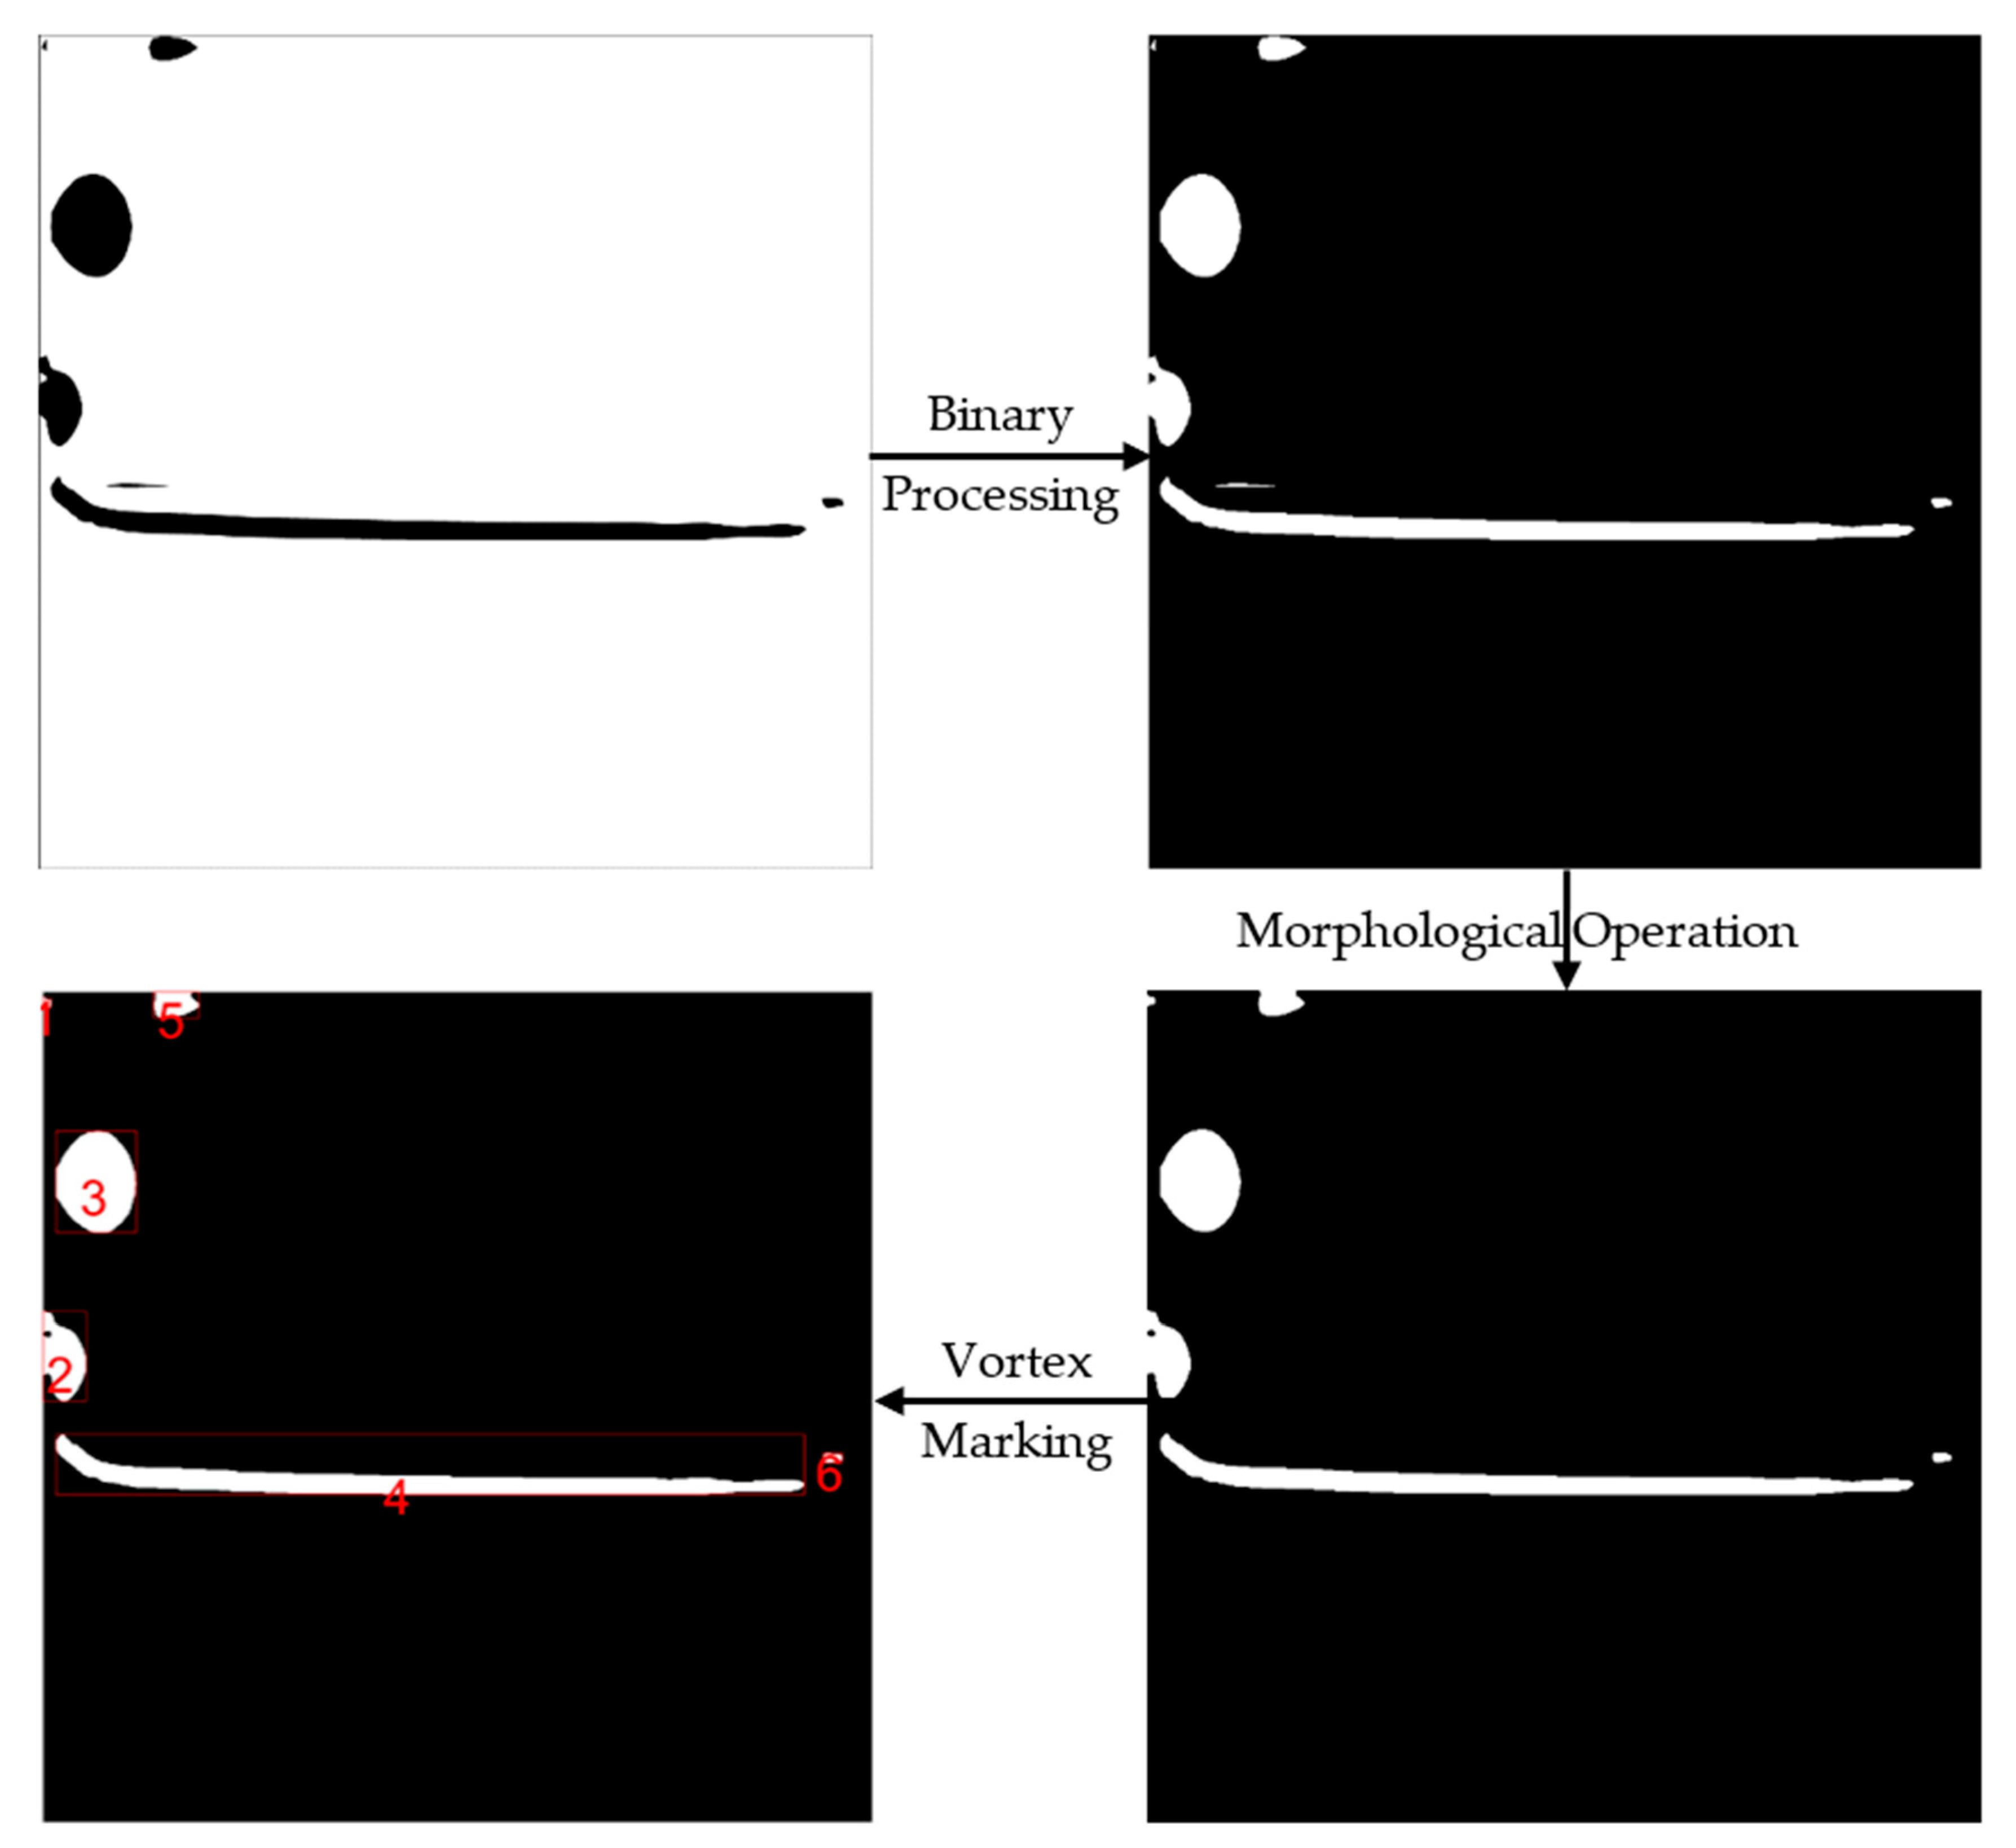
In each section, the coarse graining analysis method with λ2 = −1000 can be used to obtain the vortex shape at each flow direction position. Figure 13 shows the 2D vortex image processing process on a section. Firstly, the vortex image on the section is binarized, and the gray value of each point in the image is changed to 0 or 255. Then, a morphological operation is carried out to remove the small vortex structure in the image and keep the shape and position of the main vortex structure unchanged. Finally, we mark the number of vortex structures in the image with red numbers on each section, and we calculate the perimeter and area of each TLV to be ready for the subsequent calculation of the fractal dimension of each vortex and its analysis.

6.3. Spatial Evolution of the Tip Leakage Vortex

Figure 14 shows the vortex distribution of each section under different gap widths obtained after morphological operation. From the figure, we can see that as the water flows downstream, the tip leakage vortex continues to develop, its influence area gradually increases, and its longitudinal position gradually moves upward. The gap width has an obvious influence on the TLV. With the increase of the gap width, the area and longitudinal position of the tip leakage vortex decrease. This may be because the increase of the tip gap width will reduce the flow rate of the gap leakage flow, resulting in a smaller interaction between the gap leakage flow and the mainstream, and then the area and longitudinal position of the TLV are reduced. It can be seen from the vortex image in the downstream flow area of the hydrofoil that the flow will form a Karman vortex downstream of the hydrofoil due to the obstruction of the hydrofoil to the flow. The clearance width also affects the formation and development of the Karman vortex. With the increase of the gap width, the position where the Karman vortex forms continuously moves forward, but its strength and influence range are continuously reduced.
Table 3 displays the number of vortex structures in each section under different working conditions and the fractal dimension of the tip leakage vortex calculated according to Formula 7. Figure 15 shows the change curve of the vortex number and fractal dimension. The red dotted line in the figure is located in section S3 of the airfoil trailing edge, which is the boundary between the hydrofoil flow area and downstream flow area of the hydrofoil. From the figure, we can see that under different gap widths, the number of vortex cores has no common change trend along the flow direction. However, from the number of vortices in Table 3, we can see that the number of vortices is between 4 and 9 when τ = 0.2; the number of vortexes is between 5 and 8 when τ = 0.5; the number of vortexes is between 3 and 7 when τ = 1.0; the number of vortices is between 2 and 6 when τ = 2.0. It is obvious that with the increase of the gap width, the maximum number of vortices on the cross section decreases. In addition, from the distribution of the number of vortices on the hydrofoil trailing edge section, we can see that the number of vortices on the hydrofoil trailing edge is smaller than that on other sections. The number of vortices in this section is directly relevant to the gap width. With the rise of the gap width, the number of vortices in section S3 also decreases.
Figure 15b displays the change of the fractal dimension along the flow direction under different gap widths. From the figure, we can see that under different gap widths, the fractal dimension of the TLV decreases along the flow direction. In section S1, the fractal dimension of the leakage vortex is large; in section S6, the fractal dimension of the leakage vortex is small. The effect of the clearance width on the fractal dimension of TLV can be split into two groups: the group with a larger gap width (τ = 1.0 and τ = 2.0) and the group with a smaller gap width (τ = 0.2 and τ = 0.5). In the larger gap width group and the smaller gap width group, the effect of the clearance width on the fractal dimension of the leakage vortex is basically the same, which is shown as follows: in the hydrofoil flow region, the smaller the gap width, the larger the fractal dimension of TLV; in the downstream flow region of the hydrofoil, the fractal dimensions of the leakage vortex are basically the same under different gap widths. The fractal dimension of the leakage vortex in the group with a larger gap width is significantly different from that in the group with a smaller gap width. The fractal dimension of the leakage vortex in the group with the larger gap width is significantly greater than that in the group with the smaller gap width. In some degree, fractal dimension can be applied to express the size and shape of the vortex.
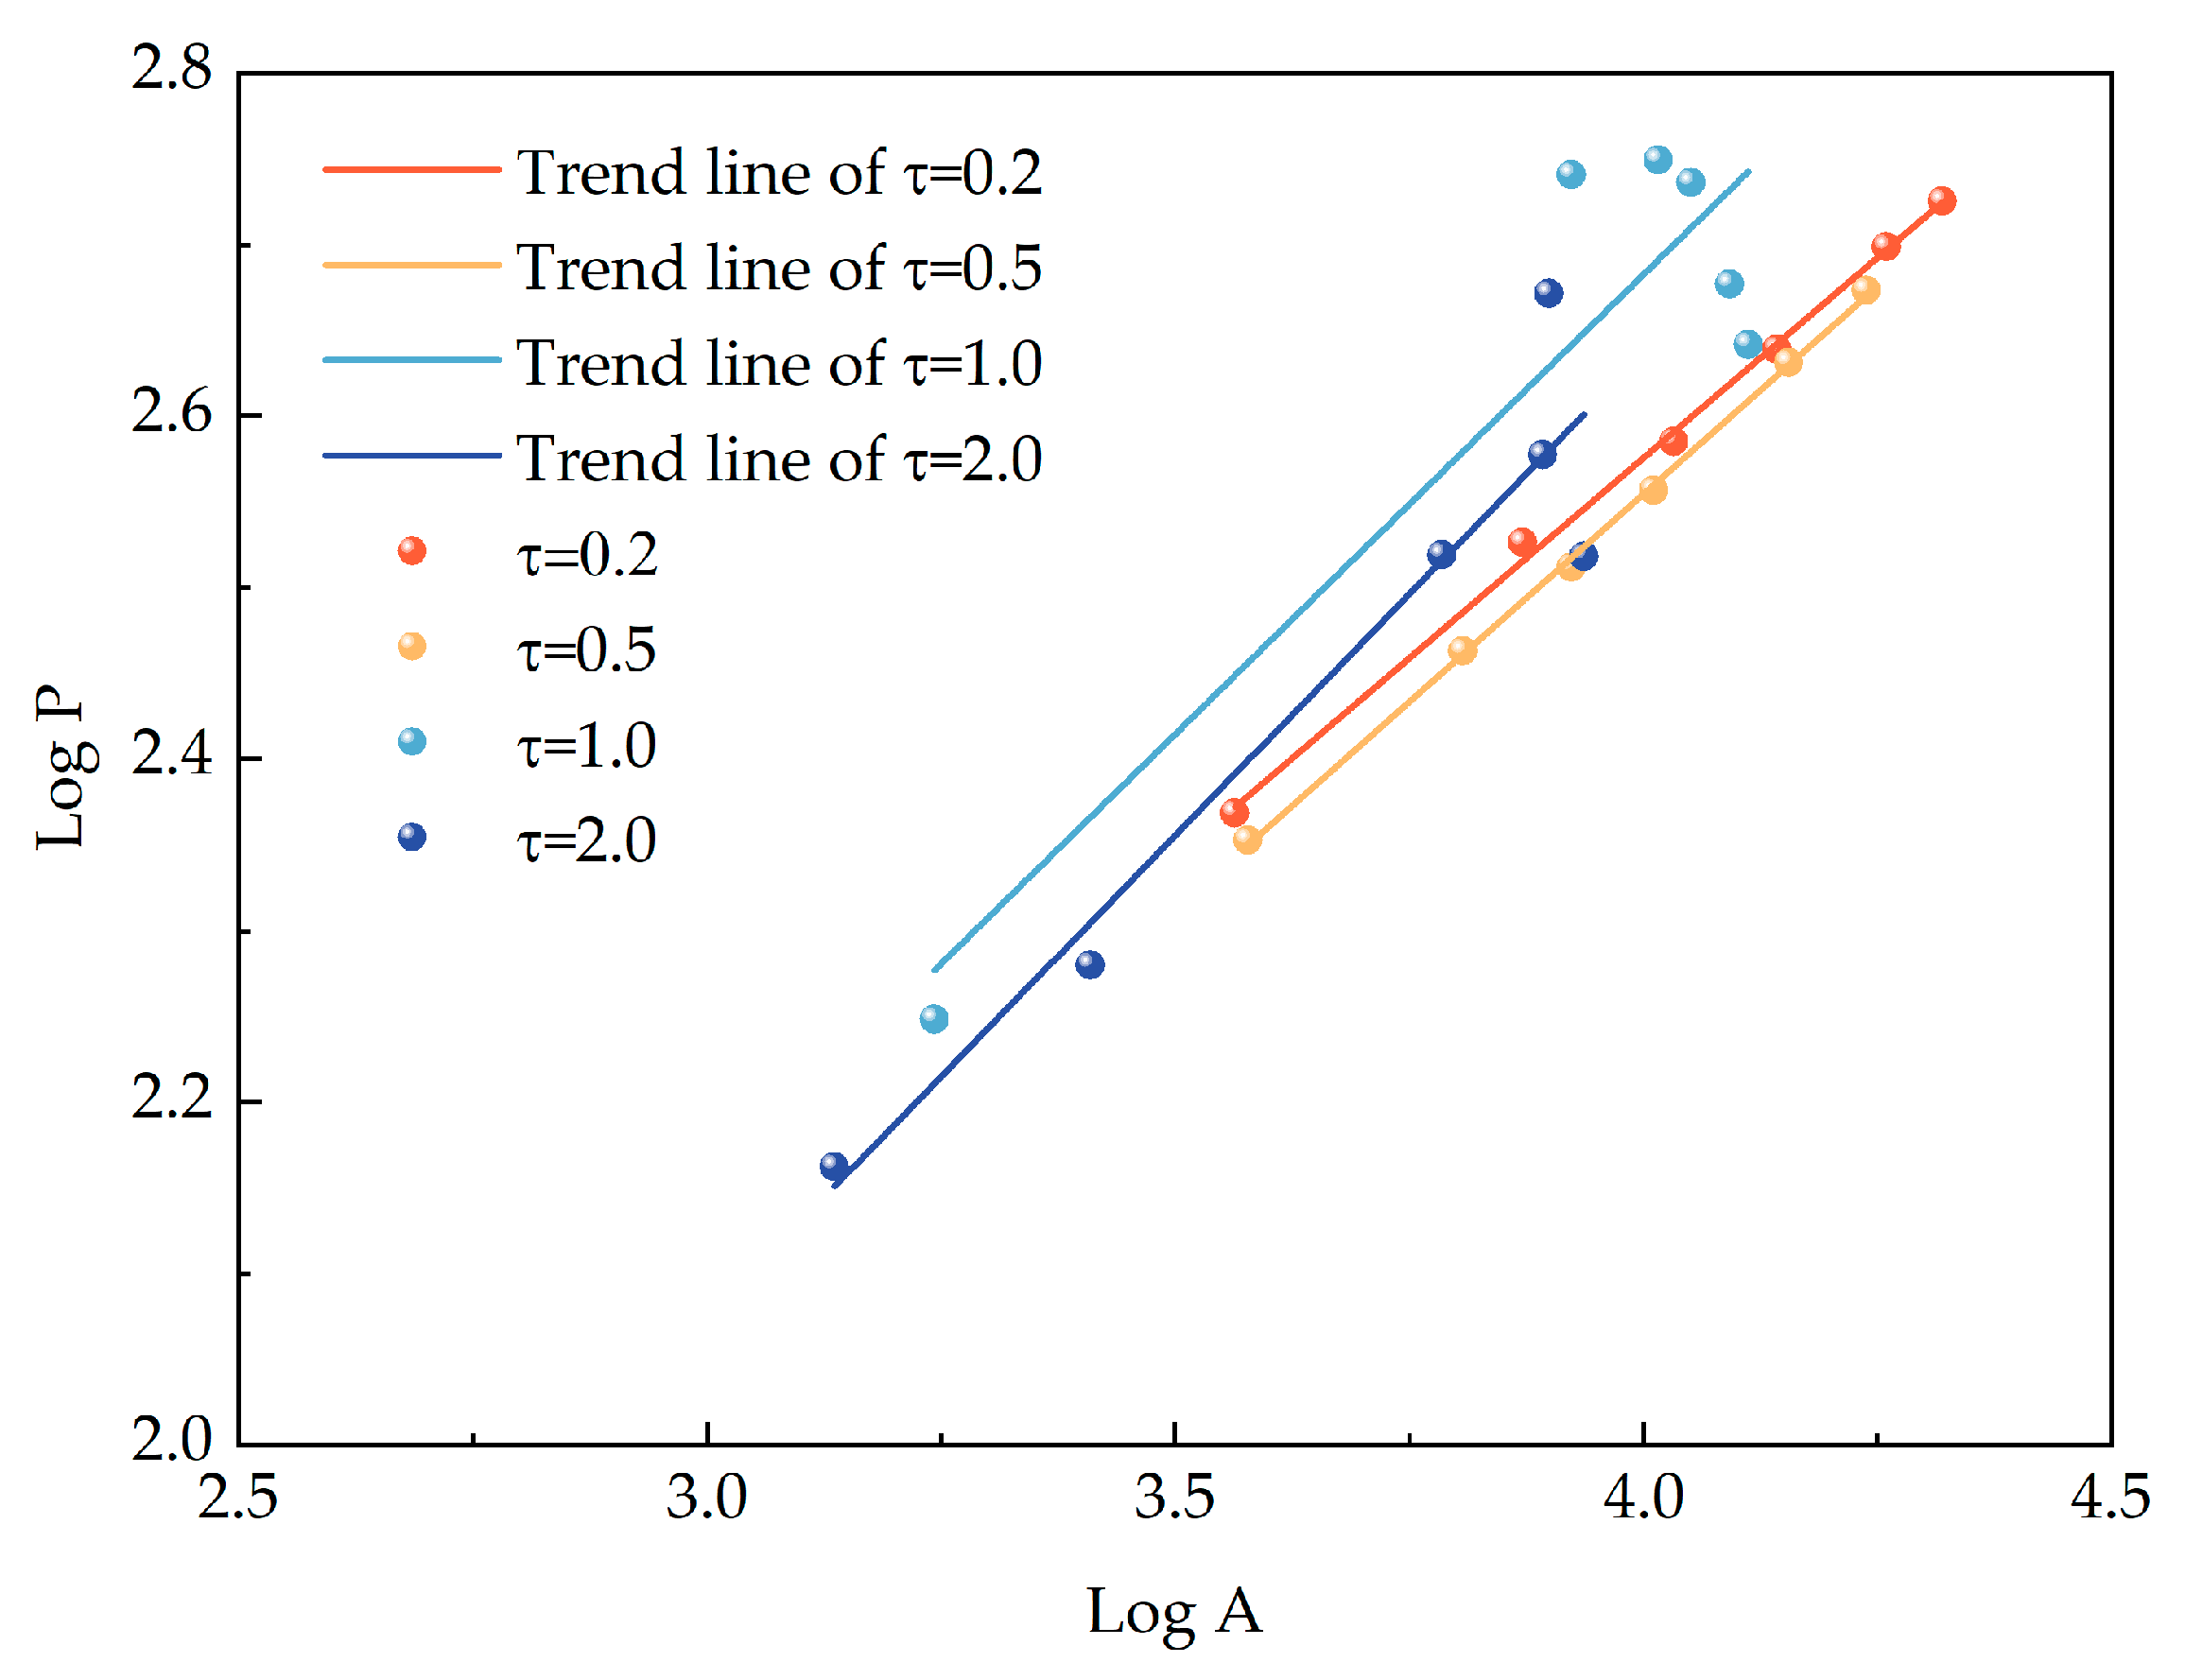
Figure 16 displays the logarithmic relationship between the circumference and area of the tip leakage vortex at each section under different gap widths. We use the following linear formula to fit the logarithmic relationship between the circumference and the area of the tip leakage vortex under different gap widths:
log   P = C 1 log   A + C 0
The fitting results are shown in Table 4. From Table 4, we can see that under the smaller gap width group, the logarithm of the perimeter and area of the tip leakage vortex shows obvious linear relationship, and the goodness of fit R2 is above 0.99. In the group of the larger gap width, the logarithm of the circumference and area of the TLV is no longer linear, and the linear formula is used to fit them, the goodness of fit is lower than 0.9. From Figure 16, we can see that in the smaller gap width group and the larger gap width group, when the circumference of the TLV is fixed, the area of the leakage vortex under the condition of the small gap width is usually large, and the circumference and area of the maximum leakage vortex are also large. By comparing the smaller gap width group with the larger gap width group, it can be found that when the perimeter of the leakage vortex is fixed, the TLV area of the larger gap width group is larger.

7. Conclusions

Based on the computational fluid dynamics method, this article takes the hydrofoil with clearance as the research object, and studies the effects of the gap width, inlet velocity, and incidence angle on the tip leakage vortex through orthogonal experiments, and studies the fractal characteristics of the tip leakage vortex under different clearance widths. The conclusions are as follows:
(1)
Through the range analysis of different parameters on the pressure coefficient, velocity coefficient, longitudinal position, angle, and length of the TLV, it can be found that the gap width has the greatest effect on the TLV. When the gap width increases, the pressure coefficient of the TLV core decreases first and then increases, the minimum pressure coefficient is about –2, the velocity coefficient of the vortex core increases first and then decreases, and the longitudinal position of the TLV core and the angle of the TLV continue to decrease, the length of TLV increases continuously;
(2)
The incidence angle has little influence on the TLV. With the increase of the hydrofoil attack angle, the TLV core pressure coefficient, the TLV core velocity coefficient, and the length of the TLV decrease, and the longitudinal position and the TLV angle of the vortex core increase. The inlet velocity has the least effect on the TLV. With the increase of the inlet velocity, the core pressure coefficient and longitudinal position of TLV gradually increase, while the core velocity coefficient decreases first and then increases, while the length and angle of leakage vortex remain basically unchanged;
(3)
In this article, the λ2 method is used to show the vortex structure generated by hydrofoil clearance flow, and the plane with different flow direction positions is used to intercept the vortex morphology. Through the analysis of vortices on different sections, the variation of the vortex number and fractal dimension along the flow direction is obtained. We can see that the fractal dimension of the leakage vortex decreases gradually from S1 to S3, and its fractal dimension is between 1.2 and 1.4. When the gap width is small, the logarithm of the circumference and area of the tip leakage vortex presents an obvious linear relationship, and the goodness of fit is above 0.99.
To sum up, the study clarified the specific effects of different parameters on tip clearance flow, and revealed the changes in the number, area, perimeter, and fractal dimension of the tip leakage vortex structure along the flow direction under different gap widths with the fractal method, providing a theoretical basis for the optimal design and safe operation of tubular flow units.

Author Contributions

Conceptualization, R.T. and P.L.; writing—original draft preparation, Z.H. and Y.W.; writing—review and editing, R.X. and R.T.; supervision, R.X. and R.T. All authors have read and agreed to the published version of the manuscript.

Funding

This research was funded by the Open Research Fund Program of State Key Laboratory of Hydroscience and Engineering (No. sklhse-2022-E-01).

Institutional Review Board Statement

Not applicable.

Informed Consent Statement

Not applicable.

Data Availability Statement

Data available on request from the corresponding author.

Conflicts of Interest

The authors declare no conflict of interest.

References

  1. Liu, Y.; Tan, L.; Wang, B. A Review of Tip Clearance in Propeller, Pump and Turbine. Energies 2018, 11, 2202. [Google Scholar] [CrossRef] [Green Version]
  2. Wu, H.; Miorini, R.L.; Katz, J. Measurements of the Tip Leakage Vortex Structures and Turbulence in the Meridional Plane of an Axial Water-Jet Pump. Exp. Fluids 2011, 50, 989–1003. [Google Scholar] [CrossRef]
  3. Zhang, D.; Shi, W.; Pan, D.; Dubuisson, M. Numerical and Experimental Investigation of Tip Leakage Vortex Cavitation Patterns and Mechanisms in an Axial Flow Pump. J. Fluids Eng. Trans. ASME 2015, 137, 121103. [Google Scholar] [CrossRef]
  4. Lin, F.; Chen, J. Oscillatory Tip Leakage Flows and Stability Enhancement in Axial Compressors. Int. J. Rotating Mach. 2018, 2018, 9076472. [Google Scholar] [CrossRef]
  5. Wang, J.; Cheng, H.; Xu, S.; Ji, B.; Long, X. Performance of Cavitation Flow and Its Induced Noise of Different Jet Pump Cavitation Reactors. Ultrason. Sonochem. 2019, 55, 322–331. [Google Scholar] [CrossRef] [PubMed]
  6. Zhang, D.; Shi, W.; Chen, B.; Guan, X. Unsteady Flow Analysis and Experimental Investigation of Axial-Flow Pump. J. Hydrodyn. Ser. B 2010, 22, 35–43. [Google Scholar] [CrossRef]
  7. Kim, S.; Choi, C.; Kim, J.; Park, J.; Baek, J. Tip Clearance Effects on Cavitation Evolution and Head Breakdown in Turbopump Inducer. J. Propul. Power 2013, 29, 1357–1366. [Google Scholar] [CrossRef]
  8. Sentyabov, A.; Timoshevskiy, M.; Pervunin, K.S. Gap Cavitation in the End Clearance of a Guide Vane of a Hydroturbine: Numerical and Experimental Investigation. J. Eng. Thermophys. 2019, 28, 67–83. [Google Scholar] [CrossRef]
  9. Tan, D.; Li, Y.; Wilkes, I.; Vagnoni, E.; Miorini, R.L.; Katz, J. Experimental Investigation of the Role of Large Scale Cavitating Vortical Structures in Performance Breakdown of an Axial Waterjet Pump. J. Fluids Eng. Trans. ASME 2015, 137, 111301. [Google Scholar] [CrossRef]
  10. Peng, X.; Zhang, L.; Wang, B.; Xu, L.; Song, M.; Cao, Y.; Liu, Y.; Hong, F.; Yan, K. Study of Tip Vortex Cavitation Inception and Vortex Singing. J. Hydrodyn. 2019, 31, 1170–1177. [Google Scholar] [CrossRef]
  11. Qian-xi, W.; Yuan-xiang, Y.; Tan, D.S.; Jian, S.; Tan, S.K. Non-Spherical Multi-Oscillations of a Bubble in a Compressible Liquid. J. Hydrodyn. 2014, 26, 848–855. [Google Scholar] [CrossRef]
  12. Zhao, M.; Zhao, W.; Wan, D. Numerical Simulations of Propeller Cavitation Flows Based on OpenFOAM. J. Hydrodyn. 2020, 32, 1071–1079. [Google Scholar] [CrossRef]
  13. Wang, X.; Zhang, J.; Huang, Z.; Wang, L.; Li, W.; Lan, G. Large Eddy Simulation on the Cavitation Flow and Noise Characteristics of a NACA0009 Hydrofoil with Different Tip Clearance Sizes. J. Fluids Eng. 2023, 145, 011204. [Google Scholar] [CrossRef]
  14. Bi, Z.; Shao, X.; Zhang, L. Numerical Study of Tip Leakage Vortex around a NACA0009 Hydrofoil. J. Fluids Eng. 2021, 143, 5. [Google Scholar] [CrossRef]
  15. Xiao, X.; McCarter, A.A.; Lakshminarayana, B. Tip Clearance Effects in a Turbine Rotor: Part I—Pressure Field and Loss. J. Turbomach. 2001, 123, 296–304. [Google Scholar] [CrossRef]
  16. Wenger, C.W.; Devenport, W.J.; Wittmer, K.S.; Muthanna, C. Wake of a Compressor Cascade with Tip Gap, Part 3: Two-Point Statistics. AIAA J. 2004, 42, 2341–2346. [Google Scholar] [CrossRef]
  17. Muthanna, C.; Devenport, W.J. Wake of a Compressor Cascade with Tip Gap, Part 1: Mean Flow and Turbulence Structure. AIAA J. 2004, 42, 2320–2331. [Google Scholar] [CrossRef]
  18. Geng, L.; Zhang, D.; Chen, J.; Escaler, X. Large-Eddy Simulation of Cavitating Tip Leakage Vortex Structures and Dynamics around a NACA0009 Hydrofoil. J. Mar. Sci. Eng. 2021, 9, 1198. [Google Scholar] [CrossRef]
  19. Decaix, J.; Balarac, G.; Dreyer, M.; Farhat, M.; Muench, C. RANS and LES Computations of the Tip-Leakage Vortex for Different Gap Widths. J. Turbul. 2015, 16, 309–341. [Google Scholar] [CrossRef]
  20. Higashi, S.; Yoshida, Y.; Tsujimoto, Y. Tip Leakage Vortex Cavitation from the Tip Clearance of a Single Hydrofoil. JSME Int. J. Ser. B-Fluids Therm. Eng. 2002, 45, 662–671. [Google Scholar] [CrossRef]
  21. Dreyer, M.; Decaix, J.; Muench-Alligne, C.; Farhat, M. Mind the Gap: A New Insight into the Tip Leakage Vortex Using Stereo-PIV. Exp. Fluids 2014, 55, 1849. [Google Scholar] [CrossRef]
  22. Lovejoy, S. Area-Perimeter Relation for Rain and Cloud Areas. Science 1982, 216, 185–187. [Google Scholar] [CrossRef] [PubMed]
  23. Batista-Tomas, A.R.; Diaz, O.; Batista-Leyva, A.J.; Altshuler, E. Classification and Dynamics of Tropical Clouds by Their Fractal Dimension. Q. J. R. Meteorol. Soc. 2016, 142, 983–988. [Google Scholar] [CrossRef]
  24. Sanchez, N.; Alfaro, E.J.; Perez, E. The Fractal Dimension of Projected Clouds. Astrophys. J. 2005, 625, 849–856. [Google Scholar] [CrossRef] [Green Version]
  25. ZheXian, L.; Ying, W.; GeLan, M.; Hui, Y.; XinWei, W.; LiFang, S.; DongHong, L. Possible Causes of the Variation in Fractal Dimension of the Perimeter during the Tropical Cyclone Dan Motion. Sci. China-Earth Sci. 2014, 57, 1383–1392. [Google Scholar] [CrossRef]
  26. von Savigny, C.; Brinkhoff, L.A.; Bailey, S.M.; Randall, C.E.; Russell, J.M. First Determination of the Fractal Perimeter Dimension of Noctilucent Clouds. Geophys. Res. Lett. 2011, 38, L02806. [Google Scholar] [CrossRef]
  27. Brinkhoff, L.A.; von Savigny, C.; Randall, C.E.; Burrows, J.P. The Fractal Perimeter Dimension of Noctilucent Clouds: Sensitivity Analysis of the Area–Perimeter Method and Results on the Seasonal and Hemispheric Dependence of the Fractal Dimension. J. Atmos. Sol. Terr. Phys. 2015, 127, 66–72. [Google Scholar] [CrossRef]
  28. Li, P.; Tao, R.; Yang, S.; Zhu, D.; Xiao, R. Temporal and Spatial Analysis on the Fractal Characteristics of the Helical Vortex Rope. Fractal Fract. 2022, 6, 477. [Google Scholar] [CrossRef]
  29. Jeong, J.; Hussain, F. On the Identification of a Vortex. J. Fluid Mech. 1995, 285, 69–94. [Google Scholar] [CrossRef]
  30. Patanka, S.V. Numerical Heat Transfer and Fluid Flow; Hemisphere Publ. Co.: Washington, DC, USA, 1980. [Google Scholar]
  31. Piomelli, U. Large-Eddy Simulation-Present State and Future Perspectives. In Proceedings of the 36th AIAA Aerospace Sciences Meeting and Exhibit, Reno, NV, USA, 12–15 January 1998; p. 534. [Google Scholar]
  32. Strelets, M. Detached Eddy Simulation of Massively Separated Flows. In Proceedings of the 39th Aerospace sciences meeting and exhibit, Reno, NV, USA, 8–11 January 2001; p. 879. [Google Scholar]
  33. Su, X.; Ren, X.; Li, X.; Gu, C. Unsteadiness of Tip Leakage Flow in the Detached-Eddy Simulation on a Transonic Rotor with Vortex Breakdown Phenomenon. Energies 2019, 12, 954. [Google Scholar] [CrossRef]
  34. Taguchi, G. Linear Graphs for Orthogonal Arrays and Their Applications to Experimental Designs, with the Aid of Various Techniques. Rep. Stat. Appl. Res. Jpn. Union Sci. Eng. 1959, 6, 1–43. [Google Scholar]
  35. Mandelbrot, B.B.; Mandelbrot, B.B. The Fractal Geometry of Nature; WH Freeman: New York, NY, USA, 1982; Volume 1. [Google Scholar]
  36. Guo, B.; Wang, D.; Zhou, X.; Shi, W.; Jing, F. Performance Evaluation of a Tidal Current Turbine with Bidirectional Symmetrical Foils. Water 2019, 12, 22. [Google Scholar] [CrossRef] [Green Version]
  37. Celik, I.B.; Ghia, U.; Roache, P.J.; Freitas, C.J. Procedure for Estimation and Reporting of Uncertainty Due to Discretization in CFD Applications. J. Fluids Eng. -Trans. ASME 2008, 130, 7. [Google Scholar]
  38. Kundu, P.; Sarkar, A.; Nagarajan, V. Improvement of Performance of S1210 Hydrofoil with Vortex Generators and Modified Trailing Edge. Renew. Energy 2019, 142, 643–657. [Google Scholar] [CrossRef]
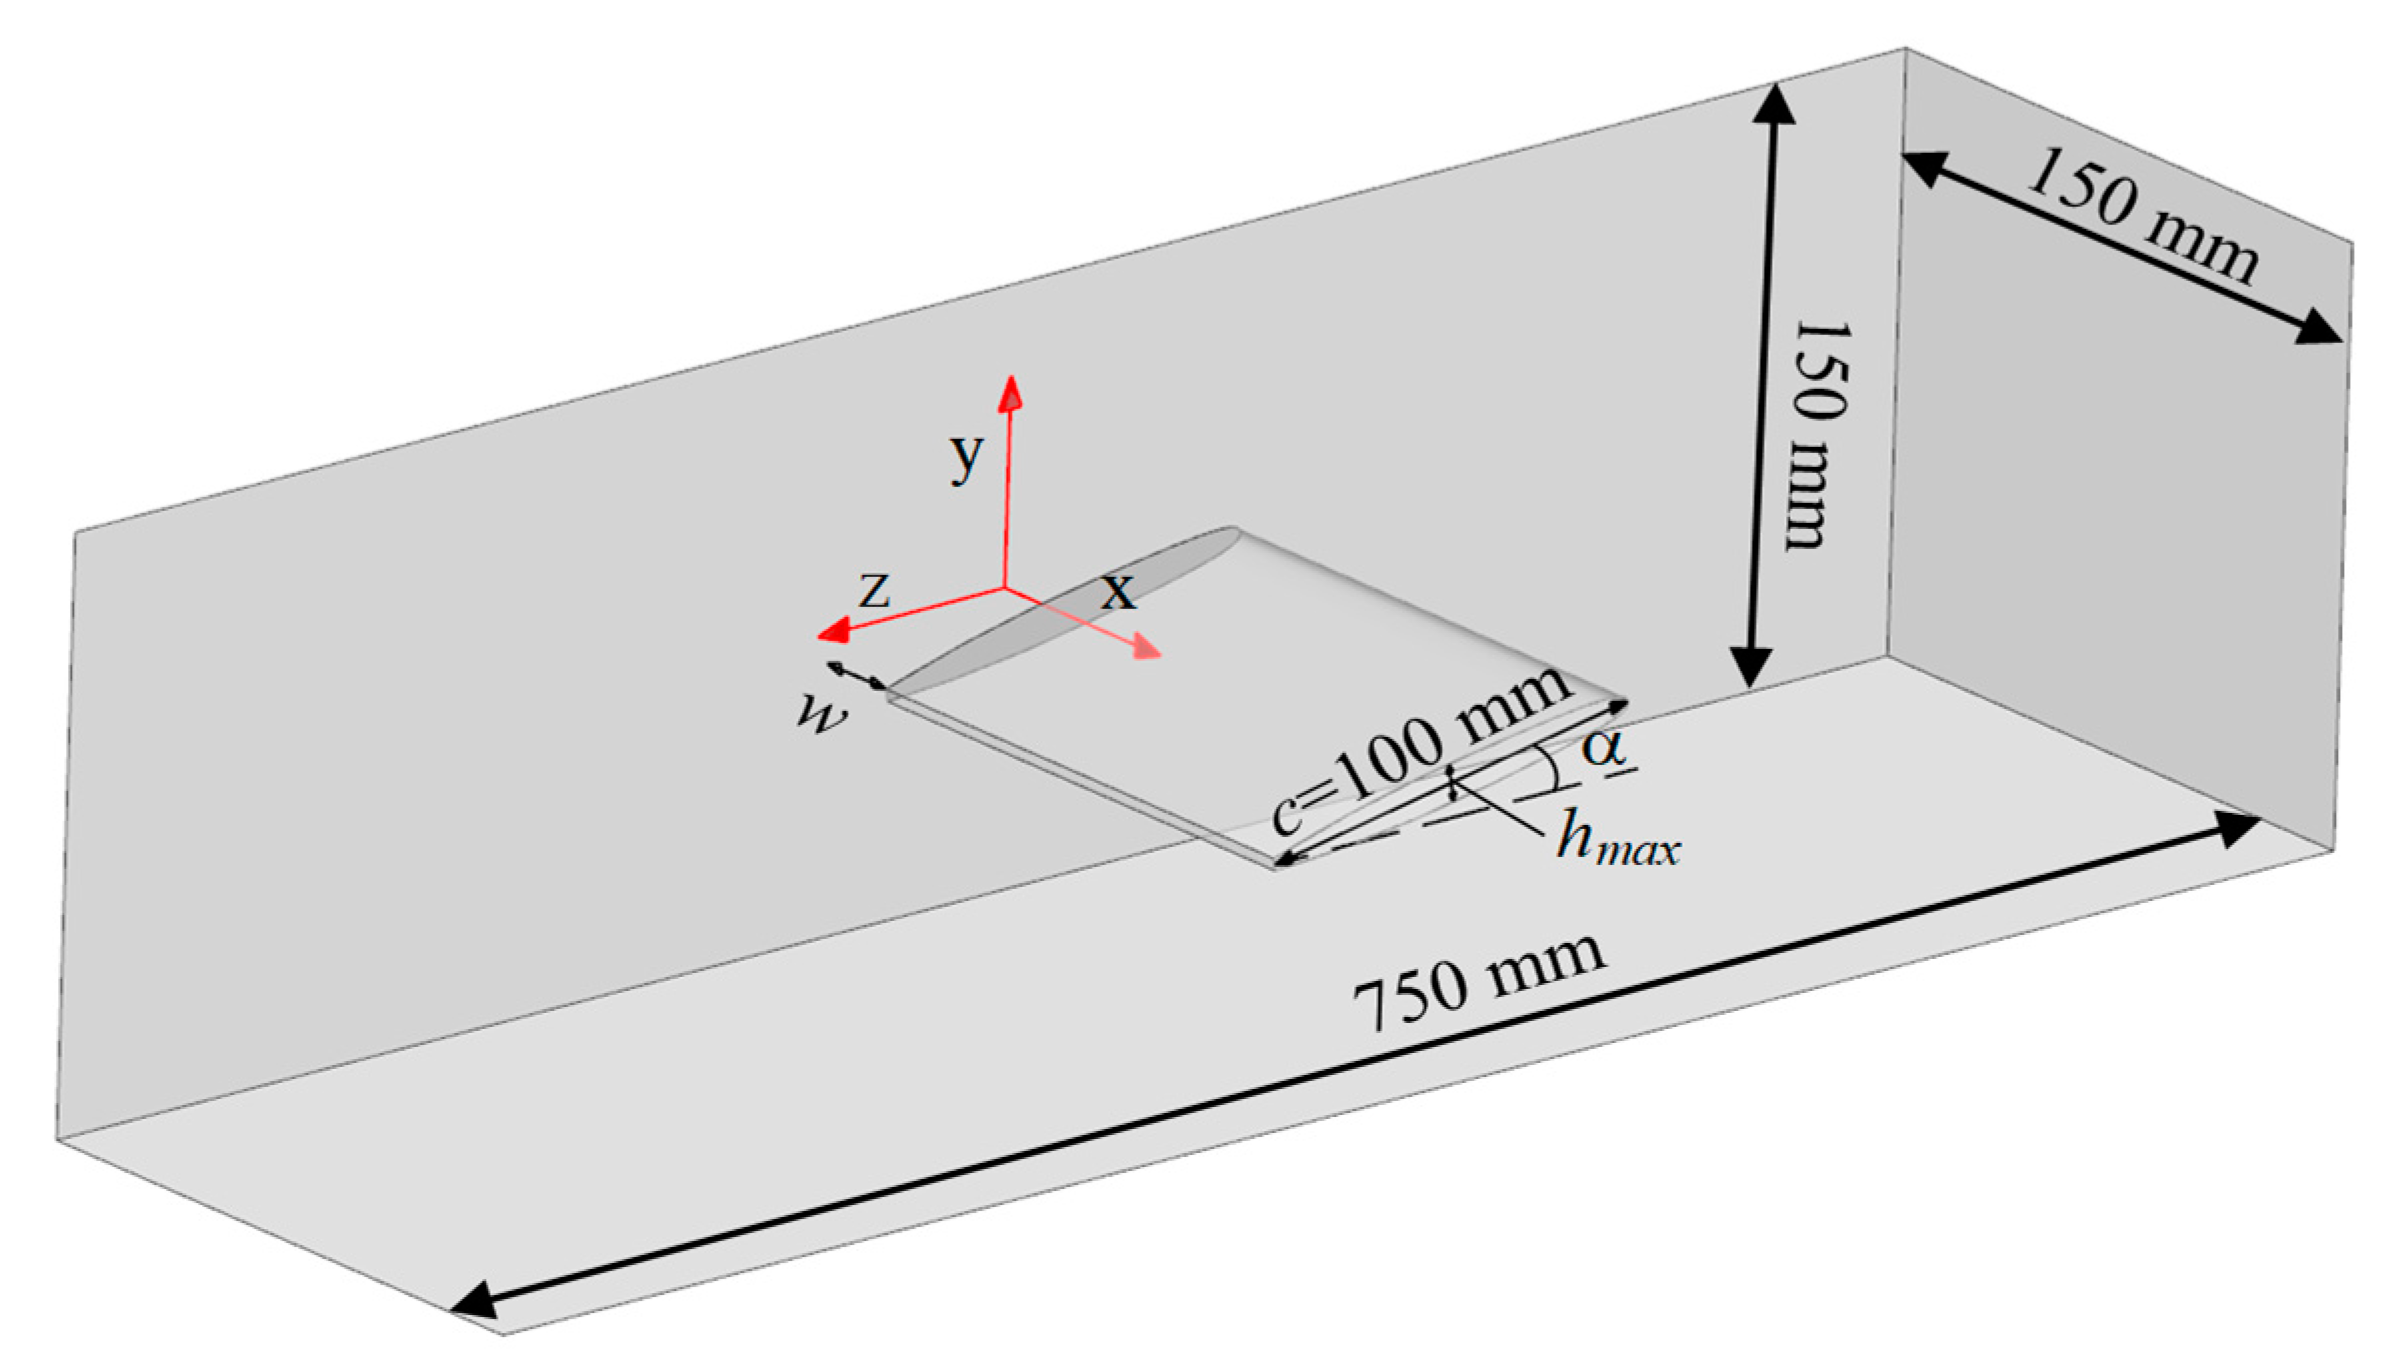
Figure 1. Schematic diagram of the research subject.
Fractalfract 07 00123 g001
Figure 2. Schematic diagram of the grid division.
Fractalfract 07 00123 g002
Figure 3. Axial velocity contour of section z/c = 1 based on numerical simulation. The experimental result for validation can be found in Ref. [21].
Fractalfract 07 00123 g003
Figure 4. Circumferential velocity contour of section z/c = 1 based on numerical simulation. The experimental result for validation can be found in Ref. [21].
Fractalfract 07 00123 g004
Figure 5. Average value and range of the pressure coefficient at different flow directions under different influencing factors and levels, (a) z/c = 0.2; (b) z/c = 0.5; (c) z/c = 0.8; (d) range analysis.
Fractalfract 07 00123 g005
Figure 6. Average value and range of the vortex core velocity coefficient at different flow direction positions under different influence factors and levels, (a) z/c = 0.2; (b) z/c = 0.5; (c) z/c = 0.8; (d) range analysis.
Fractalfract 07 00123 g006
Figure 7. Average and range of the longitudinal position of the vortex core at different flow direction positions under different influence factors and levels, (a) z/c = 0.2; (b) z/c = 0.5; (c) z/c = 0.8; (d) range analysis.
Fractalfract 07 00123 g007
Figure 8. Schematic diagram for the definition of the length and angle of TLV.
Fractalfract 07 00123 g008
Figure 9. Average and range of length under different influencing factors and levels.
Fractalfract 07 00123 g009
Figure 10. Average value and range of the leakage vortex angle under different influencing factors and levels.
Fractalfract 07 00123 g010
Figure 11. Contour of λ2 on the downstream section of hydrofoil, (a) fine grained image; (b) coarse grained image.
Fractalfract 07 00123 g011
Figure 12. Location distribution of the different sections.
Fractalfract 07 00123 g012
Figure 13. Schematic diagram of the vortex image processing process.
Fractalfract 07 00123 g013
Figure 14. Vortex distribution of each section under different gap widths after the morphological operation.
Fractalfract 07 00123 g014
Figure 15. Number of vortex structures and fractal dimension of the leakage vortex in each section under different working conditions, (a) number of vortices; (b) fractal dimension.
Fractalfract 07 00123 g015
Figure 16. Relation between the perimeter and area of the tip leakage vortex.
Fractalfract 07 00123 g016
Table 1. Orthogonal experiment design table.
Test NumberFactorTest NumberFactor
τ [-]Vin [m/s]α [°]τ [-]Vin [m/s]α [°]
10.25591510
20.21071011012
30.21510111155
40.22012121207
50.557132512
60.51051421010
70.51512152157
80.52010162205
Table 2. Grid convergence index calculation table.
Grid SchemeNumber of GridsLift CoefficientGCI (%)Drag CoefficientGCI (%)
11,426,7370.11150.180.00811.25
23,028,6110.11160.008
0.130.84
36,095,8620.11170.008
Table 3. Number of vortex structures and fractal dimension of the leakage vortex in each section under different working conditions.
CaseSectionS1S2S3S4S5S6
τ = 0.2Number of vortices496597
Dt1.3291.3051.2821.2741.2671.262
τ = 0.5Number of vortices775568
Dt1.3151.2941.2811.2751.2661.262
τ = 1.0Number of vortices633774
Dt1.3871.3971.3691.3511.3081.285
τ = 2.0Number of vortices642465
Dt1.3791.3371.371.3241.3311.28
Table 4. Linear fitting of the logarithmic relationship between the leakage vortex perimeter and area.
τC0C1R2
0.20.7070.4670.997
0.50.6160.4850.999
10.5390.5360.812
20.3870.5620.893
Disclaimer/Publisher’s Note: The statements, opinions and data contained in all publications are solely those of the individual author(s) and contributor(s) and not of MDPI and/or the editor(s). MDPI and/or the editor(s) disclaim responsibility for any injury to people or property resulting from any ideas, methods, instructions or products referred to in the content.