Article

Fractal Analysis of Coal Pore Structure Based on Computed Tomography and Fluid Intrusions

1
School of Mine Safety, North China Institute of Science and Technology, Sanhe 065201, China
2
School of Emergency Management and Safety Engineering, China University of Mining and Technology—Beijing, Beijing 100083, China
*
Author to whom correspondence should be addressed.
Fractal Fract. 2023, 7(6), 439; https://doi.org/10.3390/fractalfract7060439
Submission received: 10 May 2023 / Revised: 26 May 2023 / Accepted: 29 May 2023 / Published: 31 May 2023

Abstract

:
As a non-homogeneous porous medium, the structural complexity of coal directly affects pore structure parameters and gas percolation characteristics, which in turn determine the fractal dimension of coal samples. Among them, the specific surface area of coal largely determines the complexity of the pore structure and is closely related to coal and gas protrusion hazards. To investigate the relationship between the fractal dimension of coal and its specific surface area, we analyzed the pore structure of coal samples using low-temperature nitrogen adsorption, the mercury pressure method, and X-ray micro-computed tomography (CT) experiments. By calculating the fractal dimension of coal and reconstructing it in three dimensions, the morphological characteristics and distribution of pores can be described qualitatively and quantitatively. The fractal dimension of coal samples was found to increase exponentially with the specific surface area based on measurements of large pores and mesopores via the mercury pressure method and those of small pores and micropores using the nitrogen adsorption method. X-ray micro-CT experiments revealed that the fractal dimension of large pores (i.e., >2 μm) conformed to this pattern.

1. Introduction

The study of the complex and rich structures inside coal bodies is an important basis for the investigation of their physical properties [1]. The pores of coal are closely related to the adsorption, desorption, and diffusion of coal seam gases and determine the volume of gas storage and efficiency of gas transport [2,3,4,5,6]. Gas diffusion in the pores of coal seams primarily occurs on microporous surfaces. Coal bodies with sufficient specific surface area have a stronger gas adsorption capacity, which makes diffusion more effective. Therefore, studying the pore structure parameters of coal can aid in coal and gas accident prevention and control, and is conducive to improving the efficiency of coal-bed methane extraction [7,8,9].
Coal pore space has been extensively studied. The methods currently used to characterize the pore structure include scanning electron microscopy (SEM) [10,11,12], ray detection [13,14], fluid intrusion (commonly including high-pressure mercury compression [15], low-temperature nitrogen (N2) adsorption, and carbon dioxide (CO2) adsorption [16]), and nuclear magnetic resonance (NMR) [17]. These methods have advantages and disadvantages, and it is difficult to analyze pores qualitatively and quantitatively across the entire range of pore sizes using a single method. Therefore, multiple methods are generally combined. This results in richer and more accurate data and covers the full size of the pore structure. Zhao et al. [18] compared the use of NMR and low-temperature liquid N2 adsorption and desorption experiments (LP–N2A) to determine the distribution of pores of different sizes in six medium- to high-grade coal sample species. They found that the different water contents in the coal samples were an important factor in the differences between the results of the two experiments. The pore size distribution measured using NMR was higher than that of LP-N2A. Wang et al. [19] explored the nature of micropores and mesopores during the adsorption/desorption of bituminous coal cycle gases from a microscopic perspective using N2 and CO2 adsorption experiments. Lin et al. [20] used SEM, low-temperature N2 adsorption, mercury pressure experiments, and other methods to investigate the pore heterogeneity of tectonic and primary tectonic coals.
Scholars have also used fractal methods to study and analyze the pore structure of coal. To characterize pore boundaries by fractal means, an external analysis of small-angle X-rays of porous scatterers was proposed by Bale et al. [21] and applied to scattering data of lignite. Han et al. [22] selected coal samples with different degrees of metamorphosis and analyzed the pore structure of the samples using the mercury pressure and N2 adsorption methods. A new pore classification scheme was proposed by combining the Frenkel–Halsey-Hill (FHH) and Menger fractal dimension models, and the pores were found to have segmental fractal characteristics. Niu et al. [23] used liquid N2 adsorption experiments and methane isothermal adsorption experiments to analyze the pore structure and adsorption properties of 12 coal samples with different degrees of metamorphism. Fractal dimensions D1, D2, and D3 were obtained using LP–N2A, small-angle X-ray scattering, and SEM, respectively. As N2 adsorption is mainly applied to large pores and small-angle X-ray scattering mainly detects micropores, D2 is generally larger than D1. Jiang et al. [24] analyzed the effect of coal composition and pore parameters on its fractal dimension using NMR. The fractal dimension depends on the variability of physical parameters of coal samples and is closely related to methane adsorption. Li et al. [25] analyzed the relationship between coal pore parameters and fractal dimension using piezometric analysis, LP–N2A, and NMR to characterize the anisotropy of pores. Naveen et al. [26] determined the fractal dimension using LP–N2A and surface fractal and matrix fractal imaging techniques. A three-dimensional (3D) model of pore structure and connectivity was reconstructed using two-dimensional (2D) field emission SEM data and 3D laminar interface data using the Avizo 2019 software to quantify pore areas.
The surface characteristics and pore structure of coal are irregular and complex. The pore specific surface area is the main parameter characterizing the pore structure of coal and is closely related to its gas adsorption capacity. Many scholars have used fractal theory to investigate the influencing factors and effect of coal specific surface area. Zhu et al. [27] characterized the pore structure of 13 coal samples using fractal means and found that there was no significant relationship between D1 and pore structure parameters or the maximum solids content of coal, whereas D2 increased with increasing specific surface area of coal samples. Zhang et al. [28] studied the fractal characteristics of 58 coal blocks from 14 mines in Ordos based on the FHH model and found that the surface fractal size of coal samples (DS) had a positive correlation with surface area, and DS was inversely proportional to median pore size. DS decreased with increasing hydrocarbon content and decreasing ash content. Yan et al. [29] investigated the relationship between the fractal dimension of different roughness coal samples and their water content using electron microscope image processing and analyzed the mechanism of the effect of roughness on the wettability properties. The fractal dimension of coal samples was shown to gradually increase with increasing surface roughness. Ni et al. [30], based on low temperature N2 adsorption, SEM, and fractal theory, concluded that D1 of acidified coal samples is positively correlated with their specific surface area and total pore volume, and D2 is inversely proportional to them. Wen et al. [31] analyzed the fractal characteristics of adsorption pores using a dendritic fractal model and obtained the law of the effect of bending fractal dimension on gas adsorption capacity. Percolation pores of >65 nm in each experimental coal sample conformed to the random fractal model, and their fractal dimension was positively correlated with their specific surface area. Adsorption pores of <65 nm conformed to the dendritic fractal model, and their bending fractal dimensions were positively correlated with their specific surface area. Zhou et al. [32] used the fractal dimension to quantitatively describe the surface characteristics of wetted coal dust. Dust deposition time and gas adsorption experiments showed that the specific surface area and gas adsorption capacity of coal dust were positively proportional to the fractal dimension.
In summary, most scholars have used one or more experimental methods to analyze the pore structure of coal and have used fractal theory to quantify surface roughness and matrix complexity. However, the relationship between fractal dimension and specific surface area over the entire range of pore sizes has not been investigated. In this study, eight coal samples from the Xiangshan mine in Shaanxi province were fractalized over the entire pore size range by a combination of mercury pressure and low-temperature liquid nitrogen adsorption methods. Based on the pore structure parameters measured by fluid intrusions, the pore structure was visualized and reconstructed in three dimensions using X-ray micro-computed tomography (CT). By investigating the relationship between the fractal dimension of coal samples and their specific surface area in different pore size ranges, a theoretical basis was provided for gas extraction in field projects to reduce the risk of coal and gas disasters.

2. Coal Samples and Methods

Eight coal samples were collected from the 3# and 5# coal seams of the Xiangshan mine and labeled as 3#-1, 3#-2, 3#-3, 3#-4, 5#-1, 5#-2, 5#-3, and 5#-4. Common coal pore size classification methods are shown in Table 1. The decimal pore size classification method proposed by B.B. Hodot [33] is more detailed. The pores of the coal samples were classified into four sizes: micropores (<10 nm), small pores (10–100 nm), mesopores (100–1000 nm), and large pores (>1000 nm). Based on this classification method, the coal pore structure was analyzed in the entire pore size range using mercury pressure and low-temperature liquid N2 adsorption methods. The relationship between the fractal dimension of the coal structure and the specific surface area was investigated using the above experimental methods in combination with X-ray micro-CT scanning.
The measurement principles of the three methods are as follows. In the low-temperature liquid N2 adsorption method, N2 molecules fill coal pores ranging from 1.0–289.3 nm via micropore filling, physical adsorption, and capillary agglomeration at 77 K. The mercury pressure method can obtain the distribution characteristics and pore structure parameters of pore sizes from 3 nm to 100 μm; however, with increasing inlet pressure, extrusion damage of the coal matrix can occur, affecting the accuracy of the pore structure data of small pore sizes corresponding to the high-pressure range. Therefore, low-temperature N2 adsorption data of pore sizes < 3 nm were combined with data obtained using the mercury pressure method to quantify pore evolution more accurately. Coal pores have different shapes and surface properties. The different pore shapes change the contact angle between the mercury and pore surface, causing errors. X-ray micro-CT 3D microscopic imaging can provide high-resolution 3D digital images of the complex structure inside the sample without destroying the sample and digitally characterize its internal microstructure in 3D at the micron scale, enriching the study of pore structures in the macroporous range.

3. Experimental Results and Analysis

3.1. Low-Temperature N2 Adsorption Results

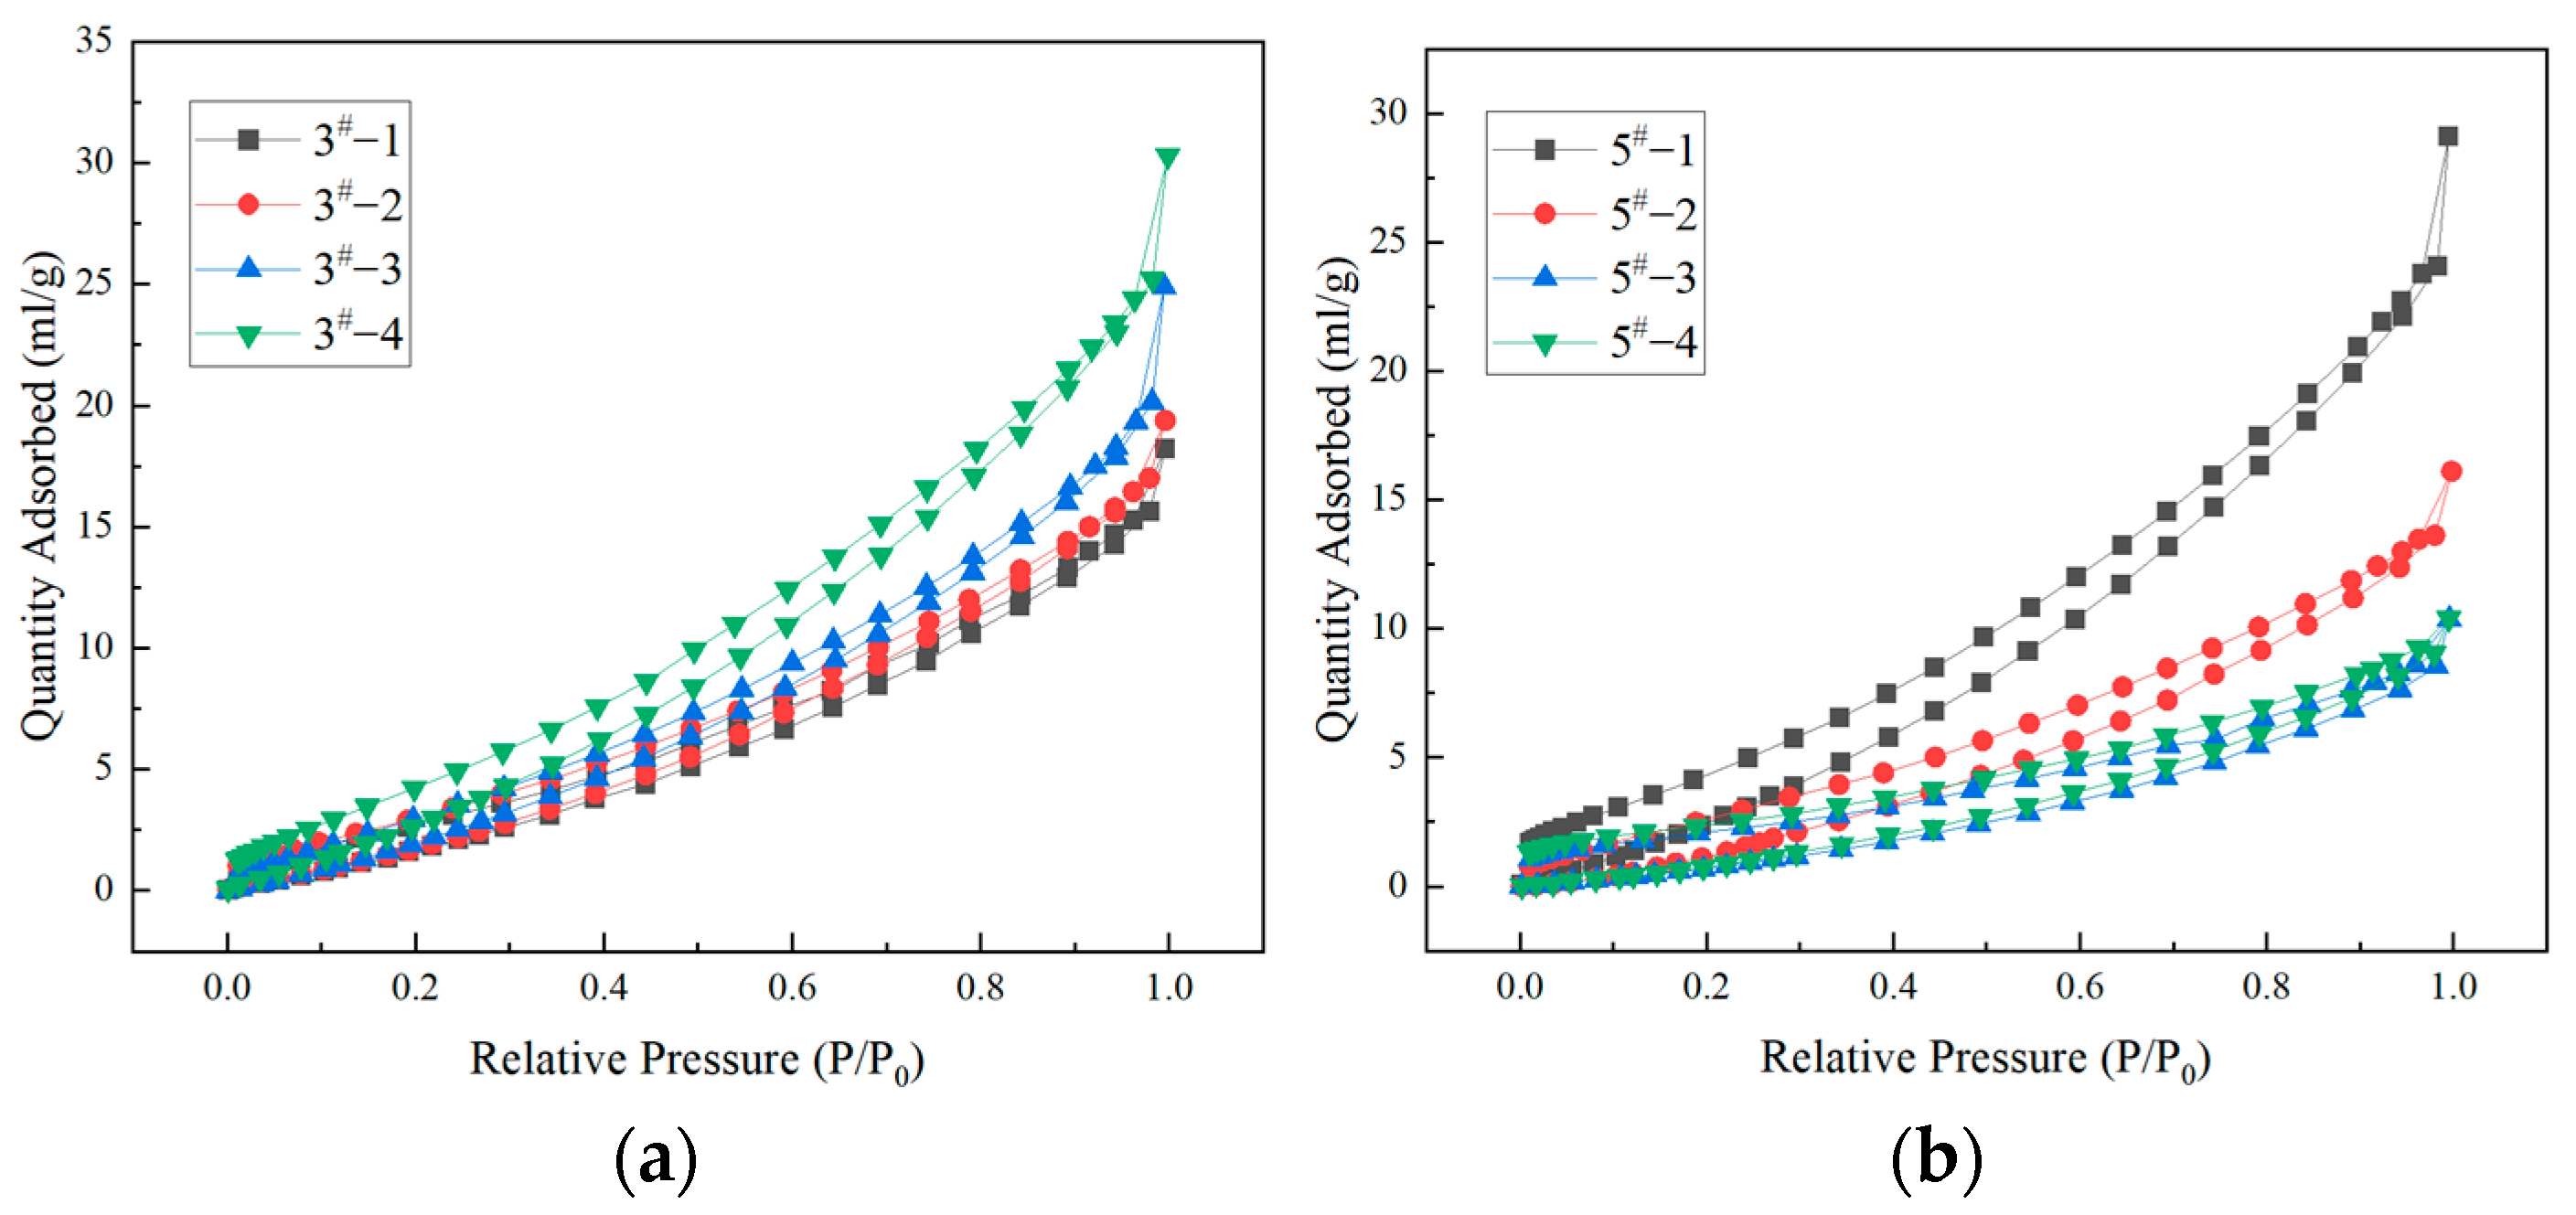
3.1.1. Adsorption Isotherm

The type of hysteresis loops corresponding to the physisorption isotherms is related to the morphology of the pores. IUPAC [37] published five types of hysteresis loops, each corresponding to a specific pore structure and its adsorption mechanism. The liquid N2 adsorption desorption curves of the eight coal samples are shown in Figure 1. The hysteresis loops of all coal samples belonged to Type H3. The adsorption branch of this hysteresis loop is very similar to the reversible Type II isotherm, which does not contain the limitations of monolayer-multilayer adsorption. In addition, the lower limit of the desorption branch is generally at P/P0 owing to cavitation, indicating the existence of slit-like pores in the coal samples. The separation of adsorption and desorption curves was more distinct in samples 5#-1 and 5#-2, indicating that the number and proportion of open and ink bottle-type pores in these two samples were relatively high. All sets of coal samples had similar characteristics: the adsorption curves increased with increasing P/P0, the rising trend was relatively smooth, and none had obvious inflection points. The desorption and adsorption curves showed the same trend but did not completely overlap, indicating that the small pores and micropores of samples 3# and 5# are impermeable pores closed at one end.

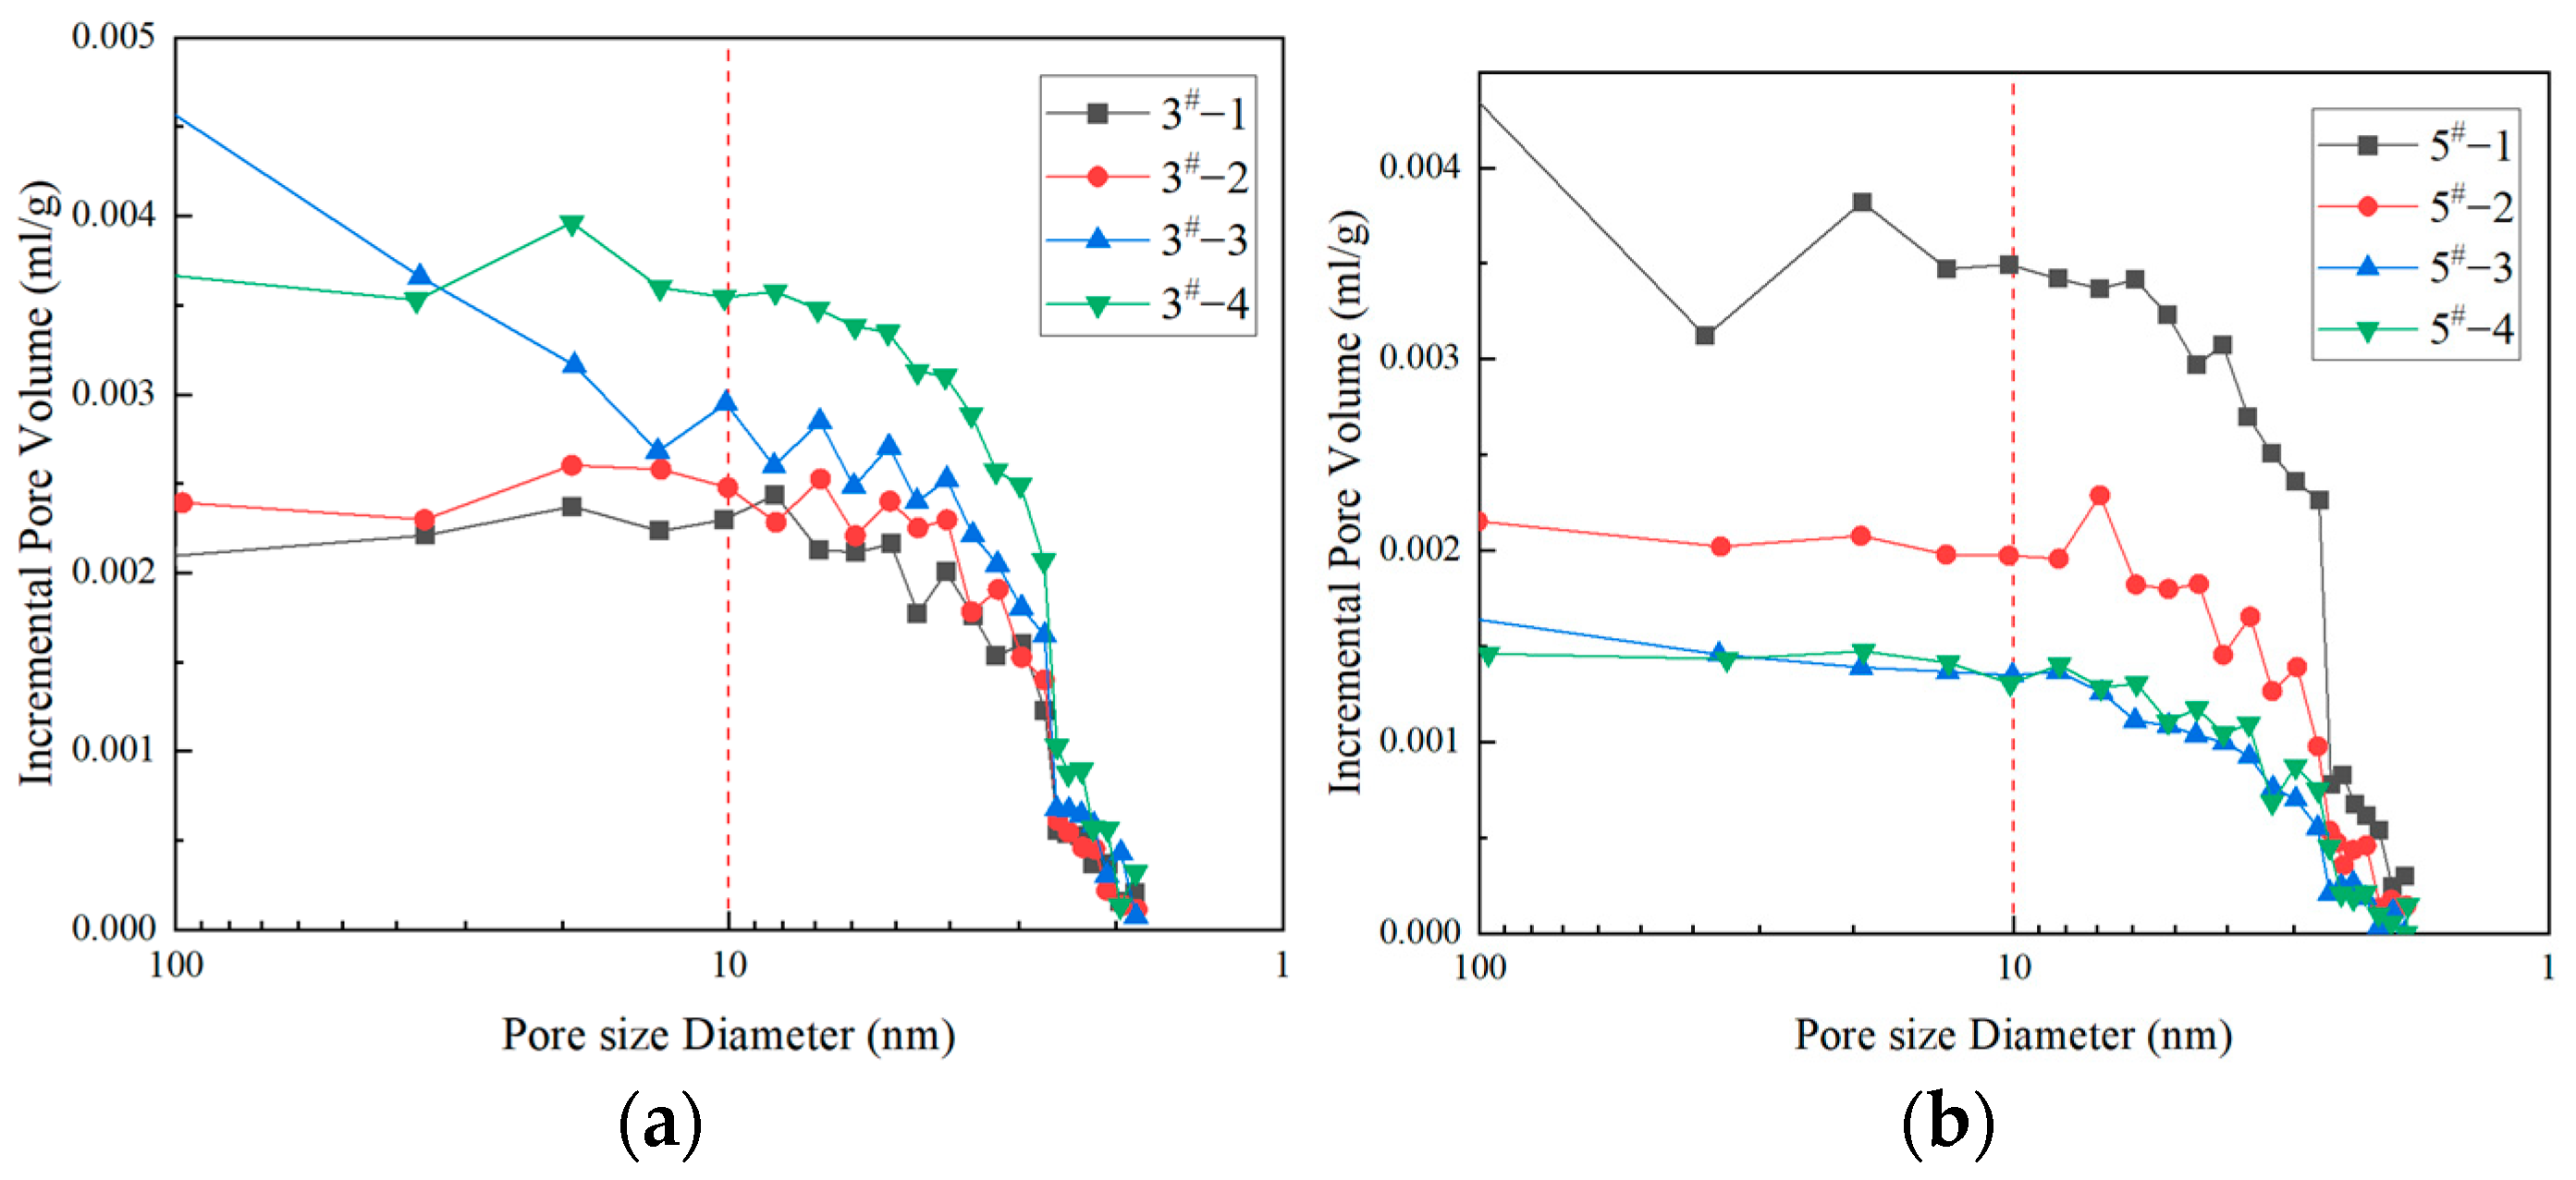
3.1.2. Pore Structure Characteristics of Small Pores and Micropores

The measured adsorption–desorption isotherms were quantified by combining the physical adsorption isotherm type, liquid N2 hysteresis loop type [37], and density flooding theory to analyze the pore structure parameters [38]. Figure 2 shows the pore volume increment distribution curves of the coal samples plotted using the Barrett–Joyner–Halenda method combined with density flooding theory analysis. The pore size distribution curves of all coal samples showed a decreasing trend with decreasing pore size when the pore size was in the range of 1.8–100 nm.
In the Barrett-Joyner-Halenda model analysis, the peaks of all sets of coal samples were relatively concentrated in the pore diameter range of 2–10 nm. When the pore diameter was >10 nm, the pore volume distribution curve showed a stable increasing trend. With the exception of samples 3#-4 and 5#-3, all coal samples showed a multipeak distribution in the 2–10 nm pore size range, indicating that the micropores provided substantial specific surface area. The volumes of small pores and micropores in the coal samples are shown in Figure 2 and Table 2. The micropores provided sufficient channels for gas adsorption and transport.
The specific surface area distribution of small pores and micropores of the eight groups of coal samples increased, then decreased, and then increased as the pore size decreased, as shown in Figure 3. The specific surface area of small pores increased slowly with decreasing pore size, while the specific surface area of micropores increased rapidly and the distribution was more concentrated than that of small pores. This indicates that the vast majority of the specific surface area of coal sample micropores is consisted of micropores, which provide the main adsorption location for gas.

3.1.3. Fractal Analysis of Small Pores and Micropores

The FHH model describing multilayer adsorption was chosen to calculate the fractal dimension under low-temperature N2 adsorption experiments [27], and the relationship between the measured pore volume, relative adsorption pressure, and fractal dimension D agreed with Equation (1) [39]:
ln ( V V 0 ) = C + A [ ln ( ln P 0 P ) ]
In the formula:
V—the amount of liquid nitrogen adsorbed, mL/g;
V0—amount of nitrogen adsorbed by a single molecular layer, mL/g;
P0—saturation vapor pressure of nitrogen adsorption, MPa;
P—liquid nitrogen adsorption pressure, MPa;
C—constant.
The data obtained from the low-temperature N2 adsorption experiment ln ( V V 0 ) [ ln ( ln P 0 P ) ] were fitted with Equation (1) to obtain slope A. The relationship between A and fractal size D can be expressed as A = (D − 3) [40]. In the low-pressure region where relative pressure P/P0 < 0.5, the fractal size of the coal surface is represented by D1, which is at the early stage of multilayer adsorption, and the gas-solid interface is mainly controlled by van der Waals forces. In the high-pressure region with relative pressure P/P0 > 0.5, capillary coalescence of liquid nitrogen occurs in the pores and the adsorption mechanism changes; therefore, D2 was used to characterize the fractal size of the pore structure of the coal body. Based on the geometric significance of the fractal dimensions, the fractal dimensions of LP–N2A based pores were calculated. The fractal dimensions of small and micro pores of different coal samples are shown in Table 3. To distinguish the fractal dimensions obtained by the mercury pressure method, D11 was defined as the fractal dimension of the low-pressure region and D12 as the fractal dimension of the high-pressure region.
The D11 value was proportional to the roughness of the pore surface. Larger values represent the presence of more adsorption points and stronger adsorption capacity for methane. D12 can describe the complexity of the internal structure of the coal body; the more complex the pore structure, the larger the D12, the stronger the capillary condensation effect, and the worse the methane adsorption capacity [41]. Analysis of the data obtained by N2 adsorption revealed that D11 of all coal samples ranged from 0.55 to 1.22, indicating that pore surfaces of <100 nm were smooth. The relationship between fractal size D12 of the coal samples in the high-pressure zone and their specific surface area (Figure 4) showed that the fractal size in the range of small pores and micropores increased exponentially with specific surface area, y = 2 × 10⁻²⁵e22.836x.

3.2. Mercury Pressure Method Results

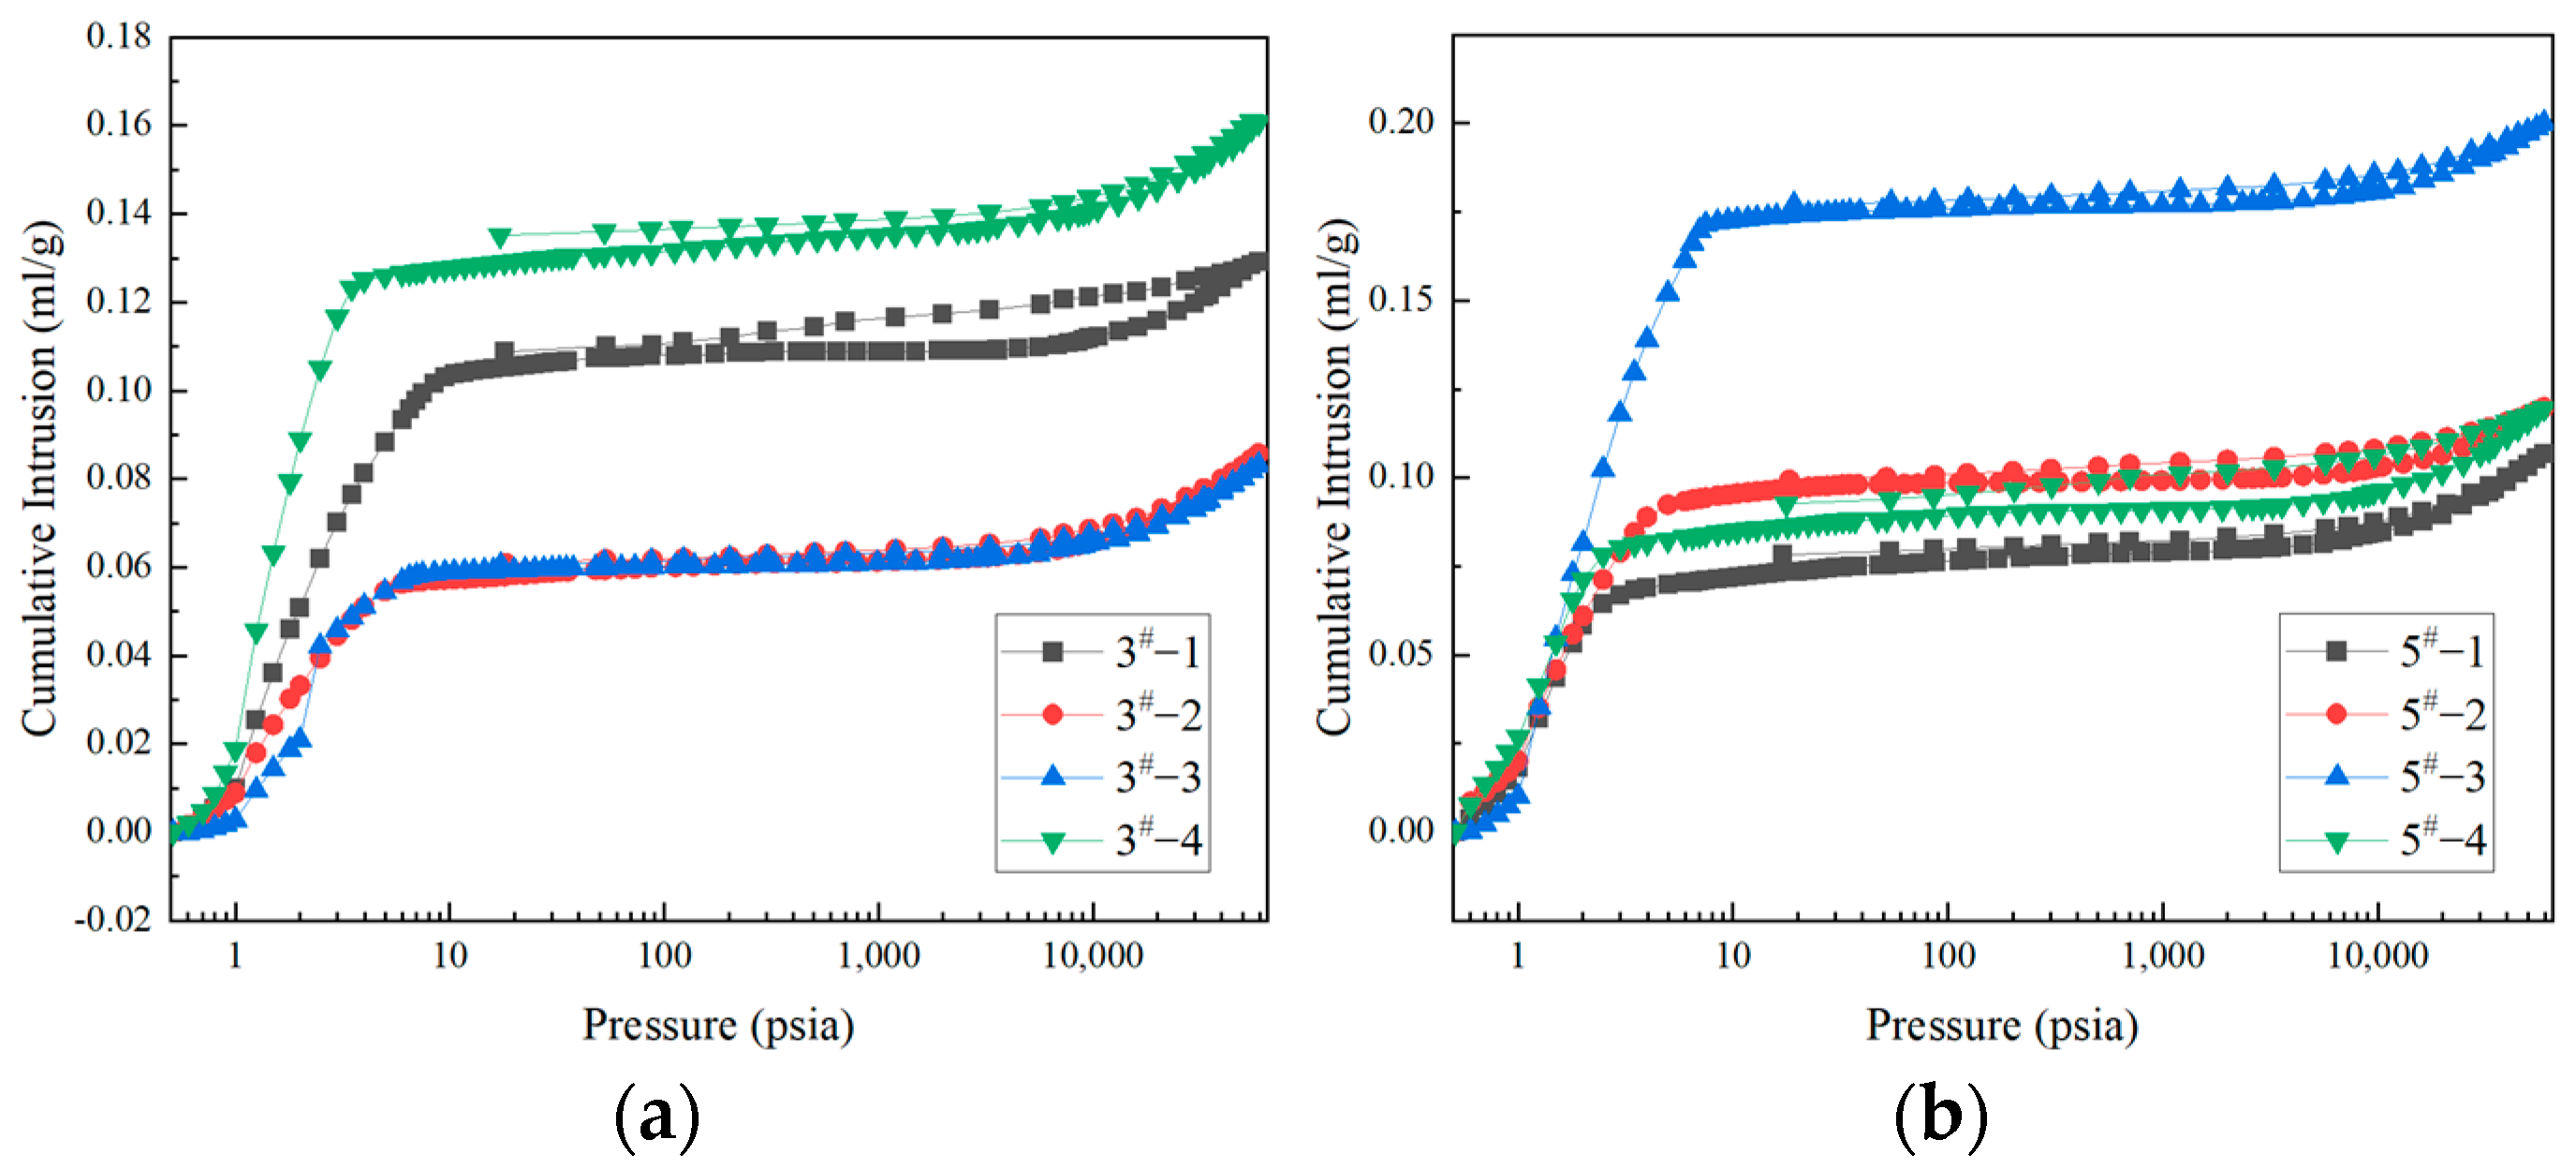
3.2.1. Inlet and Outlet Mercury Curves

The inlet and outlet mercury curves of the eight coal samples plotted from the mercury pressure experimental data are shown in Figure 5. The cumulative mercury inlet for each group of coal samples steeply increased in the initial mercury inlet stage and slowed in the middle pressure region; fissures led to a rapid increase in mercury inlet in the high-pressure region as mercury further filled the small pores and micropores. The shape of the mercury pressure curve is controlled by the sorting coefficient and size of the pore throat [42]. Therefore, mercury pressure curves allow us to visualize the pore size and pore throat distributions of coal samples. The hysteresis loop of the inlet and outlet mercury curves reflects the basic form of the pore space and its connectivity [43]. The effective pore space of coal grains consists of three basic types: open pores, semi-closed pores, and fine-necked bottle pores. Open pores produce the hysteresis phenomenon, closed pores do not produce a hysteresis loop because the receding mercury pressure is the same as the inlet pressure. The receding mercury pressures in the bottle and collar parts of the fine-necked bottle pore are not equal, causing a “sudden drop” type of hysteresis.
The inlet and outlet curves of the eight samples were similar but did not completely overlap and were generally bullhorn shaped. All coal samples produced hysteresis loops, but these were not significant, indicating the existence of mainly open, permeable pores. Small pores and micropores were more developed in the coal samples. The width of the hysteresis ring between the inlet and outlet curves of coal samples reflects the connectivity of the pores. Samples 3#-1 and 5#-4 had significantly larger hysteresis rings than the other samples, indicating that these two samples had more open pores in the pore size range measured by mercury pressure, relatively good pore connectivity, and structures that were more conducive to gas desorption, diffusion, and infiltration. The hysteresis loop in the piezometric curves of the remaining coal samples was very narrow, the volume difference between inlet and outlet was small, and the connectivity of pores with diameters of >100 nm was poor. The inlet and outlet mercury curves of all samples showed no sudden drop, the difference in inlet and outlet mercury volumes was not significant, and the curves were similar.

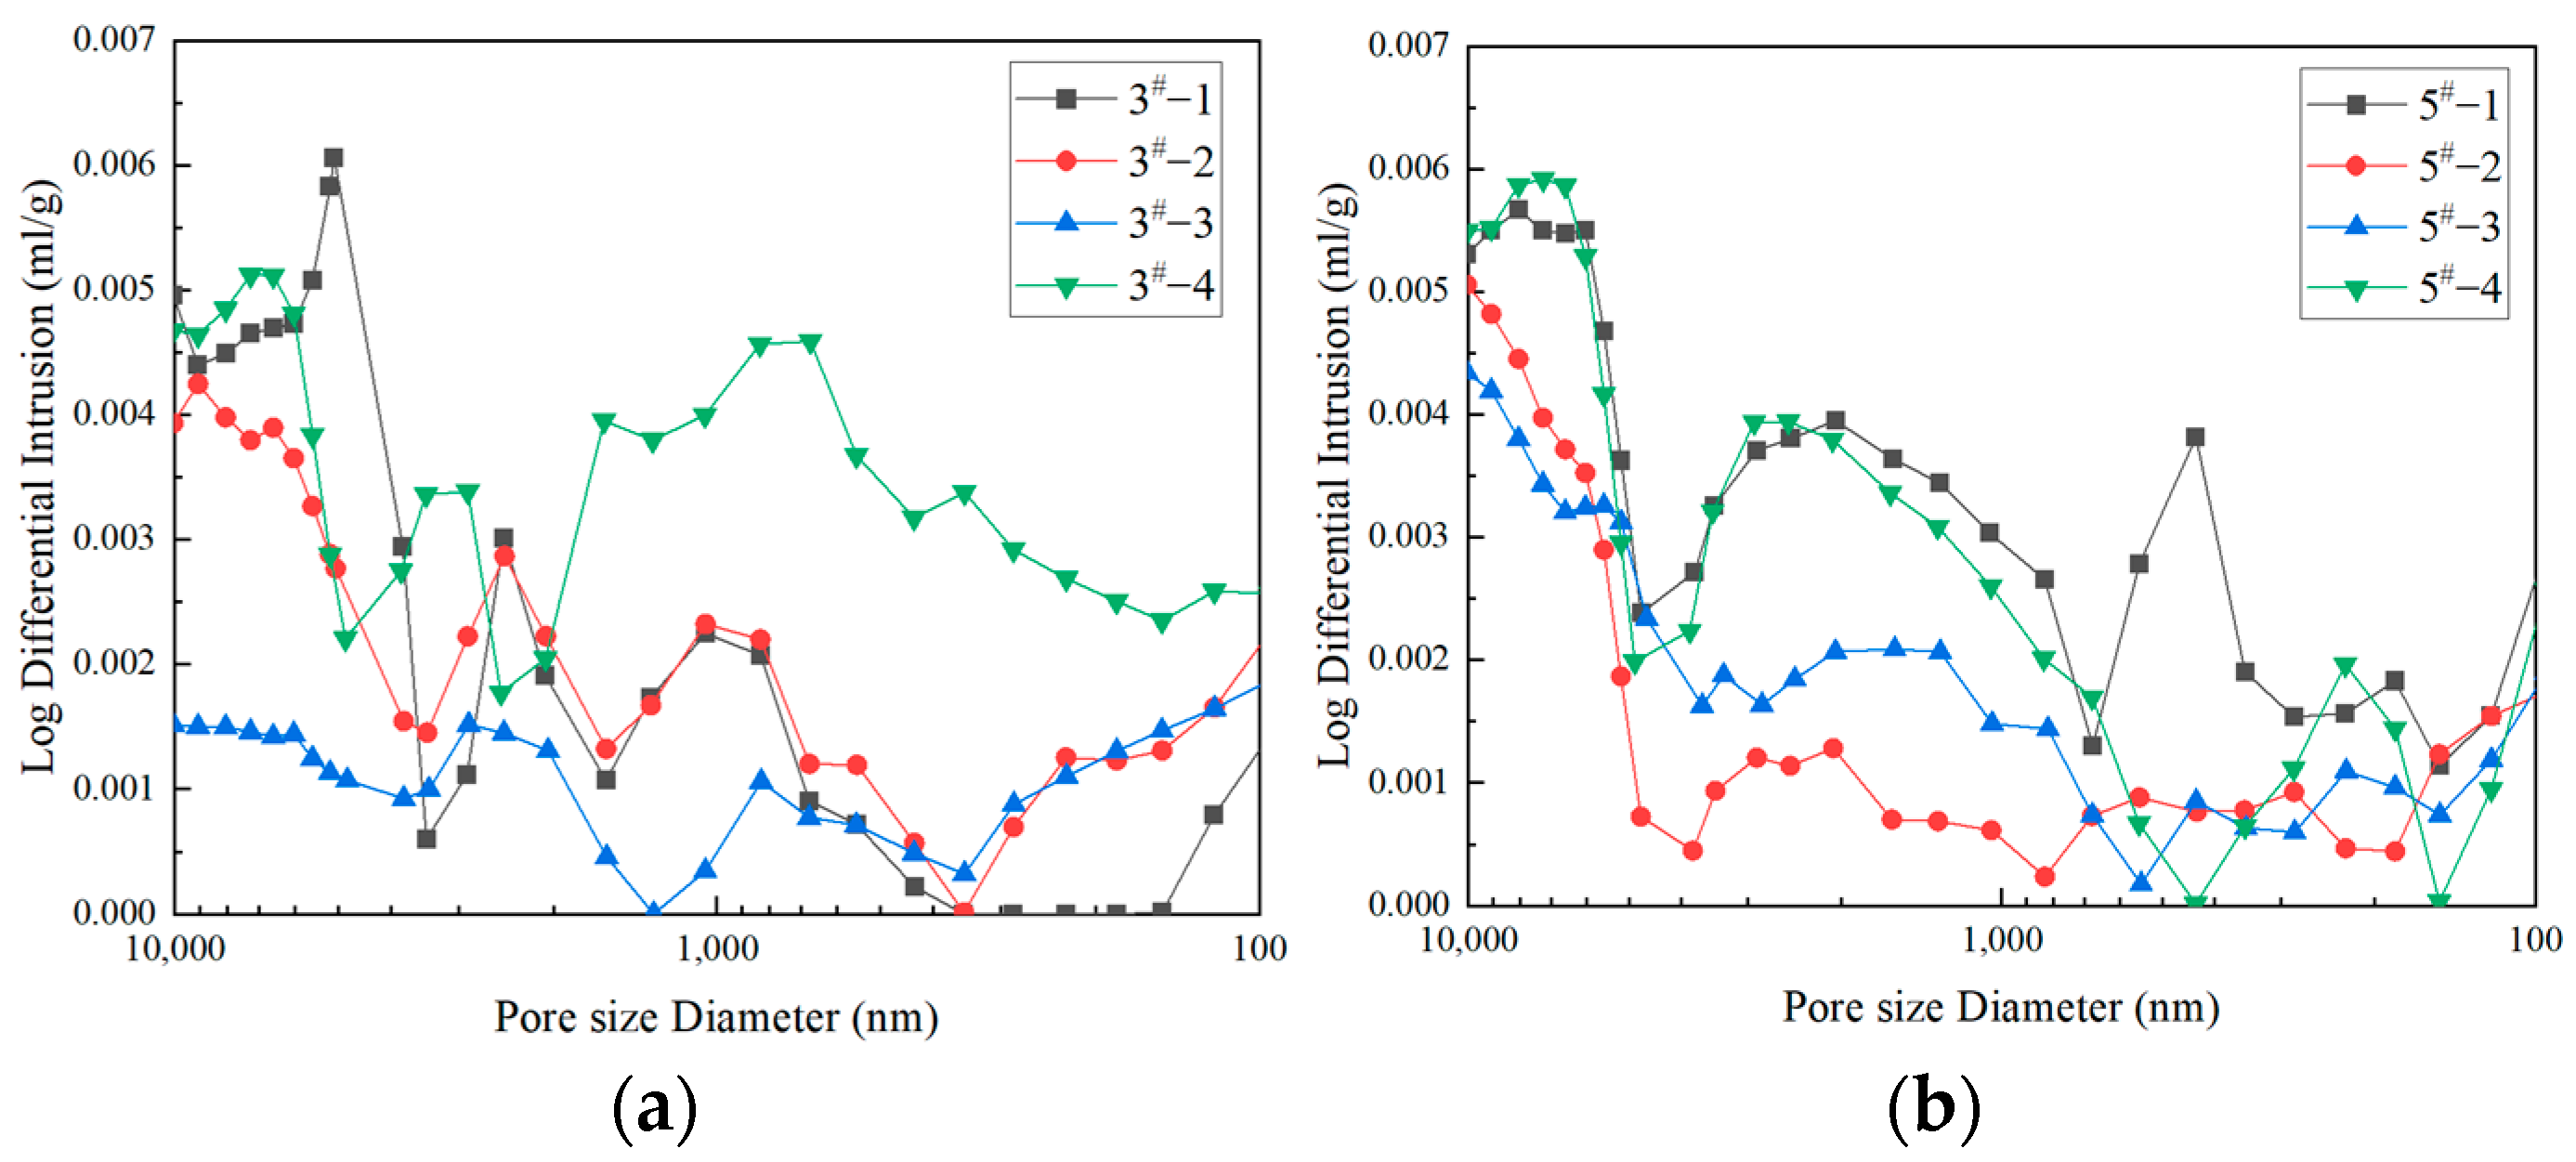
3.2.2. Large Pore and Mesopore Structure Characteristics

The volume of large pores and mesopores of all coal samples gradually decreased with the decrease of pore diameter, as shown in Figure 6; the pore volume of coal samples was mainly provided by large pores. The pore volumes of samples 3#-4 and 5#-1 increased more obviously when pore diameters were 100–1000 nm, indicating that medium pores in these two samples are better developed than others. The percentage of pore volume with large pores in the coal samples was calculated to be between 34% and 49%, while the mesopores were poorly developed.
Figure 7 shows the distribution of the specific surface area of medium and large pores for the eight coal samples. The curves of each group of coal samples were similar in shape, and the distribution curve of the specific surface area of large pores changed gently with decreasing pore size and was close to 0. The specific surface area of medium pores increased rapidly.
Smaller pore size provides more specific surface area for coal samples. The micropores and small pores of the eight groups of coal samples were the main contributors to the total specific surface area (Table 4), constituting a larger gas storage space than the mesopores and large pores. Sample 3#-1 showed an insignificant growth trend in the specific surface area distribution curve in the mesopores stage, and the lowest proportion among all coal samples. Sample 3#-4 showed a consistently increasing trend in the mesopore stage, the highest degree of mesopore development, and the highest proportion of mesopores.

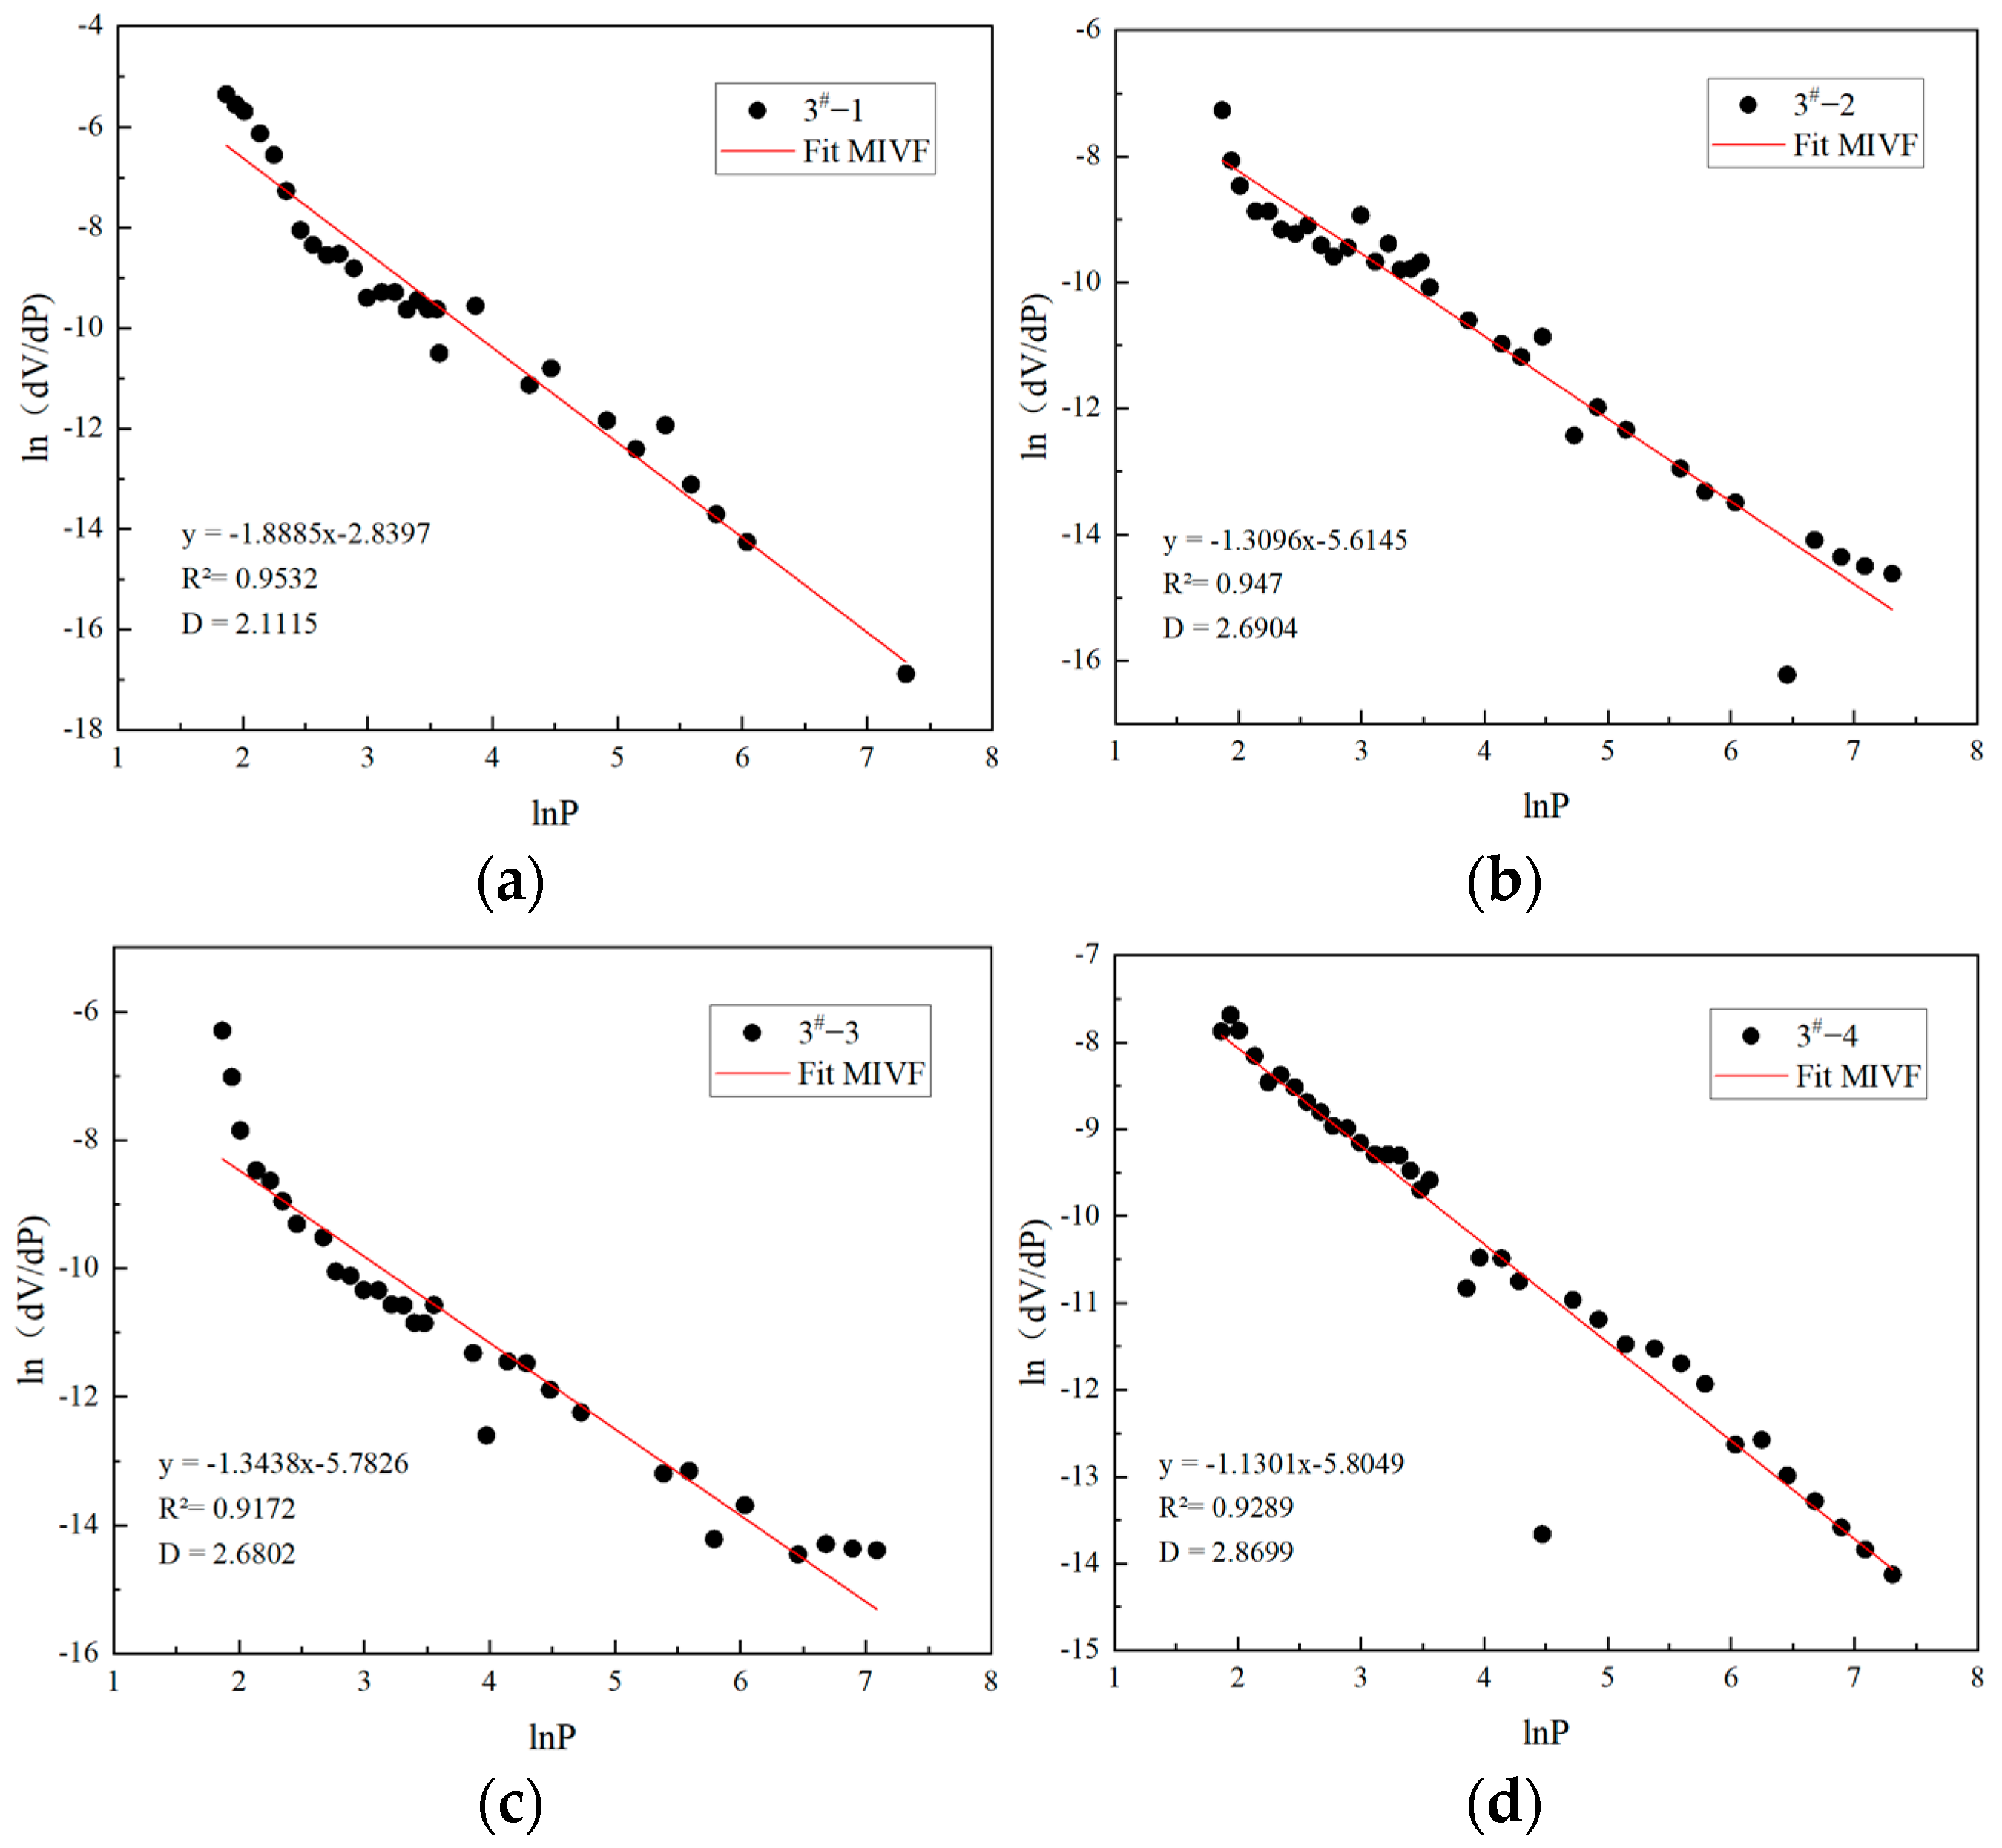
3.2.3. Fractal Analysis of Large Pores and Mesopores

The Menger sponge model and Washburn equation were chosen to process the high-pressure mercury pressure data. The calculated fractal dimension D characterizes solid surface roughness. During high-pressure mercury pressurization, the incoming mercury volume VP at pressure P is the total volume of the corresponding pores with a pore diameter greater than r, that is:
dV P dr = P r · dV P dP
The total coal volume consists of the pore volume and the volume of the coal matrix skeleton; that is:
L3 = VP + Vr
The relationship between the remaining coal matrix skeleton Vr and pore size r is:
Vr ∝ r3−D
Deriving the above equation yields:
dV r dr r 2 D
Combining Equations (2), (3) and (5) yields:
dV P dr r 2 D
According to the Washburn equation [44]:
r = 2 γ cos θ P
where P is the inlet mercury pressure (Pa), r is the pore radius (m), γ is the surface tension of mercury (N/m), and θ is the contact angle between the mercury and coal.
Combining Equations (7) and (8) yields [45]:
dV P dP P D 4
Taking the logarithm of the left and right sides of Equation (8):
ln ( dV P dP ( D 4 ) ) lnP
where V is the volume of mercury in the pore corresponding to the inlet pressure (mL), P is the inlet pressure (MPa), and D is the fractal dimension of the coal sample obtained using the mercury pressure method.
If the slope k of the curve made by ln ( dV P dP ) to lnP satisfies k = D − 4, then the fractal dimension D = k + 4. D describes the pore space as well as the roughness of the solid fracture surface, and the two are proportional.
The fractal dimensions of the eight samples measured using the mercury pressure method are shown in Figure 8 and Figure 9. The fractal dimension of large pores and mesopores ranged between 2.11 and 2.87, and the fit degree was >0.9, indicating obvious fractal characteristics. The fractal size D of the coal sample was fitted to its specific surface area (Figure 10). The relationship between D and the specific surface area of large pores and mesopores showed exponential growth (y = 3 × 10⁻⁴e1.73431x), which was consistent with the pattern for small pores and micropores obtained using the N2 adsorption method. The fitting degree was >0.97, indicating an extremely strong correlation.

3.3. Coal Pore Structure from X-ray Micro-CT

Samples of approximately 1 cm were selected and analyzed with a CT scanner having a resolution of 2 μm. The data were analyzed using the Avizo 2019 software. The size and distribution of pores affect the physical properties of porous materials, and the variation of pore morphology between different coal samples is influenced by the different geographical locations they are located in. Since the coal samples in this paper were all taken from the same mine, coal sample 3#-2 was used as an example. The median filter, which is widely used in Avizo, was selected for denoising. When setting the interactive threshold, the minimum value that can ensure the pores have connectivity is chosen, as shown in Table 5. After the noise reduction process and threshold segmentation, it can obtain the 3D pore structure of the cut coal sample, and divide the pores into connected pores and isolated pores. Figure 11 shows the pore structure of the coal samples, in which green represents isolated pores and purple represents connected pores. Figure 12 shows the view of the coal sample after separating pores of <30 μm. Figure 13 shows a ball-and-stick model of the sample connected pores.
The pore volume and total volume of the coal samples were counted separately using Avizo, and the porosity of the coal sample was obtained using Equation (10):
= V pore V voxel
In the Equation (10): ∅ is the porosity of coal sample; Vpore is the total volume of pore, m3; Vvoxel is the total volume of coal sample, m3.
The eight reconstructed samples were quantified and analyzed, and the pore fracture microscopic parameters were calculated using Avizo. The bulk porosity of the coal samples is presented in Table 5. The pore percentage of the coal samples in the pore size range visible to CT was high. From Figure 14, pores were mainly concentrated in the 2–30 μm diameter range, and the percentage of isolated pores was low in all samples, indicating that the pore connectivity in this size range was good.
Avizo2019 was able to calculate the fractal dimensions and specific surface area of the coal samples (Table 6 and Figure 15). The fractal dimension of pores > 2 μm in diameter increases exponentially with the increase of specific surface area as a whole, following the equation y = 1 × 10⁻⁷e5.25263x with a correlation coefficient of 0.90286. These findings are consistent with the pattern obtained using the fluid intrusion method. Considering that CT can only extract pores of >2 μm, it can only reflect large pore segments. The large pores in some coal samples provide sufficient specific surface area, but their complex internal structure reduces the fractal dimension; therefore, the correlation coefficient is slightly lower than that obtained with the mercury pressure method.

4. Conclusions

We used the high-pressure mercury pressure and low-temperature N2 adsorption methods to analyze the pore structures of coal samples collected from seams 3# and 5# of the Xiangshan mine. The structure of coal samples was visualized and reconstructed in three dimensions using X-ray micro-CT scanning. The fractal dimensions of each pore segment were analyzed using the FHH model, Menger sponge model, and fractal dimension command in Avizo. Finally, the relationship between the pore specific surface area and fractal dimension of the coal samples was investigated. The main conclusions are as follows:
(1)
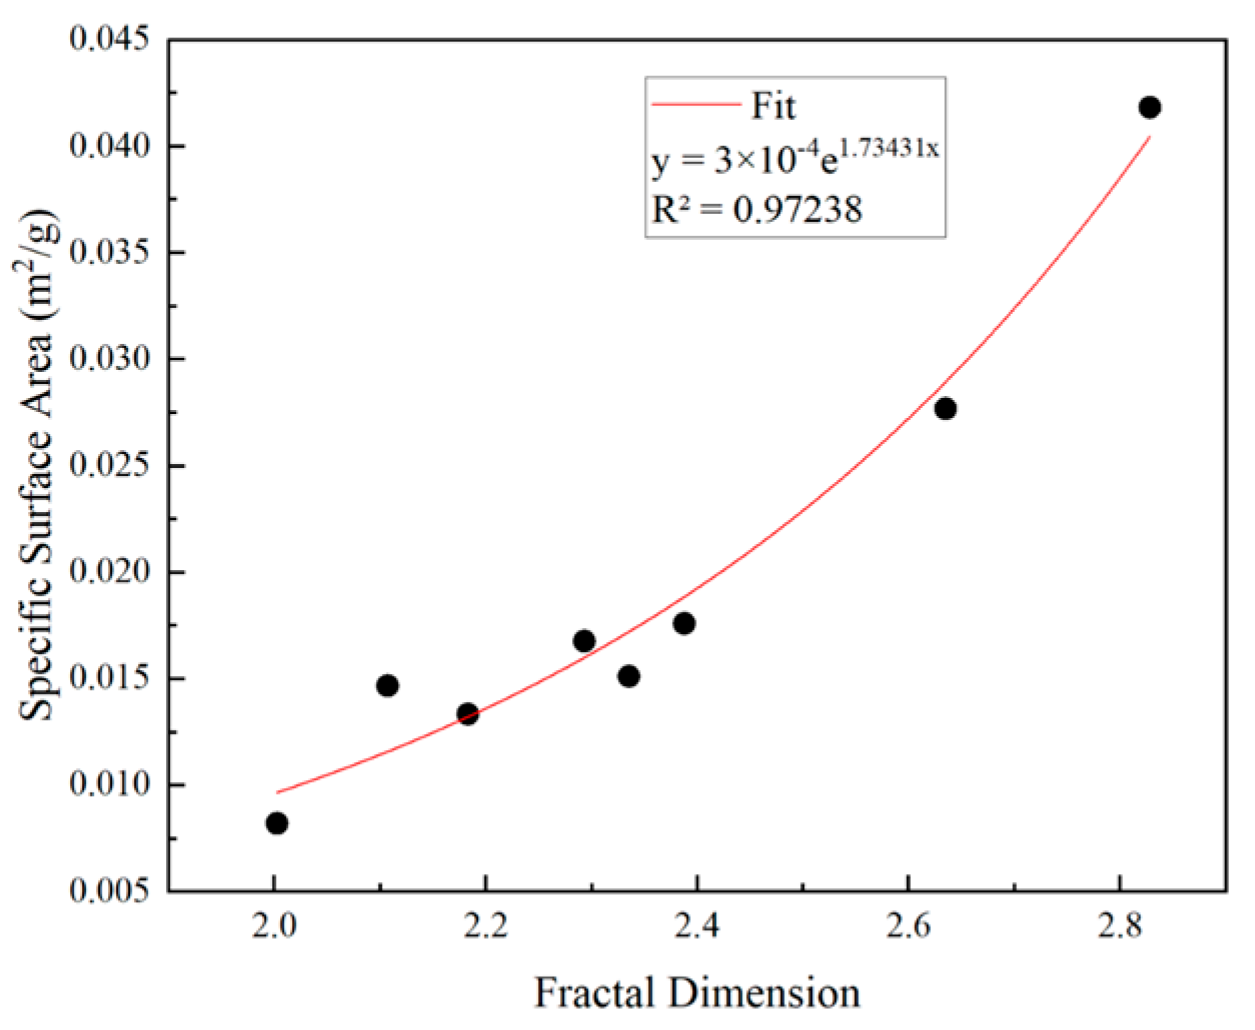
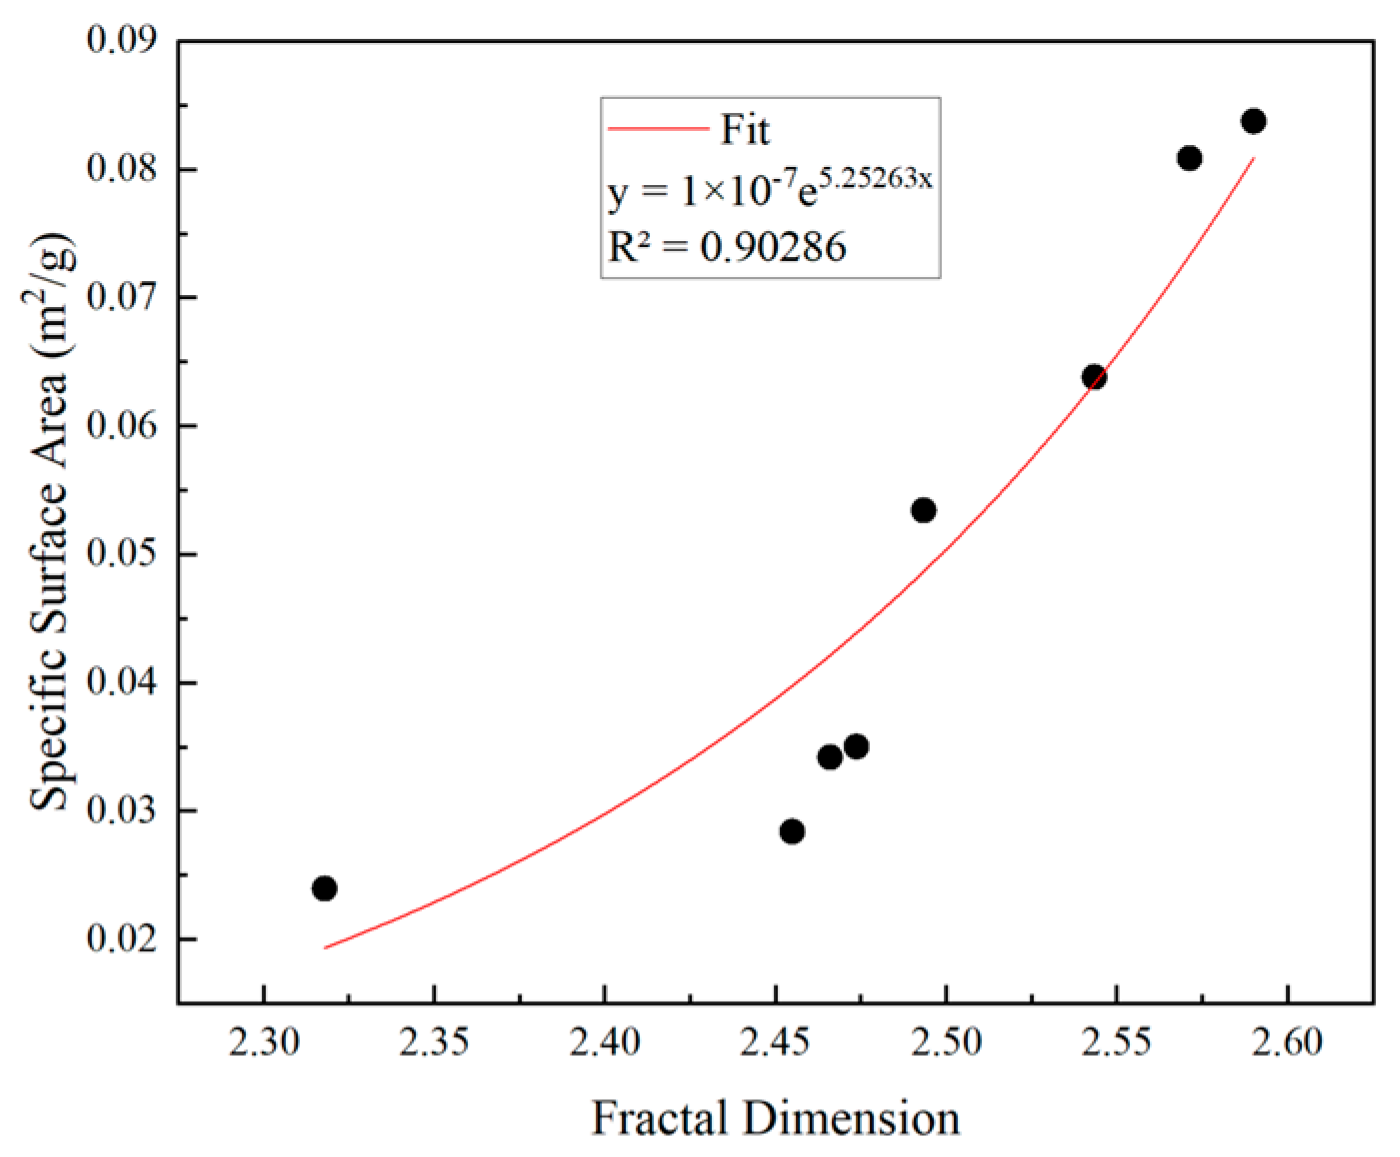
The fractal size of each pore segment in the coal samples increased exponentially with increasing specific surface area: the relationship for small pores and micropores measured using low-temperature liquid N2 adsorption was y = 2 × 10⁻²⁵e22.836x; the relationship for large pores and mesopores measured using the high-pressure mercury pressure method was y = 3 × 10⁻⁴e1.73431x; the relationship for large pores measured using X-ray micro-CT scanning was y = 1 × 10⁻⁷e5.25263x. The fitted values were all >0.9, indicating an extremely strong correlation.
(2)
The adsorption isotherms of all coal samples belonged to Type III. The adsorption curves increased with increasing P/P0, and there was no obvious inflection point in any of the curves. The desorption and adsorption curves decreased smoothly, without a steep change interval, indicating that the small micropores in the coal samples were mainly composed of impermeable pores closed at one end. The micropores developed in the coal samples provided sufficient channels for gas adsorption and transport. The fractal dimension in the range of small pores and micropores showed an exponential growth relationship with the specific surface area.
(3)
The inlet and outlet mercury curves for the samples were bullhorn shaped and similar. All coal samples produced hysteresis rings, although these were not significant, indicating that the closed pores in the large and medium pore range were more developed. The pore volume of large and medium pores in the coal samples was mainly attributable to large pores, whereas medium pores were less developed. The fractal dimension of large pores and mesopores was 2.11–2.87, and the fit was >0.9, indicating obvious fractal characteristics. The D of large and medium pores showed an exponential growth relationship with the specific surface area, and the fit was >0.97, indicating a very strong correlation.
(4)
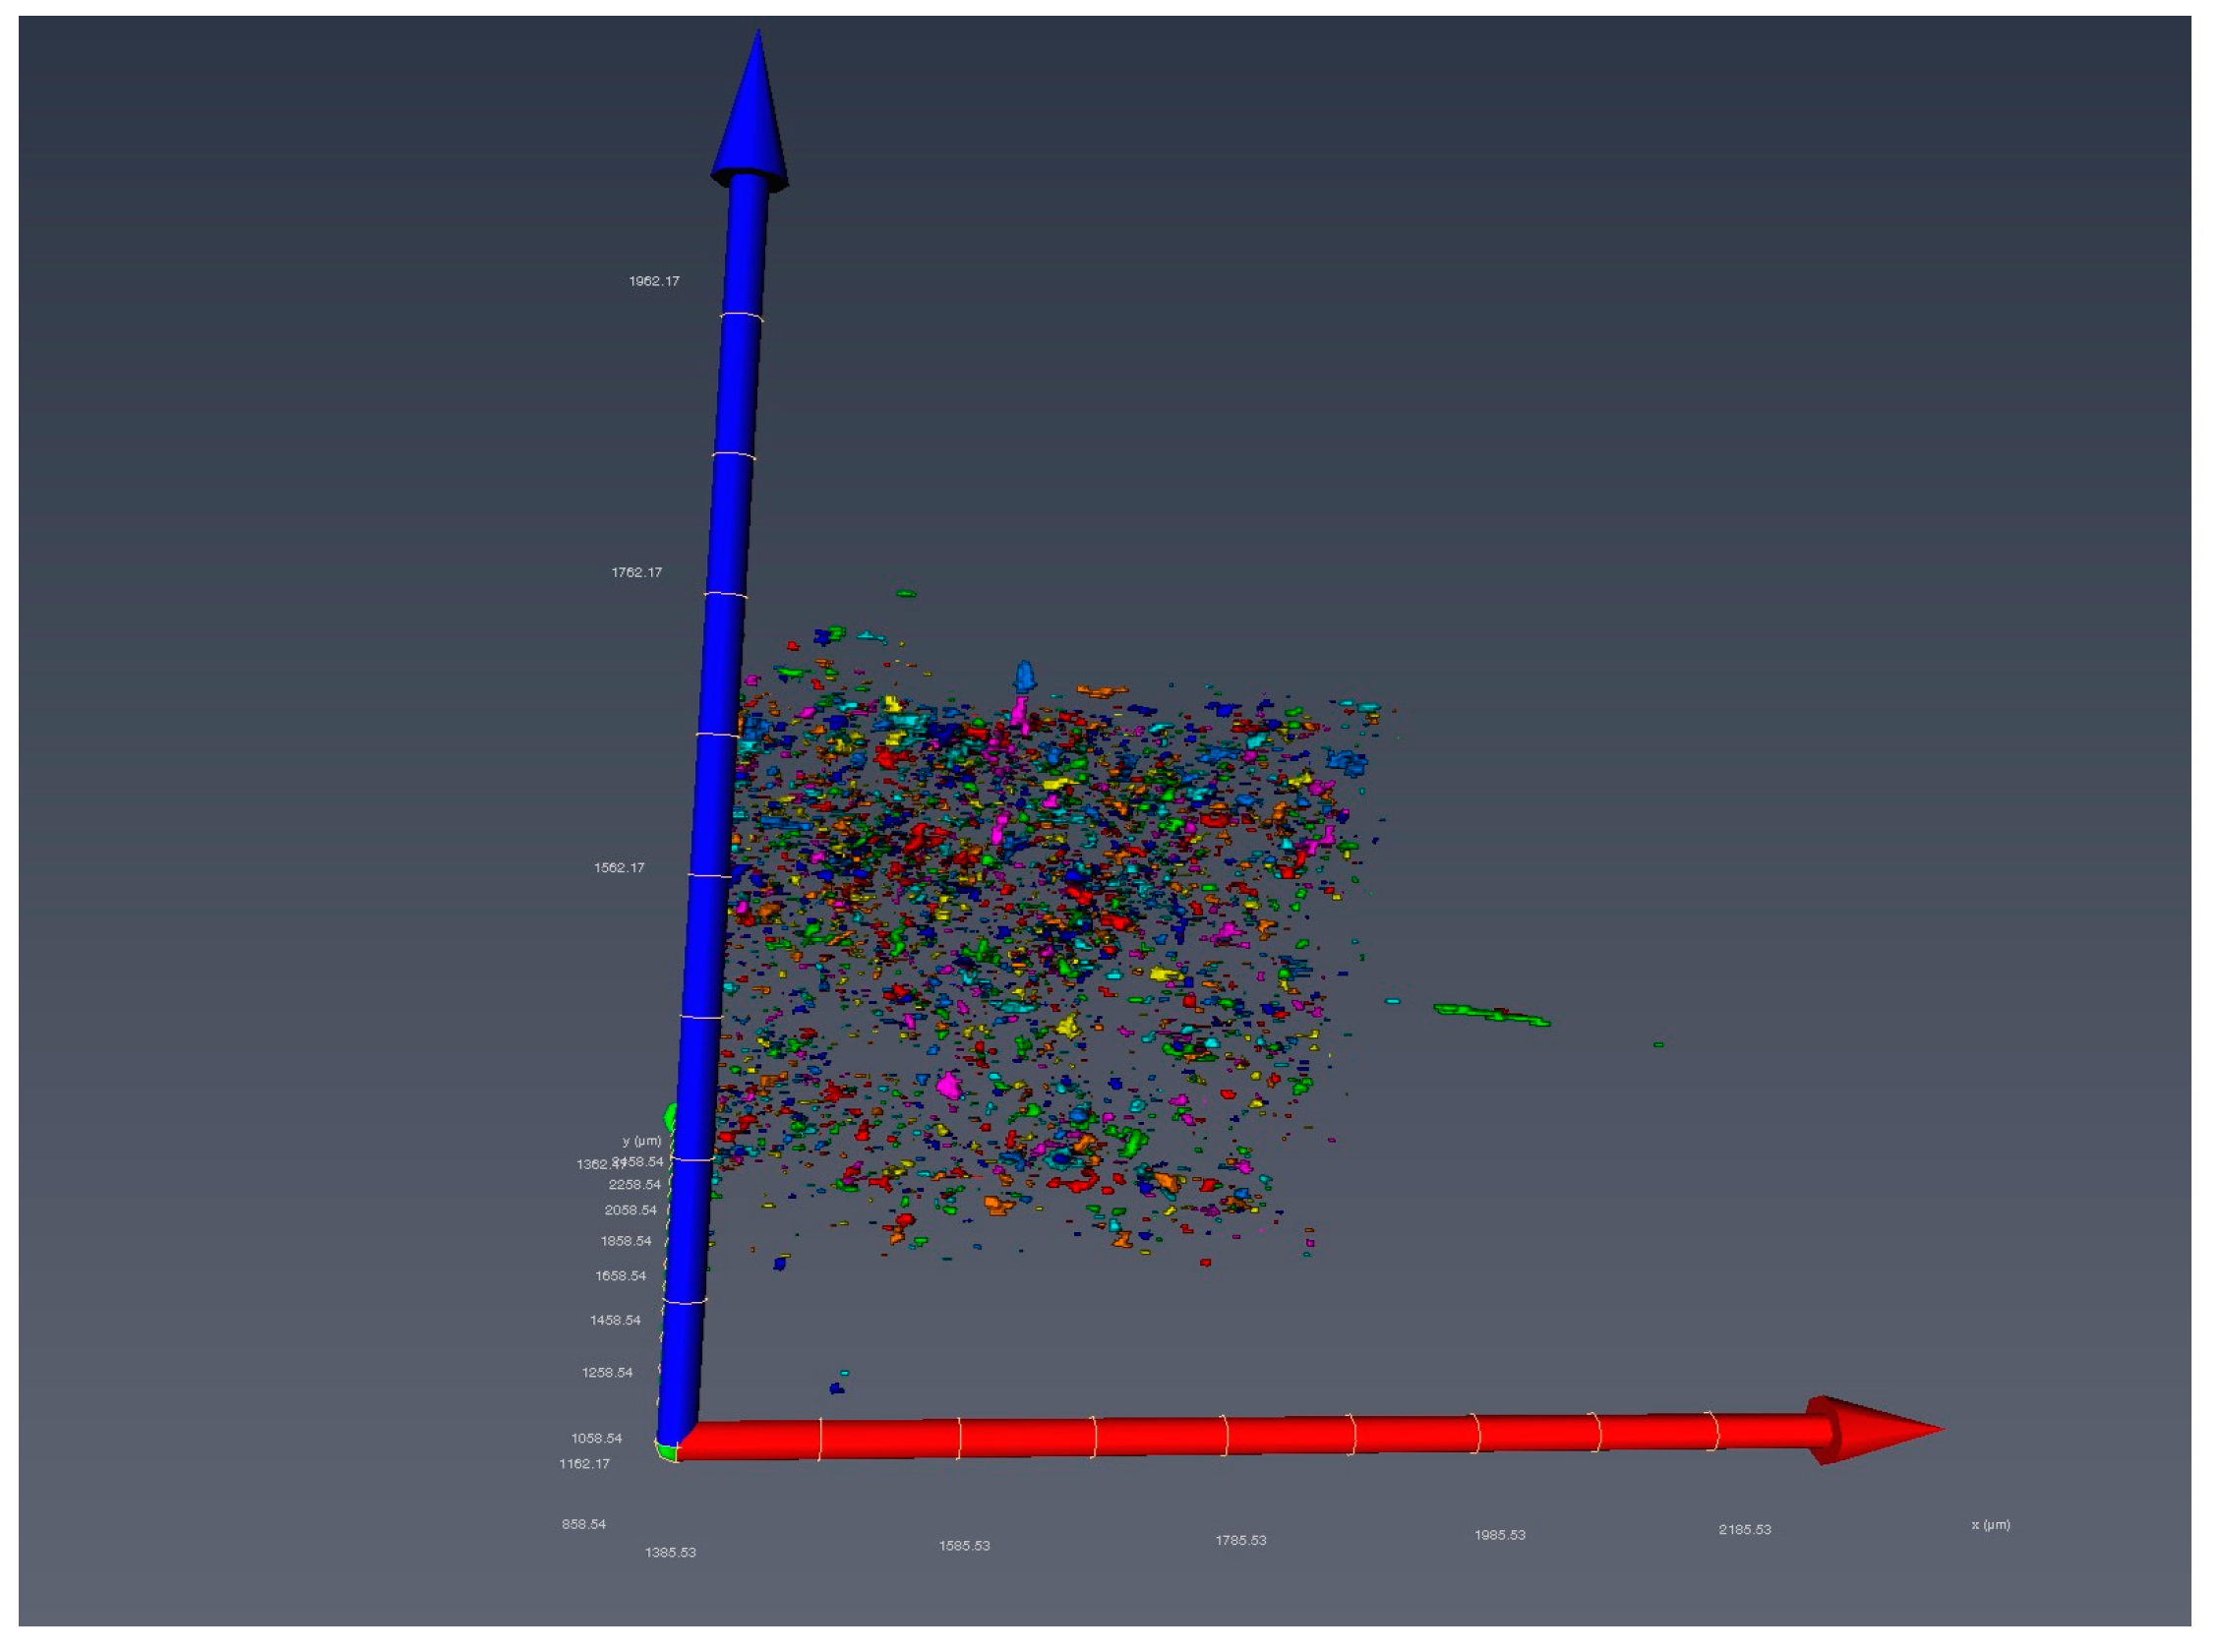
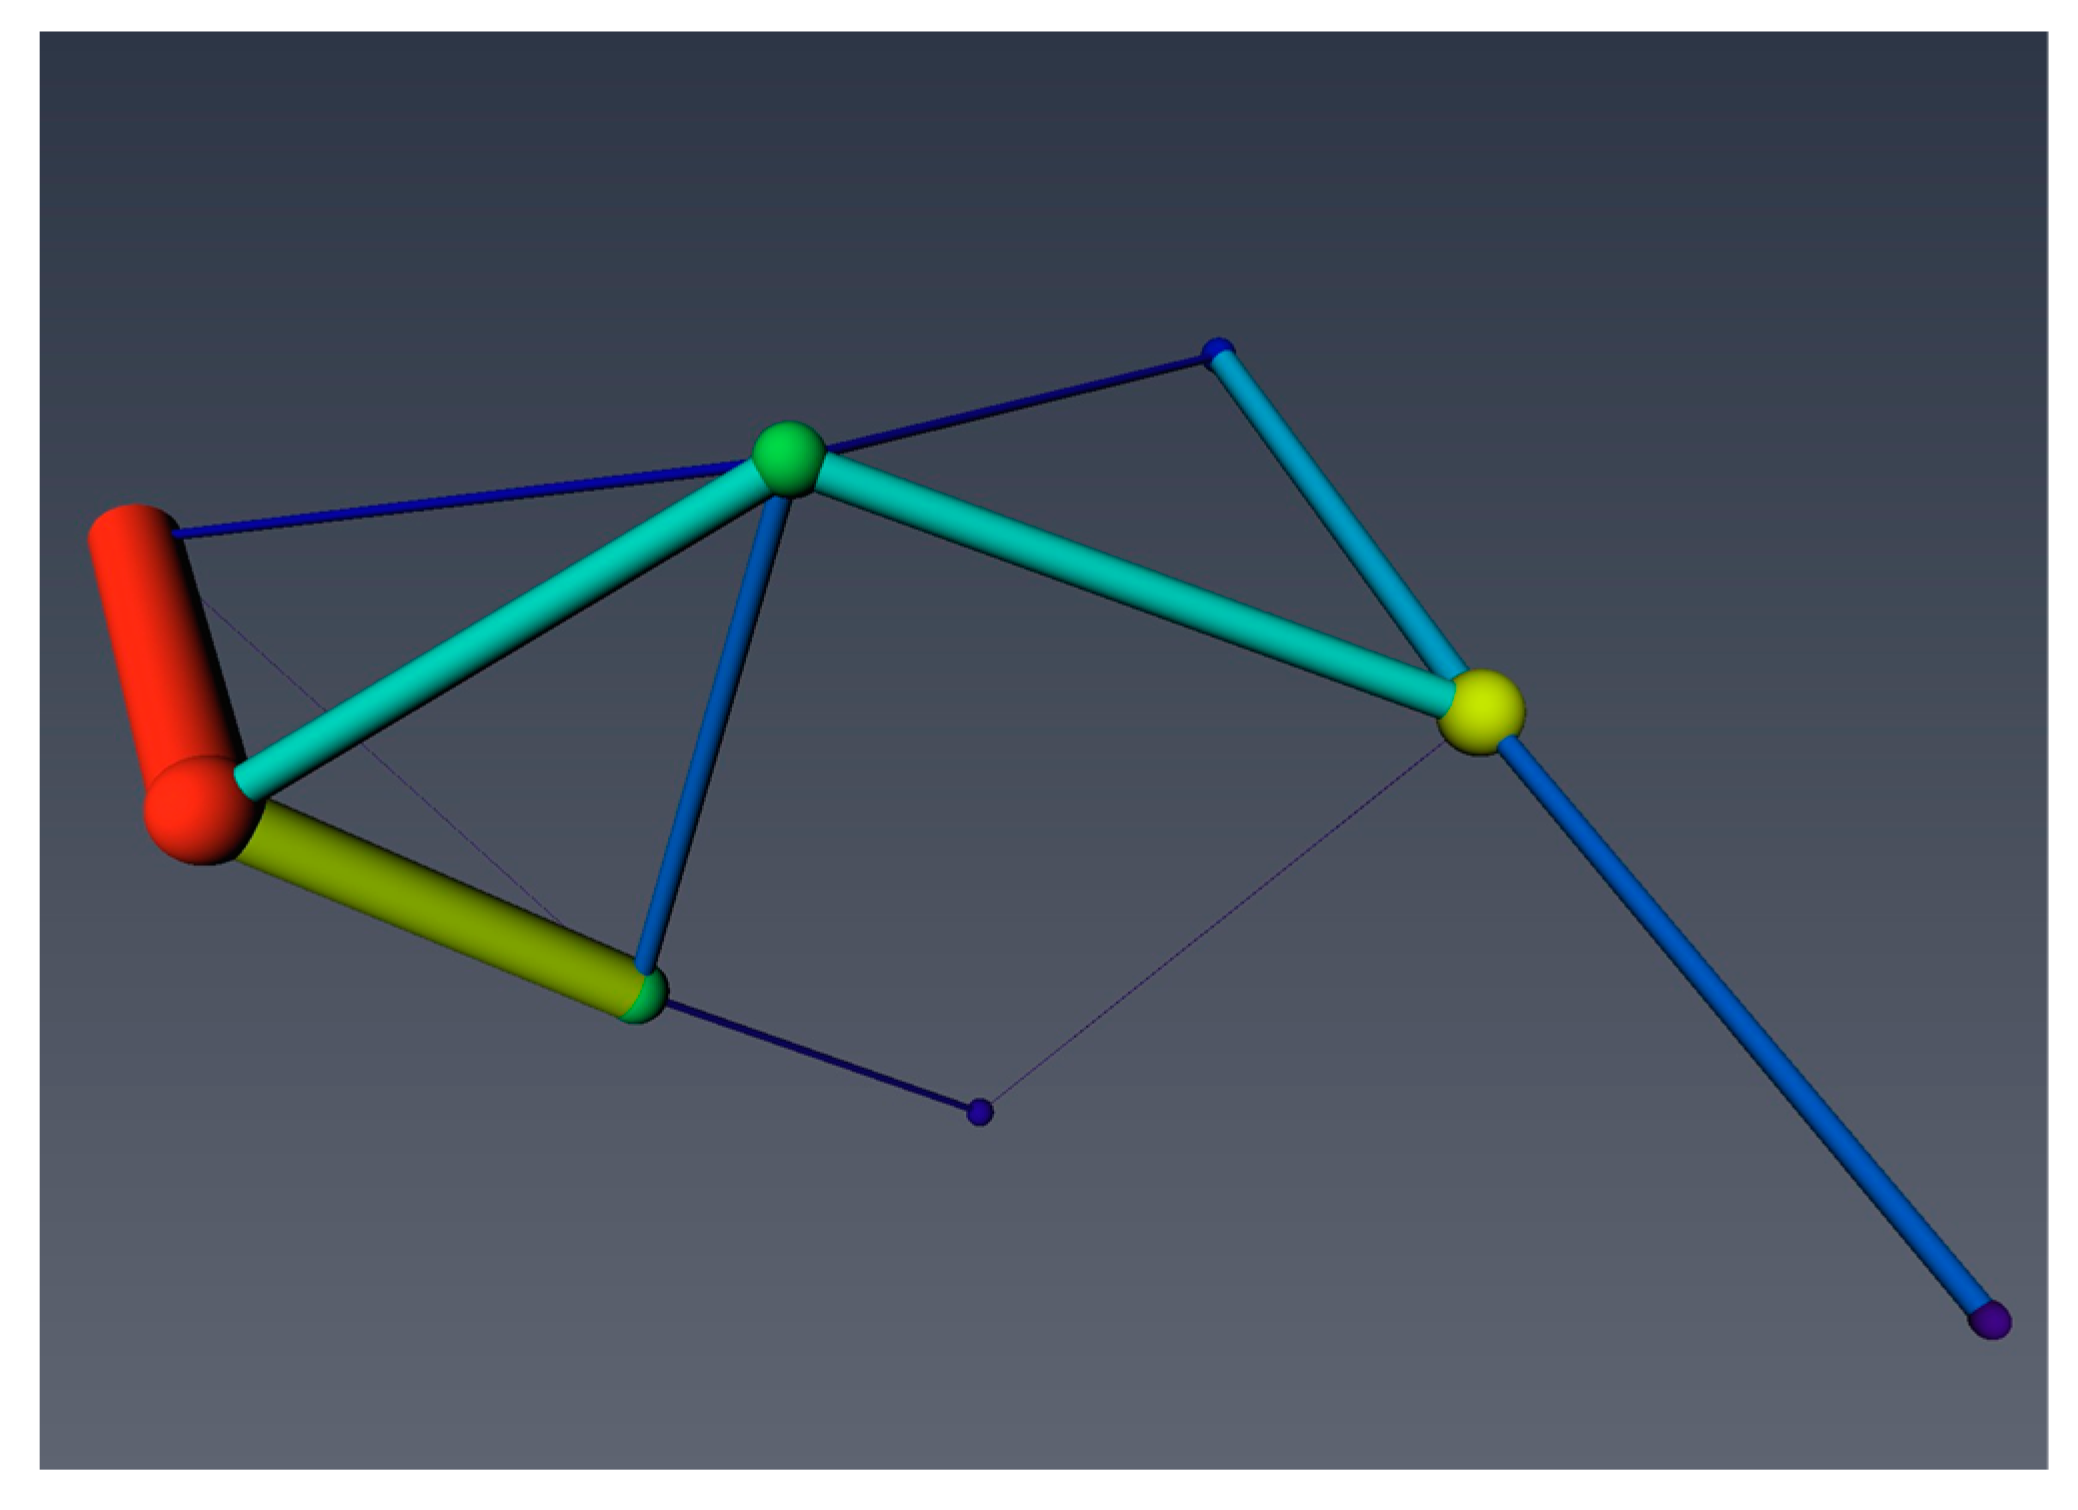
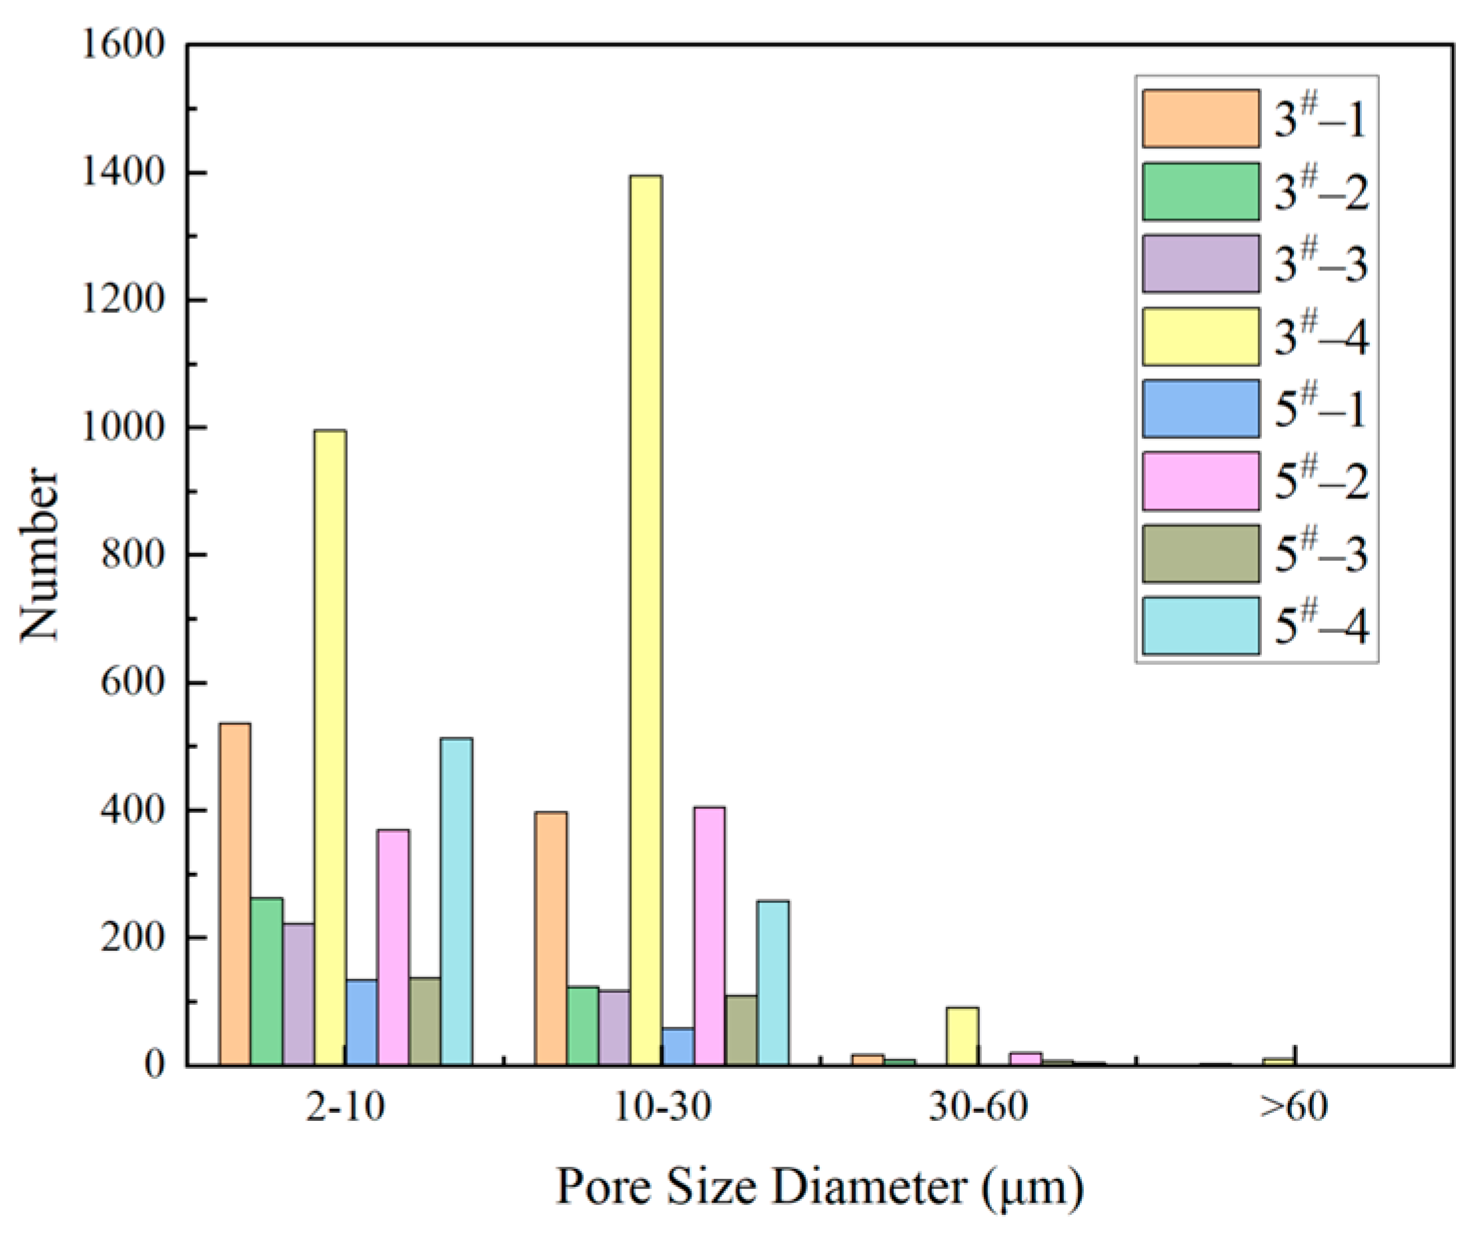
The pores of the coal samples within the CT study were mainly concentrated in the range of 4–30 μm in diameter. The percentage of isolated pores was low in all samples, indicating good connectivity in this pore size range. The fractal dimension of the pore size of coal samples of >2 μm exponentially increased with increasing specific surface area overall, which was consistent with the conclusion drawn from the data obtained using the fluid intrusion method.
The purpose of this study was to assist in determining the prominence risk of coal seams in engineering practice based on the obtained laws and to reduce the probability of coal and gas accidents. However, the study lacks a mechanistic analysis, and we will continue to explore the relevant data in order to provide a sufficient theoretical basis for the relationship between the fractal dimension of coal samples and specific surface area.

Author Contributions

Methodology, J.W.; Data curation, J.S.; Writing—original draft, R.M.; Writing—review & editing, X.C. All authors have read and agreed to the published version of the manuscript.

Funding

We gratefully acknowledge the financial support from the National Natural Science Foundation of China (52174181), National Natural Science Foundation of China (52174124), and National Natural Science Foundation of China (51204069).

Data Availability Statement

Not applicable.

Conflicts of Interest

The authors declare no conflict of interest.

References

  1. Du, F.; Wang, K.; Zhang, X.; Xin, C.P.; Shu, L.Y.; Wang, G.D. Experimental Study of Coal–Gas Outburst: Insights from Coal–Rock Structure, Gas Pressure and Adsorptivity. Nat. Resour. Res. 2020, 29, 2481–2493. [Google Scholar] [CrossRef]
  2. Yang, Y.P.; Wen, Z.H.; Si, L.L.; Xu, X.Y. Experimental study on variation law of electrical parameters and temperature rise effect of coal under DC electric field. Sci. Rep. 2021, 11, 7138. [Google Scholar] [CrossRef]
  3. Si, L.L.; Zhang, H.T.; Wei, J.P.; Li, B.; Han, H.K. Modeling and experiment for effective diffusion coefficient of gas in water-saturated coal. Fuel 2021, 284, 118887. [Google Scholar] [CrossRef]
  4. Zhang, H.J.; Zhang, L.; Wang, D.; Hou, J.L. Gas emission characteristics of tectonic coal and microscopic explanation of pore structure. J. China Coal Soc. 2018, 43, 3404–3410. [Google Scholar]
  5. Tim, A.M. Coalbed methane: A review. Int. J. Coal Geol. 2012, 101, 36–81. [Google Scholar]
  6. Qin, Y.; Tim, A.M.; Shen, J.; Yang, Z.B.; Shen, Y.L.; Wang, G. Resources and geology of coalbed methane in China: A review. Int. Geol. Rev. 2018, 60, 777–812. [Google Scholar] [CrossRef]
  7. Wen, Z.H.; Yang, Y.P.; Wang, Q.; Yao, B.H. Mechanism and characteristics of CH4/CO2/H2O adsorption in lignite molecules. Geofluids 2021, 2021, 5535321. [Google Scholar] [CrossRef]
  8. Yue, J.W.; Wang, Z.F.; Chen, J.S.; Zheng, M.H.; Wang, Q.; Lou, X.F. Investigation of pore structure characteristics and adsorption characteristics of coals with different destruction types. Adsorp. Sci. Technol. 2019, 37, 623–648. [Google Scholar] [CrossRef]
  9. Du, F.; Wang, K. Unstable failure of gas-bearing coal-rock combination bodies: Insights from physical experiments and numerical simulations. Process. Saf. Environ. Prot. 2019, 129, 264–279. [Google Scholar] [CrossRef]
  10. Wang, P.F.; Jiang, Z.X.; Chen, L.; Yin, L.S.; Li, Z.; Zhang, C.; Tang, X.L.; Wang, G.Z. Pore structure characterization for the Longmaxi and Niutitang shales in the Upper Yangtze Platform, South China: Evidence from focused ion beam–He ion microscopy, nano-computerized tomography and gas adsorption analysis. Mar. Pet. Geol. 2016, 77, 1323–1337. [Google Scholar] [CrossRef]
  11. Zhou, G.; Ma, Y.L.; Fan, T.; Wang, G. Preparation and characteristics of a multifunctional dust suppressant with agglomeration and wettability performance used in coal mine. Chem. Eng. Res. Des. 2018, 132, 729–742. [Google Scholar] [CrossRef]
  12. Ma, Y.L.; Zhou, G.; Ding, J.F.; Li, S.L.; Wang, G. Preparation and characterization of an agglomeration-cementing agent for dust suppression in open pit coal mining. Cellulose 2018, 25, 4011–4029. [Google Scholar] [CrossRef]
  13. Sun, M.D.; Yu, B.S.; Hu, Q.H.; Chen, S.; Xia, W.; Ye, R.C. Nanoscale pore characteristics of the Lower Cambrian Niutitang Formation Shale: A case study from Well Yuke #1 in the Southeast of Chongqing, China. Int. J. Coal Geol. 2016, 154, 16–29. [Google Scholar]
  14. Jouini, M.S.; Bouchaala, F.; Riahi, M.K.; Sassi, M.; Abderrahmane, H.; Hjouj, F. Multifractal Analysis of Reservoir Rock Samples Using 3D X-Ray Micro Computed Tomography Images. IEEE Access 2022, 10, 67898–67909. [Google Scholar] [CrossRef]
  15. Li, X.C.; Kang, Y.L.; Haghighi, M. Investigation of pore size distributions of coals with different structures by nuclear magnetic resonance (NMR) and mercury intrusion porosimetry (MIP). Measurement 2018, 116, 122–128. [Google Scholar] [CrossRef]
  16. Li, P.P.; Zhang, X.D.; Zhang, S. Structures and fractal characteristics of pores in low volatile bituminous deformed coals by low-temperature N2 adsorption after different solvents treatments. Fuel 2018, 224, 661–675. [Google Scholar] [CrossRef]
  17. Wang, S. Analysis of rock pore structural characteristic by nuclear magnetic resonance. Xinjiang Pet. Geol. 2009, 30, 768–771. [Google Scholar]
  18. Zhao, Y.X.; Sun, Y.F.; Liu, S.M.; Wang, K.; Jiang, Y.D. Pore structure characterization of coal by NMR cryoporometry. Fuel 2017, 190, 359–369. [Google Scholar] [CrossRef]
  19. Wang, Z.Y.; Cheng, Y.P.; Zhang, K.Z.; Hao, C.M.; Wang, L.; Li, W.; Hu, B. Characteristics of microscopic pore structure and fractal dimension of bituminous coal by cyclic gas adsorption/desorption: An experimental study. Fuel 2018, 32, 495–505. [Google Scholar] [CrossRef]
  20. Lin, H.Y.; Tian, S.X.; Jiao, A.J.; Cao, Z.Y.; Song, K.; Zou, Y.H. Pore Characteristics and Fractal Dimension Analysis of Tectonic Coal and Primary-Structure Coal: A Case Study of Sanjia Coal Mine in Northern Guizhou. ACS Omega 2022, 7, 27300–27311. [Google Scholar] [CrossRef]
  21. Bale, H.D.; Schmidt, P.W. Small-Angle X-ray-Scattering Investigation of Submicroscopic Porosity with Fractal Properties. Phys. Rev. Lett. 1984, 53, 596–599. [Google Scholar] [CrossRef]
  22. Han, W.B.; Zhou, G.; Gao, D.H.; Zhang, Z.X.; Wei, Z.Y.; Wang, H.T.; Yang, H.Q. Experimental analysis of the pore structure and fractal characteristics of different metamorphic coal based on mercury intrusion nitrogen adsorption porosimetry. Powder Technol. 2020, 362, 386–398. [Google Scholar] [CrossRef]
  23. Niu, Q.H.; Pan, J.N.; Jin, Y.; Wang, H.C.; Li, M.; Ji, Z.M.; Wang, K.; Wang, Z.Z. Fractal study of adsorption-pores in pulverized coals with various metamorphism degrees using N2 adsorption, X-ray scattering and image analysis methods. J. Pet. Sci. Eng. 2019, 176, 584–593. [Google Scholar] [CrossRef]
  24. Jiang, W.; Zhou, Y.; Wu, C.F.; Du, M.Y. Fractal characteristics and theirs influence on methane adsorption in high-rank coals with NMR. Front. Earth Sci. 2022, 10, 1047557. [Google Scholar] [CrossRef]
  25. Li, Z.Q.; Shen, X.; Qi, Z.Y.; Hu, R.L. Study on the pore structure and fractal characteristics of marine and continental shale based on mercury porosimetry, N2 adsorption and NMR methods. J. Nat. Gas. Sci. Eng. 2018, 53, 12–21. [Google Scholar] [CrossRef]
  26. Naveen, P.; Asif, M.; Ojha, K. Integrated fractal description of nanopore structure and its effect on CH4 adsorption on Jharia coals, India. Fuel 2018, 232, 190–204. [Google Scholar] [CrossRef]
  27. Zhu, J.F.; Liu, J.Z.; Yang, Y.M.; Cheng, J.; Zhou, J.H.; Cen, K.F. Fractal characteristics of pore structures in 13 coal specimens: Relationship among fractal dimension, pore structure parameter, and slurry ability of coal. Fuel Process. Technol. 2016, 149, 256–267. [Google Scholar] [CrossRef]
  28. Zhang, S.H.; Tang, S.H.; Tang, D.Z.; Huang, W.H.; Pan, Z.J. Determining fractal dimensions of coal pores by FHH model: Problems and effects. J. Pet. Sci. Eng. 2014, 21, 929–939. [Google Scholar] [CrossRef]
  29. Yan, M.; Luo, H.X.; Yang, T.; Yan, D.J.; Wei, J.N.; Lin, H.F.; Li, S.G. Experimental Study on Fractal Characteristics of Surface Roughness of Briquettes and their Effect on Wettability of Coal Samples. Nat. Resour. Res. 2023, 32, 1235–1249. [Google Scholar] [CrossRef]
  30. Ni, G.H.; Li, S.; Rahman, S.; Xun, M.; Wang, H.; Xu, Y.H.; Xie, H.C. Effect of nitric acid on the pore structure and fractal characteristics of coal based on the low-temperature nitrogen adsorption method. Powder Technol. 2020, 367, 506–516. [Google Scholar] [CrossRef]
  31. Wen, Z.H.; Jia, B.T.; Wang, J.W.; Ren, J.G.; Wang, Q. Dendric Fractal Characteristics of Pores in Anthracite and Their Influences on Gas Adsorption Characteristics. Geofluids 2022, 2022, 1465777. [Google Scholar] [CrossRef]
  32. Zhou, Q.; Qin, B.T.; Wang, J.; Wang, H.T.; Wang, F. Experimental investigation on the changes of the wettability and surface characteristics of coal dust with different fractal dimensions. Colloids Surf. A Physicochem. Eng. Asp. 2018, 551, 148–157. [Google Scholar] [CrossRef]
  33. Hodot, B.B. Coal and Gas Protrusion; Song, S.Z.; Wang, Y.A., Translators; China Industry Press: Beijing, China, 1966; pp. 27–30. [Google Scholar]
  34. Sing, K.S.W.; Everett, D.H.; Haul, R.A.W.; Moscou, L.; Pierotti, R.A.; Rouquerol, J.; Siemieniewska, T. Reporting physisorption data for gas/solid systems with special reference to the determination of surface area and porosity (Recommendations 1984). Pure Appl. Chem. 1985, 57, 603–619. [Google Scholar] [CrossRef]
  35. Dubinin, M.M. The potential theory of adsorption of gases and vapors for adsorbents with energetically nonuniform surfaces. Chem. Rev. 1960, 60, 235–241. [Google Scholar] [CrossRef]
  36. Gan, H.; Nandi, S.P.; Walker, P.L. Nature of porosities in the American coals. Fuel 1972, 51, 272–277. [Google Scholar] [CrossRef]
  37. Thommes, M.; Kaneko, K.; Neimark, A.V.; Olivier, J.P.; Reinoso, F.R.; Rouquerol, J.; Sing, K.S.W. Physisorption of gases, with special reference to the evaluation of surface area and pore size distribution (IUPAC Technical Report). Pure Appl. Chem. 2015, 87, 1051–1069. [Google Scholar] [CrossRef]
  38. Liu, R.L.; Cheng, W.M.; Yu, Y.B.; Xu, Q.F.; Jiang, A.W.; Lv, T. An impacting factors analysis of miners’ unsafe acts based on HFACS-CM and SEM. Process. Saf. Environ. Prot. 2019, 122, 221–231. [Google Scholar] [CrossRef]
  39. Wang, Z.Y.; Cheng, Y.P.; Qi, Y.X.; Wang, R.P.; Wang, L.; Jiang, J.Y. Experimental study of pore structure and fractal characteristics of pulverized intact coal and tectonic coal by low temperature nitrogen adsorption. Powder Technol. 2019, 350, 15–25. [Google Scholar] [CrossRef]
  40. Lin, Y.B.; Qin, Y.; Ma, D.M.; Duan, Z.H. Pore structure, adsorptivity and influencing factors of high-volatile bituminous coal rich in inertinite. Fuel 2021, 293, 120418. [Google Scholar] [CrossRef]
  41. Hui, W.; Wang, Y.S.; Ren, D.Z.; Jin, H. Effects of pore structures on the movable fluid saturation in tight sandstones: A He8 formation example in Sulige Gasfield, Ordos Basin, China. J. Pet. Sci. Eng. 2020, 192, 107295. [Google Scholar] [CrossRef]
  42. Conner, W.C.; Lane, A.M.; Hoffman, A.J. Measurement of the morphology of high surface area solids: Hysteresis in mercury porosimetry. J. Colloid Interface Sci. 1984, 100, 185–193. [Google Scholar]
  43. Guo, H.J.; Yuan, L.; Cheng, Y.P.; Wang, K.; Xu, C. Experimental investigation on coal pore and fracture characteristics based on fractal theory. Powder Technol. 2019, 346, 341–349. [Google Scholar] [CrossRef]
  44. Chibowski, E.; Hołysz, L. On the use of Washburn’s equation for contact angle determination. J. Adhes. Sci. Technol. 1997, 11, 1289–1301. [Google Scholar] [CrossRef]
  45. Friesen, W.I.; Mikula, R.J. Fractal dimensions of coal particles. J. Colloid Interf. Sci. 1987, 120, 263–271. [Google Scholar] [CrossRef]
Figure 1. (a) Adsorption and desorption curves of different coal samples with liquid nitrogen of 3#; (b) Adsorption and desorption curves of different coal samples with liquid nitrogen of 5#.
Fractalfract 07 00439 g001
Figure 2. (a) Pore volume distribution characteristics of small pores and micropores of different coal samples of 3#; (b) Pore volume distribution characteristics of small pores and micropores of different coal samples of 5#.
Fractalfract 07 00439 g002
Figure 3. (a) Specific surface area distribution characteristics of small pores and micropores of different coal samples of 3#; (b) Specific surface area distribution characteristics of small pores and micropores of different coal samples of 5#.
Fractalfract 07 00439 g003
Figure 4. Relationship curve between fractal dimension of small pores and micropores and the specific surface.
Fractalfract 07 00439 g004
Figure 5. (a) Mercury inlet and outlet curves of different coal samples of 3#; (b) Mercury inlet and outlet curves of different coal samples of 5#.
Fractalfract 07 00439 g005
Figure 6. (a) Pore volume distribution characteristics of large pores and mesopores of different coal samples of 3#; (b) Pore volume distribution characteristics of large pores and mesopores of different coal samples of 5#.
Fractalfract 07 00439 g006
Figure 7. (a) Specific surface area distribution characteristics of large pores and mesopores of different coal samples of 3#; (b) Specific surface area distribution characteristics of large pores and mesopores of different coal samples of 5#.
Fractalfract 07 00439 g007
Figure 8. (a) Fractal dimension fitting of large pores and mesopores of 3#-1 coal sample; (b) Fractal dimension fitting of large pores and mesopores of 3#-2 coal sample; (c) Fractal dimension fitting of large pores and mesopores of 3#-3 coal sample; (d) Fractal dimension fitting of large pores and mesopores of 3#-4 coal sample.
Fractalfract 07 00439 g008
Figure 9. (a) Fractal dimension fitting of large pores and mesopores of 5#-1 coal sample; (b) Fractal dimension fitting of large pores and mesopores of 5#-2 coal sample; (c) Fractal dimension fitting of large pores and mesopores of 5#-3 coal sample; (d) Fractal dimension fitting of large pores and mesopores of 5#-4 coal sample.
Fractalfract 07 00439 g009
Figure 10. Relationship curve between fractal dimension of large pores and mesopores and specific surface.
Fractalfract 07 00439 g010
Figure 11. Total pore space in the yz direction view of the study area of 3#-2 coal sample.
Fractalfract 07 00439 g011
Figure 12. Total pore space of pores below 30 μm in the xz-directional view in the study area of 3#-2 coal sample.
Fractalfract 07 00439 g012
Figure 13. Ball and stick model of 3#-2 coal sample joint hole in the yz directional view.
Fractalfract 07 00439 g013
Figure 14. Histogram of the distribution of the number of pores in different pore size sections of coal samples.
Fractalfract 07 00439 g014
Figure 15. Relationship between fractal dimension and specific surface area after CT treatment.
Fractalfract 07 00439 g015
Table 1. Common coal pore size classification method.
Classification SchemeLarge Pores (nm)Mesopores
(nm)
Small Pores (nm)Micropores (nm)
B.B. Hodot (1961) [33]>1000100–100010–100<10
International Union of Pure and Applied Chemistry (IUPAC) [34]>50-2–50<2
Dubinin (1966) [35]>20-2–20<2
Gan et al. (1972) [36]>301.2–30-<1.2
Table 2. Small pores and micropore volumes of different coal samples.
Coal SamplePore Volume (mL/g)
Small Pores (10–100 nm)Micropores (<10 nm)
3#-18.905 × 10−32.374 × 10−2
3#-29.871 × 10−32.559 × 10−2
3#-31.416 × 10−22.959 × 10−2
3#-41.477 × 10−23.795 × 10−2
5#-11.494 × 10−23.677 × 10−2
5#-28.229 × 10−32.112 × 10−2
5#-35.869 × 10−31.219 × 10−2
5#-45.780 × 10−31.322 × 10−2
Table 3. Fractal dimension of small pores and micropores of different coal samples.
Coal SampleFractal DimensionBET Multipoint Specific
Surface Area (m2/g)
D11D12
3#-11.14892.621716.7758
3#-21.21362.625818.2541
3#-31.02572.626222.7340
3#-41.21442.634928.8033
5#-11.13942.632628.9357
5#-20.55492.606615.1786
5#-31.02702.57717.70090
5#-40.97202.59008.71280
Table 4. Percentage of specific surface area of large pores and mesopores of different coal samples.
Coal SampleSpecific Surface Area (m2/g)Porosity (%)
Total Pores
(<30,000 nm)
Large Pores
(1000–30,000 nm)
Mesopores
(100–1000 nm)
3#-112.867050730.0050971580.00311788314.7828
3#-215.064395530.0033072080.01429767410.8212
3#-313.631989280.0014430090.01368309310.7816
3#-415.307214090.0054803250.0363556718.0309
5#-117.007668470.0060376520.02164913312.7001
5#-212.850190950.0025897370.01075182114.5666
5#-314.364975380.0044818440.0101994721.7671
5#-417.799418840.0057710290.01100777113.7139
Table 5. Porosity of different coal samples under visualization.
Coal
Sample
PorosityIntensity Range for
Interactive Thresholds
Total PoresConnected PoresIsolated Pores
3#-10.699717640.6985730.0011450–20575
3#-20.744017480.7418610.0021570–8285
3#-30.808578250.8079410.0006380–8900
3#-40.304008810.3001620.0038470–9109
5#-10.844828000.8444600.0003690–8280
5#-20.500212190.4976180.0025940–5800
5#-30.622897000.6218120.0069620–9650
5#-40.588873210.5863560.0025180–7096
Table 6. Fractal dimension of different coal samples under visualization.
Coal SampleFractal DimensionSpecific Surface Area (m2/g)
3#-12.465801480.034228548
3#-22.317707780.024005108
3#-32.473543880.035068851
3#-42.571142440.080894694
5#-12.454748150.028446458
5#-22.589946270.083772153
5#-32.493238930.053474970
5#-42.54325390.063848071
Disclaimer/Publisher’s Note: The statements, opinions and data contained in all publications are solely those of the individual author(s) and contributor(s) and not of MDPI and/or the editor(s). MDPI and/or the editor(s) disclaim responsibility for any injury to people or property resulting from any ideas, methods, instructions or products referred to in the content.

