
Fractional Control of a Class of Underdamped Fractional Systems with Time Delay—Application to a Teleoperated Robot with a Flexible Link

Abstract
:1. Introduction
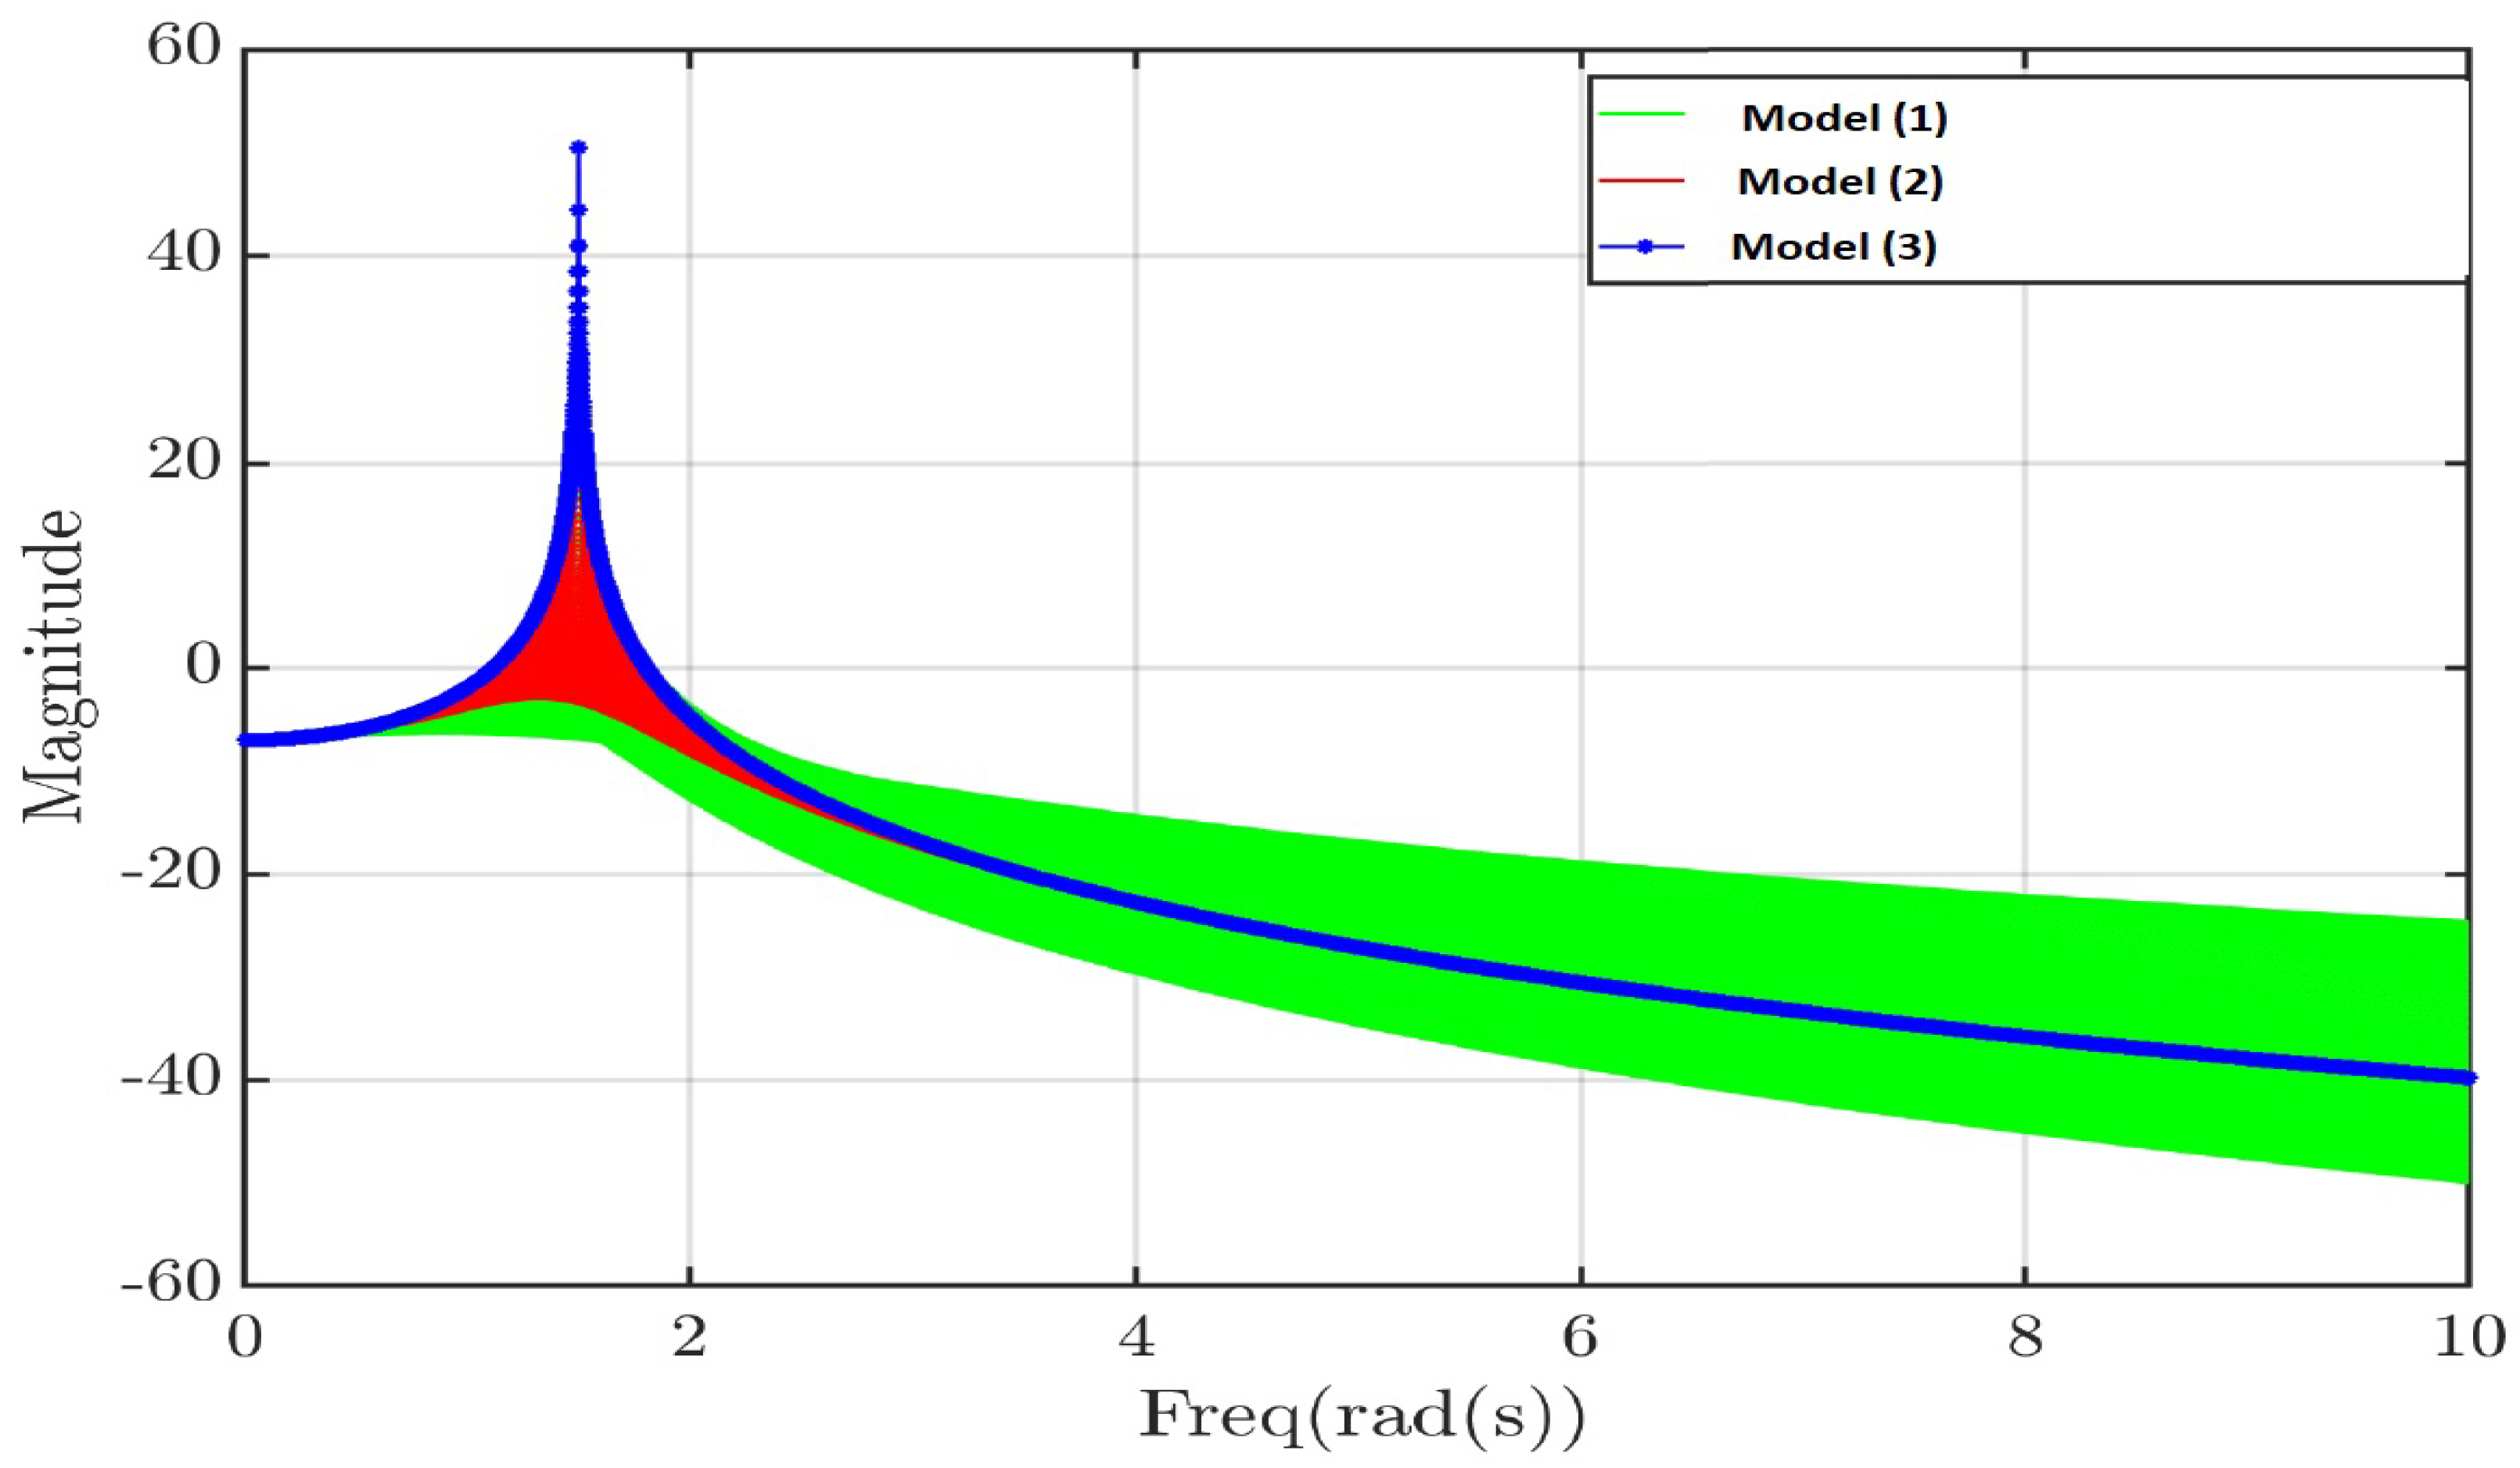
2. Frequency Domain Analysis
- is the static gain;
- = 1.64 (rad/s) is the fundamental frequency of vibration of the beam;
- is the damping coefficient;
- s is the time constant of the model (1), and is the order of the fractional order model;
- s is the time delay, which is unique for the three models.
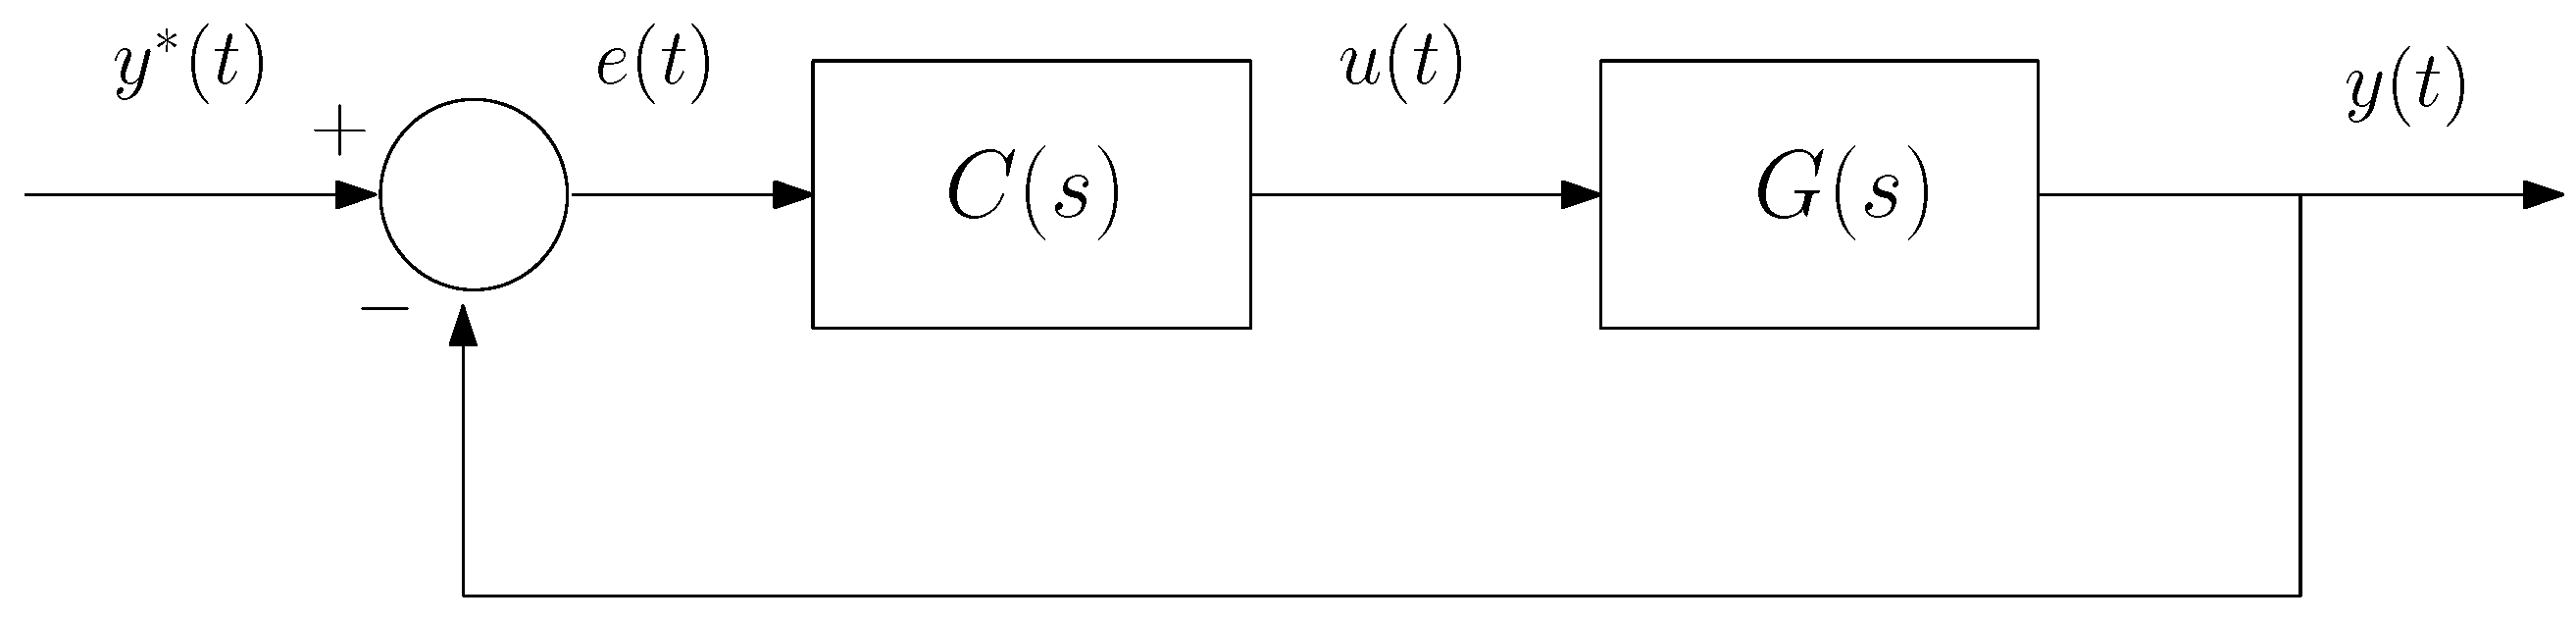
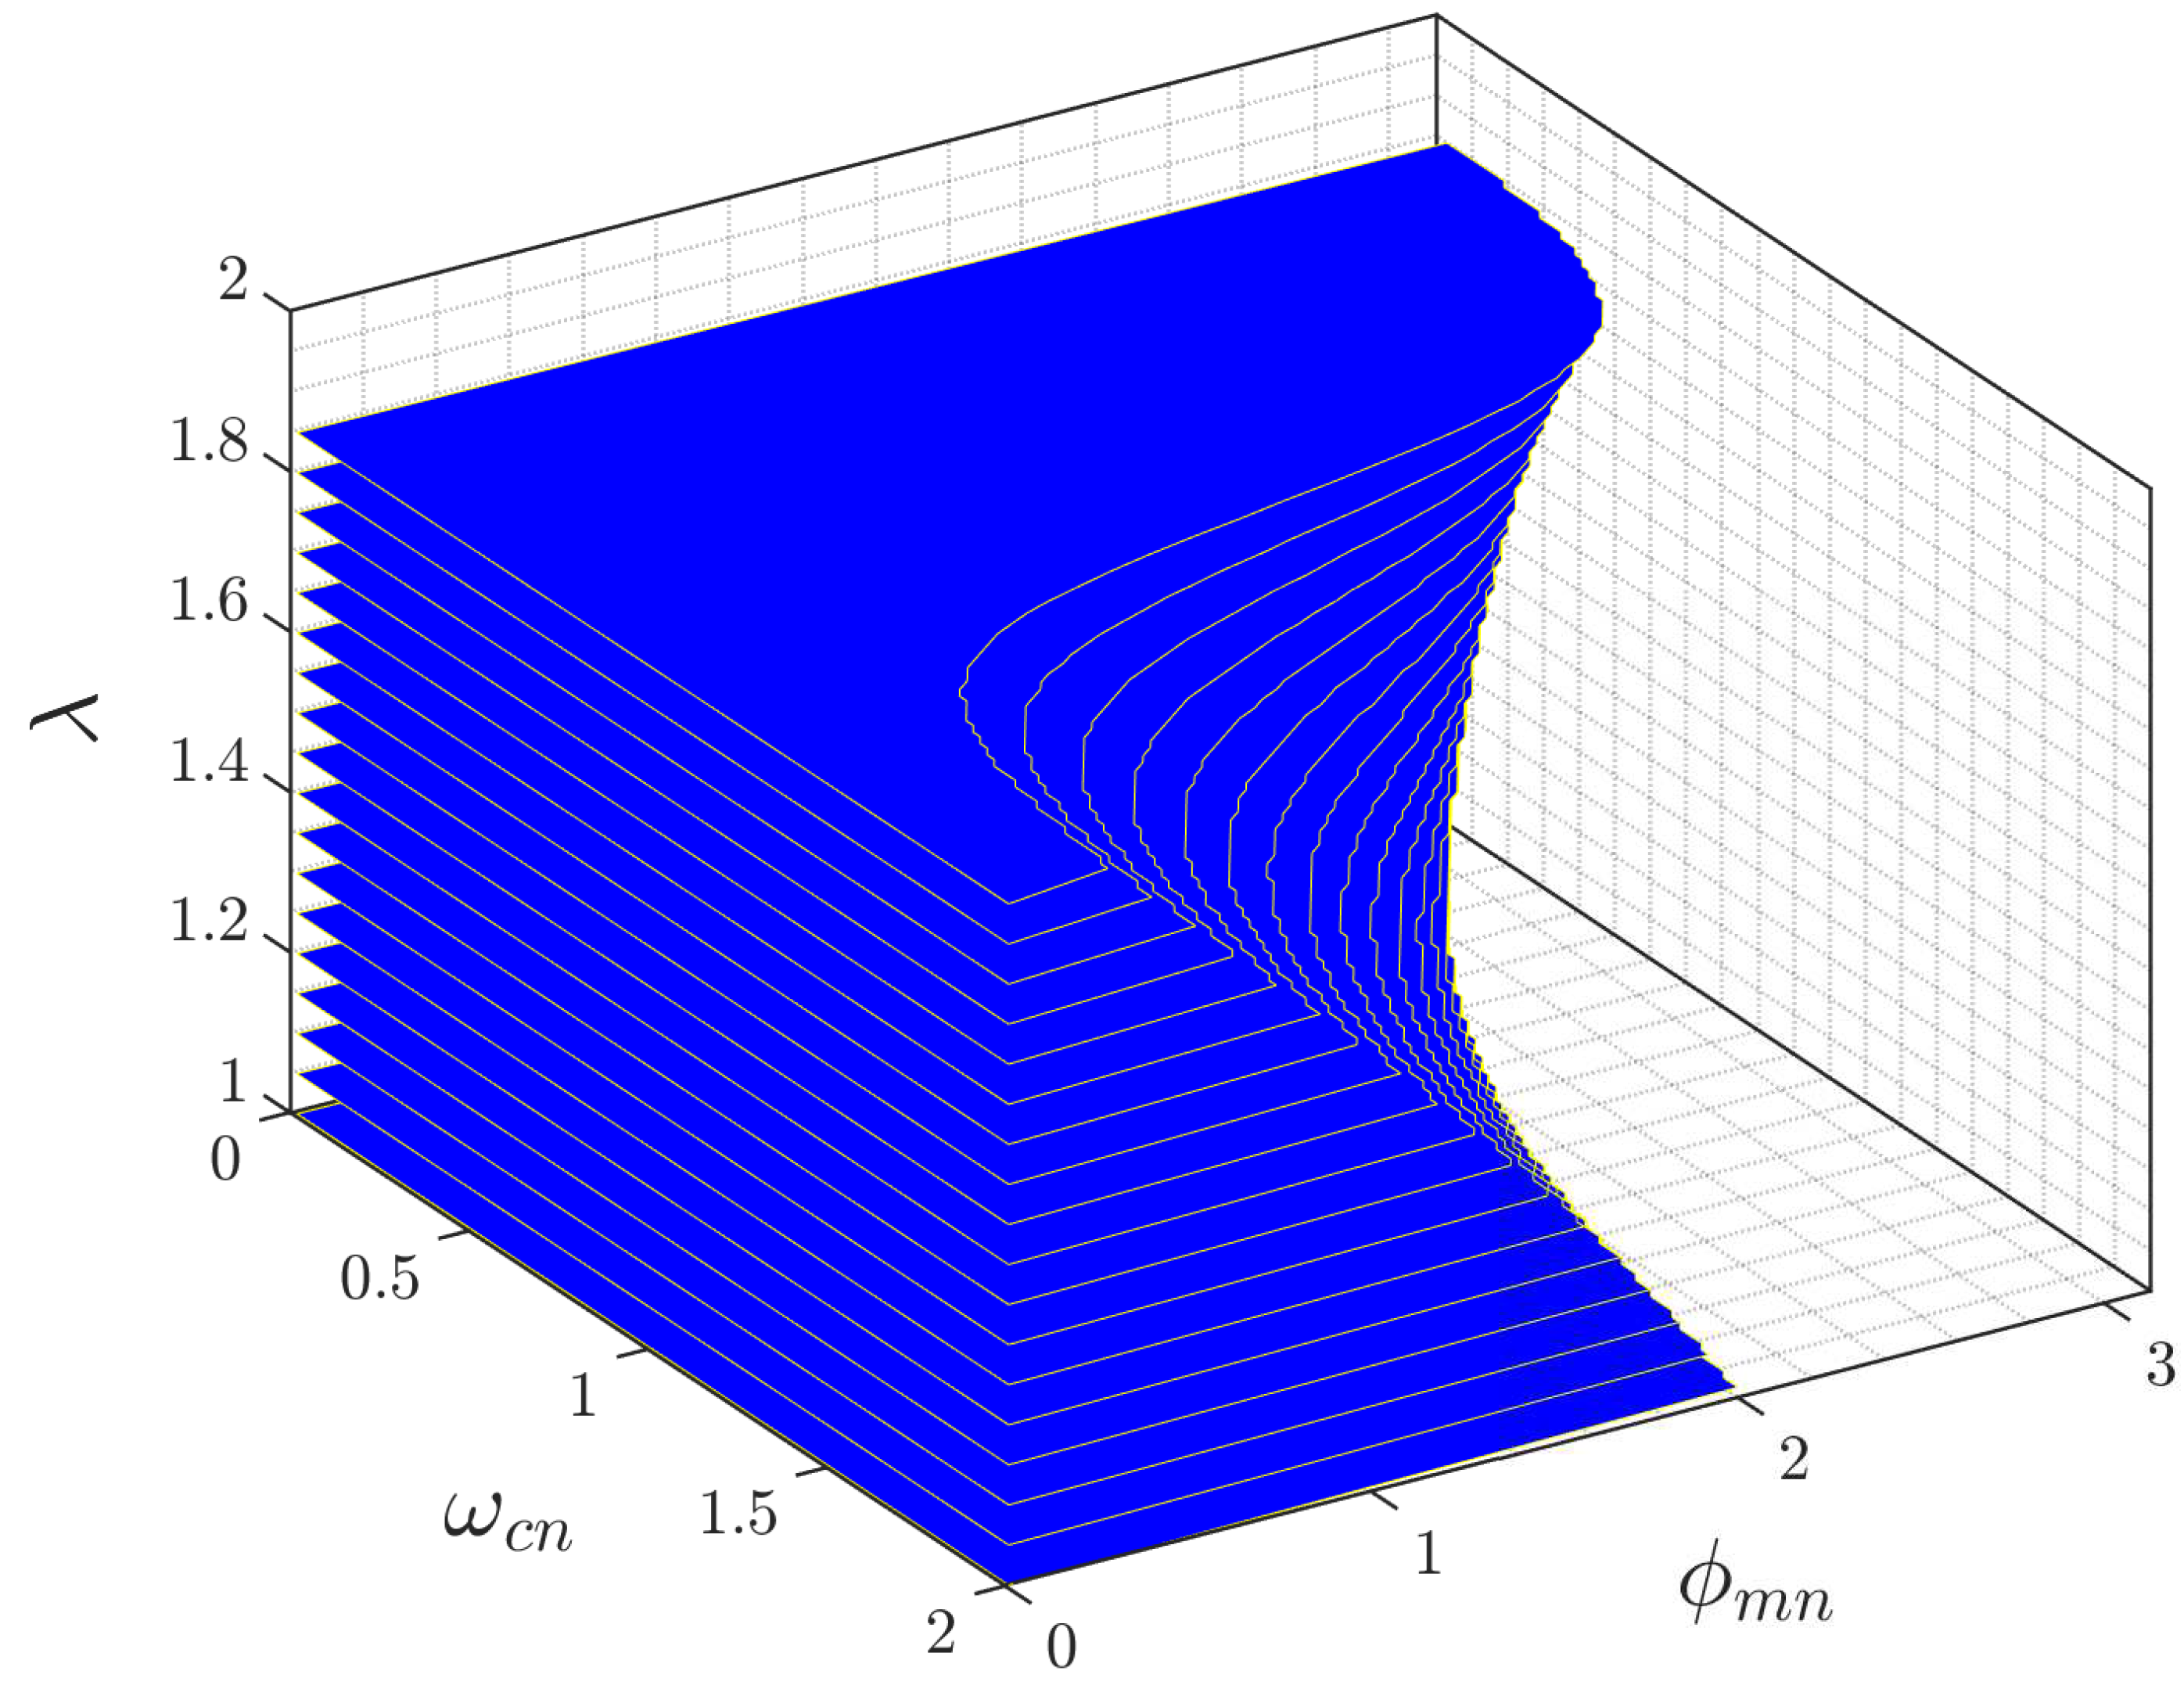
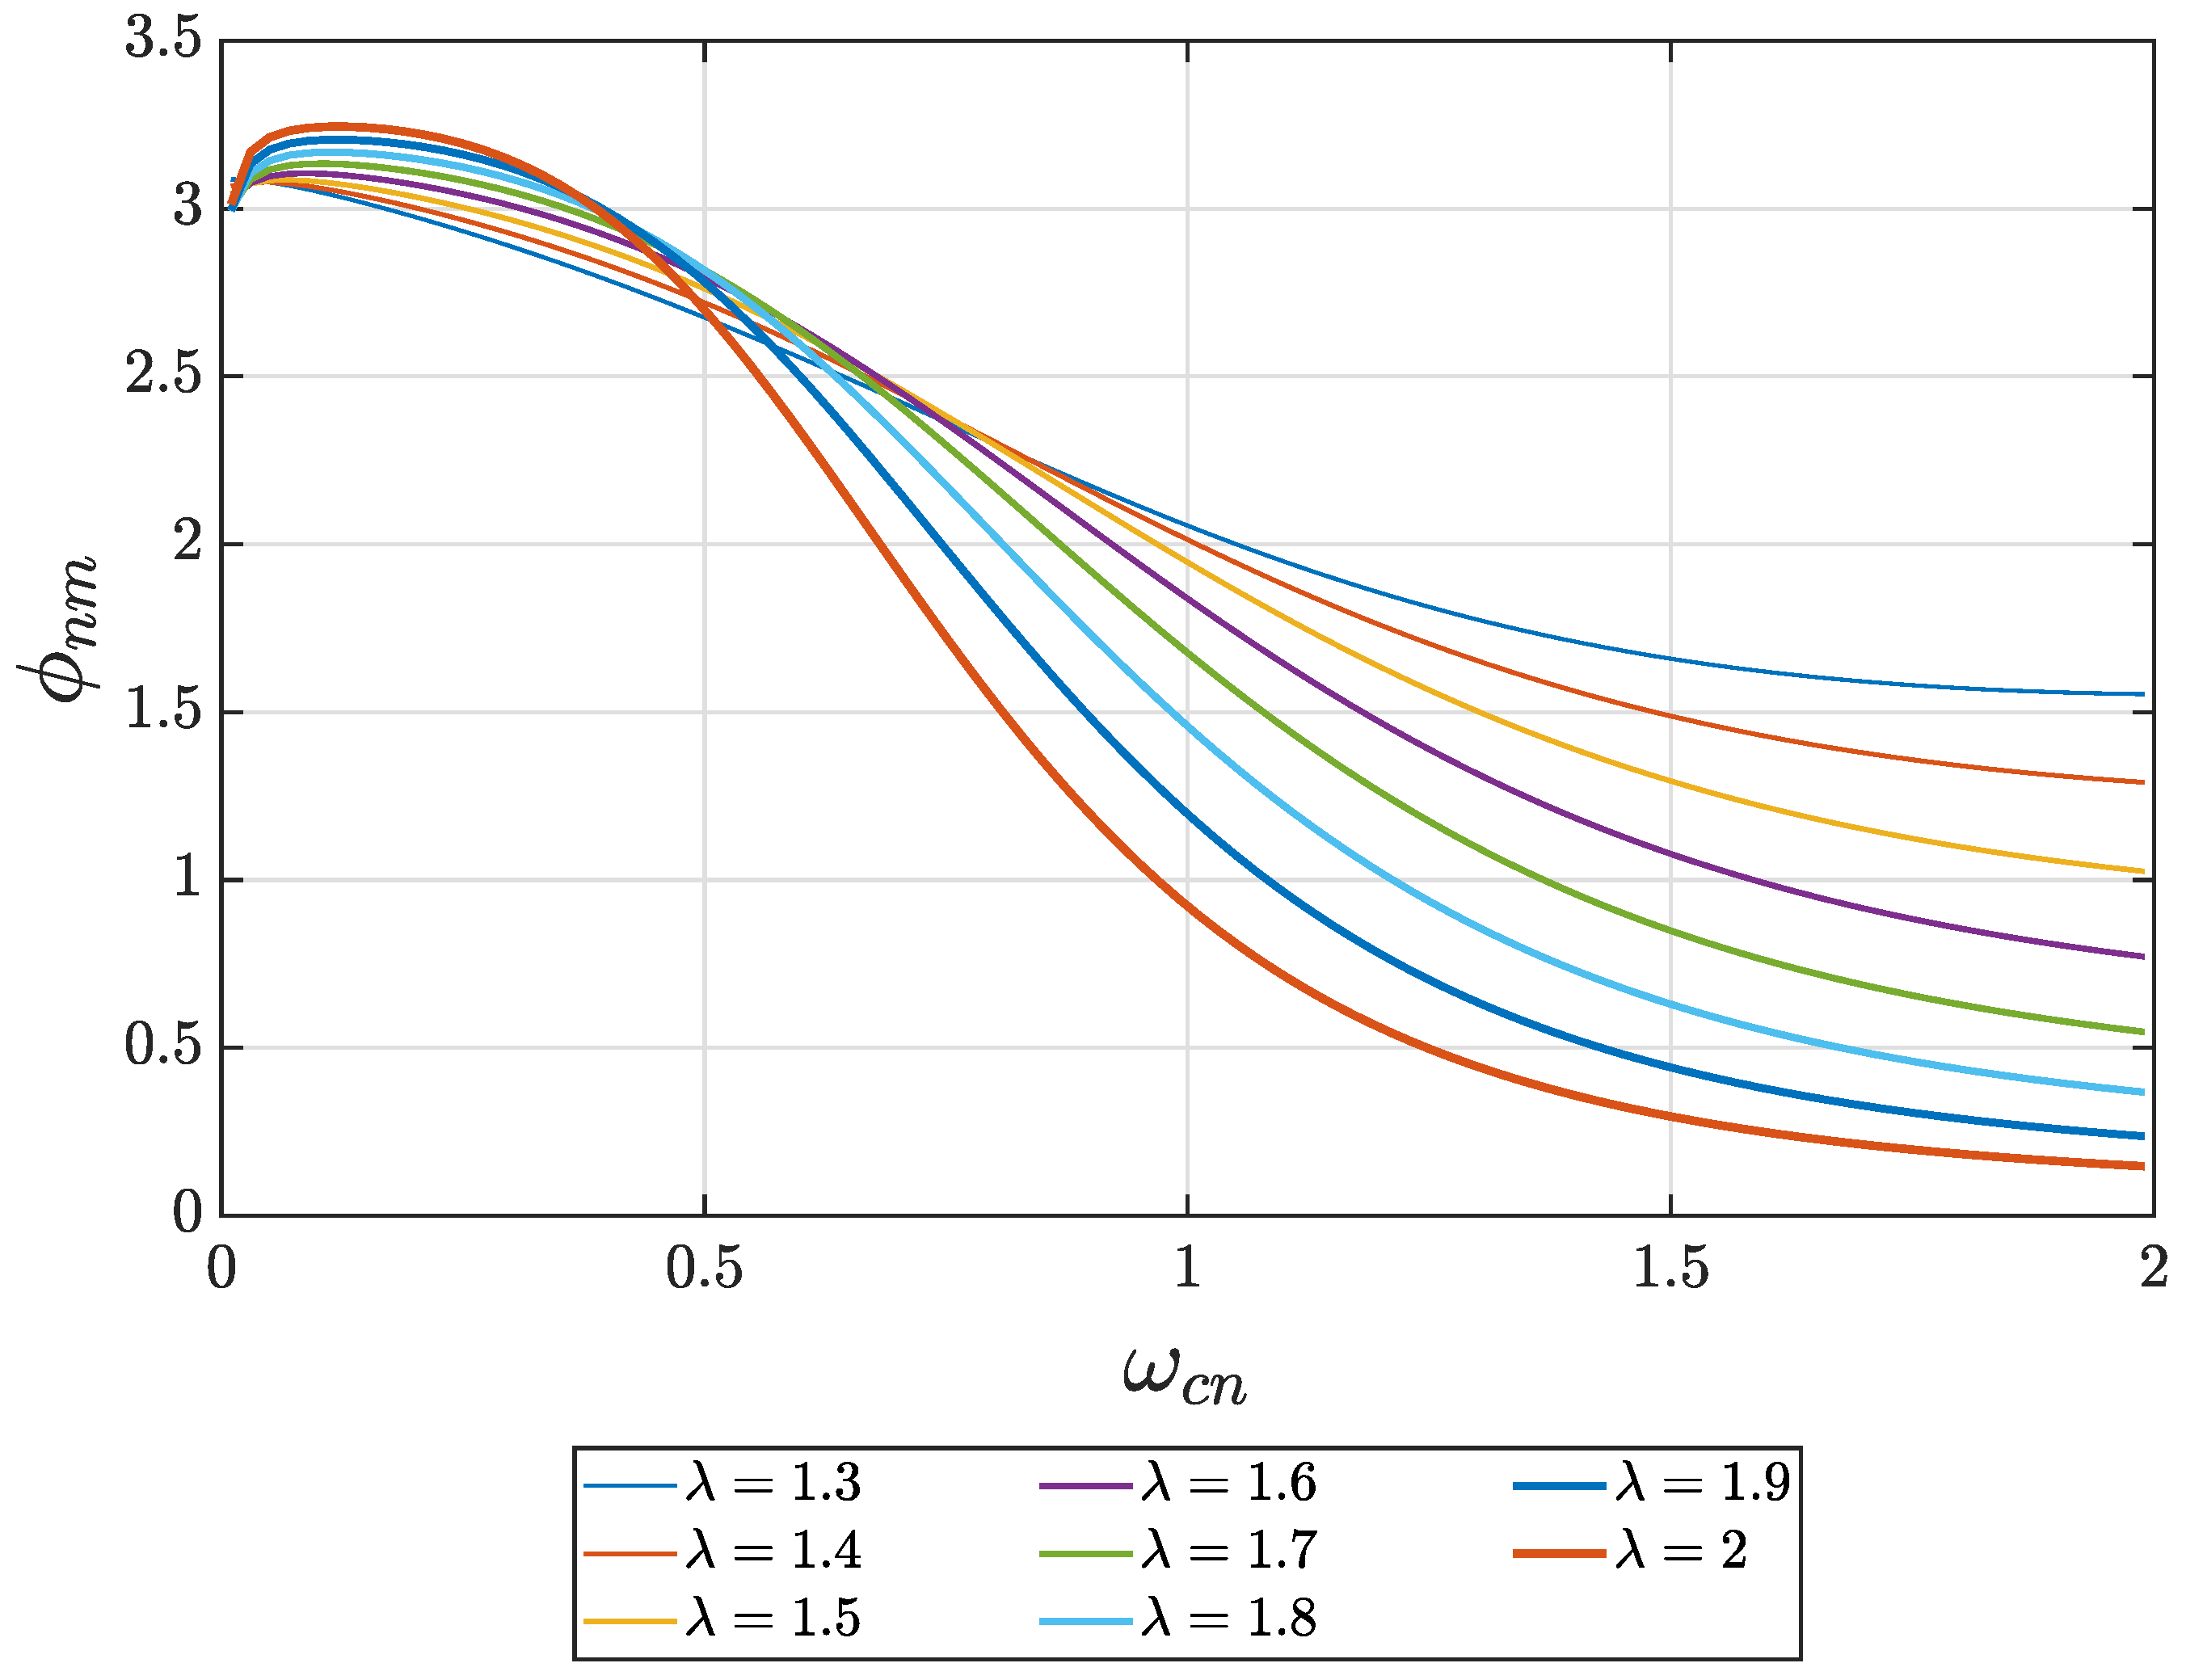
3. Region of Feasible Frequency Specifications: Controller
- (a):
- The controller must fulfill specifications with the process of (4).
- (b):
- The controller must fulfill specifications with the process :
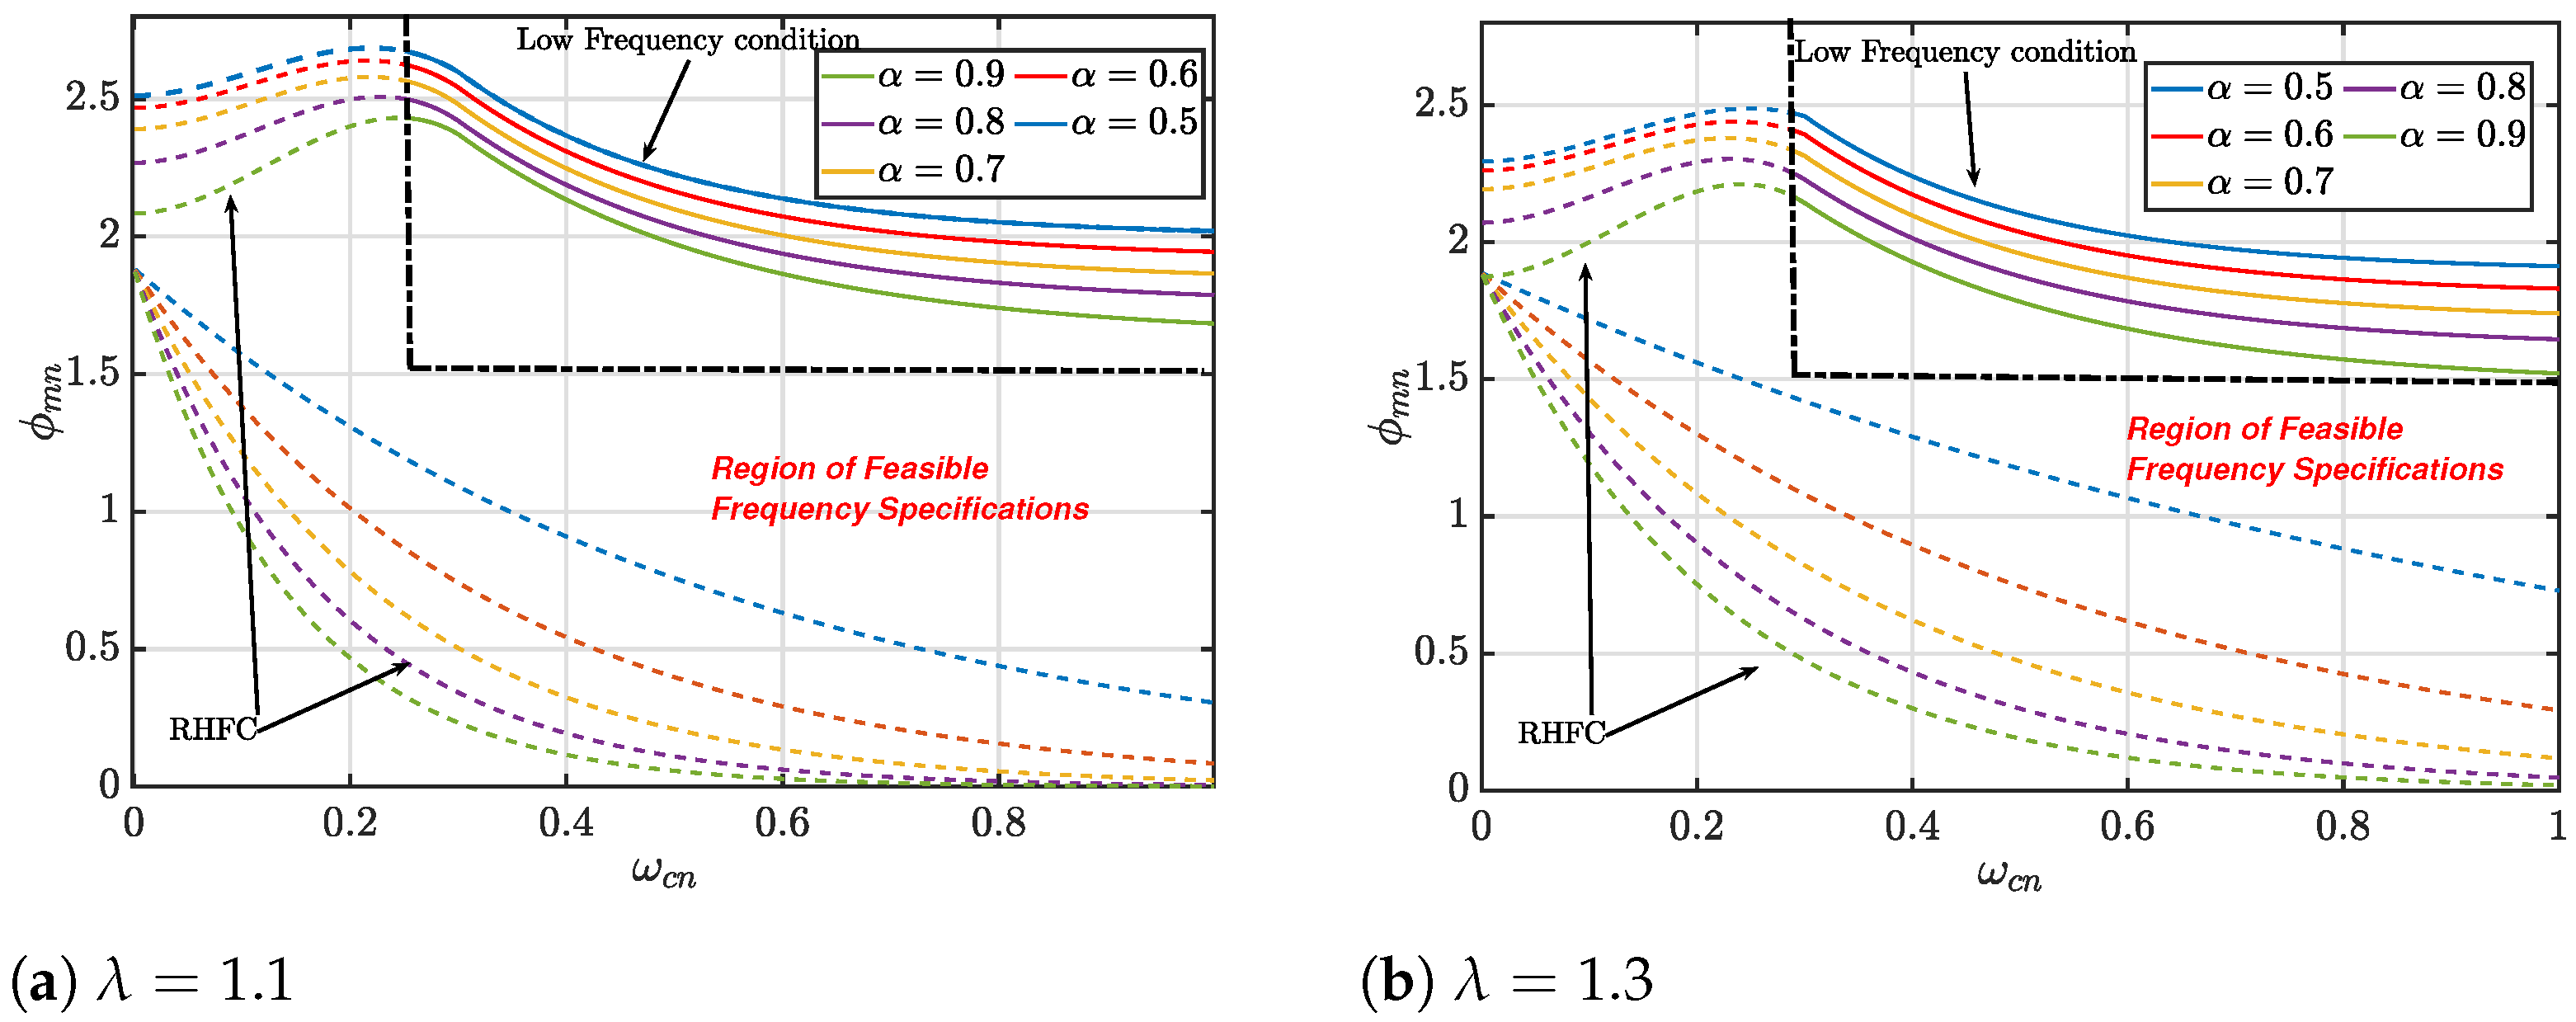
3.1. Low Frequency Condition
- 1.
- If , andwhere:
- 2.
- If , and ,
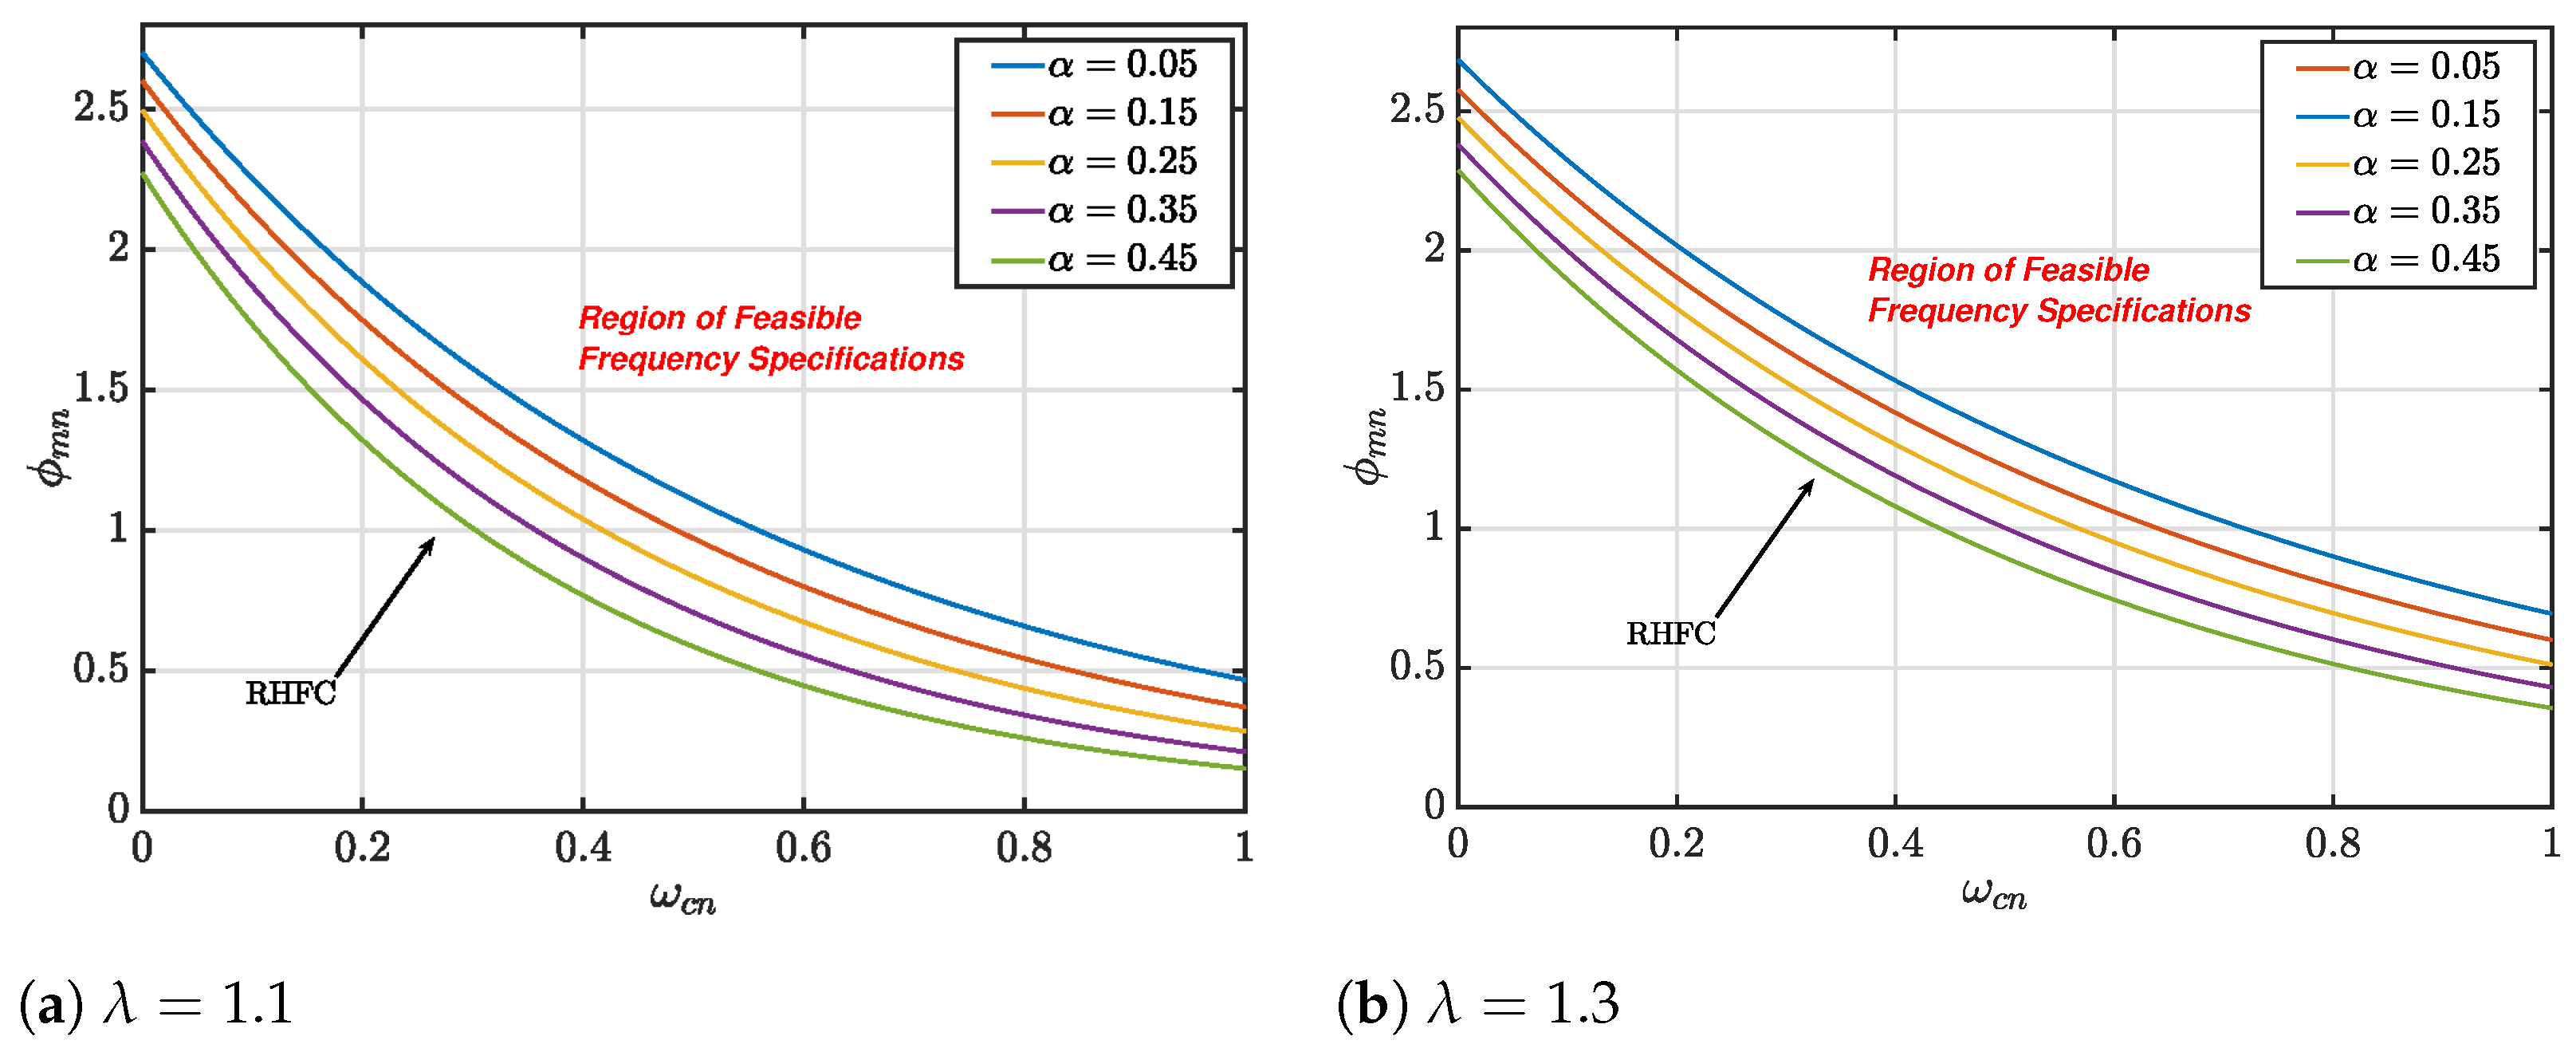
3.2. Robust High-Frequency Condition
3.2.1. Motivation
3.2.2. Analytical Global Model
- 1.
- If , andwhere:
- 2.
- If , and
- 3.
- If , andwhere:and
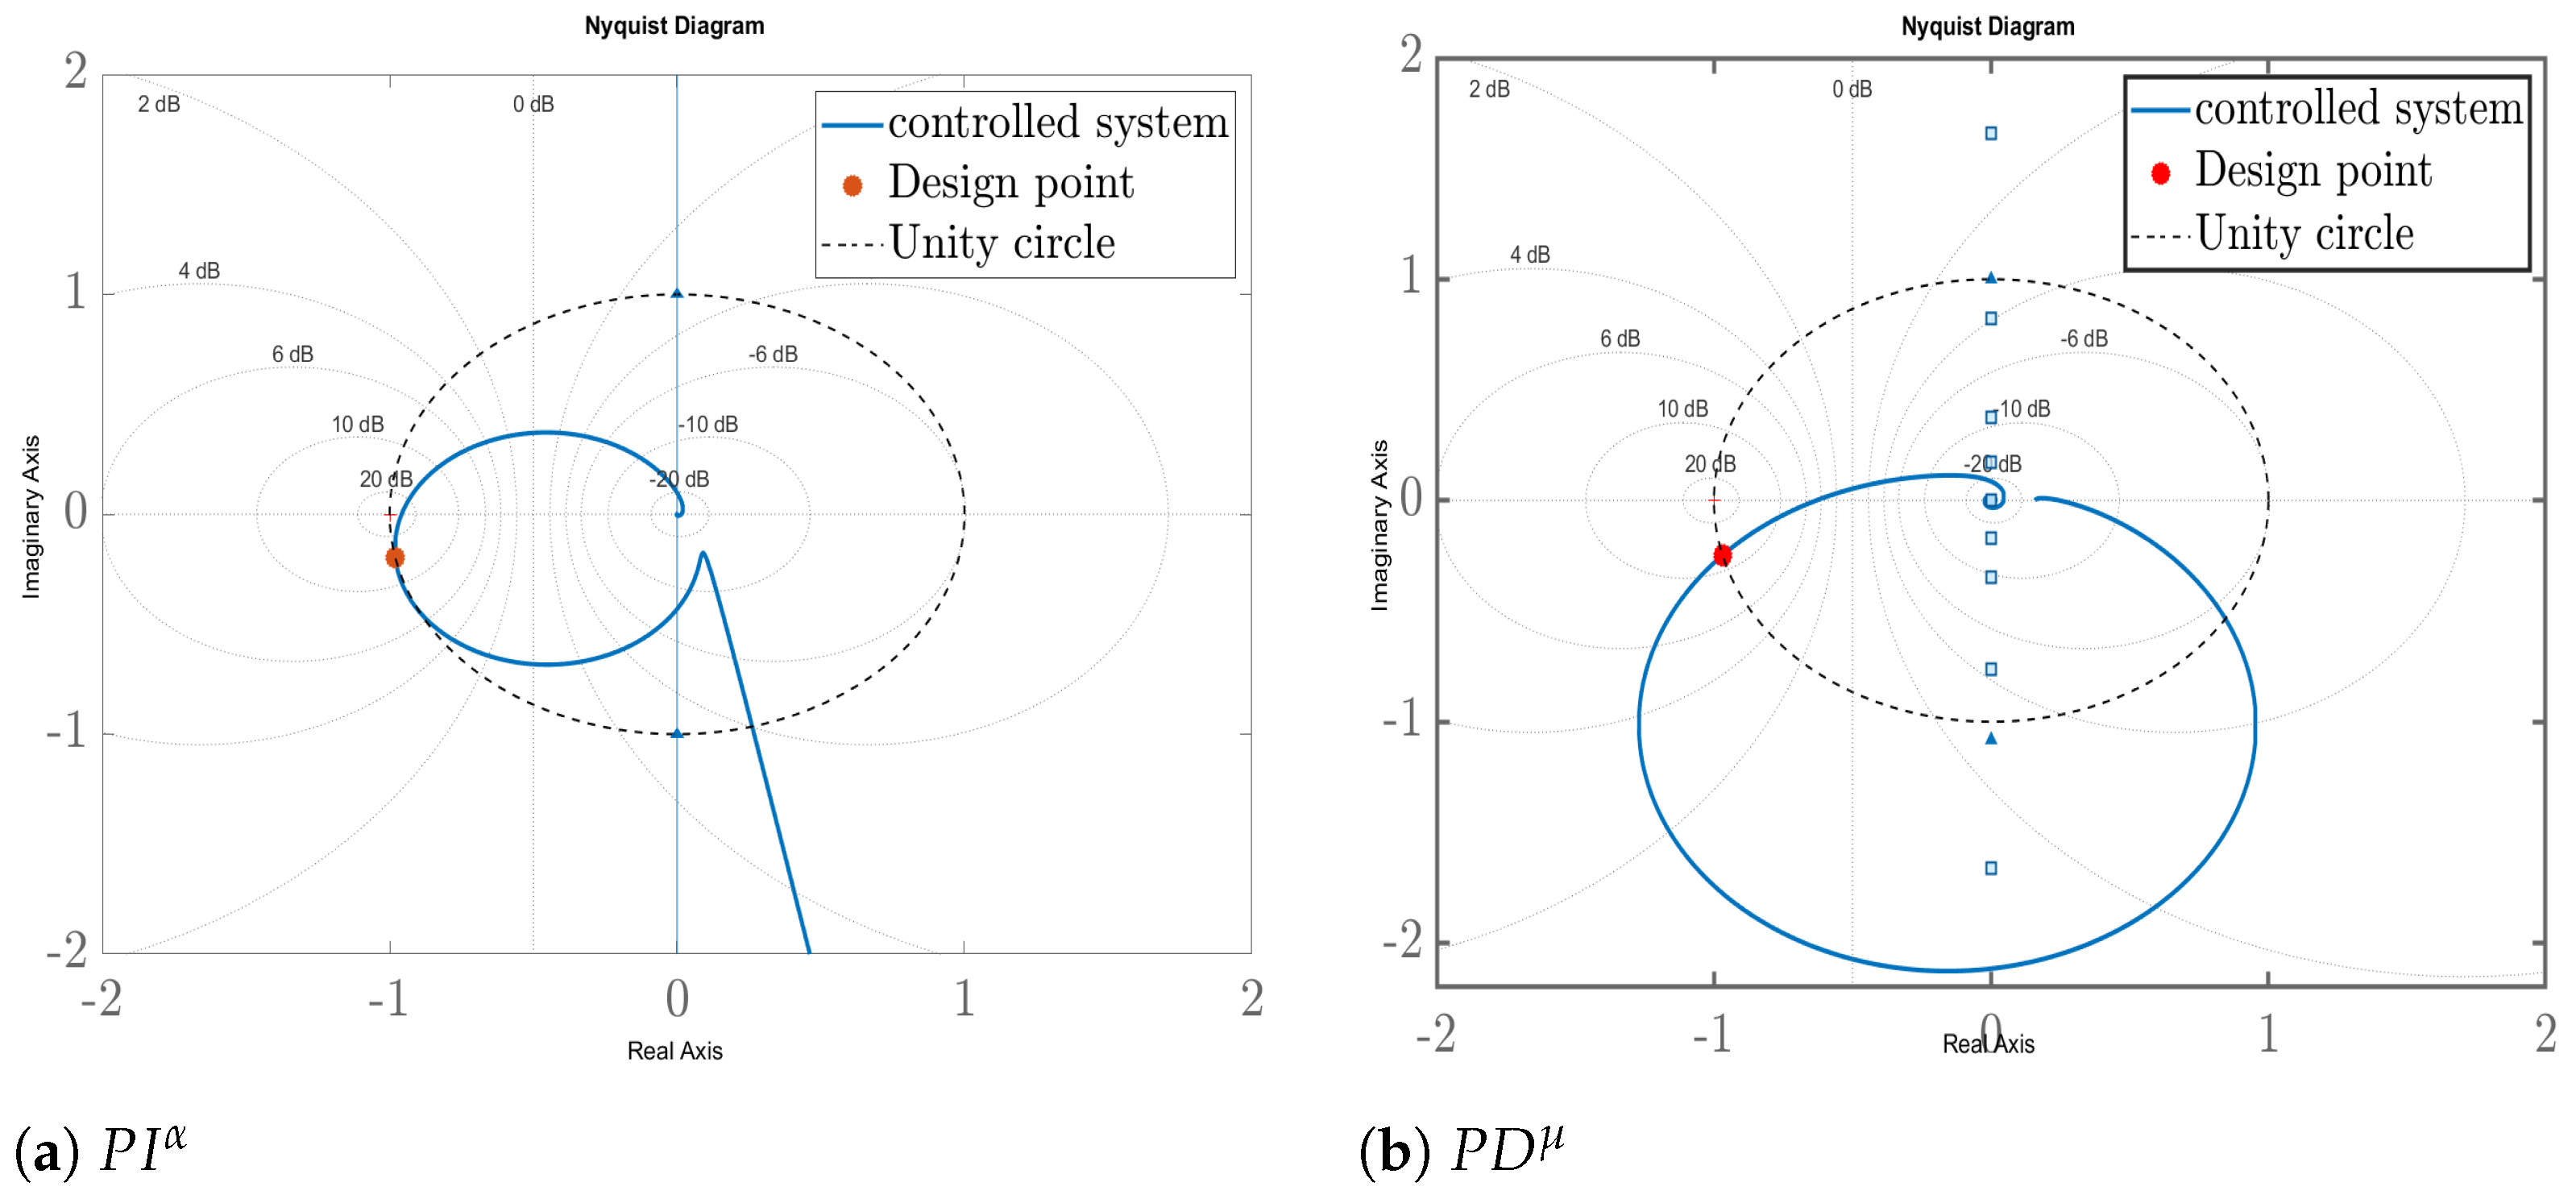
4. Fractional Order Controller
4.1. Robust High-Frequency Condition
4.2. Modified Controller
- It eliminates the steady-state error with the integral action.
- It presents two drawbacks: (a) very reduced regions for close to 2, which clearly limits the design operation, (b) the relative stability is reduced.
- The regions of feasible frequency specifications are very extended compared to the case of a .
- It increases relative stability.
- The main drawbacks are: (a) it increases the sensitivity to noise and (b) it cannot eliminate the steady-state error.
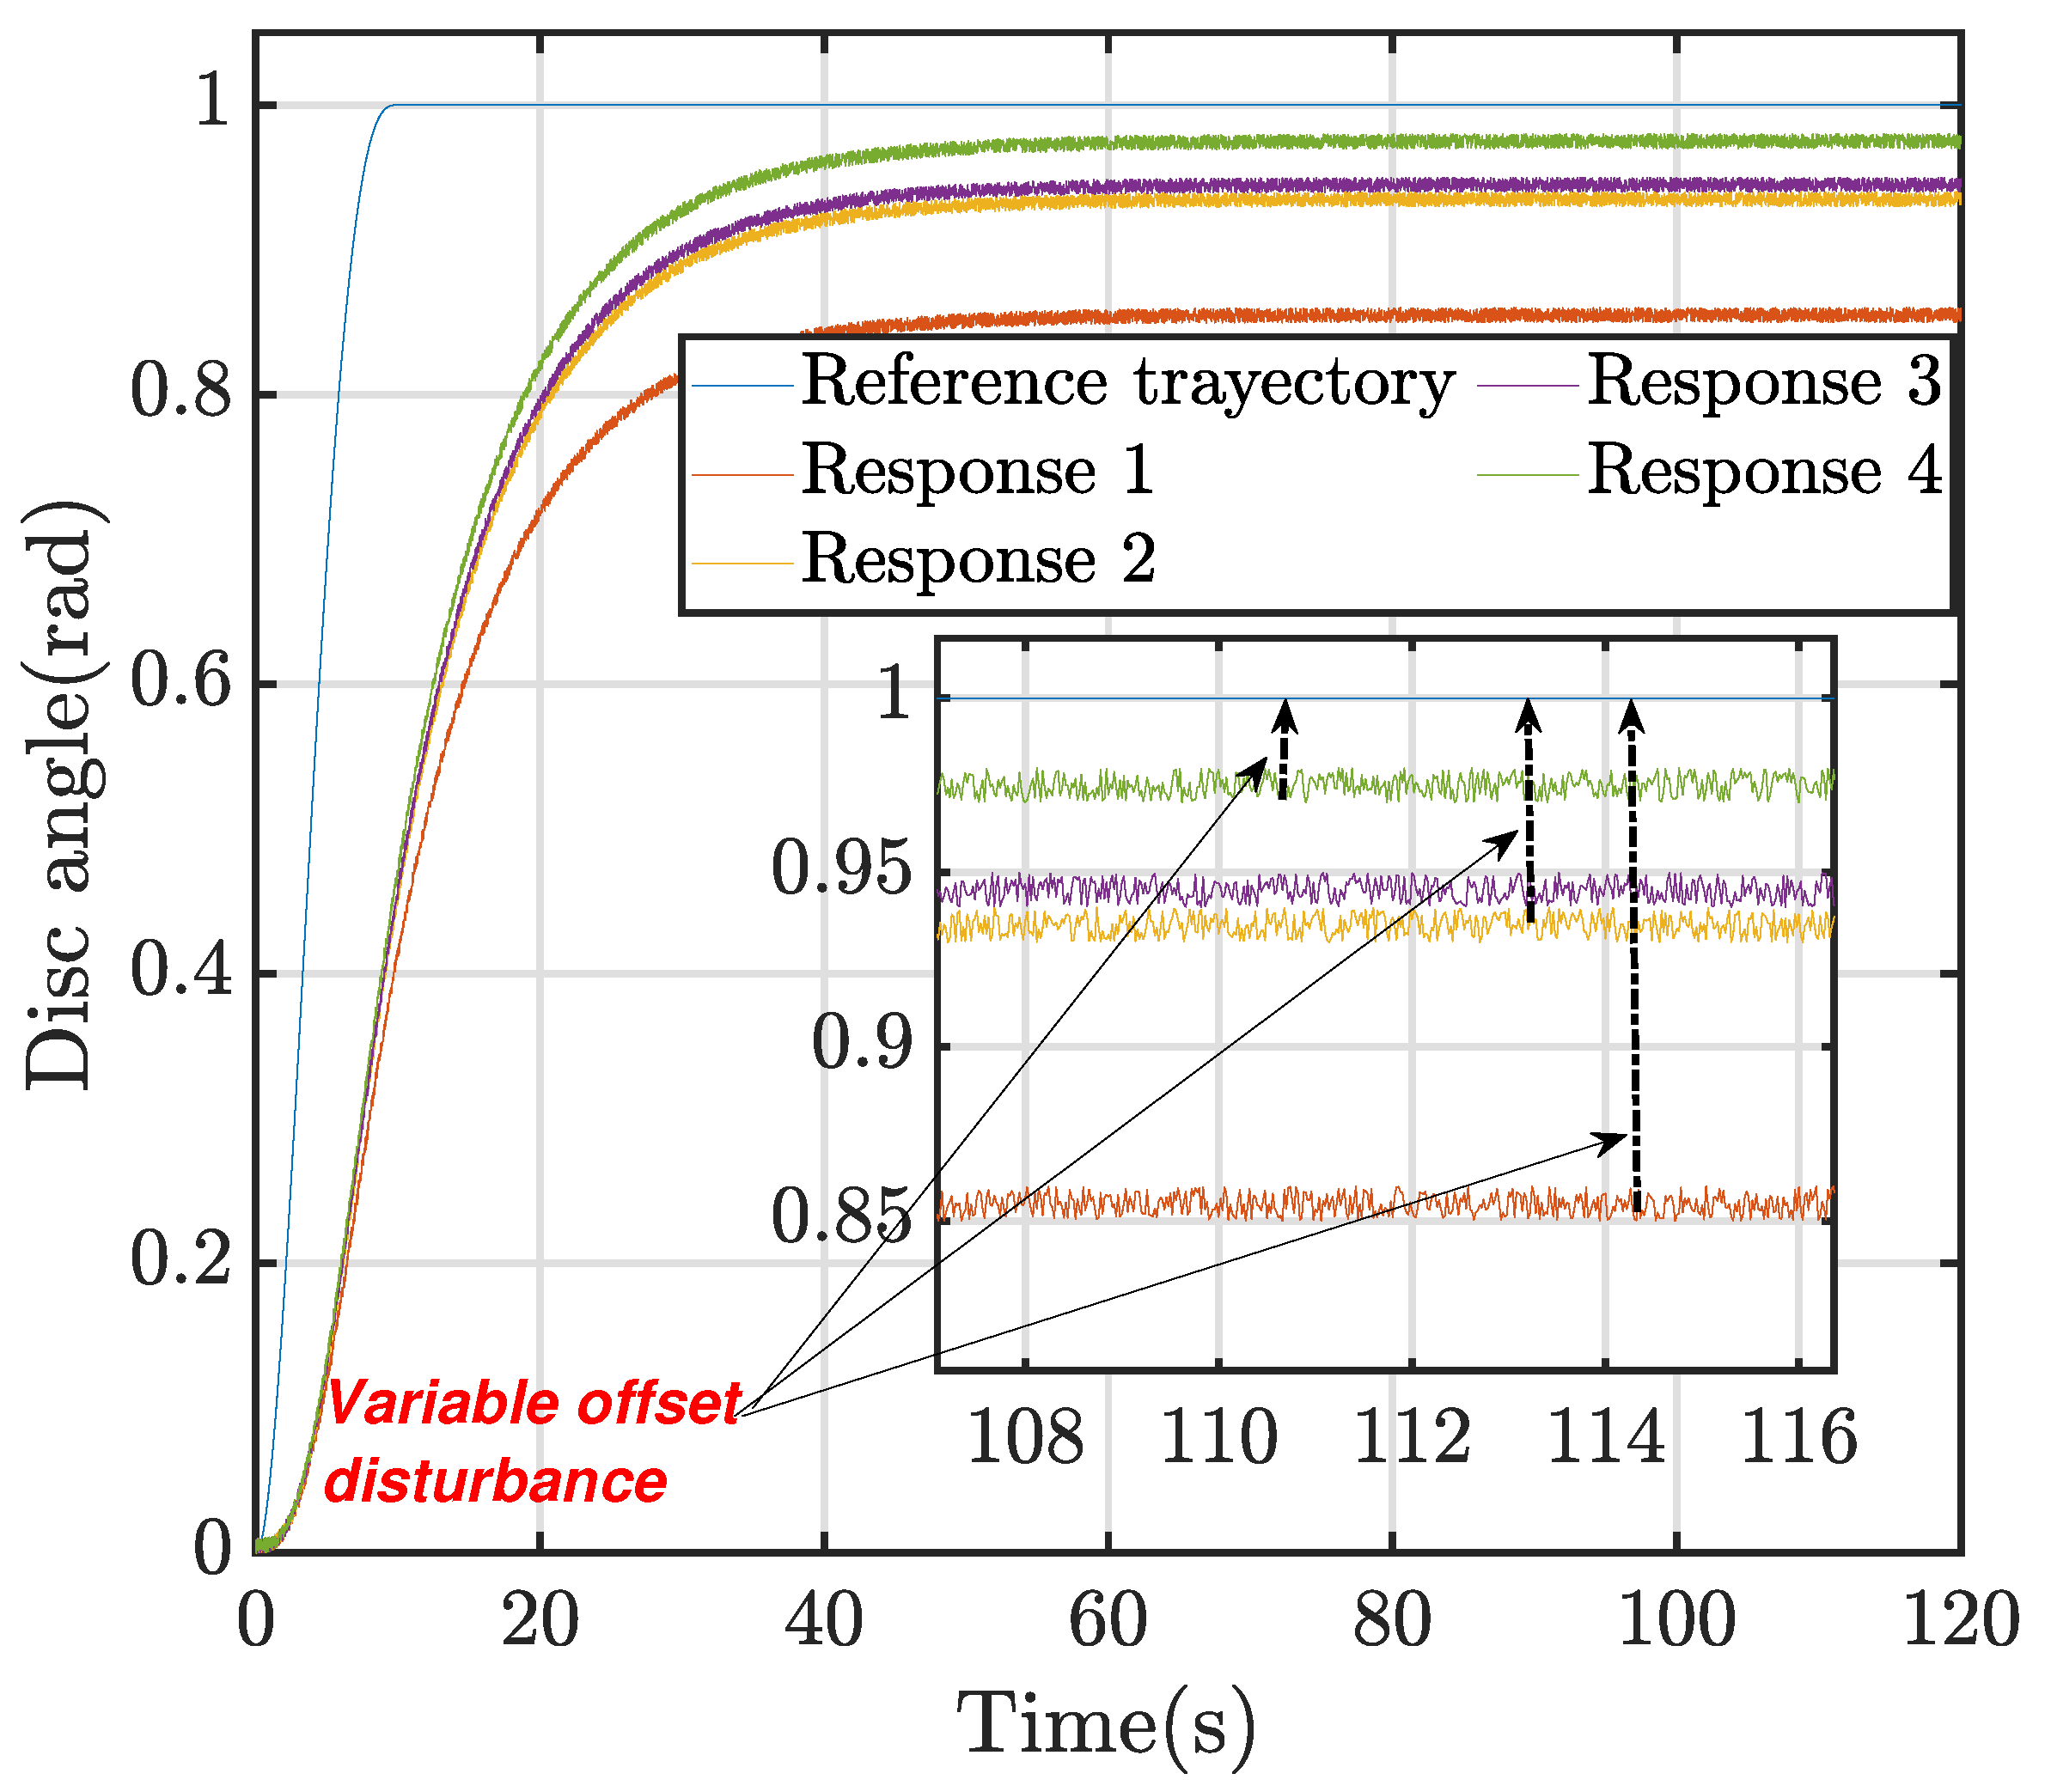
4.3. Disturbance Rejection Analysis
4.3.1. Case 1: Variable Step Disturbance at the Input of the Process
4.3.2. Case 2: Variable Step Disturbance at the Measurement of the Output of the Process
5. Application to the Control of Flexible Manipulator
5.1. Presentation of the Platform
5.2. The Dynamic Model
5.3. Control Design and Analysis of the Results
6. Conclusions
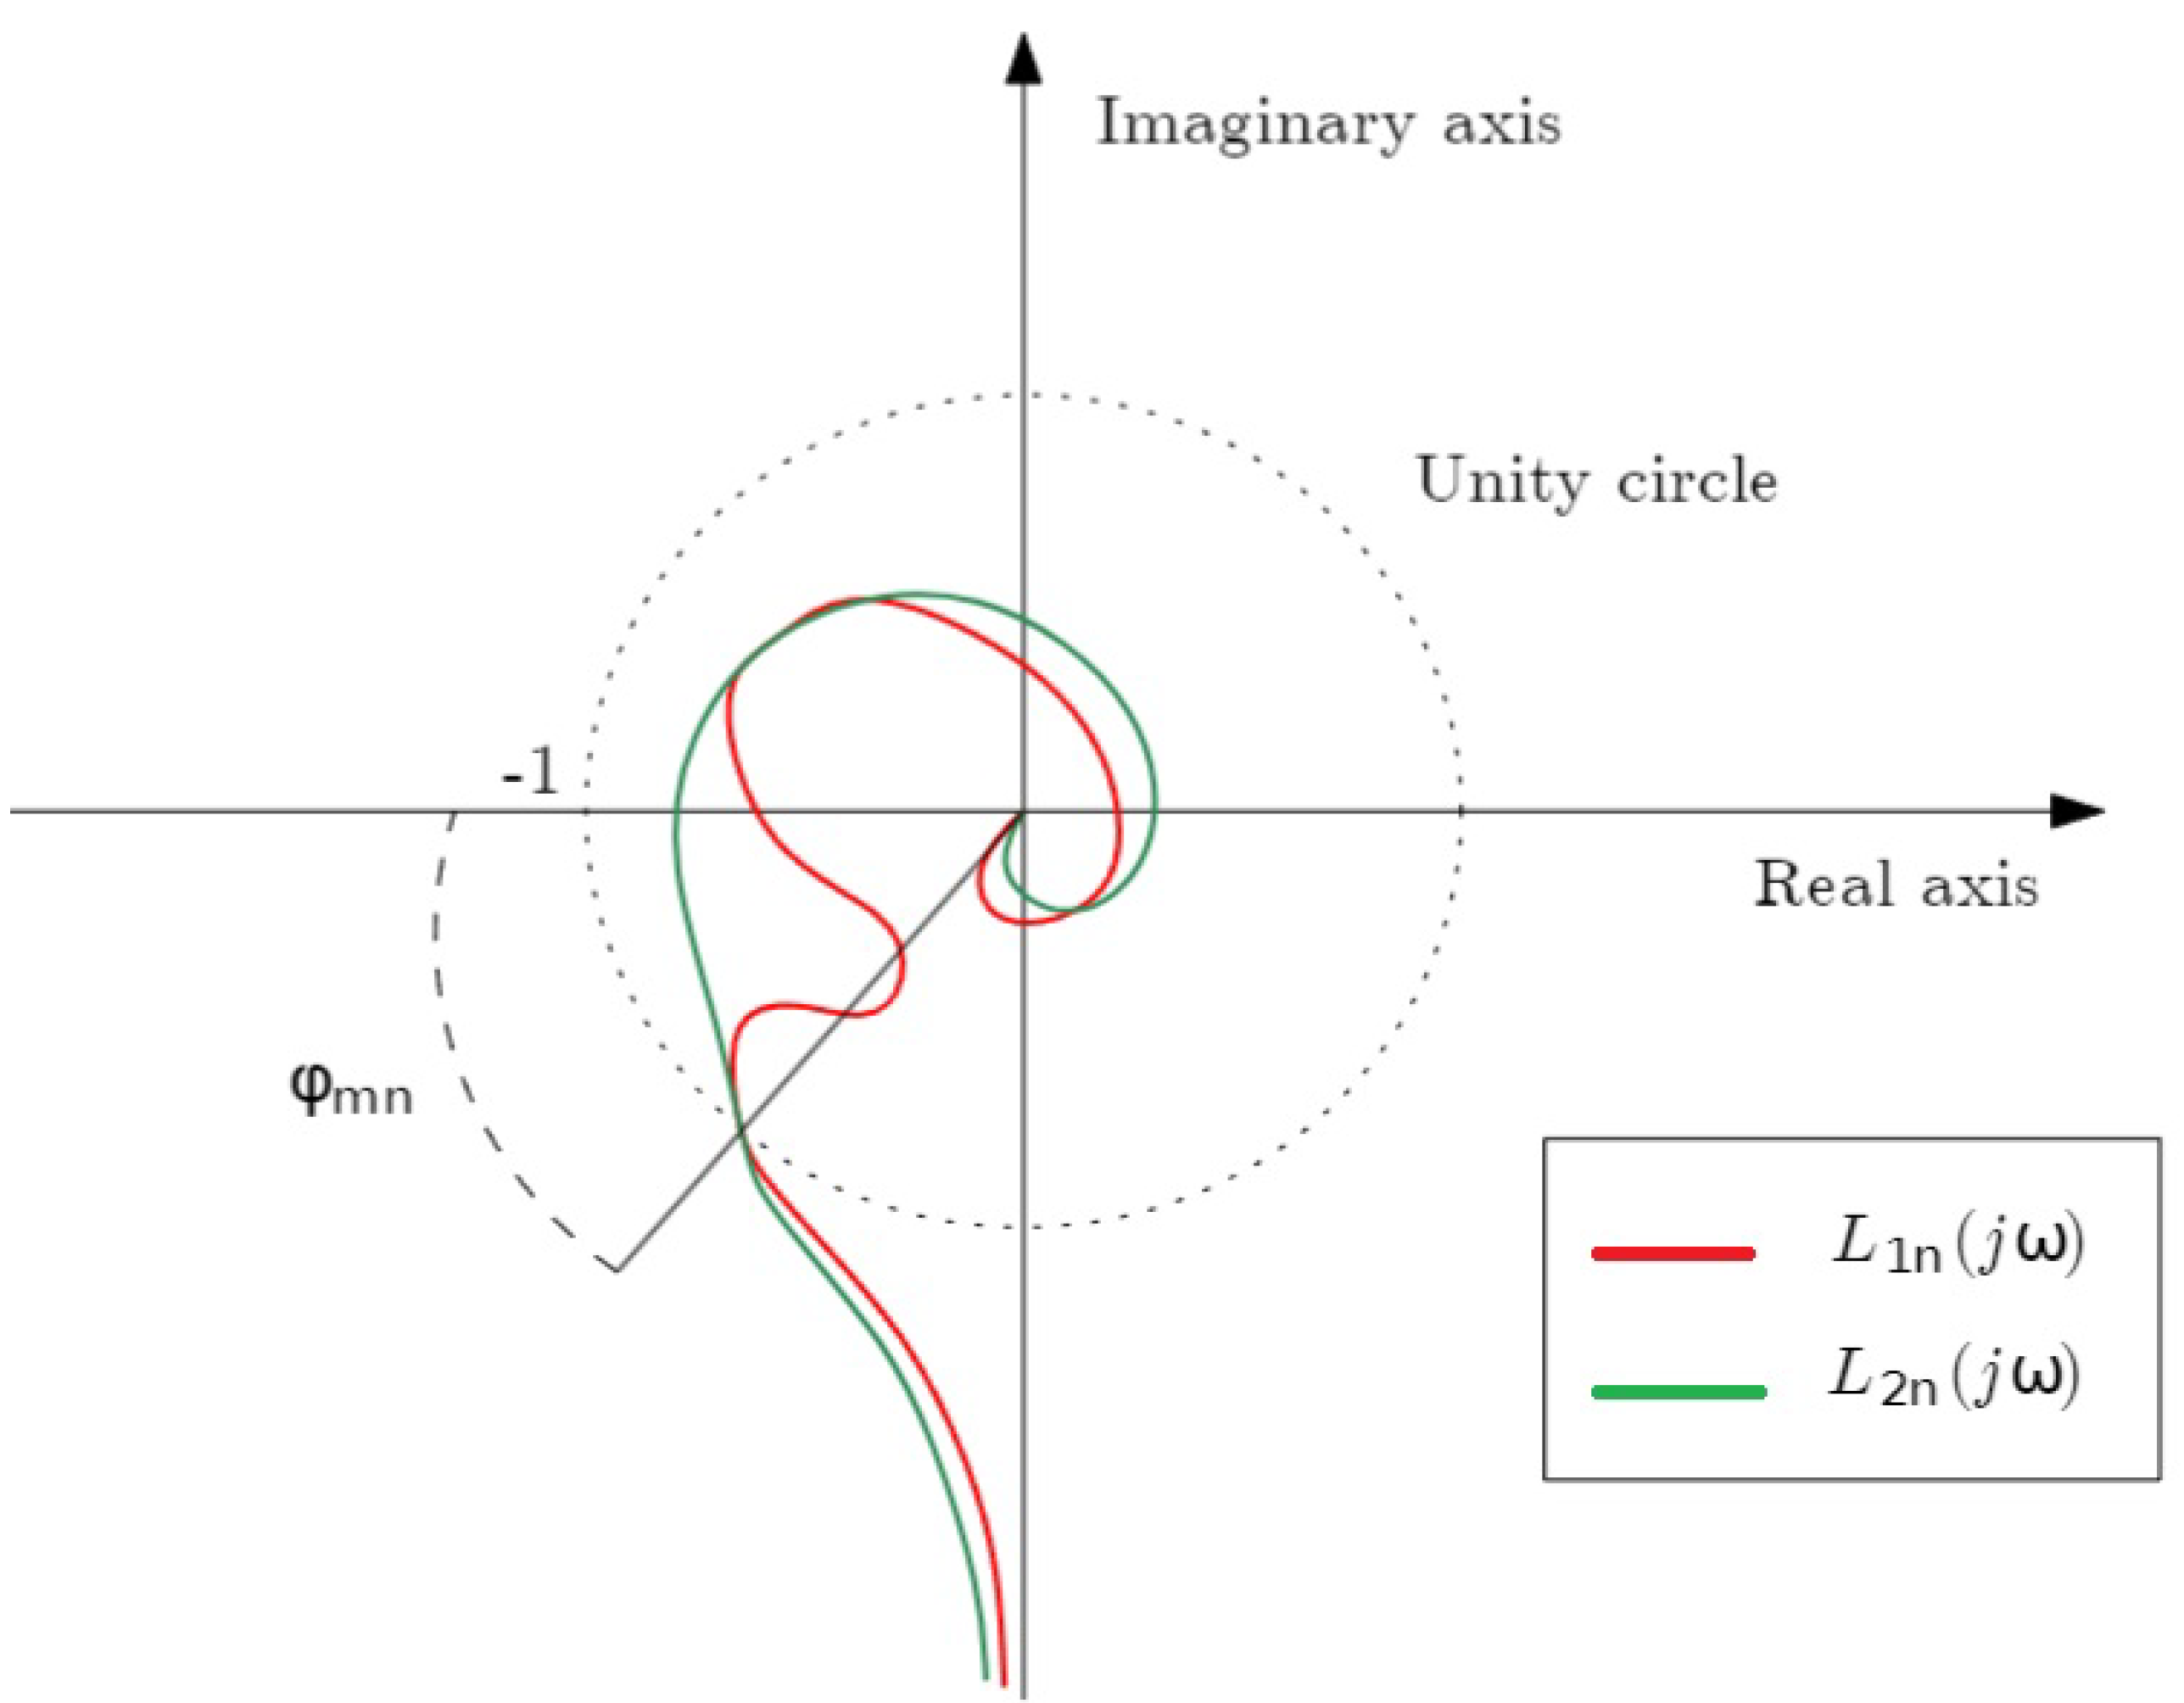
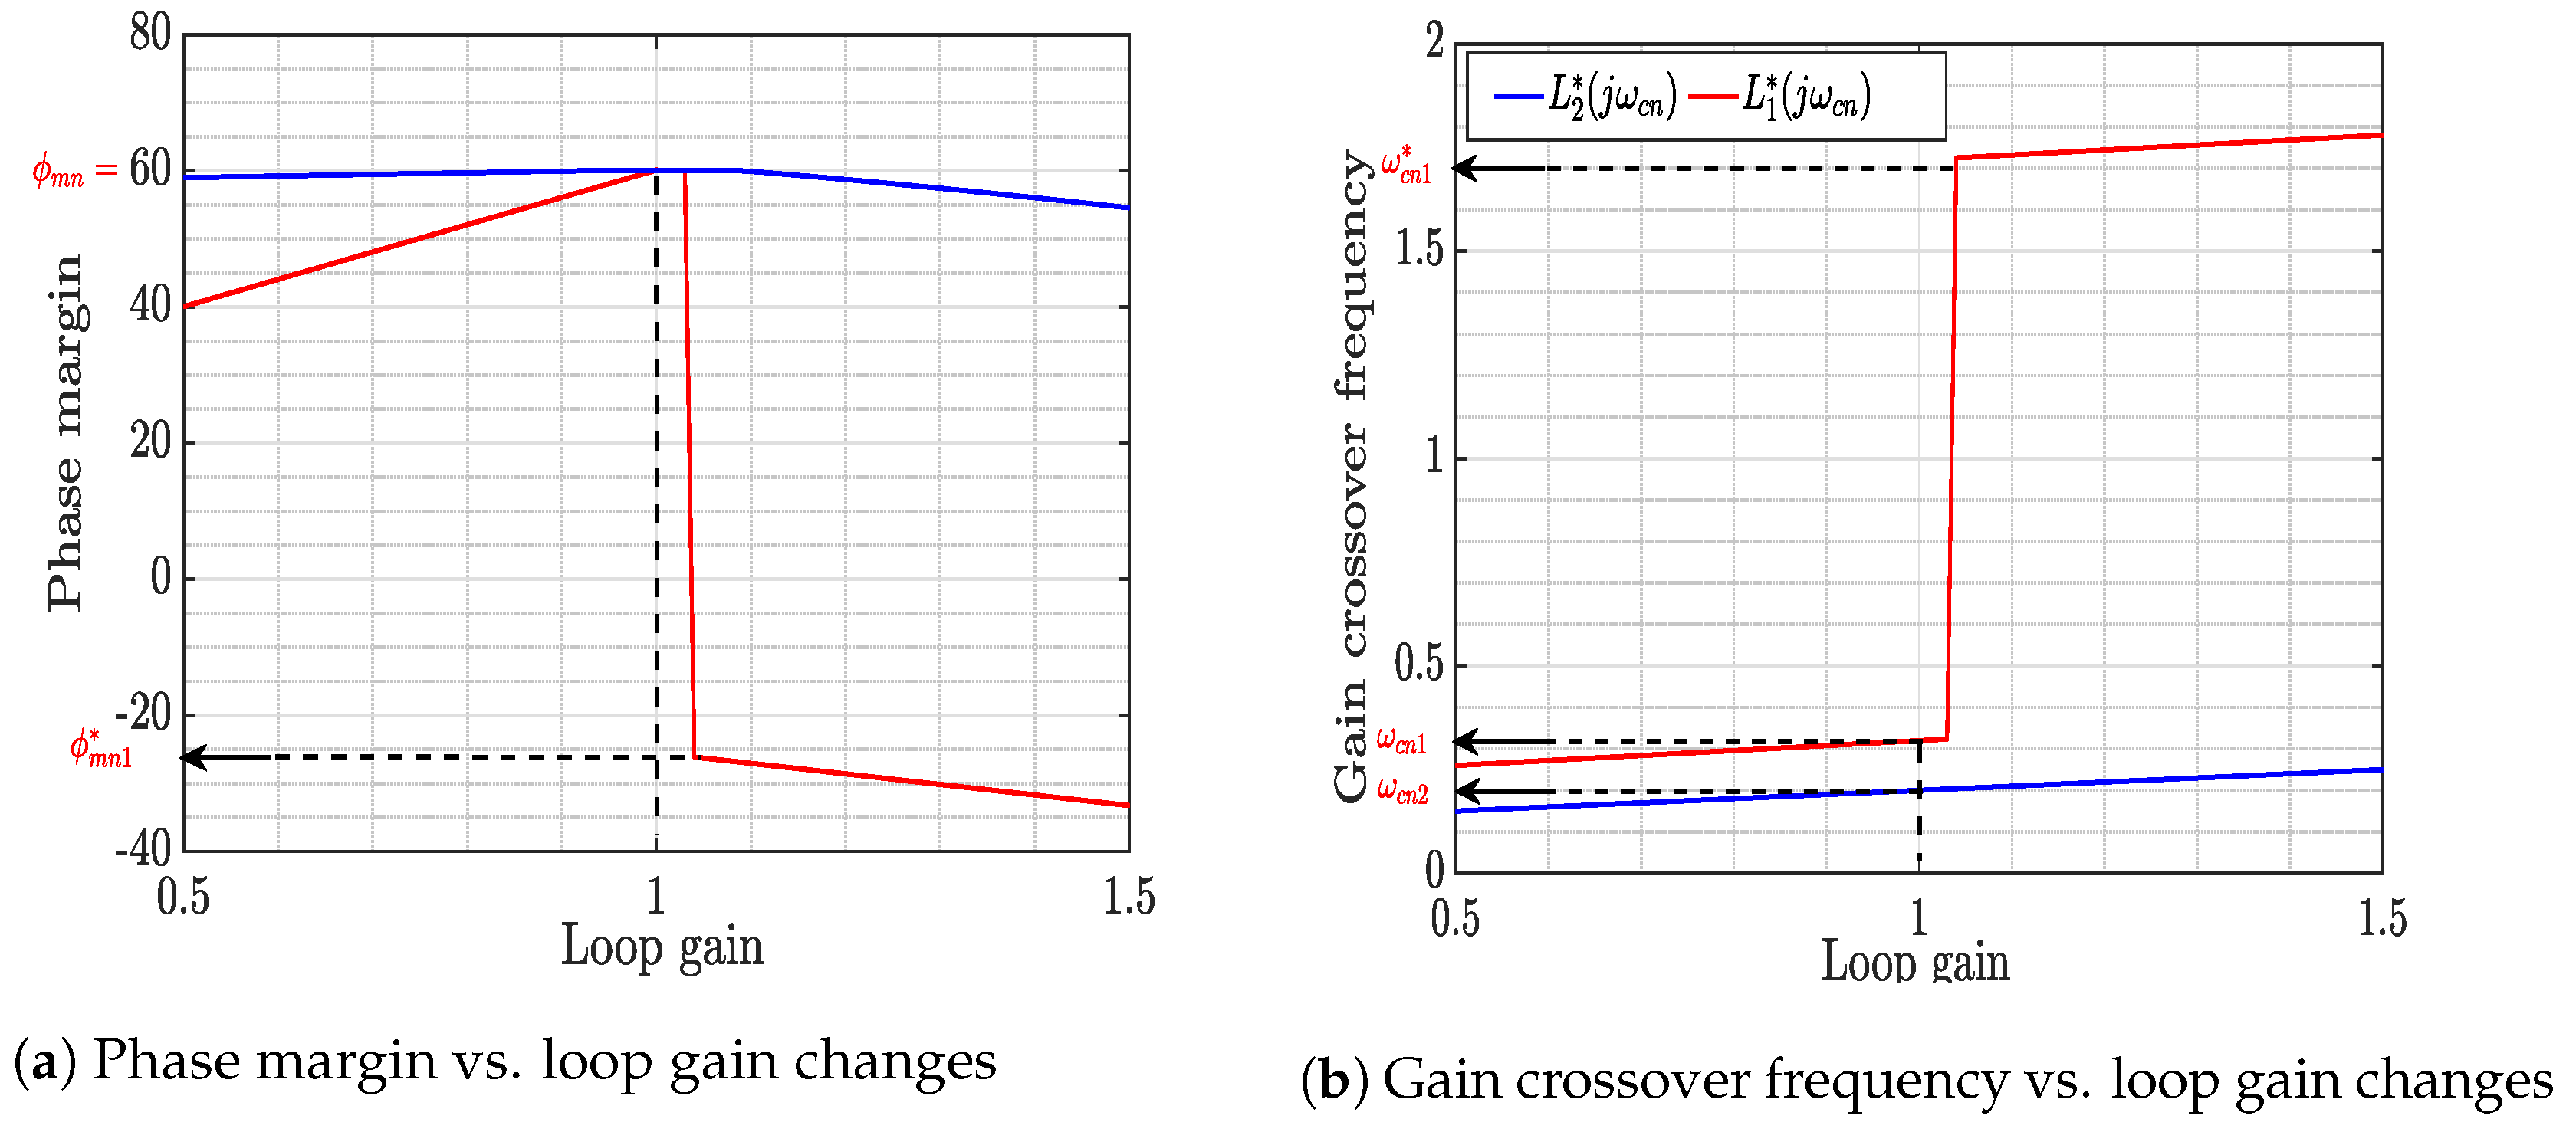
- The design specifications reflect the actual behavior of the closed-loop system, i.e., there are no frequencies beyond the gain crossover frequency at which the magnitude of the frequency response could be one, which could lead to different phase margin and gain crossover frequency specifications than the desired ones. In essence, the design method ensures that the selected specifications represent the true characteristics of the closed-loop system.
- Changes in the gain of the process (particularly increments of the gain) do not produce sharp changes in the phase margin and the gain crossover frequency that could suddenly unstabilize the closed-loop system. Note that this robustness concept is different from the well-known isophase margin condition. This one guarantees a local constant phase margin when the gain changes, while our condition guarantees that the phase margin changes smoothly in a broad range of gain variations. In particular, this smooth change is guaranteed if the gain grows with respect to the nominal value, which is the case that most likely can produce instability.
Author Contributions
Funding
Data Availability Statement
Conflicts of Interest
Abbreviations
| DC | Direct Current |
| DOF | Degree Of Freedom |
| Robust High Frequency Condition | |
| FLR | Flexible Link Robot |
| Fractional Order Proportional-Derivative controller | |
| Fractional Order Proportional-Integral controller | |
| PID | Proportional-Integral-Derivative controller |
References
- Abdulwasaa, M.A.; Abdo, M.S.; Shah, K.; Nofal, T.A.; Panchal, S.K.; Kawale, S.V.; Abdel-Aty, A.H. Fractal-fractional mathematical modeling and forecasting of new cases and deaths of COVID-19 epidemic outbreaks in India. Results Phys. 2021, 20, 103702. [Google Scholar] [CrossRef]
- AlBaidani, M.M.; Ganie, A.H.; Aljuaydi, F.; Khan, A. Application of Analytical Techniques for Solving Fractional Physical Models Arising in Applied Sciences. Fractal Fract. 2023, 7, 584. [Google Scholar] [CrossRef]
- Ahmad, I.; Ahmad, H.; Thounthong, P.; Chu, Y.M.; Cesarano, C. Solution of multi-term time-fractional PDE models arising in mathematical biology and physics by local meshless method. Symmetry 2020, 12, 1195. [Google Scholar] [CrossRef]
- Chen, W.; Sun, H.; Li, X. Fractional Derivative Modeling in Mechanics and Engineering; Springer: Berlin/Heidelberg, Germany, 2022. [Google Scholar]
- Srivastava, H.; Dubey, V.; Kumar, R.; Singh, J.; Kumar, D.; Baleanu, D. An efficient computational approach for a fractional-order biological population model with carrying capacity. Chaos Solitons Fractals 2020, 138, 109880. [Google Scholar] [CrossRef]
- Chen, S.B.; Jahanshahi, H.; Abba, O.A.; Solís-Pérez, J.; Bekiros, S.; Gómez-Aguilar, J.; Yousefpour, A.; Chu, Y.M. The effect of market confidence on a financial system from the perspective of fractional calculus: Numerical investigation and circuit realization. Chaos Solitons Fractals 2020, 140, 110223. [Google Scholar] [CrossRef]
- Shen, K.; Yu, W. Fractional programming for communication systems—Part I: Power control and beamforming. IEEE Trans. Signal Process. 2018, 66, 2616–2630. [Google Scholar] [CrossRef]
- Hekimoğlu, B. Optimal tuning of fractional order PID controller for DC motor speed control via chaotic atom search optimization algorithm. IEEE Access 2019, 7, 38100–38114. [Google Scholar] [CrossRef]
- Peng, X.; Shang, Y.; Zheng, X. Lower bounds for the blow-up time to a nonlinear viscoelastic wave equation with strong damping. Appl. Math. Lett. 2018, 76, 66–73. [Google Scholar] [CrossRef]
- Lewandowski, R.; Wielentejczyk, P. Nonlinear vibration of viscoelastic beams described using fractional order derivatives. J. Sound Vib. 2017, 399, 228–243. [Google Scholar] [CrossRef]
- Ding, X.; Zhang, G.; Zhao, B.; Wang, Y. Unexpected viscoelastic deformation of tight sandstone: Insights and predictions from the fractional Maxwell model. Sci. Rep. 2017, 7, 11336. [Google Scholar] [CrossRef]
- Xu, H.; Jiang, X. Creep constitutive models for viscoelastic materials based on fractional derivatives. Comput. Math. Appl. 2017, 73, 1377–1384. [Google Scholar] [CrossRef]
- Eldred, L.B.; Baker, W.P.; Palazotto, A.N. Kelvin-Voigt versus fractional derivative model as constitutive relations for viscoelastic materials. AIAA J. 1995, 33, 547–550. [Google Scholar] [CrossRef]
- Ogata, K. Modern Control Engineering; Prentice Hall: Upper Saddle River, NJ, USA, 2010; Volume 5, p. 894. [Google Scholar]
- Sanchis, R.; Romero, J.A.; Balaguer, P. Tuning of PID controllers based on simplified single parameter optimisation. Int. J. Control 2010, 83, 1785–1798. [Google Scholar] [CrossRef]
- Hamamci, S.E.; Tan, N. Design of PI controllers for achieving time and frequency domain specifications simultaneously. ISA Trans. 2006, 45, 529–543. [Google Scholar] [CrossRef] [PubMed]
- Castillo-Garcia, F.; Feliu-Batlle, V.; Rivas-Perez, R. Frequency specifications regions of fractional-order PI controllers for first order plus time delay processes. J. Process Control 2013, 23, 598–612. [Google Scholar] [CrossRef]
- Ariyatanapol, R.; Xiong, Y.P.; Ouyang, H. Partial pole assignment with time delays for asymmetric systems. Acta Mech. 2018, 229, 2619–2629. [Google Scholar] [CrossRef]
- Sinou, J.J.; Chomette, B. Active vibration control and stability analysis of a time-delay system subjected to friction-induced vibration. J. Sound Vib. 2021, 500, 116013. [Google Scholar] [CrossRef]
- Olgac, N.; Sipahi, R. Dynamics and stability of variable-pitch milling. J. Vib. Control 2007, 13, 1031–1043. [Google Scholar] [CrossRef]
- Gu, K.; Niculescu, S.I. Survey on recent results in the stability and control of time-delay systems. J. Dyn. Syst. Meas. Control 2003, 125, 158–165. [Google Scholar] [CrossRef]
- Li, S.; Zhu, C.; Mao, Q.; Su, J.; Li, J. Active disturbance rejection vibration control for an all-clamped piezoelectric plate with delay. Control Eng. Pract. 2021, 108, 104719. [Google Scholar] [CrossRef]
- Birs, I.; Muresan, C.; Nascu, I.; Ionescu, C. A survey of recent advances in fractional order control for time delay systems. IEEE Access 2019, 7, 30951–30965. [Google Scholar] [CrossRef]
- Shi, T.; Shi, P.; Wang, S. Robust sampled-data model predictive control for networked systems with time-varying delay. Int. J. Robust Nonlinear Control 2019, 29, 1758–1768. [Google Scholar] [CrossRef]
- Wu, M.; Cheng, J.; Lu, C.; Chen, L.; Chen, X.; Cao, W.; Lai, X. Disturbance estimator and smith predictor-based active rejection of stick–slip vibrations in drill-string systems. Int. J. Syst. Sci. 2020, 51, 826–838. [Google Scholar] [CrossRef]
- Araujo, J.M.; Santos, T.L. Control of second-order asymmetric systems with time delay: Smith predictor approach. Mech. Syst. Signal Process. 2020, 137, 106355. [Google Scholar] [CrossRef]
- Natori, K.; Oboe, R.; Ohnishi, K. Stability analysis and practical design procedure of time delayed control systems with communication disturbance observer. IEEE Trans. Ind. Inform. 2008, 4, 185–197. [Google Scholar] [CrossRef]
- Natori, K.; Oboe, R.; Ohnishi, K. Robustness on model error of time delayed control systems with communication disturbance observer. IEEJ Trans. Ind. Appl. 2008, 128, 709–717. [Google Scholar] [CrossRef]
- Zhou, W.; Wang, Y.; Liang, Y. Sliding mode control for networked control systems: A brief survey. ISA Trans. 2022, 124, 249–259. [Google Scholar] [CrossRef] [PubMed]
- Nian, F.; Shen, S.; Zhang, C.; Lv, G. Robust Switching Control for Force-reflecting Telerobotic with Time-varying Communication Delays. In Proceedings of the 2020 Chinese Control and Decision Conference (CCDC), Hefei, China, 22–24 August 2020; pp. 1714–1719. [Google Scholar]
- Rogers, G. Power System Oscillations; Springer Science & Business Media: Berlin/Heidelberg, Germany, 2012. [Google Scholar]
- Muresan, C.I.; Dutta, A.; Dulf, E.H.; Pinar, Z.; Maxim, A.; Ionescu, C.M. Tuning algorithms for fractional order internal model controllers for time delay processes. Int. J. Control 2016, 89, 579–593. [Google Scholar] [CrossRef]
- Abbisso, S.; Caponetto, R.; Diamante, O.; Fortuna, L.; Porto, D. Non-Integer Order Integration by Using Neural Networks. In Proceedings of the IEEE International Symposium on Circuits and Systems (Cat. No. 01CH37196), Sydney, Australia, 6–9 May 2001; Volume 3, pp. 688–691. [Google Scholar]
- Caponetto, R.; Dongola, G.; Pappalardo, F.; Tomasello, V. Auto-tuning and fractional order controller implementation on hardware in the loop system. J. Optim. Theory Appl. 2013, 156, 141–152. [Google Scholar] [CrossRef]
- Monje, C.A.; Chen, Y.; Vinagre, B.M.; Xue, D.; Feliu-Batlle, V. Fractional-Order Systems and Controls: Fundamentals and Applications; Springer Science & Business Media: Berlin/Heidelberg, Germany, 2010. [Google Scholar]
- Benftima, S.; Gharab, S.; Feliu-Batlle, V. Fractional Modeling and Control of Lightweight 1 DOF Flexible Robots Robust to Sensor Disturbances and Payload Changes. Fractal Fract. 2023, 7, 504. [Google Scholar] [CrossRef]
- Mamani, G.; Becedas, J.; Feliu-Batlle, V. Sliding mode tracking control of a very lightweight single-link flexible robot robust to payload changes and motor friction. J. Vib. Control 2011, 18, 1141–1155. [Google Scholar] [CrossRef]
- Gharab, S.; Benftima, S.; Batlle, V.F. Fractional Control of a Lightweight Single Link Flexible Robot Robust to Strain Gauge Sensor Disturbances and Payload Changes. Actuators 2021, 10, 317. [Google Scholar] [CrossRef]
- Yaryan, M.; Naraghi, M.; Rezaei, S.; Zareinejad, M.; Ghafarirad, H. Bilateral Nonlinear Teleoperation for Flexible Link Surgical Robot with Vibration Control. In Proceedings of the 2012 19th Iranian Conference of Biomedical Engineering (ICBME), Tehran, Iran, 20–21 December 2012; pp. 101–106. [Google Scholar]
- Podlubny, I. Fractional differential equations. Math. Sci. Eng. 1999, 198, 7–35. [Google Scholar]


Disclaimer/Publisher’s Note: The statements, opinions and data contained in all publications are solely those of the individual author(s) and contributor(s) and not of MDPI and/or the editor(s). MDPI and/or the editor(s) disclaim responsibility for any injury to people or property resulting from any ideas, methods, instructions or products referred to in the content. |
© 2023 by the authors. Licensee MDPI, Basel, Switzerland. This article is an open access article distributed under the terms and conditions of the Creative Commons Attribution (CC BY) license (https://creativecommons.org/licenses/by/4.0/).
Share and Cite
Gharab, S.; Feliu Batlle, V. Fractional Control of a Class of Underdamped Fractional Systems with Time Delay—Application to a Teleoperated Robot with a Flexible Link. Fractal Fract. 2023, 7, 646. https://doi.org/10.3390/fractalfract7090646
Gharab S, Feliu Batlle V. Fractional Control of a Class of Underdamped Fractional Systems with Time Delay—Application to a Teleoperated Robot with a Flexible Link. Fractal and Fractional. 2023; 7(9):646. https://doi.org/10.3390/fractalfract7090646
Chicago/Turabian StyleGharab, Saddam, and Vicente Feliu Batlle. 2023. "Fractional Control of a Class of Underdamped Fractional Systems with Time Delay—Application to a Teleoperated Robot with a Flexible Link" Fractal and Fractional 7, no. 9: 646. https://doi.org/10.3390/fractalfract7090646