Abstract
Jump dynamics in financial markets exhibit significant complexity, often resulting in increased probabilities of subsequent jumps, akin to earthquake aftershocks. This study aims to understand these complexities within a multifractal framework. To do this, we employed the high-frequency intraday data from six major cryptocurrencies (Bitcoin, Ethereum, Litecoin, Dashcoin, EOS, and Ripple) and six major forex markets (Euro, British pound, Canadian dollar, Australian dollar, Swiss franc, and Japanese yen) between 4 August 2019 and 4 October 2023, at 5 min intervals. We began by extracting daily jumps from realized volatility using a MinRV-based approach and then applying Multifractal Detrended Fluctuation Analysis (MFDFA) to those jumps to explore their multifractal characteristics. The results of the MFDFA—especially the fluctuation function, the varying Hurst exponent, and the Renyi exponent—confirm that all of these jump series exhibit significant multifractal properties. However, the range of the Hurst exponent values indicates that Dashcoin has the highest and Litecoin has the lowest multifractal strength. Moreover, all of the jump series show significant persistent behavior and a positive autocorrelation, indicating a higher probability of a positive/negative jump being followed by another positive/negative jump. Additionally, the findings of rolling-window MFDFA with a window length of 250 days reveal persistent behavior most of the time. These findings are useful for market participants, investors, and policymakers in developing portfolio diversification strategies and making important investment decisions, and they could enhance market efficiency and stability.
Keywords:
jumps; multifractality; complexity; MFDFA; rolling window; cryptocurrencies; forex markets 1. Introduction
The jump volatility of financial markets, often termed bad volatility, exhibits unpredictable behavior due to its intricate characteristics and discontinuous nature [1]. Understanding the potential causes of these discontinuities and jumps is crucial for developing effective risk management strategies [2], especially during major events such as: the 2007–2008 global financial crisis (GFC) [3], uncertainty related to monetary policy [4], market sentiments [5], the COVID-19 pandemic [6], and the recent bankruptcy of FTX [7]. These events tend to occur every other decade, which in turn complicates pricing and risk management strategies, and understanding of volatility, and consequently has a detrimental psychological impact on investors [8]. For example, the recent COVID-19 pandemic and the Russian–Ukraine war caused major jumps and turbulence in many financial markets, which led to significant financial damage [9,10]. The bankruptcy of FTX in November 2022 is another major event that cost the cryptocurrency market around USD 8 billion [11,12]. Therefore, market practitioners, investors, policymakers, and regulators need to monitor the behavior of financial market jumps closely, as they have a major impact on overall trading behavior, financial systems, and important investment decisions [13].
Many studies confirm the presence of substantial long memory and clustering patterns in volatility [14,15,16,17], which are largely influenced by jumps in the pricing process [18]. For instance, Corsi et al. [19] found that the future volatility of financial markets is significantly associated with jumps, making them important for volatility forecasting. Conversely, others argue that jumps do not have any direct impact on volatility forecasts [20,21,22,23]. This discrepancy raises two pertinent points. First, graphical analyses of volatility frequently show that large, unexpected changes in market prices are accompanied by volatility bursts, indicating the potential predictive power of jumps [19]. Secondly, since volatility is associated with the diversity of information and belief dispersion [24,25], jumps that increase uncertainty about fundamental values are likely to impact future volatility.
On the other hand, Hawkes describes the phenomenon of jumps using the concept of self-excitation and cross-excitation, which are similar to seismic events such as earthquakes [26,27,28]. According to this theory, jumps in a financial market increase the likelihood of subsequent jumps in the same and other markets. Thus, jumps in financial market returns exhibit self-excitation behavior, manifesting over time and across different markets. These models rely on an intensity vector, which is defined as a simple linear function of past events. Recently, several of Hawkes’ self-exciting processes have been developed to model the daily changes in various financial markets. For example, the multi-dimensional model of Aït-Sahalia et al. [29] examines self-excitation and cross-excitation, which is mostly caused by contagion. Others, meanwhile, have examined the self-exciting behavior of negative jumps in the background of the mono-asset framework [30,31].
The overall jumping behavior is much more complex, and Brownian motion-based statistical models are often found to be incapable of identifying and capturing these patterns effectively [29]. For example, it is quite unlikely for crashes to happen simultaneously across several worldwide markets under the assumptions of Brownian motion-based statistical models; yet such events do happen. Even more surprising is that they follow a pattern similar to the aftershocks of an earthquake, occurring one after another over hours, days, weeks, or even months. Thus, these complex characteristics make multifractality a perfect fit to examine the dynamics of jumps in financial markets in a fractal background.
The concept of multifractality is based on fractals, which are robust enough to measure the complex patterns, long memory, and persistent behavior of various financial markets. Many studies also view multifractality in financial markets as one of the primary stylized facts [32,33,34]. This is because multifractal properties replicate the behavior of several stylized facts, such as fat tails, long-term dependency, volatility clustering, and multi-scaling. Interestingly, these all are particularly noticeable in the jumps of financial markets [35]. However, these characteristics are in contrast to the basic tenets of the well-known Efficient Market Hypothesis (EMH) proposed by Fama [36]. In contrast, Peters [37] proposed the Fractal Market Hypothesis (FMH), which accurately explains the fractal characteristics of financial markets.
The FMH-based methodologies are categorized into two main types; i.e., mono-fractality and multifractality. Initial studies employed mono-fractal approaches, such as the rescaled range analysis (R/S) of Hurst [38] and the detrended fluctuation analysis (DFA) of Peng et al. [39], to examine the persistent behavior and long-range properties. However, it was observed later that these methodologies are limited in practical use due to the multiscale properties of financial markets. Kantelhardt et al. [40] developed a multifractal detrended fluctuation analysis (MFDFA) to address this limitation, providing a better characterization of the multiscale properties of various financial markets. Since then, MFDFA has been popular in terms of examining market efficiency through multifractality and has been applied to various financial markets like cryptocurrencies [41,42,43], currency exchange rates [44,45,46], stock markets [47,48,49], electricity markets [32], and agriculture markets [50], among others.
Cryptocurrencies have recently gained considerable interest because of their potential threat to the existing payment system, fiat currencies, financial stability, and monetary policies. The appeal of cryptocurrency interest stems from the fundamental blockchain technology and decentralized properties that contrast with traditional financial markets [51,52,53]. As of July 2024, there were around 500 exchanges with a total market capitalization of USD 2.4 trillion and over 10,000 cryptocurrencies being traded (https://coinmarketcap.com/, (accessed on 20 August 2024)). Manavi et al. [54] point out that global geopolitical events mostly drive this heightened interest in cryptocurrencies. For example, the Russian–Ukraine conflict has further highlighted the importance of cryptocurrencies in evading sanctions due to their decentralized properties (https://www.csis.org/analysis/cryptocurrencys-role-russia-ukraine-crisis, (accessed on 20 August 2024)). This situation underscores Bitcoin’s original design to empower individuals by reducing the influence of governments and central banks.
In contrast, since the collapse of Bretton Woods and the subsequent transition to a free-floating regime, extreme volatility has become a well-known feature of the forex markets [55]. This extreme volatility is primarily driven by jumps, which are associated with various complex characteristics and are linked to the forex market’s status as the largest trading market worldwide. Several studies have explored the volatility clustering and return distribution of exchange rates [56,57], as well as multifractality [44,58], persistent and long memory [59,60], and cross-correlations [61,62].
Like forex, the cryptocurrency market also exhibits severe volatility and abrupt price changes or jumps, often to a greater extent [63]. For instance, Bitcoin price fluctuations have been nearly ten times more volatile than the major forex markets [64]. The significant volatility and market capitalization of cryptocurrencies pose substantial risks to consumers and investors, as evidenced by Bitcoin’s dramatic price movements from around USD 300 at the end of 2014 to approximately USD 20,000 by the end of 2017, and a recent peak of USD 75,830 on 14 March 2024, before falling to USD 62,427 by 15 May 2024 (https://www.investopedia.com/articles/forex/121815/bitcoins-price-history.asp, (accessed on 20 August 2024)). Unlike traditional currencies, which are tied to specific countries and influenced by central banks, cryptocurrencies are decentralized and global, leading to the perception of them having little to no correlation with forex markets [54]. For instance, Urquhart et al. [65], Baumöhl [51], and Chemkha et al. [66] found significant negative dependence of cryptocurrency markets on forex markets, concluding that these can act as a hedge and safe haven.
Similarly, Shahzad et al. [67], while examining the hedging potential and price explosivity of cryptocurrencies and forex markets, found that cryptocurrency investors can be protected from downside risk through conventional currencies. Corbet et al. [68] also found the relative isolation of cryptocurrencies not only from forex but also from other financial assets as well. In contrast, Dyhrberg [69] found that Bitcoin shares characteristics similar to the US dollar; specifically, that they react similarly to federal funds rates. Raza et al. [70] also discovered a positive relationship between cryptocurrencies and forex markets, particularly for Bitcoin, for all taken quantiles. Moreover, recent studies during the COVID-19 pandemic have identified the relationship between cryptocurrencies and traditional financial markets [71,72], raising concerns about potential compromise of its decentralized nature. Therefore, it is worthwhile examining if the cryptocurrency market resembles traditional currency markets by studying the jumps that occur during extreme events.
This study addresses the intricate nature of jumps in the financial markets of cryptocurrencies and forex by using advanced econophysics techniques to investigate the internal multifractal dynamics in the jumps. It makes several contributions to the literature on market jumps. Firstly, as far as we know, it is the pioneering study to focus on the multifractal patterns of jumps in cryptocurrency and forex markets. Secondly, it utilizes high-frequency, five-minute data for six major cryptocurrencies (Bitcoin, Ethereum, Litecoin, Dashcoin, EOS, and Ripple) and six major currency exchange rates (Euro, British pound, Canadian dollar, Australian dollar, Swiss franc, and Japanese yen) against the US dollar, providing a rich dataset for analyzing the long memory of jumps. This approach helps overcome the limitations of daily data, which might not adequately capture the occurrence of jumps. Thirdly, the research employs the robust MinRV-based jump detection method developed by Andersen et al. [73], which enhances robustness against microstructure noise by utilizing closest neighbor truncation. Fourthly, the application of robust MFDFA [40]—a sophisticated extension of DFA— identifies complex multifractal patterns that reveal the markets’ informational efficiency, persistency, long memory, and predictability of the jumps. Lastly, this study applies a dynamic rolling-window approach with a window length of 250 days—i.e., approximately equal to 1 year—to understand better how the persistency or autocorrelation changes in jumps over time.
2. Literature Review
We discuss the overall relevant literature in two main streams. The first focuses on the examination of financial market jumps, and the other relates to the multifractal patterns present in various financial markets. The literature on jumps has primarily relied on developing jump identification and detection methodologies. For instance, Barndorff-Nielsen [74] proposed the pioneer model-free method to separate jumps by subtracting realized bi-power variation (BPV) from the realized volatility (RV) of Andersen et al. [75]. Later, based on this, many other jump methods were introduced, such as jump approaches based on returns [76,77], bi-power variation [20,73,78,79,80], high order variation [81,82], swap variance [83] and others (see an excellent review by Maneesoonthorn et al. [84]).
Additionally, other jump identification techniques have been reported. Concerning factor-based models, Todorov et al. [85] offer a novel method to detect jump sensitivities. In the context of nonparametric approaches, Lee et al. [86] and Xue et al. [87] provide jump tests that are robust against microstructure noise, detecting jumps in high-frequency settings. Similarly, Peng et al. [88] developed an online recursive jump detection algorithm based on Bayes theorem and Markov financial time series properties for effectively capturing large-amplitude jumps, even at lower frequencies with minimal computational power. More recently, Au Yeung et al. [89] introduced a method that combines machine learning and a long short-term memory (LSTM) neural network, which showed improved accuracy over traditional jump detection methods when tested on stock market data from both emerging and developed countries.
In addition to the literature on jump detection methods, there is a growing number of studies that deal with the confusion on long memory, clustering, and self-excitement [26,27] of jumps in financial markets. The literature on Lévy processes, jump–diffusion process, and compound Poisson jumps satisfies the assumption that jumps are serially independent; thus, there is no long memory [90,91,92,93,94,95]. Others found that jumps exhibit long memory and clustering characteristics, being influenced not only by previous jumps (self-excitation), but also by jumps in other markets (cross-excitation) [29]. Building upon this framework, Fulop et al. [30] identified significant self-excitation in jump clustering in financial markets during the 1987 market crash and the GFC 2007–2008. Eyjolfsson et al. [96] also noted jump clustering in UK electricity spot prices due to a self-excitation mechanism. Callegaro et al. [97] highlighted that self-excitation impacts both spot and forward derivatives in electricity markets, with Hawkes’ processes effectively capturing these dynamics. In terms of the cryptocurrency market, Zhang et al. [98] utilized the jump test of Boswijk et al. [99] and found significant self-exciting long memory in Bitcoin, revealing significant asymmetric self-excitation with negative jumps causing more persistent aftershocks than positive ones. Similarly, Chen et al. [100] recently discovered that the S&P 500 has more significant and frequent negative jumps, while cryptocurrencies show continuous positive jumps and complex interactions between negative and positive jumps during high volatility.
Regarding the examination of jump dynamics, the second stream of literature relevant to this study focuses on the multifractality of financial markets. Significant attention has been given to cryptocurrencies in investigating their multifractal characteristics and market efficiency using MFDFA [40], because of their pronounced volatility. Shrestha [101] employed MFDFA and discovered significant multifractal patterns in Bitcoin returns, where extreme and autocorrelated returns were identified as major contributors to this inefficiency. Takaishi [102] and Vaz et al. [103] reported similar findings and observed that fat tails and long-range correlations are key factors contributing to higher multifractality in Bitcoin. As for Bitcoin and Ethereum, Partida et al. [104] found significant persistent long-range correlations, multifractality and chaotic behavior. Moreover, Gunay et al. [105] apply a series of other methods such as R/S analysis, Peng, Higuchi, Aggregated Variances, box-counting, and monogram analysis, along with MFDFA to examine Bitcoin, Ethereum, Litecoin, and Ripple. They found evidence of chaos in the cryptocurrency market, indicating that returns follow a chaotic order rather than a random pattern. Stosic et al. [106] and Bariviera [107] analyzed multifractal patterns in returns and volume for 50 and 84 cryptocurrencies, respectively. They found that these patterns are similar to those in stock markets but differ significantly from those in forex markets. More recently, Salis et al. [108] proposed an investment strategy using MFDFA and the Markowitz framework for cryptocurrencies, and found that the inefficiency levels of cryptocurrencies change over time.
As for forex markets, few studies focused on examining their multifractal characteristics. Among the initial studies, Oh et al. [62] applied MFDFA to the exchange rates of Thailand, South Korea, Hong Kong, and Japan against the US dollar and discovered stronger multifractal patterns in Thailand and South Korea compared to Japan and Hong Kong post-Asian currency crisis. For the exchange rates of Taiwan, South Korea, Sweden, Brazil, Malaysia, Thailand, New Zealand, and Australia, Stošić et al. [109] observed significant shifts in their multifractal spectrum during independent and managed floating regimes. On the other hand, Shahzad et al. [46] studied the impact of trading volume on the returns and volatilities of the Euro, British pound, Japanese yen, and Swiss franc under the lens of multifractality. Interestingly, they found lower multifractality in the Japanese yen and Swiss franc, with their multifractality being significantly influenced by trading volume. Han et al. [45] and Han et al. [110] found lower multifractality for the Japanese yen compared to the Canadian dollar, Euro, and British pound. They also noted that the GFC 2007–2008 and the Federal Reserve’s 2014 announcement on withdrawing from quantitative easing affected market efficiency and risk levels across different periods. Czech et al. [111] analyzed the exchange rates of the Polish zloty against the Turkish lira, Mexican peso, Swiss franc, Japanese yen, and Euro against the US dollar and found that the Mexican peso, Turkish lira, and Euro exhibited mean-reverting anti-persistent behavior.
In summary, this study addresses the gaps identified in the existing literature. Firstly, most of the literature on jumps has focused primarily on developing methodologies for identifying and detecting jumps. Secondly, the evidence for long memory in jumps is puzzling and primarily limited to Hawkes’ process-based self-excitation long memory. Thirdly, despite the complexity of jumps, the multifractal perspective on long memory in jumps has been largely overlooked. Interestingly, when multifractality is present, volatility, crashes, and complexity become predictable [112,113]. Fourthly, most studies have used returns to explore the long memory and multifractality properties of financial markets, with only a few focusing on realized volatility and its continuous component [46,114,115,116]. However, no study investigated long memory or multifractal behavior of “discontinuous component” or jumps in any financial market, except for Pirino [117], who studied mono-fractality in jumps using DFA.
Additionally, there is a significant gap in the literature when examining the multifractal comparison between cryptocurrencies and forex markets, even in terms of returns, realized volatility, and the continuous component of volatility. Given that cryptocurrencies were specifically designed to have decentralized properties independent of the regulatory bodies, forex markets are more established and subject to regulatory oversight. Hence, examining a comparative multifractal analysis of these markets could offer deeper insights into their risk profiles, pricing behaviors, and efficiency levels. Therefore, this study fills this gap by examining the multifractal nature of jumps in the financial markets of cryptocurrencies and forex. This information is crucial, as market regulators and practitioners should prioritize jumps over overall returns due to their potential to quickly disrupt market trading mechanisms, disorder financial markets, and influence investor decisions.
3. Data and Descriptive Statistics
3.1. Data
The dataset comprises six major cryptocurrencies along with six major currency exchange rates aiming to explore the inner multifractal patterns of jumps. The taken cryptocurrencies include Bitcoin (BTC), Ethereum (ETH), Litecoin (LTC), Dashcoin (DSH), EOS and Ripple (XRP); while the exchange rates are Euro (EUR), British pound (GBP), Canadian dollar (CAD), Australian dollar (AUD), Swiss franc (CHF), and Japanese yen (JPY). The selection of cryptocurrencies is based on the accessibility of the maximum available data as well as the highest market capitalization. In contrast, the currency exchange rates are selected on the basis of the highest trading volumes. The data are taken at 5 min frequency intervals, covering the period of 4 August 2019 to 4 October 2023. The reason for selecting this particular frequency is that it provides the best possible balance between high- and low-frequency data [118,119,120]. In addition, all the closing prices of cryptocurrency and forex currencies closing prices are sourced from the website of Dukascopy Bank SA (Geneva, Switzerland), a Swiss forex bank, and an ECN broker headquartered in Geneva (https://www.dukascopy.com/swiss/english/home/, (accessed on 20 August 2024)).
3.2. Descriptive Statistics
This section begins by explaining the summary statistics of returns, as well as the jumps in cryptocurrency and exchange rate markets. Gaining a comprehensive overview of these statistics is crucial to understanding the magnitude, as well as the behavior of returns and jumps across the studied data. In contrast to exchange rate markets, cryptocurrencies are open even on weekends. Hence, the values of weekend data were removed to facilitate data matching. After data cleaning and matching, the intraday returns at a 5 min frequency resulted in 298,943 values for each cryptocurrency and exchange rate market. With the help of these intraday returns, the daily RV and MinRV are computed, which allowed us to determine the daily jumps for each cryptocurrency and forex market. Accordingly, each jump series comprised 1039 observations.
As for the returns of cryptocurrencies and forex markets, the summary statistics are reported in Table 1. All datasets show a negative average 5 min return, except for ETH, BTC, XRP, CHF, and GBP. Among these, ETH records the highest intraday average return at
, while EOS has the lowest at
. Furthermore, XRP boasts the highest maximum intraday return at approximately
, with DSH at
and ETH at
trailing behind. In contrast, EOS suffers the most significant intraday loss at around
, with DSH at
. In comparison to forex markets, the highest fluctuation in market returns is observed for cryptocurrencies; especially DSH, with a standard deviation of
. Interestingly, all forex markets exhibit similar behavior, fluctuating between
to
. Furthermore, the skewness values are positive for XRP, ETH, JPY, CHF, EUR, and DSH; while negative skewness values are noted for AUD, LTC, BTC, CAD, GBP, and EOS. All markets also demonstrate considerably higher kurtosis, highlighting stylized facts with fat tails. Figure 1 and Figure 2 show the temporal development of 5 min intraday returns in both the cryptocurrency and forex markets.

Table 1.
Descriptive statistics of the returns of cryptocurrency and forex markets.
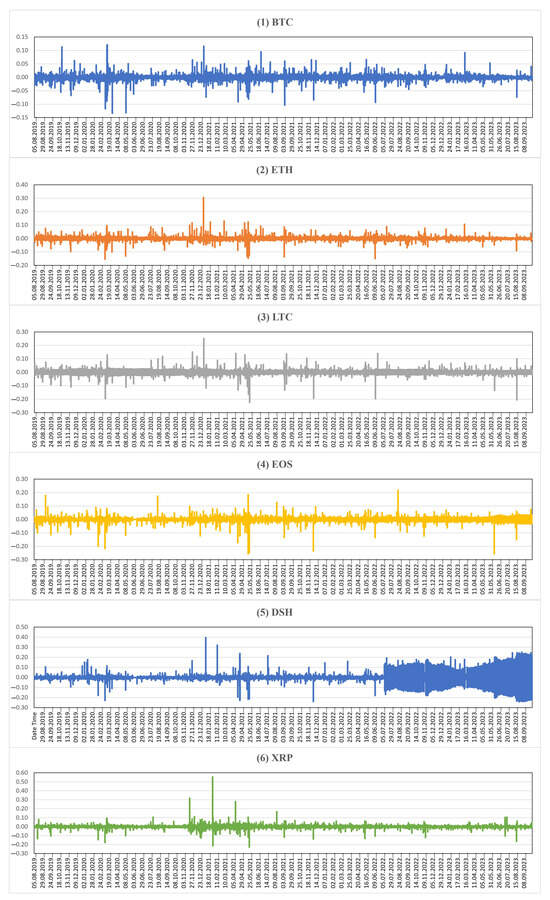
Figure 1.
5 min high-frequency returns of cryptocurrency markets.
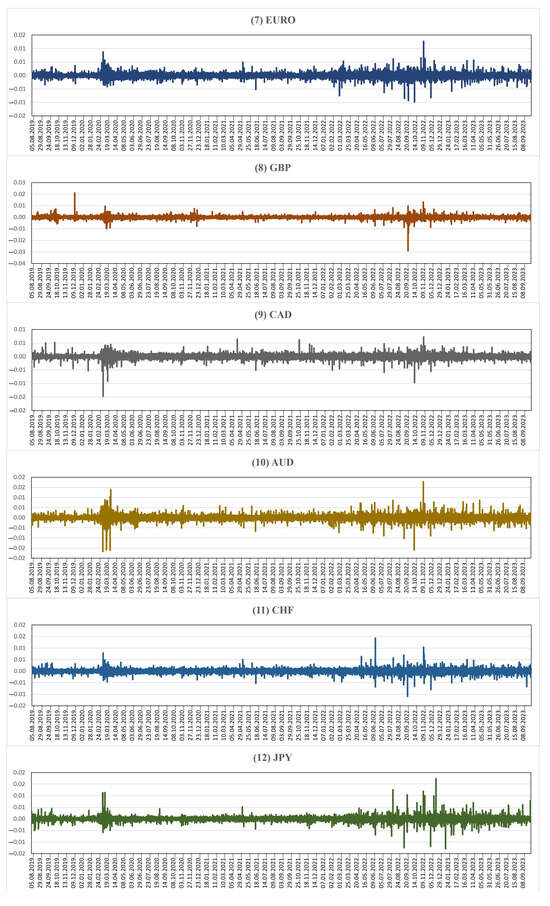
Figure 2.
5 min high-frequency returns of forex markets.
In terms of jumps, the descriptive statistics of cryptocurrencies and exchange rates are presented in Table 2, which further highlights the insights into volatility and abrupt movements. DSH leads with the highest average value of
, while LTC and EOS follow with values of
and
, respectively. Conversely, the lowest average value of
is noted for CAD, with JPY and EUR following at
and
, respectively. Across the board, all cryptocurrency markets exhibit higher jump volatility than forex markets, with DSH particularly showing the highest volatility. Additionally, the skewness values for all jump series are positive, indicating a leptokurtic behavior. This situation implies that the extreme upward movements are higher than the extreme downward movements within these jumps, indicating significant asymmetric behavior. As a result, investors may find opportunities for momentum or speculative trading strategies. However, tail-risk management and volatility premiums should also be considered; and hedging and diversification strategies might help mitigate the risks of sharp price swings.
Table 2.
Descriptive statistics of the jumps of cryptocurrency and forex markets.
Figure 3 and Figure 4 illustrate the movements of jumps in cryptocurrency and forex markets. A significant change was first noted on 13 March 2020, across nearly all cryptocurrencies. This incident resulted in the cryptocurrency market losing almost 50% of its total market capitalization, leading to a sharp decline in the capitalization value and prices of key cryptocurrencies [121]. Other notable studies [71,122,123,124] support the idea that this could be linked to the World Health Organization (WHO) officially declaring COVID-19 a pandemic. On 11 January 2021, a second notable peak was observed, possibly attributed to Bitcoin’s unprecedented increase of more than 400% from January 2020 to 11 January 2021, surpassing gains in traditional markets for the first time. According to Forbes, this surge was driven by institutional investments and was viewed as an inflationary hedge amid extensive monetary stimulus during the post-COVID-19 recovery phase (https://www.forbes.com/sites/michaeldelcastillo/2021/01/11/bitcoins-recent-surge-creates-new-billionaires/?sh=1fa043fd416c, (accessed on 20 August 2024)). Therefore, this exhibited remarkable growth and stimulated substantial institutional interest in the cryptocurrency market. The third significant spike on 19 May 2021 seems to have been triggered by the Chinese government’s crackdown on cryptocurrencies and Elon Musk’s tweet announcing Tesla’s suspension of Bitcoin payments, which heightened concerns over the environmental footprint of energy-intensive cryptocurrencies [125]. The next significant peak is observed on 7 September 2021, potentially influenced by El Salvador’s adoption of Bitcoin as a legal tender under the “Bitcoin Law”; allowing cryptocurrency to be used in various transactions, from buying a cup of coffee to paying off debts and taxes [126]. The jumps on 12 May 2022, and 15 June 2022, could be linked to the repercussions of Tether, the largest stablecoin, deviating from its dollar peg (https://www.cnbc.com/2022/05/12/bitcoin-btc-price-falls-below-27000-as-crypto-sell-off-intensifies.html, (accessed on 20 August 2024)). This event likely sparked concerns about market contagion and had repercussions for other cryptocurrencies. Lastly, the observed spikes in November 2022 could be traced back to the abrupt collapse of the cryptocurrency exchange FTX. This event had widespread repercussions across the cryptocurrency industry, leading to losses amounting to USD 9 billion (https://markets.businessinsider.com/news/currencies/ftx-bankruptcy-collapse-crypto-crash-3ac-celsius-terra-luna-chainalysis-2022-12, (accessed on 20 August 2024)) in crypto investments [127].
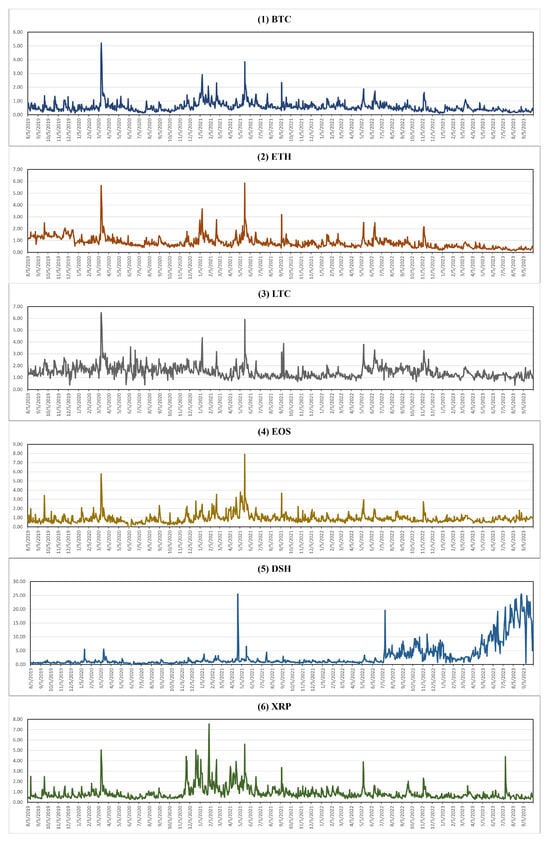
Figure 3.
Daily jump estimates of cryptocurrency markets derived from 5 min high-frequency data.
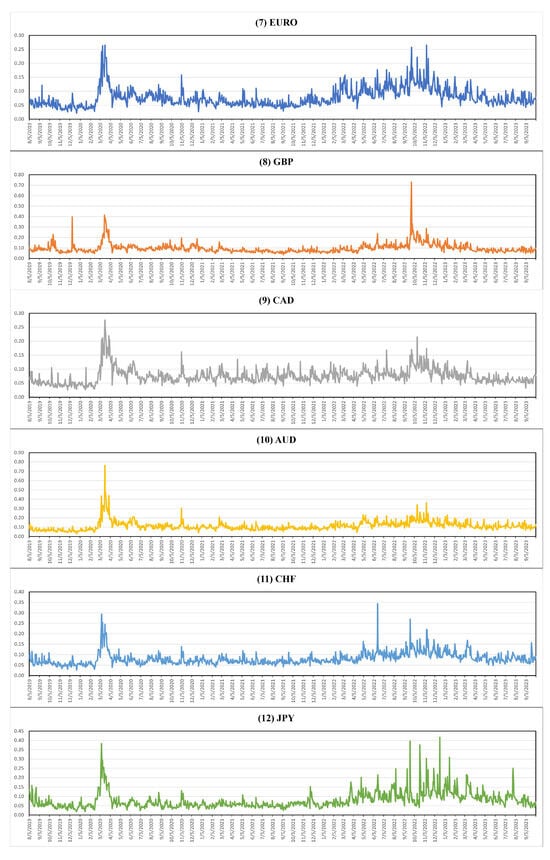
Figure 4.
Daily jump estimates of forex markets derived from 5 min high frequency data.
In forex markets, the initial spikes between March 2020 and November 2020 were observed across nearly all markets, which could be linked to the impact of COVID-19, as indicated by numerous studies [44,128,129]. Following that, more pronounced spikes were observed from September 2022 to November 2022, which was especially noticeable for EURO, GBP, CHF, and JPY. This surge might be linked to the GBP crash, which plummeted to a 37-year low (https://edition.cnn.com/2022/09/16/investing/british-pound-low, (accessed on 20 August 2024)) after the announcement of implementing the most extensive tax cuts in 50 years (https://edition.cnn.com/2022/09/25/business/british-pound-drops-record-low-intl-hnk/index.html, (accessed on 20 August 2024)).
4. Methodology
The methodology section comprises two main approaches: the MinRV-based jump detection method and the MFDFA. We begin by extracting the discontinuous part of volatility, referred to as jumps, from RV. Although there are several techniques for identifying jumps in financial time series, the MinRV-based jump method is noted for its resilience to microstructure noise [130]. Once the jump component is extracted, the MFDFA, which is derived from DFA, is utilized to investigate the long-term memory properties of these jumps.
4.1. MinRV-Based Jump Detection Method
We start by outlining the detailed steps involved in the following methodology for analyzing the jumps in cryptocurrency and forex markets.
Firstly, we compute the RVs following Andersen et al. [75]’s method. To do this, the intraday returns
are calculated for each cryptocurrency, as well as the currency exchange market time series
and the trading day
.
where
represents the
price of each market time series
on day
,
indicates the 5 min lag price on day
,
denotes the number of high-frequency return observations in a day
, and the number of trading days in a year is indicated by
. Then, the realized variance
, on any given day
can be calculated as:
Following this, the
on any day
is estimated as:
Secondly, we extract the realized jumps from
. The measure of
is actually designed to quantify the total quadratic variation, including the effects of cumulative squared jumps in the observed return time series data. In contrast, the measure of integrated variance (IV) only captures the continuous component of this quadratic variation. As a result, the difference between these measures, i.e.,
and IV, quantifies the realized jumps. Conventionally, IV is estimated through the measures of bipower variation (BPV) and tripower variation (TPV) from Barndorff-Nielsen [74] or the multi-power variation (MPV). This study, however, utilizes a different approach: the
measure, proposed by Andersen et al. [73]. The
method employs a nearest neighbor reduction/truncation approach to enhance robustness to market microstructure noise, trimming absolute returns at levels set by neighboring returns. To be more specific, we utilized a one-sided truncation method, where each intraday return is compared to the subsequent absolute return.
Finally, the realized jumps are extracted as:
4.2. Multifractal Detrended Fluctuation Analysis—MFDFA
Following the extraction of jumps from RV, we apply MFDFA on those jumps to explore their multifractal characteristics. Various studies have used MFDFA not only for detecting multifractality but also for ranking its strength, which in return provides significant insights into market efficiency. In accordance with Kantelhardt et al. [40], the steps of the MFDFA method are outlined below:
Step 1: Take a time series
with the length
, and compute the profile
or cumulative sum, by summing the deviations of the series from its mean. Through this, the time series is transformed into a “random walk”, making it easier to identify trends and scaling behavior.
where
the subtraction of
is to ensure that the series has a zero mean, but it can be skipped as it gets canceled out in the third step.
Step 2: Segment the profile
into non-overlapping sections of
; each section with an equal length of
. Because of the potential non-divisibility of
by
, a residual section could remain at the end of the series. Hence, to encompass the entire profile, repeat the segmentation process from the opposite direction, leading to
sections in total.
Step 3: Employ the least-squares fitting to determine the local trend within each section. Afterward, compute the variance for
.
For
, compute the variance as:
where
represents the local trend of segment
obtained through an order of polynomial. The choice of order determines the degree of the polynomial and controls how local trends are captured. In practice, a linear polynomial, also known as DFA1, is used but quadratic (DFA2), cubic (DFA3) or even higher-order polynomials can also be applied to remove more complex trends.
Step 4: Calculate the
th order fluctuation function by averaging all section values:
where order
can take any real value. The original DFA technique is obtained for
. As we apply MFDFA to examine the dependence of the fluctuation function on scale
for various
values. Hence, steps 2–4 are repeated for various time scales
. Following a normal practice, we limit the values of
to be between
to
.
Step 5: Analyze the
plots
vs.
for every
value to assess the scaling value of fluctuation functions. If
exhibits long-range power-law correlations,
will scale with
, according to:
Typically, the measure
, known as the Hurst exponent, varies with
. The constant values of
at all
represent mono-fractality, while variability suggests multifractality. For
, the values of
denote the persistence behavior. For instance,
indicates the persistence behavior,
means anti-persistence, while
implies the random walk behavior.
Lastly, relate the multifractal scaling exponent
to
as:
where
is the fractal dimension of the geometric objects, which is set as
in this case. Thus,
reflects the scale-dependency of both small and large fluctuations. For multifractal series,
exponent increases nonlinearly with
. Next, we calculate the multifractal spectrum
through the Legendre transform of
:
where
measures the dimension of the time series. For mono-fractal time series,
is a delta function with only one value of
. For multifractal time series, there is a distribution of
values. The measures of
and
, defined as
and
, respectively, quantify the degree of multifractality.
5. Results
This section deals with the findings derived from MFDFA to identify the complex, multifractal and scaling patterns of jumps present in cryptocurrency and forex markets. Figure 5 and Figure 6 display the MFDFA results for each cryptocurrency and forex jump series. Each series consists of four major plots: the top-left quadrant depicts the fluctuation function in relation to the time scale, with data points for
; the top-right quadrant shows the generalized Hurst exponent
; the bottom-left quadrant presents the Renyi exponent
; and the bottom-right quadrant displays the multifractal spectrum
. In the top-left quadrant, the log–log plots feature fitted lines that indicate a higher fluctuation function value, which corresponds to increased volatility complexity. The non-constant nature of the generalized Hurst exponent
across different
values confirm the multifractality of the jump series. Additionally, the concave and hump-shaped patterns in the Renyi exponent
and multifractal spectrum
plots corroborate that all jumps in cryptocurrency and forex markets are multifractal processes.
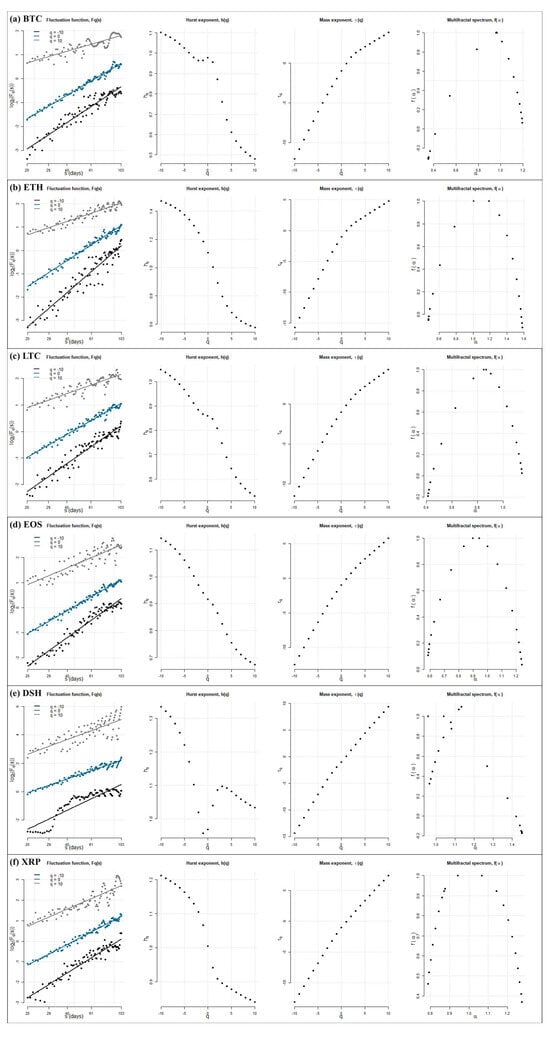
Figure 5.
This figure presents the MFDFA outcomes pertaining to the jumps observed in cryptocurrency markets. In the (top-left) section, fluctuation functions for q = 10, q = 0, and q = −10 are displayed. The (top-right) segment illustrates the GHE corresponding to each q value. Additionally, the (bottom-left) section showcases the Mass exponent, τ(q), while the (bottom-right) portion presents the Multifractal Spectrum.
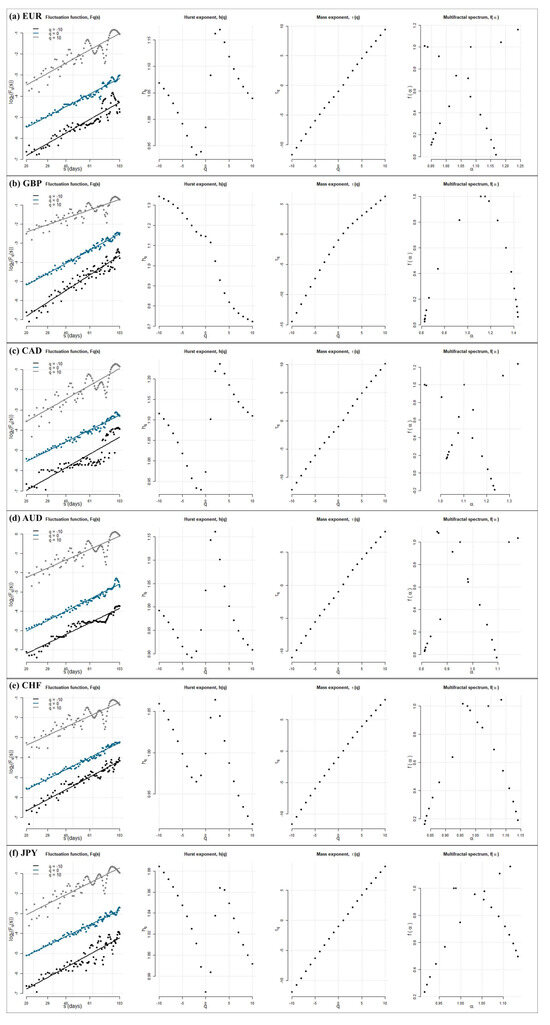
Figure 6.
This figure presents the MFDFA outcomes pertaining to the jumps observed in forex markets. In the (top-left) section, fluctuation functions for q = 10, q = 0, and q = −10 are displayed. The (top-right) segment illustrates the GHE corresponding to each q value. Additionally, the (bottom-left) section showcases the Mass exponent, τ(q), while the (bottom-right) portion presents the Multifractal Spectrum.
To further investigate multifractality, Table 3 provides
values from
to
. Negative
values reflect smaller fluctuations in jumps, whereas positive
values denote larger fluctuations. A market is generally considered to exhibit multifractal behavior if
varies across the entire
range from
; otherwise, it is considered mono-fractal. As illustrated in Table 3, the
values for all jumps exhibit significant variability, indicating multifractality in all jump series. For example, BTC results show that
peaks at
for
, decreases to
for
, and further declines to
for
. This marked reduction in
underscores its dependence on
, suggesting the presence of multifractality in the time fluctuations of BTC jumps. Similar downward patterns are evident in other cryptocurrency and forex market jumps, with some variations among them.
Table 3.
Generalized Hurst exponents ranging from q = −10 to q = 10 for the jumps of cryptocurrency and forex markets.
The width or range of Hurst exponent
is estimated by
across
, which implies the degree or strength of multifractality. Higher multifractality in the jumps is indicated by higher
values, which also signifies lower efficiency. As indicated in Table 3, among all the examined cryptocurrencies and currency exchange markets, DSH exhibits the highest multifractal patterns with the
value of
, followed by CAD
and EURO
. Conversely, LTC
, BTC
, and EOS
display the lowest multifractal characteristics. Regarding the cryptocurrency market alone, DSH
has the highest multifractal patterns, while the lowest multifractal patterns are noted for LTC
, followed by BTC
and EOS
. However, the multifractal levels of XRP and ETH are almost identical, i.e.,
. Concerning currency exchange markets exclusively, the strongest multifractal characteristics are observed for the jumps of CAD
, followed closely by EURO
, while AUD
and CHF
demonstrate comparatively lower levels of multifractality. However, JPY and GBP exhibit similar degrees of multifractality
. These observations are substantiated by the width of the multifractal spectrum
and fractal dimension values, which are presumably detailed in the last rows of Table 3.
Furthermore, the classical Hurst exponent
serves as a critical metric to discern persistent or anti-persistent tendencies, which are essential markers of multifractality. In both cryptocurrency and forex markets, all examined jump series exhibit
values above
, indicating persistent behavior or positive autocorrelation. This suggests that a positive or negative jump is more likely to be followed by another positive or negative jump in subsequent periods within these markets.
We further extend our findings to the application of the rolling-window approach on the MFDFA to delve into the time-varying characteristics of the multifractality of jumps in cryptocurrencies and forex markets. It is essential to select a suitable length of the window [131,132], since an overly large window smooths out the progression of scaling exponents and facilitates the observation of major events. However, this may obscure the impact of short-term market dynamics, and fail to capture the short-term evolution of events because the economic cycles and seasonal pressures might cause the estimated parameters to lose specificity. In contrast, a shorter window length causes substantial fluctuations in short-term parameters and, as a result, complicates the identification of trends. Therefore, we follow Lee et al. [133] and Zhuang et al. [134] and select a rolling window of 250 days, which is roughly equivalent to one year. The first 250 days are used to calculate the Hurst exponent
of the MFDFA for a single jump series in cryptocurrency and forex markets. The window then shifts forward by removing the first observation and adding a new one at the end, and this procedure is repeated until the entire series is processed. Through these methods, we aim to reveal the persistent behavior of multifractal dynamics over time, offering insights into the evolving nature of jump dynamics and their implications for trading and risk management strategies.
The dynamic evolution of Hurst exponent
for the MFDFA is presented in Figure 7 and Figure 8 for all the univariate jump series of cryptocurrencies and currency exchange rates. For exclusively cryptocurrency jumps, nearly all, except for EOS, demonstrated anti-persistent behavior from May 2022 to September 2022. However, in the forex market, EURO, GBP, and JPY exhibited the Hurst exponent
values above
throughout the observed timeframe, indicating persistent behavior. However, CAD displayed stability from May 2021 to June 2022. On the other hand, AUD and CHF had Hurst exponent
values below
from February 2022 to March 2022, and from July 2021 to September 2021, respectively, suggesting anti-persistent behavior during these periods.
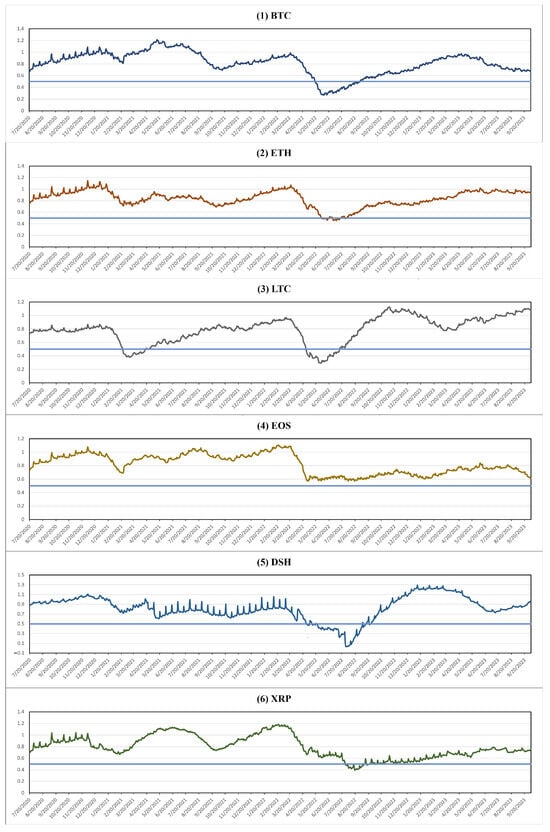
Figure 7.
Dynamic Hurst exponent evolution of the jumps of cryptocurrencies (, and
).
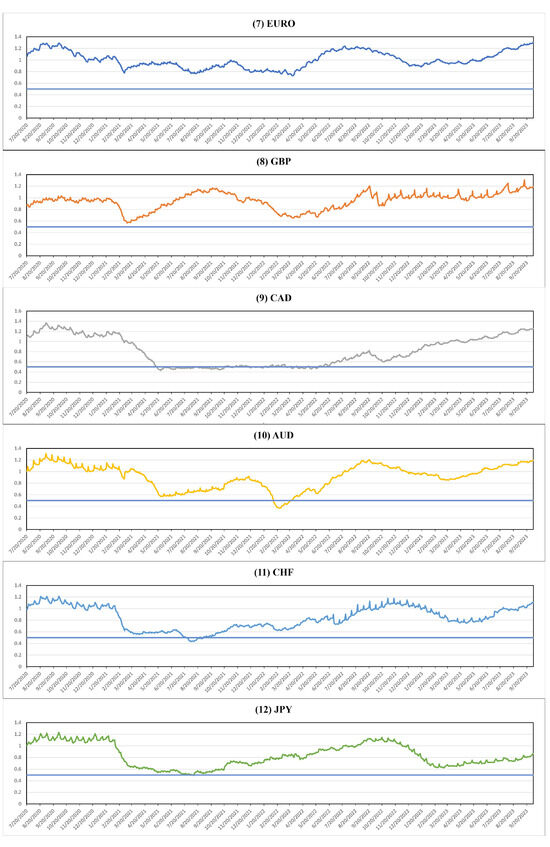
Figure 8.
Dynamic Hurst exponent evolution of the jumps of forex markets (, and
).
6. Conclusions and Discussion
The complex behavior of overall volatility is categorized into two major components, known as bad volatility and good volatility. The sudden dramatic movements, often called jumps, are responsible for the bad volatility; while the typical fluctuations represent continuous or normal volatility [23,135]. In today’s world of uncertainty, jumps deserve particular attention when navigating market dynamics and complexities [29,136]. For example, cryptocurrencies, which are modern decentralized currencies, are highly characterized by their speculative nature [137,138], explosive behavior [139], and tendency to exhibit jumps [140]. In addition to these, they are relatively immature [141], highly dependent on sentiment and hype [142,143], and attractive to irrational investors [144]. Given these unique characteristics, this study delves into examining the long memory of jumps within a multifractal background, with a specific focus on major cryptocurrencies and forex markets.
We begin the analysis by taking the 5 min high-frequency returns of six major cryptocurrencies—including Bitcoin, Ethereum, Litecoin, Dashcoin, EOS, and Ripple—as well as six highly traded forex exchange rates: Euro, British pound, Canadian dollar, Australian dollar, Swiss franc, and Japanese yen, against the US dollar. The dataset spans from 4 August 2019 to 4 October 2023, which provides an extensive view of market dynamics in both markets. These high-frequency intraday returns are then subjected to a robust MinRV-based realized jump detection method for the extraction of daily jumps. Following this, the MFDFA is applied to those extracted jump components to explore their multifractal patterns in 12 individual jump series containing six cryptocurrencies and six forex exchange rates.
The findings of this study confirm the significant presence of multifractal patterns in all of the 12 jump series of cryptocurrencies and forex markets. However, there are remarkable differences in the strength of these patterns. These variations could be attributed to the differences in legal status by the government, economic frameworks, risk levels, and shifts in monetary or macroeconomic policies that impact both cryptocurrencies and forex markets. For instance, we find Dashcoin has the highest multifractal characteristics, followed by Bitcoin and Litecoin, which display the lowest multifractality in the overall analyzed jump series. Similarly, within cryptocurrencies only, Dashcoin has the highest multifractality, whereas Litecoin has the lowest. Conversely, within the forex market only, the Canadian dollar displays the highest multifractal characteristics, while the Australian dollar exhibits the lowest.
There might be several factors influencing the highest multifractality in the jumps of Dashcoin compared to the overall jump series data. For instance, the smaller market size could lead to enhanced volatility, particularly in upward market trends and price surges. As has been found by Kakinaka et al. [145], where they argue that increased volatility in smaller cryptocurrencies could be attributed to their smaller market sizes as well as the presence of uninformed traders. These traders are usually driven by their speculative motives, which amplify the market volatility and make it difficult for informed traders to counteract these effects. In addition, the instant transaction feature (InstantSend) of Dashcoin is another reason that attracts traders looking for rapid trade executions and, in return, increases market activity and volatility [146]. Furthermore, Dashcoin is the only currency that focuses on privacy through masternodes to ensure the high anonymity of a trader. This, however, attracts illicit activities, as highlighted by Wątorek et al. [72]. Therefore, the frequent and rapid price and volume fluctuations and special privacy features might contribute to the higher multifractal patterns in the jumps of Dashcoin.
On the other hand, Litecoin jumps display the lowest multifractal characteristics, with Bitcoin following closely. Several factors may contribute to this. Historically, the relationship between Litecoin to Bitcoin has been seen as analogous to that of silver and gold, even after the launch of many new coins and tokens [147]. One possible factor could also be the relatively passive nature of the Litecoin community, as noted by Lansiaux et al. [148]. Unlike other cryptocurrencies, Litecoin users are less active on social media and less likely to engage in coordinated buying, which would have led to sudden market jumps. Additionally, Katsiampa [149] observes that traders tend to pay less attention to news affecting Litecoin compared to other cryptocurrencies, which might also result in lower market volatility and multifractality. Al-Yahyaee et al. [150] further suggest that the lower multifractal patterns in Litecoin and Bitcoin are also due to the positive relationship between liquidity and market efficiency, where higher liquidity enhances the efficiency of these markets.
The results also indicate that all of the jumps in cryptocurrencies and forex markets exhibit persistent behavior or positive autocorrelation, implying that a positive or negative jump in one period is likely to be followed by another positive or negative jump in the following period. These findings are supported by Bariviera [151], Al-Yahyaee et al. [152], Caporale et al. [153], Bouri et al. [154], Jiang et al. [155], Aslam et al. [156], among others. Such patterns could potentially inform traders in forming trading strategies to yield abnormal returns in these markets.
In addition to the time-varying characteristics of persistent behavior, the results of the rolling window indicate that forex markets predominantly exhibited persistent behavior throughout the sample period. In contrast, the cryptocurrency jumps showed anti-persistent behavior between May 2022 and September 2022. This trend may result from several negative reports and anticipated regulatory actions. For instance, in early 2022, speculation was made about Russia possibly banning cryptocurrency activities. Following the Ukraine invasion, there were demands for exchanges to cease Russian transactions. The market experienced a loss of USD 1 trillion over five weeks starting in May 2022, with Bitcoin falling below USD 29,000, its lowest level in 16 months (https://www.aa.com.tr/en/economy/bitcoin-digital-currencies-crash-in-2022-crypto-winter-amid-crises-turmoil-bankruptcies/2776010, (accessed on 20 August 2024)). Likewise, TerraUSD (UST), a stablecoin designed to maintain parity with the US dollar, fell below USD 0.26 on May 11, causing widespread investor concern [157]. In addition, Binance, a leading global cryptocurrency exchange, suspended bitcoin withdrawals in June 2022, attributing the action to a backlog caused by a “stuck transaction.” Meanwhile, Celsius Network, a prominent US cryptocurrency lending firm, halted withdrawals and transfers, citing “extreme” circumstances. In November 2022, cryptocurrency exchange FTX went bust [158].
The abovementioned results and discussion have various key recommendations and policy implications that might substantially impact regulatory measures and financial decision-making. Firstly, the presence of jumps in cryptocurrencies and forex exchange rates indicates that market participants and academicians should incorporate jumps when modeling asset pricing and option models to enhance their accuracy. Considering jumps as tail risk could also improve the robustness and predictive power of asset pricing models. Secondly, the presence of multifractal characteristics in jumps reveals the inefficiency of these markets, which challenges the traditional financial model’s reliance on the random walk hypothesis. This scenario calls for reevaluation of financial decisions based on these models, especially in light of observed multifractal patterns and market inefficiencies. In addition, linear models based on OLS, correlation, and vector regression techniques may not appropriately capture these jump dynamics. Hence, regulators and policymakers should implement more sophisticated non-linear models to closely monitor these markets and develop strategies that mitigate the risks and enhance the efficiency and transparency of these markets. Thirdly, the inefficiencies of these markets may also be attributed to their predictability, where investors and risk managers can better assess the likelihood of extreme events and adjust their exposure to risky markets. Fourthly, the presence of jumps in forex markets may affect the volatility risk premiums, which have a greater impact on funding costs for nations dependent on foreign financing sources. Therefore, developing jump-adjusted trading strategies can help navigate market complexities and leverage opportunities arising from jumps.
This study can be further extended by examining the multifractality of not only jumps but also co-jumps. Future studies might also focus on investigating the inner mechanism of jumps spread across different markets and how it affects regulatory actions. Exploring the sources of multifractality in jumps or how the multifractality changes over different frequencies would be interesting to examine in the future. By delving deeper into these aspects, future research can contribute significantly to advancing the knowledge of market dynamics, risk management strategies, and the expansion of more vigorous financial methodologies that capture the complexities of jumps and multifractal behavior.
Author Contributions
Conceptualization, H.A., M.A., F.A. and P.F.; methodology, H.A., M.A., F.A. and P.F.; formal analysis, H.A., M.A., F.A. and P.F.; resources, H.A., M.A., F.A. and P.F.; data curation, H.A., M.A., F.A. and P.F.; writing—original draft preparation, H.A., M.A., F.A. and P.F.; writing—review and editing, H.A., M.A., F.A. and P.F. All authors have read and agreed to the published version of the manuscript.
Funding
Faheem Aslam and Paulo Ferreira would like to acknowledge the financial support of the National Funds provided by FCT—Foundation for Science and Technology to VALORIZA-Research Center for Endogenous Resource Valorization (grant UIDB/05064/2020).
Data Availability Statement
Dataset available on request from the authors.
Conflicts of Interest
The authors declare no conflicts of interest.
References
- Gkillas, K.; Gupta, R.; Wohar, M.E. Volatility Jumps: The Role of Geopolitical Risks. Financ. Res. Lett. 2018, 27, 247–258. [Google Scholar] [CrossRef]
- Caldara, D.; Iacoviell, M. Measuring Geopolitical Risk. Am. Econ. Rev. 2022, 112, 1194–1225. [Google Scholar] [CrossRef]
- Bissoondoyal-Bheenick, E.; Brooks, R.; Do, H.X. Jump Connectedness in the European Foreign Exchange Market. In Advances in Econometrics, Operational Research, Data Science and Actuarial Studies; Contributions to Economics; Springer: Cham, Switzerland, 2022. [Google Scholar]
- Baker, S.R.; Bloom, N.; Davis, S.J.; Sammon, M. What Triggers Stock Market Jumps? SSRN Electron. J.; NBER working paper 28687. Available online: https://www.nber.org/papers/w28687 (accessed on 20 August 2024).
- Gao, Y.; Zhao, C.; Sun, B.; Zhao, W. Effects of Investor Sentiment on Stock Volatility: New Evidences from Multi-Source Data in China’s Green Stock Markets. Financ. Innov. 2022, 8, 77. [Google Scholar] [CrossRef] [PubMed]
- Alqahtani, A.; Selmi, R.; Hongbing, O. The Financial Impacts of Jump Processes in the Crude Oil Price: Evidence from G20 Countries in the Pre- and Post-COVID-19. Resour. Policy 2021, 72, 102075. [Google Scholar] [CrossRef]
- Conlon, T.; Corbet, S.; Hou, Y.G. Contagion Effects of Permissionless, Worthless Cryptocurrency Tokens: Evidence from the Collapse of FTX. J. Int. Financ. Mark. Inst. Money 2024, 91, 101940. [Google Scholar] [CrossRef]
- Tong, Y.; Wan, N.; Dai, X.; Bi, X.; Wang, Q. China’s Energy Stock Market Jumps: To What Extent Does the COVID-19 Pandemic Play a Part? Energy Econ. 2022, 109, 105937. [Google Scholar] [CrossRef]
- Diaconaşu, D.E.; Mehdian, S.M.; Stoica, O. The Reaction of Financial Markets to Russia’s Invasion of Ukraine: Evidence from Gold, Oil, Bitcoin, and Major Stock Markets. Appl. Econ. Lett. 2023, 30, 2792–2796. [Google Scholar] [CrossRef]
- Karkowska, R.; Urjasz, S. How Does the Russian-Ukrainian War Change Connectedness and Hedging Opportunities? Comparison between Dirty and Clean Energy Markets versus Global Stock Indices. J. Int. Financ. Mark. Inst. Money 2023, 85, 101768. [Google Scholar] [CrossRef]
- Akyildirim, E.; Conlon, T.; Corbet, S.; Goodell, J.W. Understanding the FTX Exchange Collapse: A Dynamic Connectedness Approach. Financ. Res. Lett. 2023, 53, 103643. [Google Scholar] [CrossRef]
- Jalan, A.; Matkovskyy, R. Systemic Risks in the Cryptocurrency Market: Evidence from the FTX Collapse. Financ. Res. Lett. 2023, 53, 103670. [Google Scholar] [CrossRef]
- Zhang, C. Testing for Self-Exciting Jumps in Bitcoin Returns. SSRN Electron. J. 2020. Available online: https://papers.ssrn.com/sol3/papers.cfm?abstract_id=3686237 (accessed on 20 August 2024).
- Choi, K.; Yu, W.C.; Zivot, E. Long Memory versus Structural Breaks in Modeling and Forecasting Realized Volatility. J. Int. Money Financ. 2010, 29, 857–875. [Google Scholar] [CrossRef]
- Degiannakis, S.; Floros, C. Intra-Day Realized Volatility for European and USA Stock Indices. Glob. Financ. J. 2016, 29, 24–41. [Google Scholar] [CrossRef]
- Oh, G.; Kim, S.; Eom, C. Long-Term Memory and Volatility Clustering in High-Frequency Price Changes. Phys. A Stat. Mech. Its Appl. 2008, 387, 1247–1254. [Google Scholar] [CrossRef]
- Maasoumi, E.; McAleer, M. Realized Volatility and Long Memory: An Overview. Econ. Rev. 2008, 27, 1–9. [Google Scholar] [CrossRef]
- Tian, Y.; Shi, D.; Li, H. The Long Memory of the Jump Intensity of the Price Process. J. Math. Financ. 2021, 11, 176–189. [Google Scholar] [CrossRef]
- Corsi, F.; Ren, R. Volatility Forecasting: The Jumps Do Matter; Global COE Hi-Stat Discussion Paper Series gd08-036; Institute of Economic Research, Hitotsubashi University: Tokyo, Japan, 2008; pp. 1–35. [Google Scholar]
- Andersen, T.G.; Bollerslev, T.; Diebold, F.X. Roughing It up: Including Jump Components in the Measurement, Modeling, and Forecasting of Return Volatility. Rev. Econ. Stat. 2007, 89, 701–720. [Google Scholar] [CrossRef]
- Busch, T.; Christensen, B.J.; Nielsen, M.Ø. The Role of Implied Volatility in Forecasting Future Realized Volatility and Jumps in Foreign Exchange, Stock, and Bond Markets. J. Econom. 2011, 160, 48–57. [Google Scholar] [CrossRef]
- Forsberg, L.; Ghysels, E. Why Do Absolute Returns Predict Volatility so Well? J. Financ. Econom. 2007, 5, 31–67. [Google Scholar] [CrossRef]
- Giot, P.; Laurent, S. The Information Content of Implied Volatility in Light of the Jump/Continuous Decomposition of Realized Volatility. J. Futures Mark. 2007, 27, 337–359. [Google Scholar] [CrossRef]
- Shalen, C.T. Volume, Volatility, and the Dispersion of Beliefs. Rev. Financ. Stud. 1993, 6, 405–435. [Google Scholar] [CrossRef]
- Wang, J. A Model of Competitive Stock Trading Volume. J. Political Econ. 1994, 102, 127–168. [Google Scholar] [CrossRef]
- Hawkes, A.G. Spectra of Some Self-Exciting and Mutually Exciting Point Processes. Biometrika 1971, 58, 83–90. [Google Scholar] [CrossRef]
- Hawkes, A.G. Point Spectra of Some Mutually Exciting Point Processes. J. R. Stat. Soc. Ser. B Stat. Methodol. 1971, 33, 438–443. [Google Scholar] [CrossRef]
- Hawkes, A.G.; Oakes, D. A Cluster Process Representation of a Self-Exciting Process. J. Appl. Probab. 1974, 11, 493–503. [Google Scholar] [CrossRef]
- Aït-Sahalia, Y.; Cacho-Diaz, J.; Laeven, R.J.A. Modeling Financial Contagion Using Mutually Exciting Jump Processes. J. Financ. Econ. 2015, 117, 585–606. [Google Scholar] [CrossRef]
- Fulop, A.; Li, J.; Yu, J. Self-Exciting Jumps, Learning, and Asset Pricing Implications. Rev. Financ. Stud. 2015, 28, 876–912. [Google Scholar] [CrossRef]
- Carr, P.; Wu, L. Leverage Effect, Volatility Feedback, and Self-Exciting Market Disruptions. J. Financ. Quant. Anal. 2017, 52, 2119–2156. [Google Scholar] [CrossRef]
- Ali, H.; Aslam, F.; Ferreira, P. Modeling Dynamic Multifractal Efficiency of Us Electricity Market. Energies 2021, 14, 6145. [Google Scholar] [CrossRef]
- Fu, Z.; Niu, H.; Wang, W. Market Efficiency and Cross-Correlations of Chinese New Energy Market with Other Assets: Evidence from Multifractality Analysis. Comput. Econ. 2023, 62, 1287–1311. [Google Scholar] [CrossRef]
- Mensi, W.; Vo, X.V.; Kang, S.H. Upside-Downside Multifractality and Efficiency of Green Bonds: The Roles of Global Factors and COVID-19. Financ. Res. Lett. 2021, 43, 101995. [Google Scholar] [CrossRef]
- Barunik, J.; Aste, T.; Di Matteo, T.; Liu, R. Understanding the Source of Multifractality in Financial Markets. Phys. A Stat. Mech. Its Appl. 2012, 391, 4234–4251. [Google Scholar] [CrossRef]
- Fama, E.F. Efficient Market Hypothesis: A Review of Theory and Empirical Work. J. Financ. 1970, 25, 28–30. [Google Scholar] [CrossRef]
- Peters, E.E. Chaos and Order in the Capital Markets: A New View of Cycles, Prices, and Market Volatility. J. Financ. 1993, 48, 2041–2044. [Google Scholar] [CrossRef]
- Hurst, H.E. Long-Term Storage Capacity of Reservoirs. Trans. Am. Soc. Civ. Eng. 1951, 116, 770–799. [Google Scholar] [CrossRef]
- Peng, C.K.; Buldyrev, S.V.; Havlin, S.; Simons, M.; Stanley, H.E.; Goldberger, A.L. Mosaic Organization of DNA Nucleotides. Phys. Rev. E 1994, 49, 1685. [Google Scholar] [CrossRef]
- Kantelhardt, J.W.; Zschiegner, S.A.; Koscielny-Bunde, E.; Havlin, S.; Bunde, A.; Stanley, H.E. Multifractal Detrended Fluctuation Analysis of Nonstationary Time Series. Phys. A Stat. Mech. Appl. 2002, 316, 87–144. [Google Scholar] [CrossRef]
- da Silva Filho, A.C.; Maganini, N.D.; de Almeida, E.F. Multifractal Analysis of Bitcoin Market. Phys. A Stat. Mech. Appl. 2018, 512, 954–967. [Google Scholar] [CrossRef]
- Mnif, E.; Jarboui, A.; Mouakhar, K. How the Cryptocurrency Market Has Performed during COVID 19? A Multifractal Analysis. Financ. Res. Lett. 2020, 36, 101647. [Google Scholar] [CrossRef]
- Shao, Y.H.; Xu, H.A.N.; Liu, Y.L.; Xu, H.C. Multifractal Behavior of Cryptocurrencies before and during Covid-19. Fractals 2021, 29, 2150132. [Google Scholar] [CrossRef]
- Aslam, F.; Aziz, S.; Nguyen, D.K.; Mughal, K.S.; Khan, M. On the Efficiency of Foreign Exchange Markets in Times of the COVID-19 Pandemic. Technol. Forecast. Soc. Chang. 2020, 161, 120261. [Google Scholar] [CrossRef]
- Han, C.; Wang, Y.; Ning, Y. Comparative Analysis of the Multifractality and Efficiency of Exchange Markets: Evidence from Exchange Rates Dynamics of Major World Currencies. Phys. A Stat. Mech. Appl. 2019, 535, 122365. [Google Scholar] [CrossRef]
- Shahzad, S.J.H.; Hernandez, J.A.; Hanif, W.; Kayani, G.M. Intraday Return Inefficiency and Long Memory in the Volatilities of Forex Markets and the Role of Trading Volume. Phys. A Stat. Mech. Appl. 2018, 506, 433–450. [Google Scholar] [CrossRef]
- Aslam, F.; Ferreira, P.; Ali, H.; Kauser, S. Herding Behavior during the Covid-19 Pandemic: A Comparison between Asian and European Stock Markets Based on Intraday Multifractality. Eurasian Econ. Rev. 2022, 12, 333–359. [Google Scholar] [CrossRef]
- Aslam, F.; Ferreira, P.; Mohti, W. Investigating Efficiency of Frontier Stock Markets Using Multifractal Detrended Fluctuation Analysis. Int. J. Emerg. Mark. 2023, 18, 1650–1676. [Google Scholar] [CrossRef]
- Aslam, F.; Ferreira, P.; Mughal, K.S.; Bashir, B. Intraday Volatility Spillovers among European Financial Markets during COVID-19. Int. J. Financ. Stud. 2021, 9, 5. [Google Scholar] [CrossRef]
- Stosic, T.; Nejad, S.A.; Stosic, B. Multifractal Analysis of Brazilian Agricultural Market. Fractals 2020, 28, 2050076. [Google Scholar] [CrossRef]
- Baumöhl, E. Are Cryptocurrencies Connected to Forex? A Quantile Cross-Spectral Approach. Financ. Res. Lett. 2019, 29, 363–372. [Google Scholar] [CrossRef]
- Böhme, R.; Christin, N.; Edelman, B.; Moore, T. Bitcoin: Economics, Technology, and Governance. J. Econ. Perspect. 2015, 29, 213–238. [Google Scholar] [CrossRef]
- Qureshi, S.; Aftab, M.; Bouri, E.; Saeed, T. Dynamic Interdependence of Cryptocurrency Markets: An Analysis across Time and Frequency. Phys. A Stat. Mech. Appl. 2020, 559, 125077. [Google Scholar] [CrossRef]
- Manavi, S.A.; Jafari, G.; Rouhani, S.; Ausloos, M. Demythifying the Belief in Cryptocurrencies Decentralized Aspects. A Study of Cryptocurrencies Time Cross-Correlations with Common Currencies, Commodities and Financial Indices. Phys. A Stat. Mech. Appl. 2020, 556, 124759. [Google Scholar] [CrossRef]
- Gnabo, J.Y.; Lahaye, J.; Laurent, S.; Lecourt, C. Do Jumps Mislead the FX Market? Quant Financ. 2012, 12, 1521–1532. [Google Scholar] [CrossRef]
- Ausloos, M. Statistical Physics in Foreign Exchange Currency and Stock Markets. Phys. A Stat. Mech. Appl. 2000, 285, 48–65. [Google Scholar] [CrossRef]
- Drozdz, S.; Kwapień, J.; Oświȩcimka, P.; Rak, R. The Foreign Exchange Market: Return Distributions, Multifractality, Anomalous Multifractality and the Epps Effect. New J. Phys. 2010, 12, 105003. [Google Scholar] [CrossRef]
- Xu, Z.; Gençay, R. Scaling, Self-Similarity and Multifractality in FX Markets. Phys. A Stat. Mech. Appl. 2003, 323, 578–590. [Google Scholar] [CrossRef]
- Berger, D.; Chaboud, A.; Hjalmarsson, E. What Drives Volatility Persistence in the Foreign Exchange Market? J. Financ. Econ. 2009, 94, 192–213. [Google Scholar] [CrossRef]
- Tabak, B.M.; Cajueiro, D.O. Assessing Inefficiency in Euro Bilateral Exchange Rates. Phys. A Stat. Mech. Appl. 2006, 367, 319–327. [Google Scholar] [CrossRef]
- Gębarowski, R.; Oświęcimka, P.; Wątorek, M.; Drożdż, S. Detecting Correlations and Triangular Arbitrage Opportunities in the Forex by Means of Multifractal Detrended Cross-Correlations Analysis. Nonlinear Dyn. 2019, 98, 2349–2364. [Google Scholar] [CrossRef]
- Oh, G.; Eom, C.; Havlin, S.; Jung, W.S.; Wang, F.; Stanley, H.E.; Kim, S. A Multifractal Analysis of Asian Foreign Exchange Markets. Eur. Phys. J. B 2012, 85, 214. [Google Scholar] [CrossRef]
- Bouri, E.; Roubaud, D.; Shahzad, S.J.H. Do Bitcoin and Other Cryptocurrencies Jump Together? Q. Rev. Econ. Financ. 2020, 76, 396–409. [Google Scholar] [CrossRef]
- Baur, D.G.; Dimpfl, T. The Volatility of Bitcoin and Its Role as a Medium of Exchange and a Store of Value. Empir. Econ. 2021, 61, 2662–2683. [Google Scholar] [CrossRef]
- Urquhart, A.; Zhang, H. Is Bitcoin a Hedge or Safe Haven for Currencies? An Intraday Analysis. Int. Rev. Financ. Anal. 2019, 63, 49–57. [Google Scholar] [CrossRef]
- Chemkha, R.; BenSaïda, A.; Ghorbel, A. Connectedness between Cryptocurrencies and Foreign Exchange Markets: Implication for Risk Management. J. Multinatl. Financ. Manag. 2021, 59, 100666. [Google Scholar] [CrossRef]
- Shahzad, S.J.H.; Balli, F.; Naeem, M.A.; Hasan, M.; Arif, M. Do Conventional Currencies Hedge Cryptocurrencies? Q. Rev. Econ. Financ. 2022, 85, 223–228. [Google Scholar] [CrossRef]
- Corbet, S.; Meegan, A.; Larkin, C.; Lucey, B.; Yarovaya, L. Exploring the Dynamic Relationships between Cryptocurrencies and Other Financial Assets. Econ. Lett. 2018, 165, 28–34. [Google Scholar] [CrossRef]
- Dyhrberg, A.H. Bitcoin, Gold and the Dollar—A GARCH Volatility Analysis. Financ. Res. Lett. 2016, 16, 85–92. [Google Scholar] [CrossRef]
- Raza, S.A.; Ahmed, M.; Aloui, C. On the Asymmetrical Connectedness between Cryptocurrencies and Foreign Exchange Markets: Evidence from the Nonparametric Quantile on Quantile Approach. Res. Int. Bus. Financ. 2022, 61, 101627. [Google Scholar] [CrossRef]
- Drozdz, S.; Kwapień, J.; Oświecimka, P.; Stanisz, T.; Watorek, M. Complexity in Economic and Social Systems: Cryptocurrency Market at around COVID-19. Entropy 2020, 22, 1043. [Google Scholar] [CrossRef]
- Wątorek, M.; Drożdż, S.; Kwapień, J.; Minati, L.; Oświęcimka, P.; Stanuszek, M. Multiscale Characteristics of the Emerging Global Cryptocurrency Market. Phys. Rep. 2021, 901, 1–82. [Google Scholar] [CrossRef]
- Andersen, T.G.; Dobrev, D.; Schaumburg, E. Jump-Robust Volatility Estimation Using Nearest Neighbor Truncation. J. Econom. 2012, 169, 75–93. [Google Scholar] [CrossRef]
- Barndorff-Nielsen, O.E. Power and Bipower Variation with Stochastic Volatility and Jumps. J. Financ. Econom. 2004, 2, 1–37. [Google Scholar] [CrossRef]
- Andersen, T.G.; Bollerslev, T.; Diebold, F.X.; Labys, P. The Distribution of Realized Exchange Rate Volatility. J. Am. Stat. Assoc. 2001, 96, 42–55. [Google Scholar] [CrossRef]
- Lee, S.S.; Hannig, J. Detecting Jumps from Lévy Jump Diffusion Processes. J. Financ. Econ. 2010, 96, 271–290. [Google Scholar] [CrossRef]
- Lee, S.S.; Mykland, P.A. Jumps in Financial Markets: A New Nonparametric Test and Jump Dynamics. Rev. Financ. Stud. 2008, 21, 2535–2563. [Google Scholar] [CrossRef]
- Barndorff-Nielsen, O.E.; Shephard, N. Econometrics of Testing for Jumps in Financial Economics Using Bipower Variation. J. Financ. Econom. 2006, 4, 1–30. [Google Scholar] [CrossRef]
- Corsi, F.; Pirino, D.; Renò, R. Threshold Bipower Variation and the Impact of Jumps on Volatility Forecasting. J. Econ. 2010, 159, 276–288. [Google Scholar] [CrossRef]
- Huang, X.; Tauchen, G. The Relative Contribution of Jumps to Total Price Variance. J. Financ. Econom. 2005, 3, 456–499. [Google Scholar] [CrossRef]
- Aït-Sahalia, Y.; Jacod, J. Testing for Jumps in a Discretely Observed Process. Ann. Stat. 2009, 37, 184–222. [Google Scholar] [CrossRef]
- Podolskij, M.; Ziggel, D. New Tests for Jumps in Semimartingale Models. Stat. Inference Stoch. Process. 2010, 13, 15–41. [Google Scholar] [CrossRef]
- Jiang, G.J.; Oomen, R.C.A. Testing for Jumps When Asset Prices Are Observed with Noise-a “Swap Variance” Approach. J. Econ. 2008, 144, 352–370. [Google Scholar] [CrossRef]
- Maneesoonthorn, W.; Martin, G.M.; Forbes, C.S. High-Frequency Jump Tests: Which Test Should We Use? J. Econ. 2020, 219, 478–487. [Google Scholar] [CrossRef]
- Todorov, V.; Bollerslev, T. Jumps and Betas: A New Framework for Disentangling and Estimating Systematic Risks. J. Econ. 2010, 157, 220–235. [Google Scholar] [CrossRef]
- Lee, S.S.; Mykland, P.A. Jumps in Equilibrium Prices and Market Microstructure Noise. J. Econ. 2012, 168, 396–406. [Google Scholar] [CrossRef]
- Xue, Y.; Gençay, R.; Fagan, S. Jump Detection with Wavelets for High-Frequency Financial Time Series. Quant. Financ. 2014, 14, 1427–1444. [Google Scholar] [CrossRef]
- Peng, H.; Kitagawa, G.; Tamura, Y.; Xi, Y.; Qin, Y.; Chen, X. A Modeling Approach to Financial Time Series Based on Market Microstructure Model with Jumps. Appl. Soft Comput. J. 2015, 29, 40–51. [Google Scholar] [CrossRef]
- Yeung, J.F.K.A.; Wei, Z.-K.; Chan, K.Y.; Lau, H.Y.K.; Yiu, K.-F.C. Jump Detection in Financial Time Series Using Machine Learning Algorithms. Soft Comput. 2020, 24, 1789–1801. [Google Scholar] [CrossRef]
- Chaim, P.; Laurini, M.P. Volatility and Return Jumps in Bitcoin. Econ. Lett. 2018, 173, 158–163. [Google Scholar] [CrossRef]
- Gronwald, M. Is Bitcoin a Commodity? On Price Jumps, Demand Shocks, and Certainty of Supply. J. Int. Money Financ. 2019, 97, 86–92. [Google Scholar] [CrossRef]
- Hou, A.J.; Wang, W.; Chen, C.Y.H.; Härdle, W.K. Pricing Cryptocurrency Options. J. Financ. Econom. 2020, 18, 250–279. [Google Scholar] [CrossRef]
- Applebaum, D. Levy processes and infinitely divisible distributions, by Ken-iti Sato. Pp. 486.£ 50. 1999. ISBN 0 521 55302 4 (Cambridge University Press). Math. Gaz. 2001, 85, 568–569. [Google Scholar] [CrossRef][Green Version]
- Merton, R.C. Option Pricing When Underlying Stock Returns Are Discontinuous. J. Financ. Econ. 1976, 3, 125–144. [Google Scholar] [CrossRef]
- Scaillet, O.; Treccani, A.; Trevisan, C. High-Frequency Jump Analysis of the Bitcoin Market. J. Financ. Econom. 2020, 18, 209–232. [Google Scholar] [CrossRef]
- Eyjolfsson, H.; Tjøstheim, D. Self-Exciting Jump Processes with Applications to Energy Markets. Ann. Inst. Stat. Math. 2018, 70, 373–393. [Google Scholar] [CrossRef]
- Callegaro, G.; Mazzoran, A.; Sgarra, C. A Self-Exciting Modeling Framework for forward Prices in Power Markets. Appl. Stoch. Model. Bus. Ind. 2022, 38, 27–48. [Google Scholar] [CrossRef]
- Zhang, C.; Zhang, Z.; Xu, M.; Peng, Z. Good and Bad Self-Excitation: Asymmetric Self-Exciting Jumps in Bitcoin Returns. Econ. Model. 2023, 119, 106124. [Google Scholar] [CrossRef]
- Boswijk, H.P.; Laeven, R.J.A.; Yang, X. Testing for Self-Excitation in Jumps. J. Econ. 2018, 203, 256–266. [Google Scholar] [CrossRef]
- Chen, Y.; Zhang, L.; Bouri, E. Can a Self-Exciting Jump Structure Better Capture the Jump Behavior of Cryptocurrencies? A Comparative Analysis with the S&P 500. Res. Int. Bus. Financ. 2024, 69, 102277. [Google Scholar] [CrossRef]
- Shrestha, K. Multifractal Detrended Fluctuation Analysis of Return on Bitcoin. Int. Rev. Financ. 2021, 21, 312–323. [Google Scholar] [CrossRef]
- Takaishi, T. Statistical Properties and Multifractality of Bitcoin. Phys. A Stat. Mech. Appl. 2018, 506, 507–519. [Google Scholar] [CrossRef]
- Vaz, C.; Pascoal, R.; Sebastião, H. Price Appreciation and Roughness Duality in Bitcoin: A Multifractal Analysis. Mathematics 2021, 9, 2088. [Google Scholar] [CrossRef]
- Partida, A.; Gerassis, S.; Criado, R.; Romance, M.; Giráldez, E.; Taboada, J. The Chaotic, Self-Similar and Hierarchical Patterns in Bitcoin and Ethereum Price Series. Chaos Solitons Fractals 2022, 165, 112806. [Google Scholar] [CrossRef]
- Gunay, S.; Kaşkaloğlu, K. Seeking a Chaotic Order in the Cryptocurrency Market. Math. Comput. Appl. 2019, 24, 36. [Google Scholar] [CrossRef]
- Stosic, D.; Stosic, D.; Ludermir, T.B.; Stosic, T. Multifractal Behavior of Price and Volume Changes in the Cryptocurrency Market. Phys. A Stat. Mech. Appl. 2019, 520, 54–61. [Google Scholar] [CrossRef]
- Bariviera, A.F. One Model Is Not Enough: Heterogeneity in Cryptocurrencies’ Multifractal Profiles. Financ. Res. Lett. 2021, 39, 101649. [Google Scholar] [CrossRef]
- de Salis, E.A.V.; dos Santos Maciel, L. How Does Price (in)Efficiency Influence Cryptocurrency Portfolios Performance? The Role of Multifractality. Quant. Financ. 2023, 23, 1637–1658. [Google Scholar] [CrossRef]
- Stošić, D.; Stošić, D.; Stošić, T.; Stanley, H.E. Multifractal Analysis of Managed and Independent Float Exchange Rates. Phys. A Stat. Mech. Appl. 2015, 428, 13–18. [Google Scholar] [CrossRef]
- Han, C.; Wang, Y.; Xu, Y. Nonlinearity and Efficiency Dynamics of Foreign Exchange Markets: Evidence from Multifractality and Volatility of Major Exchange Rates. Econ. Res. Ekon. Istraz. 2020, 33, 731–751. [Google Scholar] [CrossRef]
- Czech, K.; Pietrych, Ł. The Efficiency of the Polish Zloty Exchange Rate Market: The Uncovered Interest Parity and Fractal Analysis Approaches. Risks 2021, 9, 142. [Google Scholar] [CrossRef]
- Grech, D.; Mazur, Z. Can One Make Any Crash Prediction in Finance Using the Local Hurst Exponent Idea? Phys. A Stat. Mech. Its Appl. 2004, 336, 133–145. [Google Scholar] [CrossRef]
- Wei, Y.; Wang, P. Forecasting Volatility of SSEC in Chinese Stock Market Using Multifractal Analysis. Phys. A Stat. Mech. Appl. 2008, 387, 1585–1592. [Google Scholar] [CrossRef]
- Fernandes, L.H.S.; de Araújo, F.H.A.; Silva, I.E.M. The (in)Efficiency of NYMEX Energy Futures: A Multifractal Analysis. Phys. A Stat. Mech. Appl. 2020, 556, 124783. [Google Scholar] [CrossRef]
- Jia, Z.; Cui, M.; Li, H. Research on the Relationship between the Multifractality and Long Memory of Realized Volatility in the SSECI. Phys. A Stat. Mech. Appl. 2012, 391, 740–749. [Google Scholar] [CrossRef]
- Liu, Y.; Zhang, W.; Fu, J.; Wu, X. Multifractal Analysis of Realized Volatilities in Chinese Stock Market. Comput. Econ. 2020, 56, 319–336. [Google Scholar] [CrossRef]
- Pirino, D. Jump Detection and Long Range Dependence. Phys. A Stat. Mech. Appl. 2009, 388, 1150–1156. [Google Scholar] [CrossRef]
- Ben Omrane, W.; Guesmi, K.; Qianru, Q.; Saadi, S. The High-Frequency Impact of Macroeconomic News on Jumps and Co-Jumps in the Cryptocurrency Markets. Ann. Oper. Res. 2023, 330, 177–209. [Google Scholar] [CrossRef]
- Hansen, P.R.; Lunde, A. Realized Variance and Market Microstructure Noise. J. Bus. Econ. Stat. 2006, 24, 127–161. [Google Scholar] [CrossRef]
- Liu, L.Y.; Patton, A.J.; Sheppard, K. Does Anything Beat 5-Minute RV? A Comparison of Realized Measures across Multiple Asset Classes. J. Econ. 2015, 187, 293–311. [Google Scholar] [CrossRef]
- Umar, Z.; Jareño, F.; González, M.; de la, O. The Impact of COVID-19-Related Media Coverage on the Return and Volatility Connectedness of Cryptocurrencies and Fiat Currencies. Technol. Forecast. Soc. Chang. 2021, 172, 121025. [Google Scholar] [CrossRef]
- Caferra, R.; Vidal-Tomás, D. Who Raised from the Abyss? A Comparison between Cryptocurrency and Stock Market Dynamics during the COVID-19 Pandemic. Financ. Res. Lett. 2021, 43, 101954. [Google Scholar] [CrossRef]
- Polat, O.; Kabakçı Günay, E. Cryptocurrency Connectedness Nexus the COVID-19 Pandemic: Evidence from Time-Frequency Domains. Stud. Econ. Financ. 2021, 38, 946–963. [Google Scholar] [CrossRef]
- Rubbaniy, G.; Polyzos, S.; Rizvi, S.K.A.; Tessema, A. COVID-19, Lockdowns and Herding towards a Cryptocurrency Market-Specific Implied Volatility Index. Econ. Lett. 2021, 207, 110017. [Google Scholar] [CrossRef]
- Shahzad, S.J.H.; Anas, M.; Bouri, E. Price Explosiveness in Cryptocurrencies and Elon Musk’s Tweets. Financ. Res. Lett. 2022, 47, 102695. [Google Scholar] [CrossRef]
- Alvarez, F.; Argente, D.; Van Patten, D. Are Cryptocurrencies Currencies? Bitcoin as Legal Tender in El Salvador. Science 2023, 382, eadd2844. [Google Scholar] [CrossRef]
- Conlon, T.; Corbet, S.; Hu, Y. The Collapse of the FTX Exchange: The End of Cryptocurrency’s Age of Innocence. Br. Account. Rev. 2023, 101277. [Google Scholar] [CrossRef]
- Azzam, I.; El-Masry, A.A.; Yamani, E. Foreign Exchange Market Efficiency during COVID-19 Pandemic. Int. Rev. Econ. Financ. 2023, 86, 717–730. [Google Scholar] [CrossRef]
- Fasanya, I.O.; Oyewole, O.; Adekoya, O.B.; Odei-Mensah, J. Dynamic Spillovers and Connectedness between COVID-19 Pandemic and Global Foreign Exchange Markets. Econ. Res. Ekon. Istraz. 2021, 34, 2059–2084. [Google Scholar] [CrossRef]
- Hu, S.; Gu, Z.; Wang, Y.; Zhang, X. An Analysis of the Clustering Effect of a Jump Risk Complex Network in the Chinese Stock Market. Phys. A Stat. Mech. Appl. 2019, 523, 622–630. [Google Scholar] [CrossRef]
- Liu, L.; Wan, J. A Study of Correlations between Crude Oil Spot and Futures Markets: A Rolling Sample Test. Phys. A Stat. Mech. Appl. 2011, 390, 3754–3766. [Google Scholar] [CrossRef]
- Zhao, R.; Cui, Y. Dynamic Cross-Correlations Analysis on Economic Policy Uncertainty and US Dollar Exchange Rate: AMF-DCCA Perspective. Discret. Dyn. Nat. Soc. 2021, 2021, 6668912. [Google Scholar] [CrossRef]
- Lee, M.; Song, J.W.; Kim, S.; Chang, W. Asymmetric Market Efficiency Using the Index-Based Asymmetric-MFDFA. Phys. A Stat. Mech. Appl. 2018, 512, 1278–1294. [Google Scholar] [CrossRef]
- Zhuang, X.; Wei, D. Asymmetric Multifractality, Comparative Efficiency Analysis of Green Finance Markets: A Dynamic Study by Index-Based Model. Phys. A Stat. Mech. Appl. 2022, 604, 127949. [Google Scholar] [CrossRef]
- Hanousek, J.; Novotný, J. Price Jumps in Visegrad-Country Stock Markets: An Empirical Analysis. Emerg. Mark. Rev. 2012, 13, 184–201. [Google Scholar] [CrossRef]
- Dungey, M.; Erdemlioglu, D.; Matei, M.; Yang, X. Testing for Mutually Exciting Jumps and Financial Flights in High Frequency Data. J. Econ. 2018, 202, 18–44. [Google Scholar] [CrossRef]
- Celeste, V.; Corbet, S.; Gurdgiev, C. Fractal Dynamics and Wavelet Analysis: Deep Volatility and Return Properties of Bitcoin, Ethereum and Ripple. Q. Rev. Econ. Financ. 2020, 76, 310–324. [Google Scholar] [CrossRef]
- Corbet, S.; Lucey, B.; Yarovaya, L. Datestamping the Bitcoin and Ethereum Bubbles. Financ. Res. Lett. 2018, 26, 81–88. [Google Scholar] [CrossRef]
- Gronwald, M. How Explosive Are Cryptocurrency Prices? Financ. Res. Lett. 2021, 38, 101603. [Google Scholar] [CrossRef]
- Zhang, L.; Bouri, E.; Chen, Y. Co-Jump Dynamicity in the Cryptocurrency Market: A Network Modelling Perspective. Financ. Res. Lett. 2023, 58, 104372. [Google Scholar] [CrossRef]
- Kang, H.J.; Lee, S.G.; Park, S.Y. Information Efficiency in the Cryptocurrency Market: The Efficient-Market Hypothesis. J. Comput. Inf. Syst. 2022, 62, 622–631. [Google Scholar] [CrossRef]
- Banerjee, A.K.; Akhtaruzzaman, M.; Dionisio, A.; Almeida, D.; Sensoy, A. Nonlinear Nexus between Cryptocurrency Returns and COVID-19 News Sentiment. J. Behav. Exp. Financ. 2022, 36, 100747. [Google Scholar] [CrossRef] [PubMed]
- Raimundo Júnior, G.D.; Palazzi, R.B.; Tavares, R.D.; Klotzle, M.C. Market Stress and Herding: A New Approach to the Cryptocurrency Market. J. Behav. Financ. 2022, 23, 43–57. [Google Scholar] [CrossRef]
- Almeida, J.; Gonçalves, T.C. A Systematic Literature Review of Investor Behavior in the Cryptocurrency Markets. J. Behav. Exp. Financ. 2023, 37, 100785. [Google Scholar] [CrossRef]
- Kakinaka, S.; Umeno, K. Asymmetric Volatility Dynamics in Cryptocurrency Markets on Multi-Time Scales. Res. Int. Bus. Financ. 2022, 62, 101754. [Google Scholar] [CrossRef]
- Phillip, A.; Chan, J.; Peiris, S. A New Look at Cryptocurrencies. Econ. Lett. 2018, 163, 6–9. [Google Scholar] [CrossRef]
- Kristoufek, L.; Vosvrda, M. Cryptocurrencies Market Efficiency Ranking: Not so Straightforward. Phys. A Stat. Mech. Appl. 2019, 531, 120853. [Google Scholar] [CrossRef]
- Lansiaux, E.; Tchagaspanian, N.; Forget, J. Community Impact on a Cryptocurrency: Twitter Comparison Example between Dogecoin and Litecoin. Front. Blockchain 2022, 5, 829865. [Google Scholar] [CrossRef]
- Katsiampa, P. An Empirical Investigation of Volatility Dynamics in the Cryptocurrency Market. Res. Int. Bus. Financ. 2019, 50, 322–335. [Google Scholar] [CrossRef]
- Al-Yahyaee, K.H.; Mensi, W.; Ko, H.U.; Yoon, S.M.; Kang, S.H. Why Cryptocurrency Markets Are Inefficient: The Impact of Liquidity and Volatility. North Am. J. Econ. Financ. 2020, 52, 101168. [Google Scholar] [CrossRef]
- Bariviera, A.F. The Inefficiency of Bitcoin Revisited: A Dynamic Approach. Econ. Lett. 2017, 161, 1–4. [Google Scholar] [CrossRef]
- Al-Yahyaee, K.H.; Mensi, W.; Yoon, S.M. Efficiency, Multifractality, and the Long-Memory Property of the Bitcoin Market: A Comparative Analysis with Stock, Currency, and Gold Markets. Financ. Res. Lett. 2018, 27, 228–234. [Google Scholar] [CrossRef]
- Caporale, G.M.; Gil-Alana, L.; Plastun, A. Persistence in the Cryptocurrency Market. Res. Int. Bus. Financ. 2018, 46, 141–148. [Google Scholar] [CrossRef]
- Bouri, E.; Azzi, G.; Dyhrberg, A.H. On the Return-Volatility Relationship in the Bitcoin Market around the Price Crash of 2013. Economics 2017, 11, 1–16. [Google Scholar] [CrossRef]
- Jiang, Y.; Nie, H.; Ruan, W. Time-Varying Long-Term Memory in Bitcoin Market. Financ. Res. Lett. 2018, 25, 280–284. [Google Scholar] [CrossRef]
- Aslam, F.; Memon, B.A.; Hunjra, A.I.; Bouri, E. The Dynamics of Market Efficiency of Major Cryptocurrencies. Glob. Financ. J. 2023, 58, 100899. [Google Scholar] [CrossRef]
- Lee, S.; Lee, J.; Lee, Y. Dissecting the Terra-LUNA Crash: Evidence from the Spillover Effect and Information Flow. Financ. Res. Lett. 2023, 53, 103590. [Google Scholar] [CrossRef]
- Vidal-Tomás, D.; Briola, A.; Aste, T. FTX’s Downfall and Binance’s Consolidation: The Fragility of Centralised Digital Finance. Phys. A Stat. Mech. Appl. 2023, 625, 129044. [Google Scholar] [CrossRef]


Disclaimer/Publisher’s Note: The statements, opinions and data contained in all publications are solely those of the individual author(s) and contributor(s) and not of MDPI and/or the editor(s). MDPI and/or the editor(s) disclaim responsibility for any injury to people or property resulting from any ideas, methods, instructions or products referred to in the content. |
© 2024 by the authors. Licensee MDPI, Basel, Switzerland. This article is an open access article distributed under the terms and conditions of the Creative Commons Attribution (CC BY) license (https://creativecommons.org/licenses/by/4.0/).