
Fractal Dimension Analysis of the Tumor Microenvironment in Cutaneous Squamous Cell Carcinoma: Insights into Angiogenesis and Immune Cell Infiltration

 , ,
, ,
Abstract
:1. Introduction
2. Materials and Methods
2.1. Material
- •
- CD4: Clone 4B12, mouse, ready-to-use (RTU), Leica. Antigen retrieval was achieved using Bond ER2 solution at an alkaline pH for 20 min.
- •
- CD8: Clone 4B11, mouse, RTU, Leica. Antigen retrieval was conducted using Bond ER2 solution at an alkaline pH for 30 min.
- •
- CD20: Clone L26, mouse, RTU, Leica. Antigen retrieval was performed using Bond ER1 solution at an alkaline pH for 20 min.
- •
- CD31: Clone 1A10, mouse, RTU, Leica. Antigen retrieval was accomplished using Bond ER2 solution at an alkaline pH for 10 min.
2.2. Image Selection
2.3. Algorithm
2.4. Statistical Assessment
3. Results
4. Discussion
5. Conclusions
Author Contributions
Funding
Institutional Review Board Statement
Informed Consent Statement
Data Availability Statement
Conflicts of Interest
References
- Scolyer, R.A.; Messina, J.; Brenn, T.; Calonje, J.E.; Rongioletti, F. Keratinocytic/Epidermal Tumours. In WHO Classification of Tumours Editorial Board. Skin Tumours; International Agency for Research on Cancer (IACR): Lyon, France, 2023; Volume 12. [Google Scholar]
- Guo, A.; Liu, X.; Li, H.; Cheng, W.; Song, Y. The Global, Regional, National Burden of Cutaneous Squamous Cell Carcinoma (1990–2019) and Predictions to 2035. Eur. J. Cancer Care 2023, 2023, e5484597. [Google Scholar] [CrossRef]
- Caudill, J.; Thomas, J.E.; Burkhart, C.G. The Risk of Metastases from Squamous Cell Carcinoma of the Skin. Int. J. Dermatol. 2023, 62, 483–486. [Google Scholar] [CrossRef] [PubMed]
- Fijałkowska, M.; Koziej, M.; Antoszewski, B. Detailed Head Localization and Incidence of Skin Cancers. Sci. Rep. 2021, 11, 12391. [Google Scholar] [CrossRef]
- Tokez, S.; Wakkee, M.; Louwman, M.; Noels, E.; Nijsten, T.; Hollestein, L. Assessment of Cutaneous Squamous Cell Carcinoma (cSCC) In Situ Incidence and the Risk of Developing Invasive cSCC in Patients with Prior cSCC In Situ vs the General Population in the Netherlands, 1989–2017. JAMA Dermatol. 2020, 156, 973–981. [Google Scholar] [CrossRef]
- Guo, S.; Deng, C.-X. Effect of Stromal Cells in Tumor Microenvironment on Metastasis Initiation. Int. J. Biol. Sci. 2018, 14, 2083–2093. [Google Scholar] [CrossRef]
- Stravodimou, A.; Tzelepi, V.; Papadaki, H.; Mouzaki, A.; Georgiou, S.; Melachrinou, M.; Kourea, E.P. Evaluation of T-Lymphocyte Subpopulations in Actinic Keratosis, in Situ and Invasive Squamous Cell Carcinoma of the Skin. J. Cutan. Pathol. 2018, 45, 337–347. [Google Scholar] [CrossRef]
- Nishida, H.; Kondo, Y.; Kusaba, T.; Kawamura, K.; Oyama, Y.; Daa, T. CD8/PD-L1 Immunohistochemical Reactivity and Gene Alterations in Cutaneous Squamous Cell Carcinoma. PLoS ONE 2023, 18, e0281647. [Google Scholar] [CrossRef]
- Schütz, S.; Solé-Boldo, L.; Lucena-Porcel, C.; Hoffmann, J.; Brobeil, A.; Lonsdorf, A.S.; Rodríguez-Paredes, M.; Lyko, F. Functionally Distinct Cancer-Associated Fibroblast Subpopulations Establish a Tumor Promoting Environment in Squamous Cell Carcinoma. Nat. Commun. 2023, 14, 5413. [Google Scholar] [CrossRef] [PubMed]
- van Kempen, L.C.L.T.; Rijntjes, J.; Claes, A.; Blokx, W.A.M.; Gerritsen, M.-J.P.; Ruiter, D.J.; van Muijen, G.N.P. Type I Collagen Synthesis Parallels the Conversion of Keratinocytic Intraepidermal Neoplasia to Cutaneous Squamous Cell Carcinoma. J. Pathol. 2004, 204, 333–339. [Google Scholar] [CrossRef]
- Tzoutzos, K.; Batistatou, A.; Kitsos, G.; Liasko, R.; Stefanou, D. Study of Microvascular Density and Expression of Vascular Endothelial Growth Factor and Its Receptors in Cancerous and Precancerous Lesions of the Eyelids. Anticancer Res. 2014, 34, 4977–4983. [Google Scholar]
- Bussard, K.M.; Mutkus, L.; Stumpf, K.; Gomez-Manzano, C.; Marini, F.C. Tumor-Associated Stromal Cells as Key Contributors to the Tumor Microenvironment. Breast Cancer Res. 2016, 18, 84. [Google Scholar] [CrossRef] [PubMed]
- Saeidi, V.; Doudican, N.; Carucci, J.A. Understanding the Squamous Cell Carcinoma Immune Microenvironment. Front. Immunol. 2023, 14, 1084873. [Google Scholar] [CrossRef] [PubMed]
- Xie, Q.; Ding, J.; Chen, Y. Role of CD8+ T Lymphocyte Cells: Interplay with Stromal Cells in Tumor Microenvironment. Acta Pharm. Sin. B 2021, 11, 1365–1378. [Google Scholar] [CrossRef] [PubMed]
- Rosa, M.L.; Reinert, T.; Pauletto, M.M.; Sartori, G.; Graudenz, M.; Barrios, C.H. Implications of Tumor-Infiltrating Lymphocytes in Early-Stage Triple-Negative Breast Cancer: Clinical Oncologist Perspectives. Transl. Breast Cancer Res. 2024, 5. [Google Scholar] [CrossRef] [PubMed]
- Dwivedi, M.; Tiwari, S.; Kemp, E.H.; Begum, R. Implications of Regulatory T Cells in Anti-Cancer Immunity: From Pathogenesis to Therapeutics. Heliyon 2022, 8, e10450. [Google Scholar] [CrossRef]
- Bungărdean, R.-M.; Stoia, M.-A.; Pop, B.; Crişan, M. Morphological Aspects of Basal Cell Carcinoma Vascularization. Rom. J. Morphol. Embryol. 2023, 64, 15–23. [Google Scholar] [CrossRef]
- Cross, S.S. Fractals in Pathology. J. Pathol. 1997, 182, 1–8. [Google Scholar] [CrossRef]
- da Silva, L.G.; da Silva Monteiro, W.R.S.; de Aguiar Moreira, T.M.; Rabelo, M.A.E.; de Assis, E.A.C.P.; de Souza, G.T. Fractal Dimension Analysis as an Easy Computational Approach to Improve Breast Cancer Histopathological Diagnosis. Appl. Microsc. 2021, 51, 6. [Google Scholar] [CrossRef]
- Di Ieva, A. Fractal Analysis in Clinical Neurosciences: An Overview. Adv. Neurobiol. 2024, 36, 261–271. [Google Scholar] [CrossRef]
- Di Ieva, A.; Al-Kadi, O.S. Computational Fractal-Based Analysis of Brain Tumor Microvascular Networks. Adv. Neurobiol. 2024, 36, 525–544. [Google Scholar] [CrossRef]
- Miola, A.C.; Castilho, M.A.; Schmitt, J.V.; Marques, M.E.A.; Miot, H.A. Contribution to Characterization of Skin Field Cancerization Activity: Morphometric, Chromatin Texture, Proliferation, and Apoptosis Aspects. An. Bras. Dermatol. 2019, 94, 698–703. [Google Scholar] [CrossRef] [PubMed]
- Bedin, V.; Adam, R.L.; de Sá, B.C.; Landman, G.; Metze, K. Fractal Dimension of Chromatin Is an Independent Prognostic Factor for Survival in Melanoma. BMC Cancer 2010, 10, 260. [Google Scholar] [CrossRef] [PubMed]
- Piantanelli, A.; Maponi, P.; Scalise, L.; Serresi, S.; Cialabrini, A.; Basso, A. Fractal Characterisation of Boundary Irregularity in Skin Pigmented Lesions. Med. Biol. Eng. Comput. 2005, 43, 436–442. [Google Scholar] [CrossRef] [PubMed]
- Popecki, P.; Kozakiewicz, M.; Ziętek, M.; Jurczyszyn, K. Fractal Dimension Analysis of Melanocytic Nevi and Melanomas in Normal and Polarized Light-A Preliminary Report. Life 2022, 12, 1008. [Google Scholar] [CrossRef]
- Quatresooz, P.; Pierard-Franchimont, C.; Paquet, P.; Pierard, G.E. Angiogenic Fast-Growing Melanomas and Their Micrometastases. Eur. J. Dermatol. 2010, 20, 302–307. [Google Scholar] [CrossRef]
- Reinhard, E.; Adhikhmin, M.; Gooch, B.; Shirley, P. Color Transfer between Images. IEEE Comput. Graph. Appl. 2001, 21, 34–41. [Google Scholar] [CrossRef]
- Şerbănescu, M.S.; Pleşea, I.E. A Hardware Approach for Histological and Histopathological Digital Image Stain Normalization. Rom. J. Morphol. Embryol. 2015, 56, 735–741. [Google Scholar]
- Pleşea, R.M.; Şerbănescu, M.S.; Ciovică, D.V.; Roşu, G.C.; Moldovan, V.T.; Bungărdean, R.M.; Popescu, N.A.; Pleşea, I.E. The Study of Tumor Architecture Components in Prostate Adenocarcinoma Using Fractal Dimension Analysis. Rom. J. Morphol. Embryol. 2019, 60, 501–519. [Google Scholar]
- Șerbănescu, M.-S. Fractal Dimension Box-Counting Algorithm Optimization Through Integral Images. In Proceedings of the 7th International Conference on Advancements of Medicine and Health Care through Technology, Cluj-Napoca, Romania, 13–15 October 2020; Springer International Publishing: Cham, Switzerland, 2022; pp. 95–101. [Google Scholar]
- Stoiculescu, A.; Pleşea, I.E.; Pop, O.T.; Alexandru, D.O.; Man, M.; Serbănescu, M.; Pleşea, R.M. Correlations between Intratumoral Interstitial Fibrillary Network and Tumoral Architecture in Prostatic Adenocarcinoma. Rom. J. Morphol. Embryol. 2012, 53, 941–950. [Google Scholar]
- Pleşea, I.E.; Stoiculescu, A.; Serbănescu, M.; Alexandru, D.O.; Man, M.; Pop, O.T.; Pleşea, R.M. Correlations between Intratumoral Vascular Network and Tumoral Architecture in Prostatic Adenocarcinoma. Rom. J. Morphol. Embryol. 2013, 54, 299–308. [Google Scholar]
- Mitroi, G.; Pleşea, R.M.; Pop, O.T.; Ciovică, D.V.; Şerbănescu, M.S.; Alexandru, D.O.; Stoiculescu, A.; Pleşea, I.E. Correlations between Intratumoral Interstitial Fibrillary Network and Vascular Network in Srigley Patterns of Prostate Adenocarcinoma. Rom. J. Morphol. Embryol. 2015, 56, 1319–1328. [Google Scholar] [PubMed]
- Bărbălan, A.; Nicolaescu, A.C.; Măgăran, A.V.; Mercuţ, R.; Bălăşoiu, M.; Băncescu, G.; Şerbănescu, M.S.; Lazăr, O.F.; Săftoiu, A. Immunohistochemistry Predictive Markers for Primary Colorectal Cancer Tumors: Where Are We and Where Are We Going? Rom. J. Morphol. Embryol. 2018, 59, 29–42. [Google Scholar]
- Harbiyeli, I.F.C.; Burtea, D.E.; Ivan, E.T.; Streață, I.; Nicoli, E.R.; Uscatu, D.; Șerbănescu, M.-S.; Ioana, M.; Vilmann, P.; Săftoiu, A. Assessing Putative Markers of Colorectal Cancer Stem Cells: From Colonoscopy to Gene Expression Profiling. Diagnostics 2022, 12, 2280. [Google Scholar] [CrossRef] [PubMed]
- Șerbănescu, M.-S.; Bungărdean, R.M.; Georgiu, C.; Crișan, M. Nodular and Micronodular Basal Cell Carcinoma Subtypes Are Different Tumors Based on Their Morphological Architecture and Their Interaction with the Surrounding Stroma. Diagnostics 2022, 12, 1636. [Google Scholar] [CrossRef] [PubMed]
- Pătru, A.; Şurlin, V.; Mărgăritescu, C.; Ciucă, E.M.; Matei, M.; Şerbănescu, M.S.; Camen, A. Analysis of the Distribution and Expression of Some Tumor Invasiveness Markers in Palate Squamous Cell Carcinomas. Rom. J. Morphol. Embryol. 2020, 61, 1259–1278. [Google Scholar] [CrossRef]
- Lertkiatmongkol, P.; Liao, D.; Mei, H.; Hu, Y.; Newman, P.J. Endothelial Functions of Platelet/Endothelial Cell Adhesion Molecule-1 (CD31). Curr. Opin. Hematol. 2016, 23, 253–259. [Google Scholar] [CrossRef]
- Newman, P.J. The Biology of PECAM-1. J. Clin. Investig. 1997, 99, 3–8. [Google Scholar] [CrossRef]
- Mei, H.; Campbell, J.M.; Paddock, C.M.; Lertkiatmongkol, P.; Mosesson, M.W.; Albrecht, R.; Newman, P.J. Regulation of Endothelial Cell Barrier Function by Antibody-Driven Affinity Modulation of Platelet Endothelial Cell Adhesion Molecule-1 (PECAM-1)*. J. Biol. Chem. 2014, 289, 20836–20844. [Google Scholar] [CrossRef]
- Cao, G.; O’Brien, C.D.; Zhou, Z.; Sanders, S.M.; Greenbaum, J.N.; Makrigiannakis, A.; DeLisser, H.M. Involvement of Human PECAM-1 in Angiogenesis and in Vitro Endothelial Cell Migration. Am. J. Physiol. Cell Physiol. 2002, 282, C1181–C1190. [Google Scholar] [CrossRef]
- Andreata, F.; Clément, M.; Benson, R.A.; Hadchouel, J.; Procopio, E.; Even, G.; Vorbe, J.; Benadda, S.; Ollivier, V.; Ho-Tin-Noe, B.; et al. CD31 Signaling Promotes the Detachment at the Uropod of Extravasating Neutrophils Allowing Their Migration to Sites of Inflammation. Elife 2023, 12, e84752. [Google Scholar] [CrossRef]
- Kuriri, F.A.; O’Malley, C.J.; Jackson, D.E. Molecular Mechanisms of Immunoreceptors in Platelets. Thromb. Res. 2019, 176, 108–114. [Google Scholar] [CrossRef] [PubMed]
- Pavlasova, G.; Mraz, M. The Regulation and Function of CD20: An “Enigma” of B-Cell Biology and Targeted Therapy. Haematologica 2020, 105, 1494–1506. [Google Scholar] [CrossRef] [PubMed]
- Casan, J.M.L.; Wong, J.; Northcott, M.J.; Opat, S. Anti-CD20 Monoclonal Antibodies: Reviewing a Revolution. Hum. Vaccin. Immunother. 2018, 14, 2820–2841. [Google Scholar] [CrossRef]
- Carlson, A.K.; Amin, M.; Cohen, J.A. Drugs Targeting CD20 in Multiple Sclerosis: Pharmacology, Efficacy, Safety, and Tolerability. Drugs 2024, 84, 285–304. [Google Scholar] [CrossRef]
- Sun, L.; Su, Y.; Jiao, A.; Wang, X.; Zhang, B. T Cells in Health and Disease. Signal Transduct. Target. Ther. 2023, 8, 235. [Google Scholar] [CrossRef] [PubMed]
- Zhen, A.; Krutzik, S.R.; Levin, B.R.; Kasparian, S.; Zack, J.A.; Kitchen, S.G. CD4 Ligation on Human Blood Monocytes Triggers Macrophage Differentiation and Enhances HIV Infection. J. Virol. 2014, 88, 9934–9946. [Google Scholar] [CrossRef]
- Jardine, L.; Barge, D.; Ames-Draycott, A.; Pagan, S.; Cookson, S.; Spickett, G.; Haniffa, M.; Collin, M.; Bigley, V. Rapid Detection of Dendritic Cell and Monocyte Disorders Using CD4 as a Lineage Marker of the Human Peripheral Blood Antigen-Presenting Cell Compartment. Front. Immunol. 2013, 4, 495. [Google Scholar] [CrossRef]
- Chen, H.; Sameshima, J.; Yokomizo, S.; Sueyoshi, T.; Nagano, H.; Miyahara, Y.; Sakamoto, T.; Fujii, S.; Kiyoshima, T.; Guy, T.; et al. Expansion of CD4+ Cytotoxic T Lymphocytes with Specific Gene Expression Patterns May Contribute to Suppression of Tumor Immunity in Oral Squamous Cell Carcinoma: Single-Cell Analysis and in Vitro Experiments. Front. Immunol. 2023, 14, 1305783. [Google Scholar] [CrossRef]
- Eizenberg-Magar, I.; Rimer, J.; Zaretsky, I.; Lara-Astiaso, D.; Reich-Zeliger, S.; Friedman, N. Diverse Continuum of CD4+ T-Cell States Is Determined by Hierarchical Additive Integration of Cytokine Signals. Proc. Natl. Acad. Sci. USA 2017, 114, E6447–E6456. [Google Scholar] [CrossRef]
- Kruse, B.; Buzzai, A.C.; Shridhar, N.; Braun, A.D.; Gellert, S.; Knauth, K.; Pozniak, J.; Peters, J.; Dittmann, P.; Mengoni, M.; et al. CD4+ T Cell-Induced Inflammatory Cell Death Controls Immune-Evasive Tumours. Nature 2023, 618, 1033–1040. [Google Scholar] [CrossRef]
- Janeway, C.A., Jr.; Travers, P.; Walport, M.; Shlomchik, M.J. T Cell-Mediated Cytotoxicity. In Immunobiology: The Immune System in Health and Disease, 5th ed.; Garland Science: New York, NY, USA, 2001. [Google Scholar]
- Schmidt, M.E.; Varga, S.M. The CD8 T Cell Response to Respiratory Virus Infections. Front. Immunol. 2018, 9, 678. [Google Scholar] [CrossRef] [PubMed]
- Koh, C.-H.; Lee, S.; Kwak, M.; Kim, B.-S.; Chung, Y. CD8 T-Cell Subsets: Heterogeneity, Functions, and Therapeutic Potential. Exp. Mol. Med. 2023, 55, 2287–2299. [Google Scholar] [CrossRef] [PubMed]
- Wang, K.; Shen, T.; Siegal, G.P.; Wei, S. The CD4/CD8 Ratio of Tumor-Infiltrating Lymphocytes at the Tumor-Host Interface Has Prognostic Value in Triple-Negative Breast Cancer. Hum. Pathol. 2017, 69, 110–117. [Google Scholar] [CrossRef] [PubMed]
- Brummel, K.; Eerkens, A.L.; de Bruyn, M.; Nijman, H.W. Tumour-Infiltrating Lymphocytes: From Prognosis to Treatment Selection. Br. J. Cancer 2023, 128, 451–458. [Google Scholar] [CrossRef]
- Buruiană, A.; Gheban, B.-A.; Gheban-Roșca, I.-A.; Georgiu, C.; Crișan, D.; Crișan, M. The Tumor Stroma of Squamous Cell Carcinoma: A Complex Environment That Fuels Cancer Progression. Cancers 2024, 16, 1727. [Google Scholar] [CrossRef]
- Liu, Z.-L.; Chen, H.-H.; Zheng, L.-L.; Sun, L.-P.; Shi, L. Angiogenic Signaling Pathways and Anti-Angiogenic Therapy for Cancer. Signal Transduct. Target. Ther. 2023, 8, 198. [Google Scholar] [CrossRef]
- Fukumura, D.; Kloepper, J.; Amoozgar, Z.; Duda, D.G.; Jain, R.K. Enhancing Cancer Immunotherapy Using Antiangiogenics: Opportunities and Challenges. Nat. Rev. Clin. Oncol. 2018, 15, 325–340. [Google Scholar] [CrossRef]
- Bose, P.; Brockton, N.T.; Guggisberg, K.; Nakoneshny, S.C.; Kornaga, E.; Klimowicz, A.C.; Tambasco, M.; Dort, J.C. Fractal Analysis of Nuclear Histology Integrates Tumor and Stromal Features into a Single Prognostic Factor of the Oral Cancer Microenvironment. BMC Cancer 2015, 15, 409. [Google Scholar] [CrossRef]
- Goutzanis, L.P.; Papadogeorgakis, N.; Pavlopoulos, P.M.; Petsinis, V.; Plochoras, I.; Eleftheriadis, E.; Pantelidaki, A.; Patsouris, E.; Alexandridis, C. Vascular Fractal Dimension and Total Vascular Area in the Study of Oral Cancer. Head. Neck 2009, 31, 298–307. [Google Scholar] [CrossRef]
- Margaritescu, C.; Raica, M.; Pirici, D.; Simionescu, C.; Mogoanta, L.; Stinga, A.C.; Stinga, A.S.; Ribatti, D. Podoplanin Expression in Tumor-Free Resection Margins of Oral Squamous Cell Carcinomas: An Immunohistochemical and Fractal Analysis Study. Histol. Histopathol. 2010, 25, 701–711. [Google Scholar] [CrossRef]
- Capasso, A.; Viggiano, D.; Lee, M.W.; Palladino, G.; Bilancio, G.; Simeoni, M.; Capolongo, G.; Secondulfo, C.; Ronchi, A.; Caputo, A.; et al. Kidney Transplant Modifies the Architecture and Microenvironment of Basal Cell Carcinomas. Kidney Blood Press. Res. 2020, 45, 368–377. [Google Scholar] [CrossRef] [PubMed]
- Lookian, P.P.; Chen, E.X.; Elhers, L.D.; Ellis, D.G.; Juneau, P.; Wagoner, J.; Aizenberg, M.R. The Association of Fractal Dimension with Vascularity and Clinical Outcomes in Glioblastoma. World Neurosurg. 2022, 166, e44–e51. [Google Scholar] [CrossRef] [PubMed]
- Koppensteiner, L.; Mathieson, L.; O’Connor, R.A.; Akram, A.R. Cancer Associated Fibroblasts—An Impediment to Effective Anti-Cancer T Cell Immunity. Front. Immunol. 2022, 13, 887380. [Google Scholar] [CrossRef] [PubMed]
- Gorchs, L.; Fernández Moro, C.; Bankhead, P.; Kern, K.P.; Sadeak, I.; Meng, Q.; Rangelova, E.; Kaipe, H. Human Pancreatic Carcinoma-Associated Fibroblasts Promote Expression of Co-Inhibitory Markers on CD4+ and CD8+ T-Cells. Front. Immunol. 2019, 10, 847. [Google Scholar] [CrossRef]
- Ford, K.; Hanley, C.J.; Mellone, M.; Szyndralewiez, C.; Heitz, F.; Wiesel, P.; Wood, O.; Machado, M.; Lopez, M.-A.; Ganesan, A.-P.; et al. NOX4 Inhibition Potentiates Immunotherapy by Overcoming Cancer-Associated Fibroblast-Mediated CD8 T-Cell Exclusion from Tumors. Cancer Res. 2020, 80, 1846–1860. [Google Scholar] [CrossRef]


| CD31 | CD20 | CD4 | CD8 | |
|---|---|---|---|---|
| Pre-invasive n = 100 | 1.645 ± 0.024 | 1.321 ± 0.104 | 1.623 ± 0.041 | 1.530 ± 0.041 |
| Invasive n = 100 | 1.661 ± 0.035 | 1.220 ± 0.102 | 1.610 ± 0.046 | 1.527 ± 0.053 |
| p, t-test | 0.010 | <0.001 | 0.133 | 0.738 |
| CD31 | CD20 | CD4 | CD8 | |
|---|---|---|---|---|
| Pre-invasive n = 100 | 1.827 ± 0.019 | 1.827 ± 0.006 | 1.835 ± 0.020 | 1.774 ± 0.019 |
| Invasive n = 100 | 1.876 ± 0.012 | 1.827 ± 0.009 | 1.875 ± 0.021 | 1.783 ± 0.014 |
| p, t-test | <0.001 | 0.619 | <0.001 | 0.007 |
| CD31 | CD20 | CD4 | CD8 | |
|---|---|---|---|---|
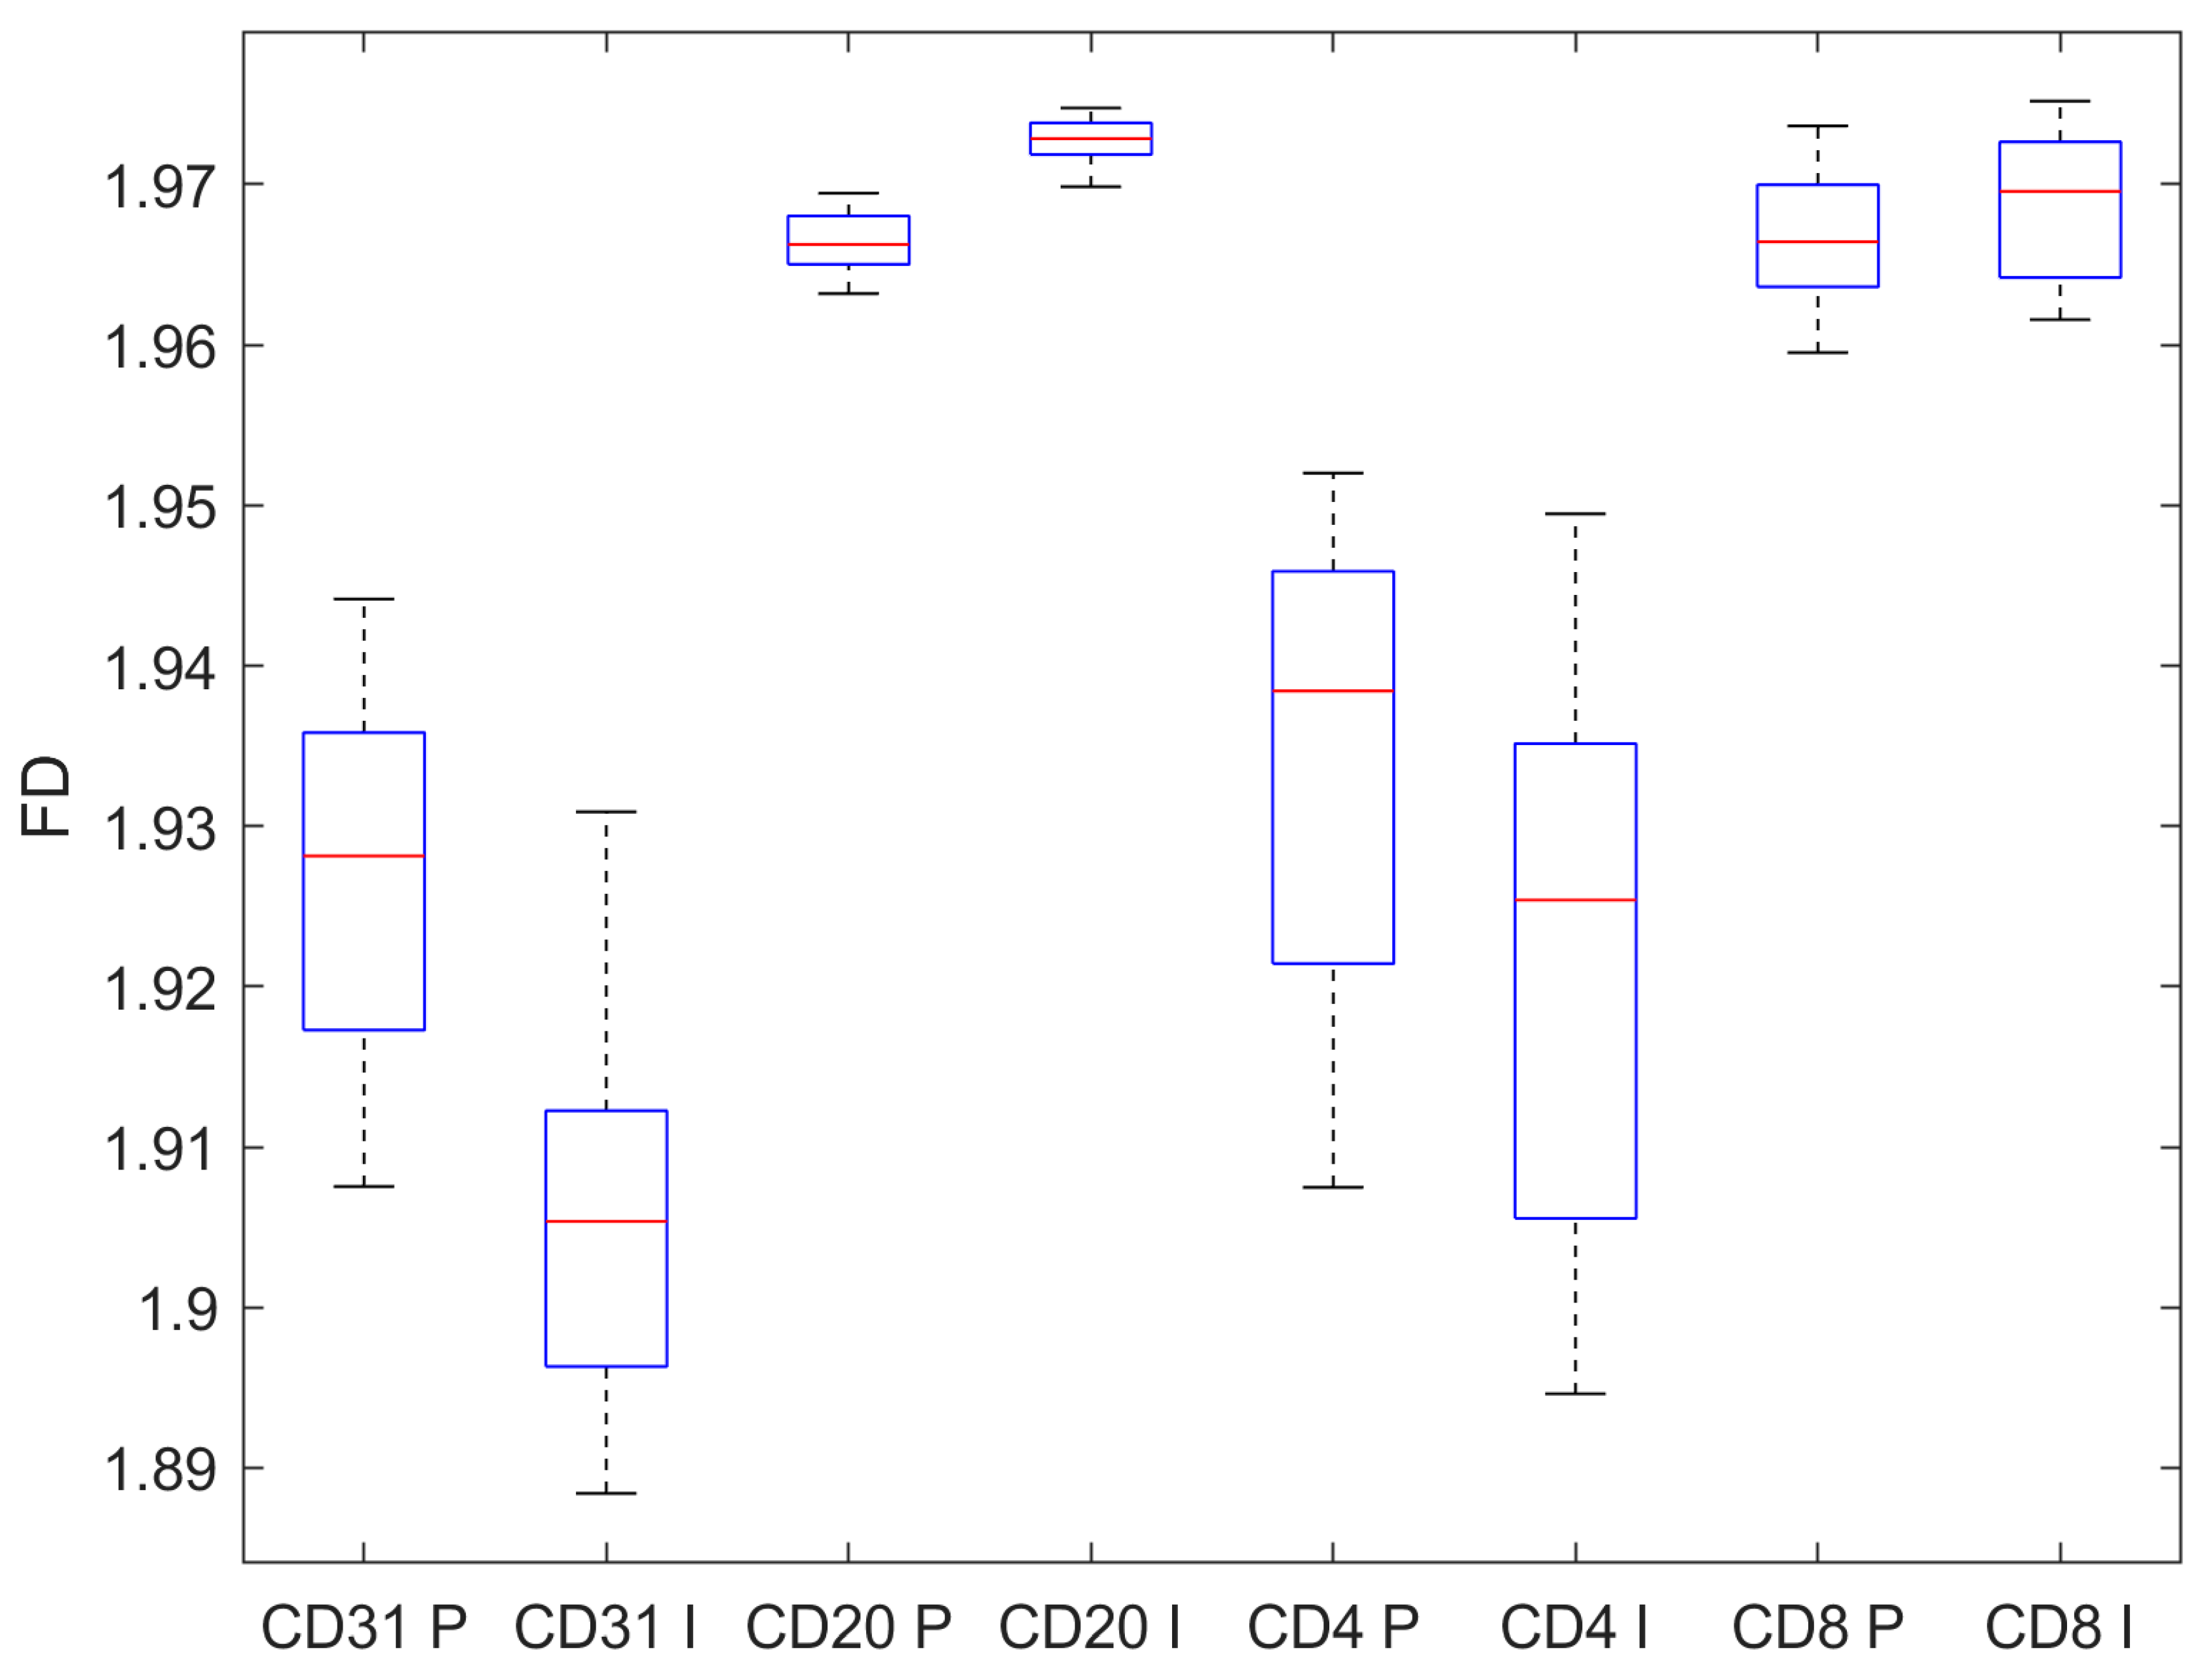
| Pre-invasive n = 100 | 1.926 ± 0.011 | 1.966 ± 0.002 | 1.934 ± 0.015 | 1.967 ± 0.004 |
| Invasive n = 100 | 1.906 ± 0.011 | 1.973 ± 0.001 | 1.922 ± 0.017 | 1.969 ± 0.004 |
| p, t-test | <0.001 | <0.001 | <0.001 | 0.019 |
| CD4/CD8 | CD4 + CD8 | (CD4 + CD8)/CD20 | |
|---|---|---|---|
| Pre-invasive n = 100 | 1.061 ± 0.006 | 3.153 ± 0.082 | 2.397 ± 0.132 |
| Invasive n = 100 | 1.055 ± 0.009 | 3.136 ± 0.099 | 2.581 ± 0.136 |
| p, t-test | 0.010 | 0.368 | <0.001 |
Disclaimer/Publisher’s Note: The statements, opinions and data contained in all publications are solely those of the individual author(s) and contributor(s) and not of MDPI and/or the editor(s). MDPI and/or the editor(s) disclaim responsibility for any injury to people or property resulting from any ideas, methods, instructions or products referred to in the content. |
© 2024 by the authors. Licensee MDPI, Basel, Switzerland. This article is an open access article distributed under the terms and conditions of the Creative Commons Attribution (CC BY) license (https://creativecommons.org/licenses/by/4.0/).
Share and Cite
Buruiană, A.; Șerbănescu, M.-S.; Pop, B.; Gheban, B.-A.; Gheban-Roșca, I.-A.; Hendea, R.M.; Georgiu, C.; Crișan, D.; Crișan, M. Fractal Dimension Analysis of the Tumor Microenvironment in Cutaneous Squamous Cell Carcinoma: Insights into Angiogenesis and Immune Cell Infiltration. Fractal Fract. 2024, 8, 600. https://doi.org/10.3390/fractalfract8100600
Buruiană A, Șerbănescu M-S, Pop B, Gheban B-A, Gheban-Roșca I-A, Hendea RM, Georgiu C, Crișan D, Crișan M. Fractal Dimension Analysis of the Tumor Microenvironment in Cutaneous Squamous Cell Carcinoma: Insights into Angiogenesis and Immune Cell Infiltration. Fractal and Fractional. 2024; 8(10):600. https://doi.org/10.3390/fractalfract8100600
Chicago/Turabian StyleBuruiană, Alexandra, Mircea-Sebastian Șerbănescu, Bogdan Pop, Bogdan-Alexandru Gheban, Ioana-Andreea Gheban-Roșca, Raluca Maria Hendea, Carmen Georgiu, Doinița Crișan, and Maria Crișan. 2024. "Fractal Dimension Analysis of the Tumor Microenvironment in Cutaneous Squamous Cell Carcinoma: Insights into Angiogenesis and Immune Cell Infiltration" Fractal and Fractional 8, no. 10: 600. https://doi.org/10.3390/fractalfract8100600
APA StyleBuruiană, A., Șerbănescu, M.-S., Pop, B., Gheban, B.-A., Gheban-Roșca, I.-A., Hendea, R. M., Georgiu, C., Crișan, D., & Crișan, M. (2024). Fractal Dimension Analysis of the Tumor Microenvironment in Cutaneous Squamous Cell Carcinoma: Insights into Angiogenesis and Immune Cell Infiltration. Fractal and Fractional, 8(10), 600. https://doi.org/10.3390/fractalfract8100600