Article

Multi-Buoy Deployment Method Based on an Improved Tuna Swarm Optimizer Enhanced with Fractional-Order Calculus Method for Marine Observation

1
School of Marine Science and Technology, Northwestern Polytechnical University, Xi’an 710072, China
2
Research & Development Institute, Northwestern Polytechnical University, Shenzhen 518057, China
*
Author to whom correspondence should be addressed.
Fractal Fract. 2024, 8(11), 625; https://doi.org/10.3390/fractalfract8110625
Submission received: 18 September 2024 / Revised: 22 October 2024 / Accepted: 23 October 2024 / Published: 24 October 2024

Abstract

:
Ocean buoys play a critical role in marine hydrological, water quality, and meteorological monitoring, with applications in navigation, environmental observation, and communication. However, accurately modeling and deploying a multi-buoy system in the complex marine environment presents significant challenges. To address these challenges, this study proposes an enhanced deployment strategy using the tuna swarm optimizer enhanced with the fractional-order calculus method for marine observation. The proposed method first introduces a detailed observation model that precisely captures the performance of buoys in terms of coverage and communication efficiency. By integrating the observation coverage ratio and communication energy consumption, we establish an optimal multi-buoy deployment model. The proposed method leverages tent chaotic mapping to improve the diversity of initial solution generation and incorporates fractional-order calculus to strengthen its search capabilities. Simulation experiments and statistical analysis verify the effectiveness of the proposed deployment model, with the proposed method achieving the best performance in deploying the multi-buoy system, reaching a final fitness value of 0.190052 at iteration 449, outperforming TSA, PSO, GWO, and WOA. These results highlight the potential of the proposed method in optimizing multi-buoy system deployment in marine observation.

1. Introduction

The intelligent development of unmanned underwater platforms brings new tactical forms and challenges to the future maritime battlefield. Optimized deployment is one of the key issues to ensure efficient mission execution of unmanned underwater clusters [1]. Unmanned underwater clusters are capable of performing critical tasks such as reconnaissance and detection [2], environmental monitoring [3], and counter-attack [4] in a variety of complex environments. However, the sensing capability of each node in the cluster is very limited, and irrational deployment will reduce the observation capability of the cluster, resulting in high cost waste. Therefore, it is very important to study the node optimal deployment of underwater unmanned clusters, which can realize long-term and normalized cooperative observation of the marine environment. In light of these emerging challenges, this study aims to enhance the deployment strategies of multi-buoy systems to improve performance in complex marine environments.
Underwater unmanned platforms, such as surface unmanned vessels and surface buoys, need to be fully autonomous for target identification [5], generative networks for underwater modeling [6], and obstacle avoidance under weak communication conditions [7], which face difficulties in complex and unknown environments. The perception of the underwater environment by surface buoys is mainly through mounted active and passive sonar [8]. However, complex underwater environments can challenge the perception ability of buoys, so the establishment of an observation model adapted to underwater environments is crucial to improve the task execution ability of multi-buoy systems in marine environments. Building upon these advancements in autonomous platforms, this paper proposes a novel observation model tailored specifically for multi-buoy systems to ensure optimal coverage and communication efficiency.
Due to the complexity and variability of the underwater environment, traditional land-based node deployment methods are difficult to adapt for underwater use [9]. Current research, both domestically and internationally, focuses on minimizing the number of nodes required for optimized deployment in the marine environment. Early research primarily centered on the establishment of basic mathematical models, without comprehensive consideration of the underwater environment [10]. Li et al. reviewed the probabilistic model of unmanned detection platforms and evaluated the effectiveness of underwater diving exploration missions, which laid the foundation for evaluating the effectiveness of unmanned platforms [11]. Wu et al. modeled the search space and terminal error of unmanned aerial vehicles (UAVs), unmanned surface vessels (USVs), and AUVs, generating paths in centralized or distributed modes using an improved particle swarm optimizer (IPSO) [12]. Experimental results demonstrated that the UAV & USV & AUV system outperformed the USV & AUV system in search-and-track (SAT) missions, offering an effective strategy for collaborative execution of complex missions. Detweiler et al. proposed a depth adjustment platform called AQUANODE, where system nodes were deployed underwater and connected to surface AQUANODE sensor nodes [13]. Experiments conducted at a water depth of 50 m validated the system’s effectiveness. Shahanaghi et al. investigated the effect of ocean waves on the line-of-sight (LoS) links between static sensors in an ocean surface wireless sensor network (WSN) [14]. Their model is applicable to the design and planning of WSNs in marine environments, aiding in the improvement of link stability for marine monitoring networks. With these technological advancements in mind, the ITSFO method provides a solution that addresses the limitations of traditional approaches by incorporating chaotic mapping and fractional-order calculus.
Bio-inspired algorithms are optimizers that rely on the evolutionary and behavioral patterns of organisms in nature and are widely used to solve various complex optimization problems [15]. These algorithms show unique advantages in dealing with nonlinear, multi-peak, high-dimensional, and dynamic optimization problems and have been widely used in many fields, such as engineering [16], computer science [17], economics [18], and bioinformatics [19]. The tuna swarm optimization (TSO) is a meta-heuristic algorithm that mimics the foraging behavior of tuna swarms, showing certain advantages in sensitivity, scalability, robustness, and convergence [20]. It has been widely used in path planning [21], numerical optimization [22], image segmentation [23], and engineering design [24]. These findings underscore the importance of developing more effective deployment strategies, such as the one proposed in this study, to address the complex dynamics of underwater environments.
Kulkarni et al. studied real-time autonomous deployment of UAV sensors with node localization in sensor networks, emphasizing its importance for emergency applications such as disaster monitoring and battlefield surveillance [25]. Attea et al. proposed a multi-objective set cover (MOSC) algorithm for the multi-objective set coverage problem in wireless sensor networks, introducing an adaptive heuristic variation operator to enhance network lifetime and coverage probability [26]. Senel et al. addressed the deployment of unsupervised sensor nodes in underwater acoustic sensor networks, focusing on maximizing coverage while ensuring network connectivity [27]. They proposed a new self-deployment algorithm that ensures each node is connected to the surface base station and automatically calculates the optimal depth of each node to maximize network coverage. Su et al. proposed a Voronoi graph-based optimized depth adjustment (VODA) deployment scheme for sensor nodes in target waters, addressing the key issue of node deployment in underwater acoustic sensor networks (UASNs) [28]. Incorporating these concepts, our research focuses on improving the deployment of buoys by optimizing observation and communication parameters using advanced optimization algorithms.
Chaotic mapping is a type of complex nonlinear system dynamic behavior that demonstrates the complexity and unpredictability of system behavior through simple mathematical expressions [29]. Chaotic mapping is widely used in image encryption [30], engineering control [31], physics [32], and biological networks [33]. The definition of fractional-order calculus dates back to the inception of calculus [34]. Fractional calculus is a natural extension of integer calculus and, due to its long-term memory, non-locality, and weak singularity, has become a new subdiscipline in applied mathematics. It has been applied in diffusion processes [35], dynamics [36], control systems [37], memristors [38], image processing [39], biomedical classification [40], PID controllers [41], and signal processing [42]. This study proposes a model that leverages these insights to enhance the deployment of multi-buoy systems through improved optimization techniques.
The main contributions of this study are as follows:
(1)
An observation model for buoys considering marine environmental factors is proposed, which can be optimized by any heuristic algorithm.
(2)
The observation coverage ratio and communication energy consumption of the multi-buoy system are derived in detail, and an optimized deployment model is established.
(3)
A novel improved tuna swarm optimizer enhanced with fractional-order calculus method (ITSFO) is proposed. The superiority of ITSFO is verified by simulation.
The rest of this paper is organized as follows. Section 2 describes the basic tent chaotic mapping and tuna swarm optimizer. Section 3 proposes the optimized deployment model of the multi-buoy system. The proposed ITSFO method is elaborated in Section 4. Section 5 presents the simulation experiments. Finally, Section 6 concludes the paper.

2. Preliminary

2.1. Tent Chaotic Mapping

Chaos is the complex nonlinear dynamic behavior of a system. To improve the efficiency of optimization search algorithms, chaotic optimization leverages the characteristics of chaotic motion. The basic idea is to map the optimization variables linearly into chaotic variables using chaotic mapping, then perform an optimization search based on the traversal and randomness of chaos. The obtained solutions are then linearly transformed back into the space of optimization variables [29]. Tent mapping chaotic sequences are uniformly distributed, leading to faster and more efficient searches. The process of generating chaotic sequences Z t k based on tent mapping is as follows:
Z t + 1 k = t e n t ( Z t k ) = Z t k u , 0 Z t k u 1 Z t k 1 u , u < Z t k 1
where k is the number of populations, t is the number of current iterations, and to ensure the randomness of the initialization information of the algorithm, u r a n d [ 0 , 1 ] .

2.2. Tuna Swarm Optimization

The tuna swarm optimization (TSO) is a meta-heuristic algorithm inspired by the cooperative foraging behavior of tuna swarms, and the main behaviors consist of two strategies: spiral foraging and parabolic foraging [21].

2.2.1. Spiral Foraging

The spiral foraging strategy of a tuna swarm is as follows:
X i t + 1 = α 1 · ( X b e s t t + β · | X b e s t t X i t | ) + α 2 · X i t , i = 1 α 1 · ( X b e s t t + β · | X b e s t t X i t | ) + α 2 · X i 1 t , i = 2 , 3 , , N P
α 1 = a + ( 1 a ) · t t max
α 2 = ( 1 a ) ( 1 a ) · t t max
β = e b l · cos ( 2 π b )
l = e 3 cos ( ( ( t max + 1 / t ) 1 ) π )
where X i t + 1 represents the i t h individual in the t + 1 iteration and is the optimal individual at time t . The parameters α 1 and α 2 are weight coefficients that control the tendency of an individual to move toward the optimal individual and its previous position, respectively. The constant a is used to adjust the influence of these tendencies. The variable t denotes the current iteration number, and t m a x represents the maximum number of iterations. b r a n d [ 0 , 1 ] .
If the optimal individual cannot find food, blindly following the optimal individual to forage is detrimental to group foraging. Therefore, it is beneficial to generate a random coordinate in the search space as a reference point for spiral search. This allows each individual to explore a larger space, thereby increasing the global search capability of the TSO. The specific model is as follows:
X i t + 1 = α 1 · ( X r a n d t + β · | X r a n d t X i t | ) + α 2 · X i t , i = 1 α 1 · ( X r a n d t + β · | X r a n d t X i t | ) + α 2 · X i 1 t , i = 2 , 3 , , N P
where X r a n d t is a randomly generated reference point in the search space.
In particular, the TSO changes the reference point for spiral foraging from a random individual to an optimal individual as the number of iterations increases. In summary, the final model of the spiral foraging strategy is as follows:
X i t + 1 = α 1 · ( X r a n d t + β · | X r a n d t X i t | ) + α 2 · X i t , i = 1 ,   r a n d < t t max , α 1 · ( X r a n d t + β · | X r a n d t X i t | ) + α 2 · X i 1 t , i = 2 , 3 , , N P ,   r a n d < t t max , α 1 · ( X b e s t t + β · | X b e s t t X i t | ) + α 2 · X i t , i = 1 ,   r a n d t t max , α 1 · ( X b e s t t + β · | X b e s t t X i t | ) + α 2 · X i 1 t , i = 2 , 3 , , N P ,   r a n d t t max ,

2.2.2. Parabolic Foraging

In addition to forming spirals for foraging, tuna swarms also form parabolas for cooperative foraging. The tuna swarm forms a parabolic shape with the food as a reference point. Assuming the probability of the tuna swarm choosing either spiral or parabolic foraging is 50%, the specific mathematical model is described as follows:
X i t + 1 = X b e s t t + r a n d · ( X b e s t t X i t ) + T F · p 2 · ( X b e s t t X i t ) ,   r a n d < 0.5 , T F · p 2 · X i t ,   r a n d 0.5 ,
p = ( 1 t t max ) ( t / t max ) ,
where TF is a random number with value 1 or −1.
Due to the limitations and shortcomings of the original TSO, such as its tendency to get trapped in local optima, slow convergence in the later stages, lack of memory to leverage previous search experiences, and restricted exploration in complex search spaces, the TSO algorithm has proven to be inadequate for solving the complex multi-buoy system deployment problem. Therefore, improvements to the TSO algorithm are necessary to enhance its global search capabilities, increase convergence speed, and overcome these challenges in order to better optimize multi-buoy system deployment.

2.3. Fractional-Order Calculus

In this paper, the Grunwald–Lernikov (G-L) definition form is used considering the expansion property of fractional order. G-L is defined as follows: the function f ( t ) has n + 1 orders of continuous derivatives in the interval [a, t], and n reaches at least ε when ε > 0 . Then the fractional-order calculus of order ε ( n ε < n + 1 ) is defined as follows:
D i ε f ( t ) = lim h 0 h ε i = 0 ( t a ) / h ( 1 ) i ε i f ( t i h )
where ε is the fractional order, a is the initial sampling time, and h is the sampling step size. ( 1 ) j ε i is the polynomial coefficients defined by the Gamma function, as follows:
D i ε f ( t ) = lim h 0 h ε i = 0 + ( 1 ) i Γ ( ε + 1 ) Γ ( i + 1 ) Γ ( ε i + 1 ) f ( t i h ) .
By discretizing,
D i ε f ( t ) = T ε i = 0 r ( 1 ) i Γ ( ε + 1 ) Γ ( i + 1 ) Γ ( ε i + 1 ) f ( t i T )
where T is the period and r is the truncation order. When T = 1,
D t ε f ( t ) = f ( t ) f ( t 1 ) + 1 2 ε ( ε 1 ) f ( t 2 ) + + ( 1 ) i Γ ( ε + 1 ) Γ ( i + 1 ) Γ ( ε i + 1 ) f ( t i )

3. Optimized Deployment Model of the Multi-Buoy System

The multi-buoy system offers advantages in flexibility, mobility, rich information acquisition, and strong system stability. To fully utilize the advantages of clustering, this section proposes a novel observation model of ocean buoys, defining the observation coverage ratio and communication energy consumption of the multi-buoy system within the context of the marine environment, and finally proposes an optimal deployment model for the multi-buoy system.

3.1. Observation Model of Ocean Buoy

The sensing capability of the sensor determines the observation capability of the ocean buoy. Most existing observation modeling studies use Boolean models to reduce computational complexity [43]. However, in practical applications, the effects of environmental noise, target noise, and other marine environmental factors need to be considered to more accurately characterize the observation performance of ocean buoys.
Based on the structural design of an ocean buoy and the passive sonar layout, the observation model is proposed as shown in Figure 1. The passive sonars are configured in the underbelly, head, and tail on the left and right sides of the ocean buoy. Considering the performance and layout of the passive sonar systems, we define the observation radius, including the maximum radius R max and the minimum radius R min , and equate the observation area to an ellipse. By cross-laying and overlapping passive sonar of different power levels, we ensure effective cooperative observation of the entire monitoring area.
As shown in Figure 1, the coordinate system is established with the geometric center of the ocean buoy, O , as the origin, and the theoretical observation range of the ocean buoy is defined as follows:
φ ( x , y ) = x R max 2 2 + y 2 R min 2 1
Erdinc et al. pointed out that passive sonar performance is susceptible to environmental factors such as ambient noise, target noise, etc.
P D = e D T / ( 1 + S N R )
The observation coverage ratio is correlated with the detection threshold DT (dB) as well as the signal-to-noise ratio SNR (dB) [29]:
N L w i n d = 10 lg 10 4.12 v 2.24 ( 1.5 + f 1.59 ) 10 0.1 δ = 41.2 + 22.4 lg v 10 lg ( 1.5 + f 1.59 ) δ ( Δ T )
where v is the wind speed, v 1   m / s , f is the noise frequency, and Δ T is the temperature difference, defined as follows:
δ ( Δ T ) = 0 , Δ T < 1 0.26 ( Δ T 1.0 ) 2 , Δ T 1
For rain noise, the noise spectral level can be defined as follows:
NL 20 r a i n = b ( v ) + a ( v ) l g R
where R is the rainfall. a and b determine v , thus affecting the noise level as follows:
a ( v ) = 25.0 ,   ( v 1.5 ) 5.0 + 5.7 ( 5.0 v ) ,   ( 1.5 < v < 5.0 ) 5.0 ,   ( v 5.0 )
b ( v ) = 41.6 ,   ( v 1.5 ) 50.0 2.4 ( 5.0 v ) ,   ( 1.5 < v < 5.0 ) 50.0 ,   ( v 5.0 )
Therefore, the rain noise spectral level is defined as follows:
NL r a i n = NL 20 r a i n + 10 log f ,   ( 1 f < 10 ) 49 lg f 59.0 ,   ( 10 f < 16 ) 0 ,   ( 16 f 24 ) 231 g f + 31.7 ,   ( 24 < f 100 )
For marine environmental noise with diverse sources, it is obtained by non-coherent superposition of multi-source noise:
N L = 10 log ( 10 N L w i n d / 10 + 10 N L r a i n / 10 )
However, the actual marine environment is affected by signal attenuation, noise interference, and other factors. To more accurately describe the observation coverage ratio of the ocean buoy on the target within a certain range, this paper introduces the fault-tolerant radius R e ( R e < R s ) , depicted as the blue-colored part in Figure 1. The fault-tolerant radius indicates the probability of the ocean buoy observing a target within this distance range. We adopt a power decay model to define the fault-tolerant radius and propose the following observation model for the ocean buoy, considering the fault-tolerant radius:
P x y ( φ ) = 0 ,                                           R s R e d ( A k , T ) e D T / ( 1 + S N R ) ,       R s R e <   d ( A k , T ) < R s + R e   1 ,                                           R s R e d ( A k , T )

3.2. Observation Coverage Ratio of Multi-Buoy System

Assuming that the target observation area of the multi-buoy system is W   ( km ) × L   ( km ) . The area step size is 0.1 km, and the area is discretized into w × l points. Noting that the set of multi-buoy is χ A = { A 1 , A 2 , , A k } , the observation coverage ratio of the multi-buoy system is defined as follows:
S P φ ( χ A ) = i = 1 k P x y ( φ i ) = 1 φ i χ A ( 1 P x y ( φ i ) )
Further, the observation coverage ratio of the multi-buoy system is defined as follows:
P W × L = i = 1 w j = 1 l P x y ( χ A ) / ( w × l )

3.3. Communication Energy Consumption of Multi-Buoy System

In the normalized observation mission, inter-buoy connectivity is essential to extend the effective observation range of the system. However, communication energy consumption increases with distance. Therefore, it is necessary to establish a communication energy consumption model among the buoys to ensure that the communication working state closely reflects real conditions, thereby optimizing the overall performance of the system.
The minimum power level at which each buoy can properly receive a unit packet is P 0 . The attenuation ratio of the transmission power with distance d U is A ( d U ) , and the minimum transmission power of the sending buoy is P 0 A ( d U ) [44], then
A ( d U ) = Ε d d β
where d U ( km ) is the communication distance, and β is the expansion factor. E is the attenuation coefficient, which is mainly affected by the absorption loss of seawater and is defined as follows:
Ε = 10 α ( f ) 10
where α ( f ) is the absorption coefficient and f is the acoustic frequency.
α ( f ) = 0.11 f 2 1 + f 2 + 44 f 2 4100 + f 2 + 2.75 × 10 4 f 2 + 3 × 10 3
In marine environments, the energy consumption of a node for transmitting is approximately 100 times higher than for receiving. During underwater deployment, the total energy consumption of the buoys as both transmitting and receiving nodes is calculated. Generally, each buoy has multiple communication links connected to it; therefore, the communication energy consumption of a single buoy i can be expressed as follows (in this paper, we use acoustic waves with horizontal columnar wave expansion β = 1 ):
C i = ( i , k ) E i 1.01 P 0 × 10 α ( f ) × d i k 10 × d i k
where E i is the set of links connected to node i . d i k is the communication distance from node- i to node- k .
The multi-buoy system is simplified as an undirected graph. The link communication energy consumption between buoy i and buoy j can be represented as follows:
C i j = 1.01 P 0 A ( d i j ) + 1.01 P 0 A ( d j i ) = 2.02 P 0 A ( d i j ) = 2.02 P 0 × 10 α ( f ) × d i j 10 × d i j
where d i j = d i i , denotes the communication distance between buoy i and buoy j .

3.4. The Optimized Deployment Model

Based on the observation coverage ratio and communication energy consumption of the multi-buoy system defined above, the optimal deployment model is developed. The number of decision variables X var depends on the number of buoys | χ A | , defined as follows:
X A U V = 2 | χ A | + N l i n k N l i n k = | χ A | | χ A | 1 / 2
where 2 | χ A | represents the total number of horizontal and vertical coordinates deployed by the buoys, and N l i n k represents the maximum number of communication links present in the multi-buoy system.
Then, the decision variable N var can be expressed as follows:
X A U V = [ x 1 , x 2 , , x | χ A | , y 1 , y 2 , , y | χ A | , e 12 , e 13 , , e l m , , e | χ A | 1 , | χ A | ] T l = 1 , 2 , , | χ A | 1 m = l + 1 , l + 2 , , | χ A |
where ( x k , y k ) is the 2D coordinate of the k t h ( k = 1 , 2 , , | χ A | ) buoy. e l m represents the communication link between node l and node m . It takes the values of 0 if the link does not exist and 1 if it does.
Further, a weighting factor is introduced to construct the fitness function as follows:
F f i t = λ 1 f 1 + λ 2 f 2 f 1 = i = 1 w j = 1 l P x y ( χ A ) / ( w × l ) f 2 = 2.02 P 0 × 10 α ( f ) × d i j 10 × d i j
where f 1 and f 2 are the observation coverage ratio and communication energy consumption of the multi-buoy system λ 1 and λ 2 are weighting factors. The constraint ζ * is defined as follows:
ζ * = 1 ,   D n o d e i = 0 0 ,   D n o d e i 1
where D n o d e i represents the degree of node i , and D n o d e i 1 ( i = 1 , 2 , , | χ A | ) ensures effective communication in the system.
Furthermore, assuming that the deployment area of the system is wide W and long L , the coordinates ( x k , y k ) ( k = 1 , 2 , , | χ A | ) satisfy the following constraints:
0 x k W 0 y k L
In summary, the optimized deployment model of the multi-buoy system is defined as follows:
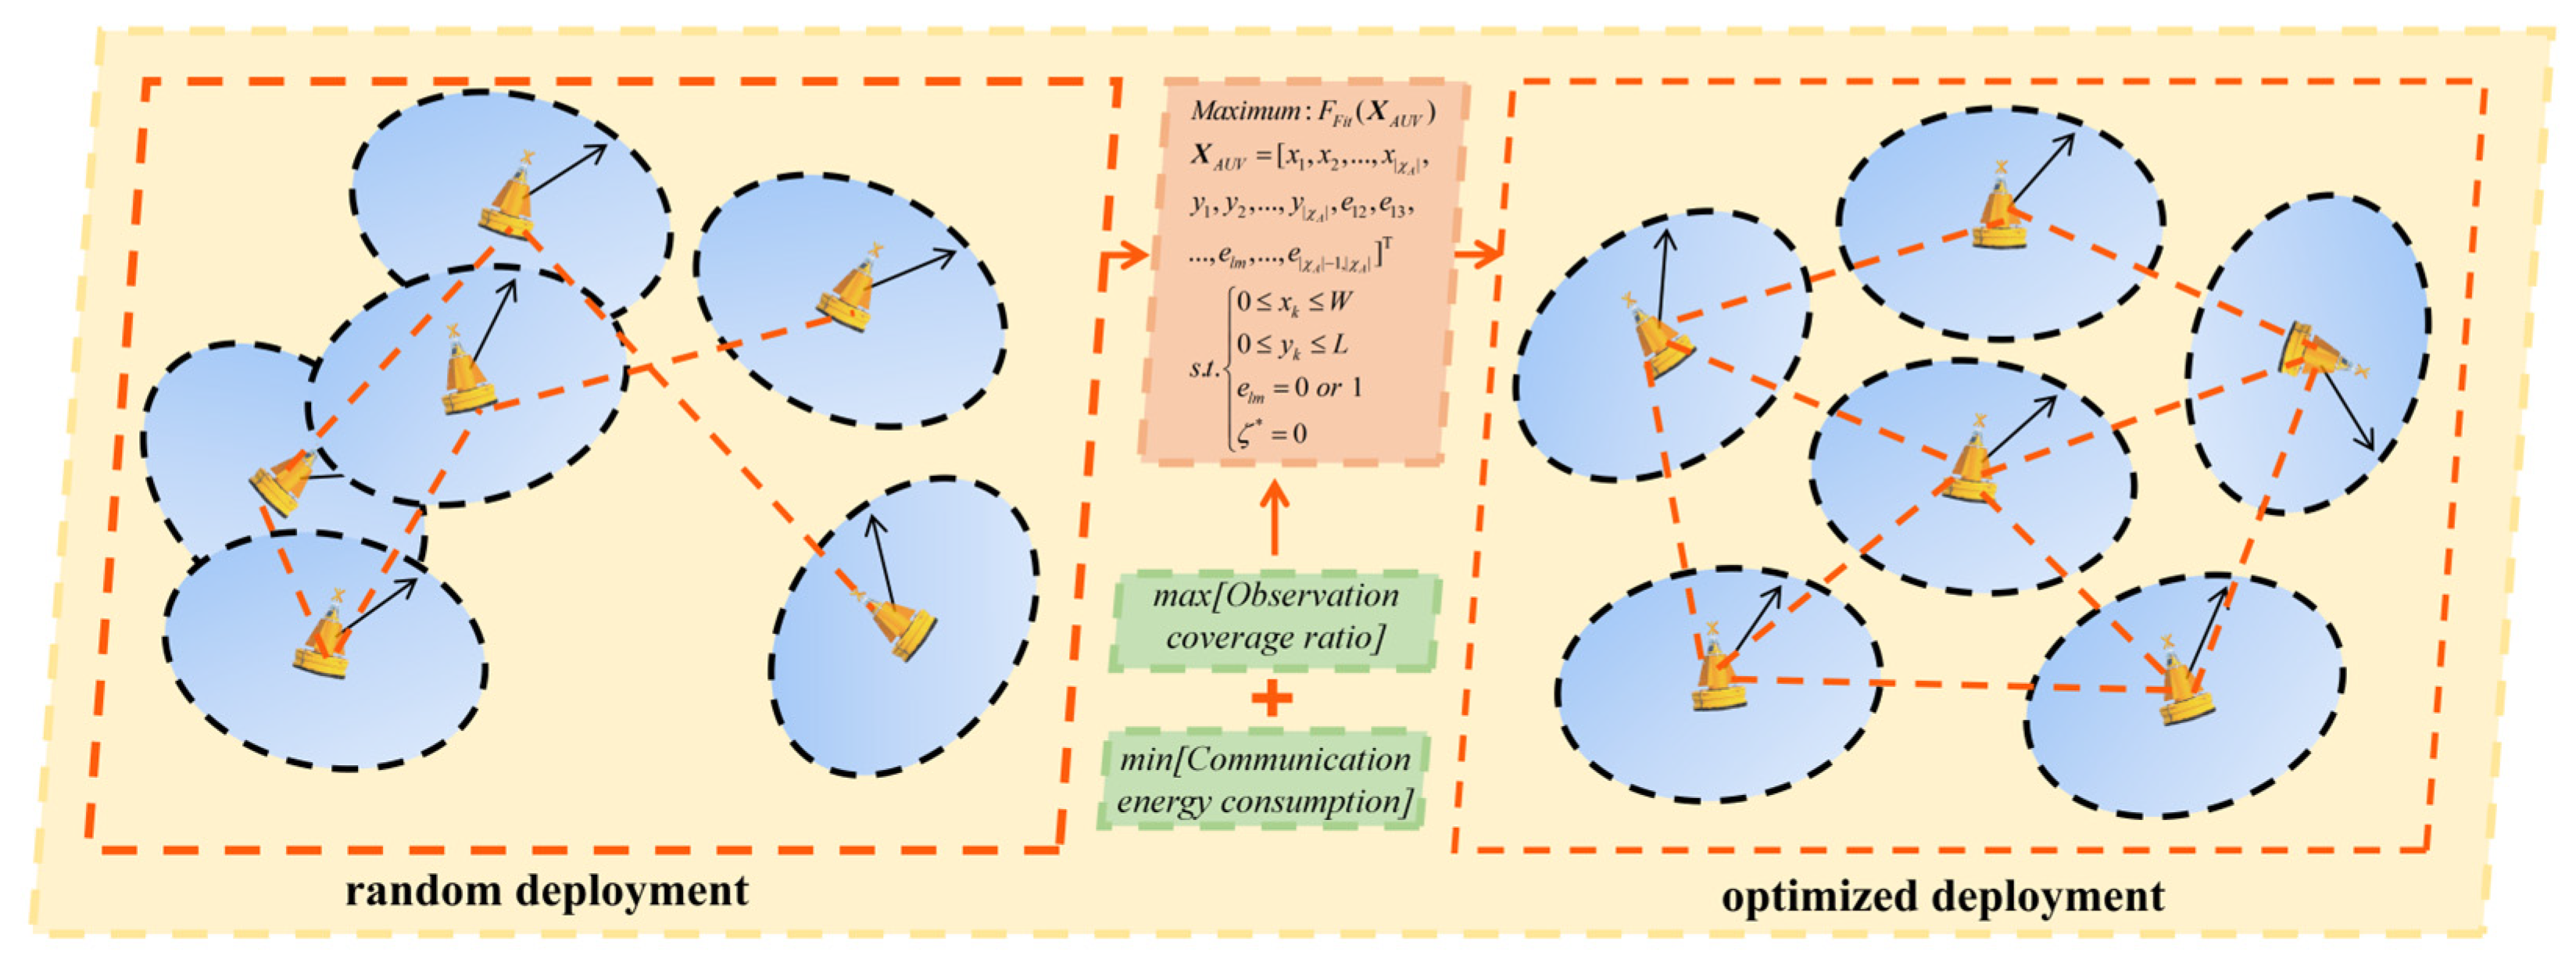
M a x i m u m : F F i t ( X A U V ) X A U V = [ x 1 , x 2 , , x | χ A | , y 1 , y 2 , , y | χ A | , e 12 , e 13 , , e l m , , e | χ A | 1 , | χ A | ] T s . t . 0 x k W 0 y k L e l m = 0   o r   1 ζ * = 0
A schematic comparison between a random deployment and the optimized deployment achieved through the proposed method is illustrated in Figure 2 below, highlighting the system’s capacity to improve both observation coverage and communication efficiency.

4. The Proposed ITSFO Method

In this section, the innovation of the proposed method is analyzed based on the preliminary knowledge above, then the proposed ITSFO method is described in detail, and finally the flowchart of the ITSFO method is presented.

4.1. An Enhanced Tuna Swarm Optimization

To improve the quality of the initial population, the tuna population was initialized using tent chaotic mapping. Tent chaotic mapping achieves its most typical form when the resulting sequences are uniformly distributed, with approximately uniform distribution densities for different parameters. Therefore, the process of tent chaotic mapping cited in this paper is as follows:
Z t + 1 k = t e n t ( Z t k ) = 2 Z t k , 0 Z t k 1 2 2 ( 1 Z t k ) , 1 2 < Z t k 1
By combining the chaotic sequences, the initial position sequence X i k of individual tuna in the search area is further generated by the following process:
X i k = X i , min k + Z i k ( X i , max k X i , min k )
where X i , min k and X i , min k are the minimum and maximum values of the X i k sequence, respectively.

4.2. Improved Tuna Swarm Optimizer Enhanced with Fractional-Order Calculus Method

In this paper, we use the theory of fractional-order calculus to optimize the TSO, given its excellent memory properties, which can significantly improve the speed of the algorithm search.

4.2.1. Improved Spiral Foraging

The improved tuna spiral foraging strategy of Formula (2) can be rewritten as follows:
X i t + 1 X i t = α 1 · ( X r a n d t + β · | X r a n d t X i t | ) + ( α 2 1 ) · X i t , i = 1 , r a n d < t t max , α 1 · ( X r a n d t + β · | X r a n d t X i t | ) + ( α 2 1 ) · X i 1 t , i = 2 , 3 , , N P , r a n d < t t max , α 1 · ( X b e s t t + β · | X b e s t t X i t | ) + ( α 2 1 ) · X i t , i = 1 , r a n d t t max , α 1 · ( X b e s t t + β · | X b e s t t X i t | ) + ( α 2 1 ) · X i 1 t , i = 2 , 3 , , N P , r a n d t t max ,
Combined with Formula (14), fractional calculus theory is combined, and the improved positional update formula is as follows:
X i t + 1 = ε X i t 1 2 ε ( ε 1 ) X i t 1 + + ( 1 ) i Γ ( ε + 1 ) Γ ( i + 1 ) Γ ( ε i + 1 ) X i t + 1 i + α 1 · ( X r a n d t + β · | X r a n d t X i t | ) + ( α 2 1 ) · X i t , i = 1 ,   r a n d < t t max , ε X i t 1 2 ε ( ε 1 ) X i t 1 + + ( 1 ) i Γ ( ε + 1 ) Γ ( i + 1 ) Γ ( ε i + 1 ) X i t + 1 i + α 1 · ( X r a n d t + β · | X r a n d t X i t | ) + ( α 2 1 ) · X i 1 t , i = 2 , 3 , , N P , r a n d < t t max , ε X i t 1 2 ε ( ε 1 ) X i t 1 + + ( 1 ) i Γ ( ε + 1 ) Γ ( i + 1 ) Γ ( ε i + 1 ) X i t + 1 i + α 1 · ( X b e s t t + β · | X b e s t t X i t | ) + ( α 2 1 ) · X i t , i = 1 , r a n d t t max , ε X i t 1 2 ε ( ε 1 ) X i t 1 + + ( 1 ) i Γ ( ε + 1 ) Γ ( i + 1 ) Γ ( ε i + 1 ) X i t + 1 i + α 1 · ( X b e s t t + β · | X b e s t t X i t | ) + ( α 2 1 ) · X i 1 t , i = 2 , 3 , , N P , r a n d t t max ,

4.2.2. Improved Parabolic Foraging

The improved tuna parabolic foraging strategy of Formula (9) can be rewritten as follows:
X i t + 1 X i t = X b e s t t + r a n d · ( X b e s t t X i t ) + T F · p 2 · ( X b e s t t X i t ) X i t ,   r a n d < 0.5 , ( T F · p 2 1 ) · X i t ,   r a n d 0.5 ,
Combined with Formula (14), fractional calculus theory is combined, and the improved positional update formula is as follows:
X i t + 1 X i t = ε X i t 1 2 ε ( ε 1 ) X i t 1 + + ( 1 ) i Γ ( ε + 1 ) Γ ( i + 1 ) Γ ( ε i + 1 ) X i t + 1 i + X b e s t t + r a n d · ( X b e s t t X i t ) + T F · p 2 · ( X b e s t t X i t ) X i t ,   r a n d < 0.5 , ε X i t 1 2 ε ( ε 1 ) X i t 1 + + ( 1 ) i Γ ( ε + 1 ) Γ ( i + 1 ) Γ ( ε i + 1 ) X i t + 1 i + ( T F · p 2 1 ) · X i t ,   r a n d 0.5 ,
By combining the TSO method with fractional-order calculus, several limitations of the original TSO are addressed. The original TSO often struggles with balancing exploration and exploitation, leading to a tendency to get trapped in local optima. The incorporation of the memory and non-locality properties of fractional-order calculus allows the ITSFO method to retain past search information, enabling more diverse initial solutions and enhancing global exploration capabilities, thereby avoiding local optima and improving search efficiency. Furthermore, fractional-order calculus provides more precise step-size control during iterations, allowing the ITSFO method to transition smoothly between fast convergence in the early stages and refined searches later on, which significantly improves the overall convergence speed. The position update strategy is also optimized, enabling particles to dynamically adjust during both fast and fine-tuning phases according to the objective function, making the method more effective in handling complex optimization problems. Additionally, in high-dimensional or complex search spaces where TSO often fails, the memory effect and non-locality of fractional-order calculus help ITSFO to adapt better and avoid being confined to small local regions.
In conclusion, the enhanced ITSFO algorithm not only strengthens the global search capability of the original TSO but also accelerates convergence and prevents local optima, making it better suited for the complex task of multi-buoy system deployment.

4.3. Flowchart and Pseudo-Code

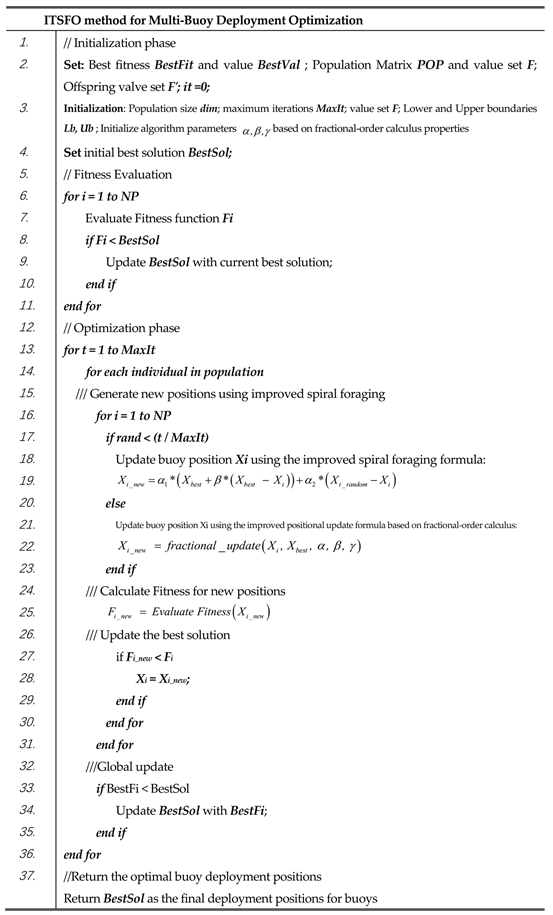
To summarize, the flowchart of the ITSFO method proposed in this paper is shown in Figure 3, illustrating the initialization, iteration, and optimization phases. It highlights key steps, such as the initialization of parameters, the calculation of fitness values, and the update of positions based on enhanced tuna swarm optimization with fractional-order calculus.
To provide a clearer understanding of the algorithm’s implementation, the following pseudo-code outlines the specific procedures applied in each phase, relating the fitness function of ITSFO to the objective function of the multi-buoy deployment problem. The pseudo-code also explains how the design parameters of ITSFO interact with the problem’s tuning parameters to achieve optimized buoy deployment.
Fractalfract 08 00625 i001

4.4. Wilcoxon Sign Rank Test

To validate the superiority of the ITSFO method, the Wilcoxon signed-rank test was used to determine whether there was a significant difference between the ITSFO and TSO methods. The Wilcoxon signed-rank test is a paired test that checks for significant differences between two algorithms. The results of the test between ITSFO and TSO at a significance level α = 0.05 are given in Table 1. The proposed ITSFO is tested using the IEEE CEC2017 test functions. The results of 50 optimization runs are compared.
In the results, “R+” indicates that the ITSFO method outperforms TSO, “R−” means the improved algorithm performs worse, and “R=” indicates similar performance.
Table 1 shows the results of the Wilcoxon signed-rank test of F1–F8. The statistics show that the ITSFO method ranks first in all cases. Therefore, it can be concluded that the ITSFO method outperforms the original TSO, showing the best overall performance.

5. Simulation and Analysis

5.1. Coverage and Energy Consumption with Varying Weight Factor

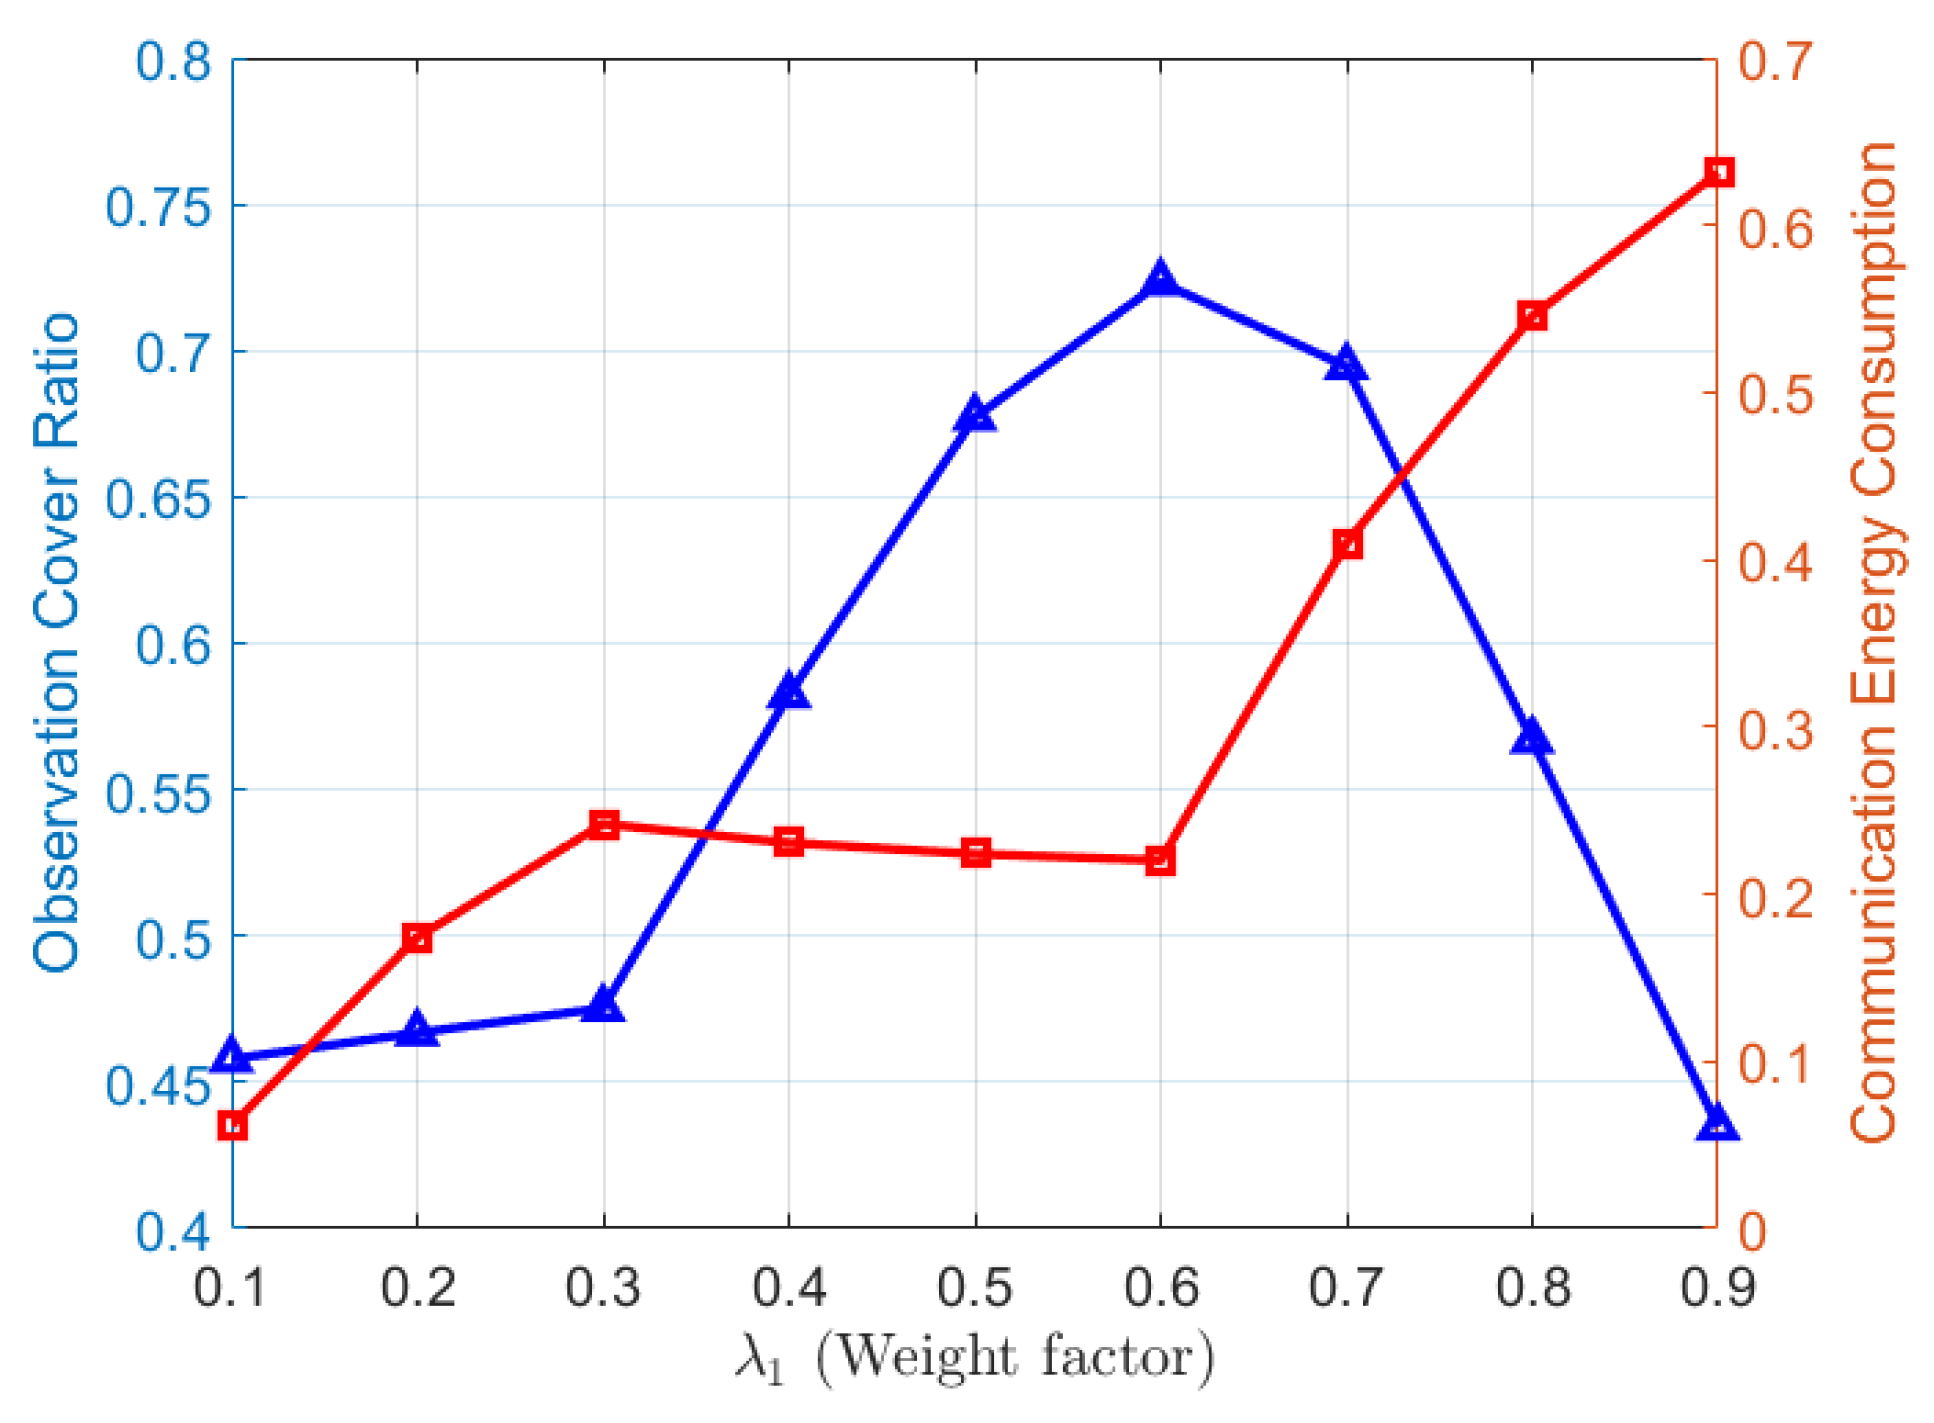
In addressing the underwater optimization deployment problem, in Equation (34), λ 1 and λ 2 are weighting factors, where the weight coefficients of each component have a great impact on the optimization results. Thus, as shown in Figure 4, simulations were performed with changes in the observation cover ratio and communication energy consumption under different values of λ 1 . With the increase in the coverage weight, the observation cover ratio keeps increasing and reaches its maximum when λ 1 = 0.6, at which point the communication energy consumption is 0.2202. Although energy consumption is minimized when λ 1 = 0.1, the coverage area is also the smallest, which is not conducive to long-term monitoring by the multi-buoy system. A reasonable weighting coefficient is more beneficial for long-term monitoring of the ocean environment, so λ 1 = 0.6 was chosen.

5.2. Simulation Experiments for Single-Buoy

A simulation experiment was conducted to demonstrate the effectiveness of the multi-buoy deployment model and the superiority of the proposed ITSFO algorithm. The parameters in the simulation are shown in Table 2.
A model of the buoy is shown in Figure 5. Due to the certain randomness of deployment in the marine environment, the directionality of the buoy must also be considered. Different angles will affect the probability of observing the target. In order to more accurately describe the sensing ability of the buoy, we propose a probabilistic sensing model of the buoy with a heading angle, as shown in Figure 5a,b.
As shown in Figure 5, the white pentagram represents the geometric center of the buoy. As the distance from this center increases, the observation coverage ratio gradually decays to zero. This decaying trend reflects the characteristic that the buoy’s observation capability decreases significantly with increasing distance, thereby affecting the effective observation of long-range targets.

5.3. Simulation Experiments for Multi-Buoy System

All buoys are deployed at a certain depth in the observation sea area. The number of iterations for all algorithms is 500.
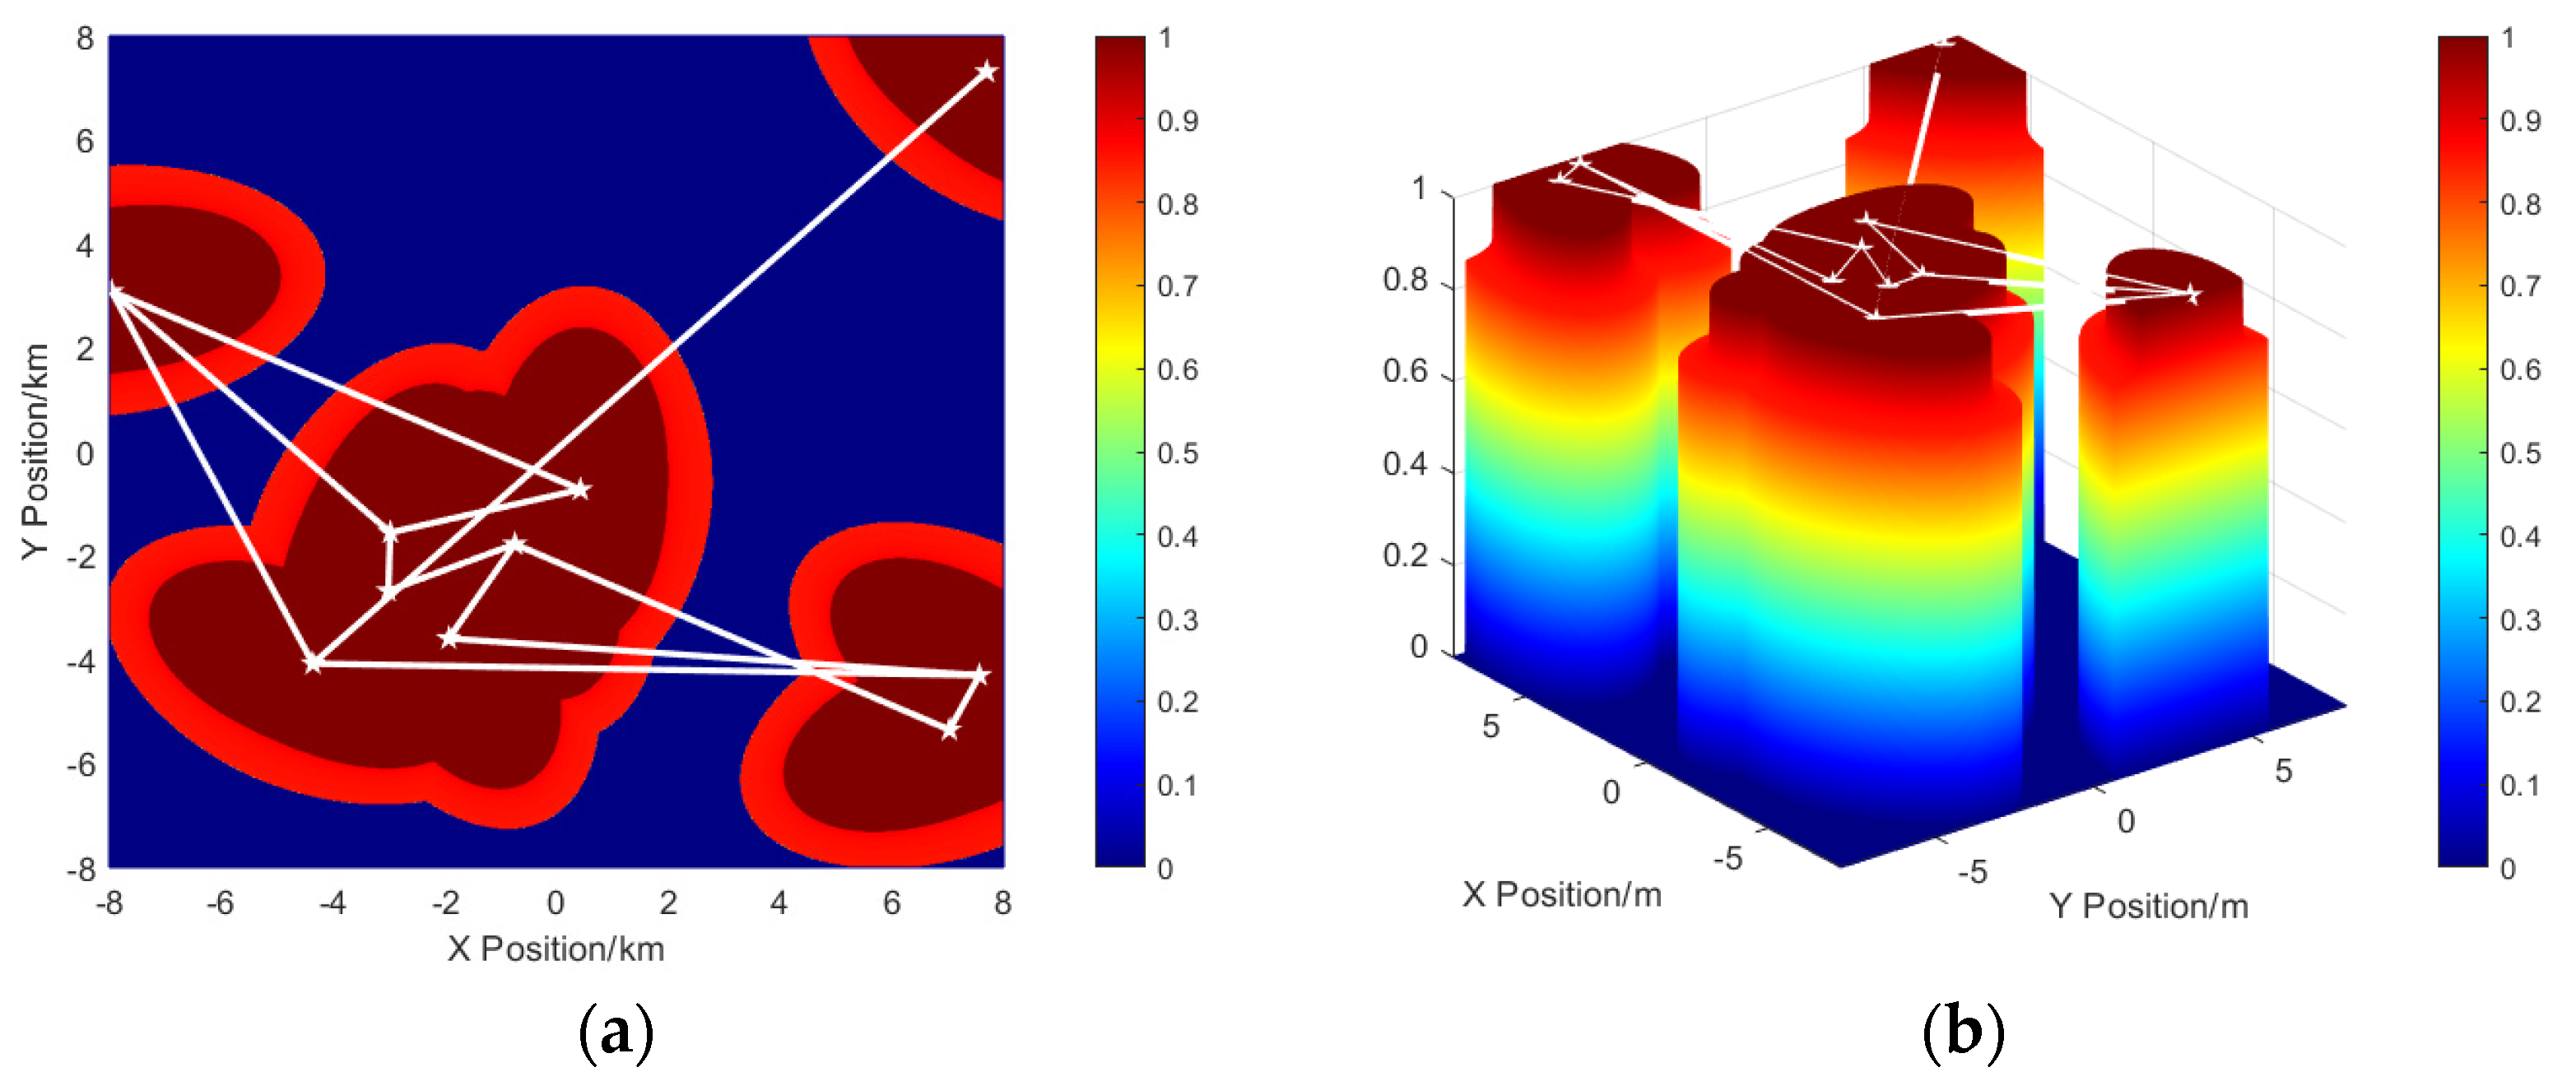
The results of a random deployment of 10 buoys are shown in Figure 6. The white lines represent the communication links between the buoys and the white pentagram represents the geometric center of the buoys.
As shown in analyzing Figure 6, the randomly deployed buoys are distributed in a relatively decentralized manner. As a result, effective coverage of the surveillance area is not achieved. Although this random deployment is easily accomplished, the lack of systematic planning and optimization results in large coverage gaps in the surveillance area, which significantly affects the overall surveillance effectiveness and system performance. In order to improve observation efficiency and coverage, a more optimized deployment strategy is needed to ensure that the buoys are more evenly and reasonably distributed throughout the surveillance area.
Figure 7 shows the optimized deployment of a multi-buoy system based on TSA, WOA, GWO, and PSO.
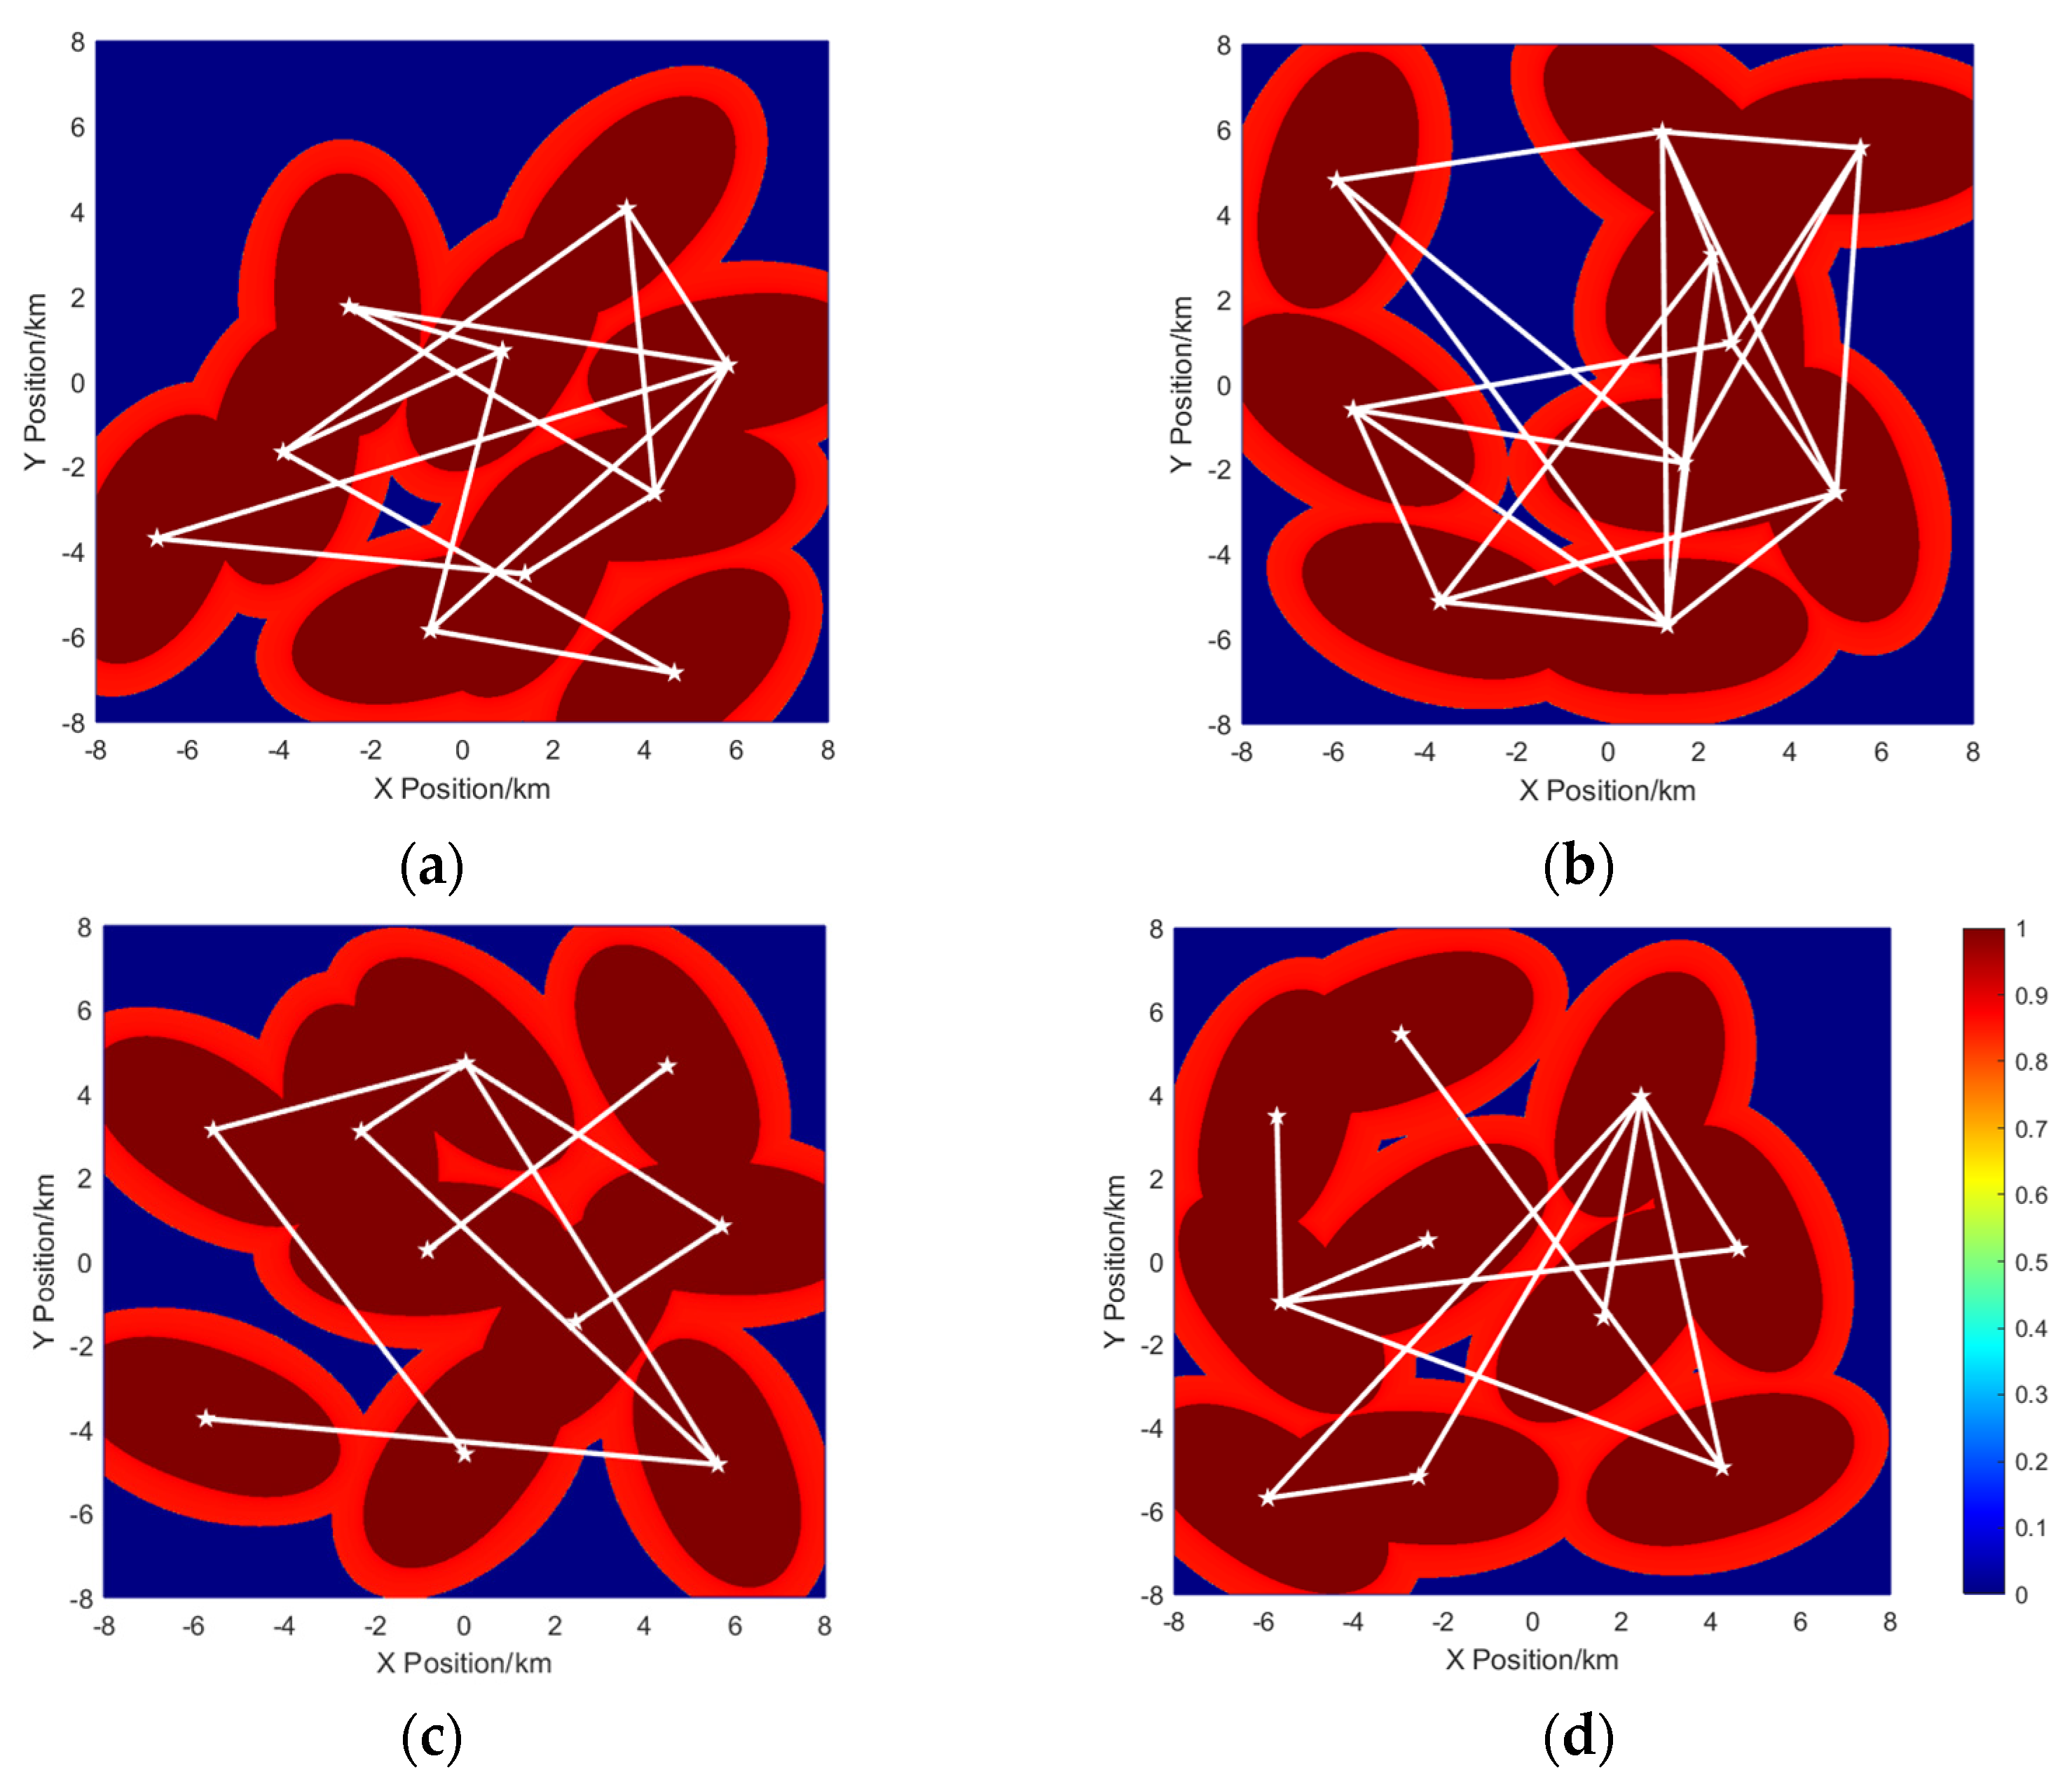
As shown in analyzing Figure 7a and Figure 8a, the optimized deployment based on TSA demonstrates an effective reduction in communication energy consumption but suffers from local optima, with buoys predominantly clustered in the lower-right region, leaving the upper-left unmonitored. This local aggregation restricts observation coverage, indicating a deficiency in the global optimization capability. Conversely, the deployment based on WOA consumes substantial communication energy despite achieving superior spatial coverage, as shown in Figure 7b and Figure 8b. This high energy communication topology, while stabilizing system communication, impacts system longevity and diminishes cooperative observation efficiency. The GWO-based deployment, as shown in Figure 7c and Figure 8c, shows a decentralized layout but includes two buoys that only communicate with each other, compromising network stability and coverage comprehensiveness. Independent communication increases energy consumption and reduces system performance. The PSO-based deployment, as shown in Figure 7d and Figure 8d, presents a more balanced layout but faces high communication energy consumption and risk of connectivity loss due to single-link connections. The algorithm’s tendency to cluster buoys and fall into local minima further escalates energy usage, hindering optimal deployment and system performance.
Figure 9 shows the optimized deployment of a multi-buoy system based on the ITSFO method.
As shown in analyzing Figure 9, the optimized deployment based on ITSFO is significantly improved compared to other algorithms, both in terms of observation coverage ratio and communication energy consumption. ITSFO enables the multi-buoy system to attain larger coverage and significantly reduces the communication energy consumption when completing the cooperative observation task. A well-designed optimization deployment strategy enables a multi-buoy system to conduct long-term, continuous observations of the marine environment.
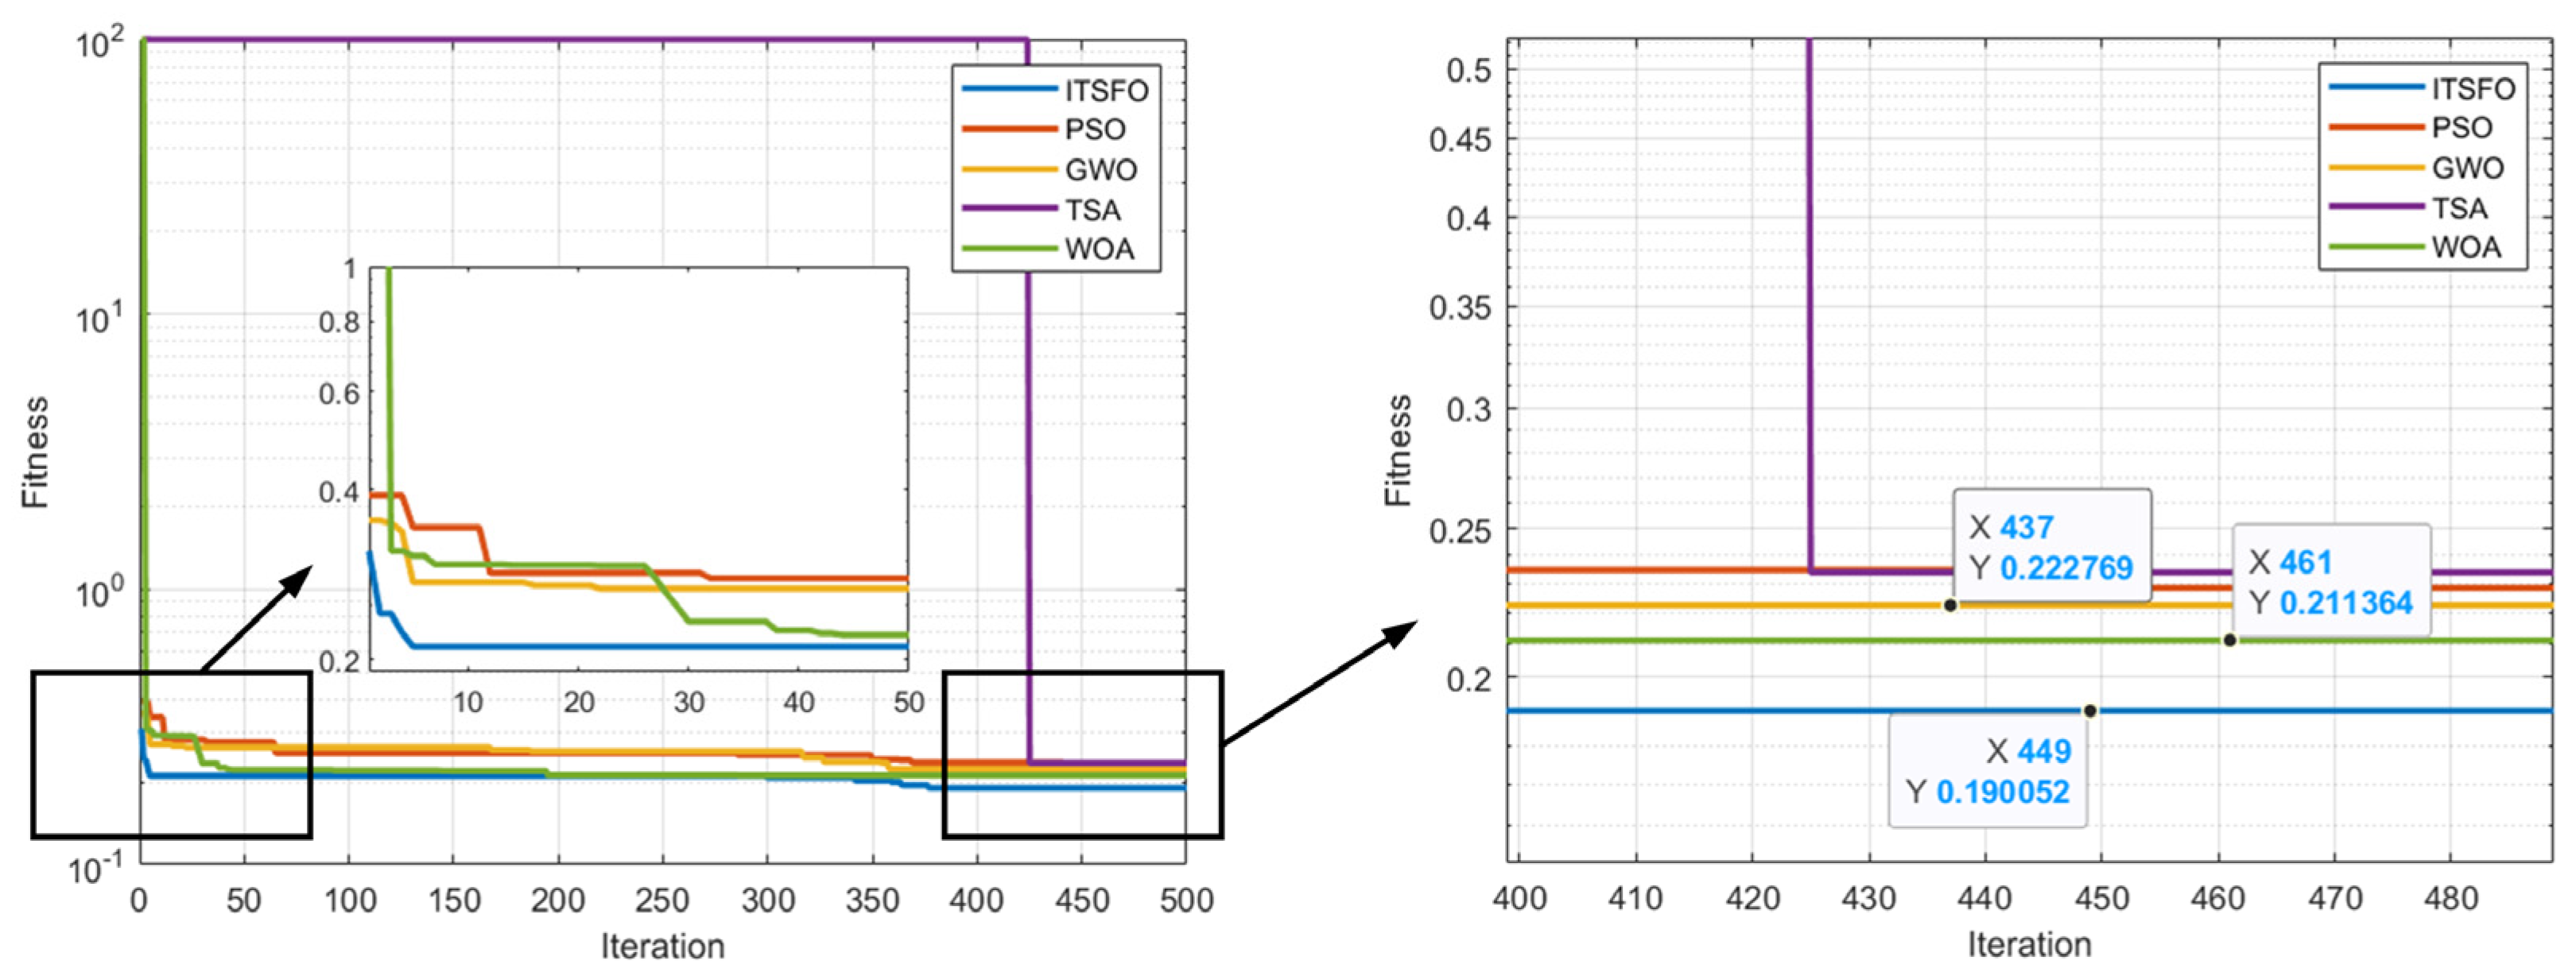
Figure 10 shows the iteration curves for each algorithm. Figure 11 shows the iteration curves for each algorithm over 50 runs. The curves represent the average values and the shaded areas indicate the upper and lower bounds.
As shown in analyzing Figure 10, the convergence performance of the ITSFO algorithm is better than that with PSO, GWO, TSA, and WOA over 500 iterations. In the early stages of optimization (inset graph), ITSFO demonstrates rapid convergence, reducing the fitness value much faster than the other algorithms. As the algorithms approach convergence, ITSFO achieves a final fitness value of 0.190052 at iteration 449, outperforming PSO (0.222769), GWO (0.211364), and the others. TSA shows slower convergence and fails to reach an optimal solution within the given iterations.
As seen in Figure 11, all algorithms converge. However, TSA easily falls into local optima during convergence. Although it eventually converges, it does not find the optimal solution, which hinders the optimal deployment of the multi-buoy system. The ITSFO method proposed in this paper converges significantly faster than the other four algorithms and achieves a better convergence effect. This demonstrates ITSFO’s higher efficiency and effectiveness in solving such optimization problems, confirming its superiority in the optimal deployment of the multi-buoy system. By comparison, it can be concluded that ITSFO has a faster convergence speed and a better convergence effect when dealing with complex optimization problems, which further proves its potential advantages in practical applications.
Table 3 shows the experimental results of the five algorithms after 50 independent runs, including the mean, best, worst, and running time.

6. Conclusions

In this paper, an improved tuna swarm optimizer enhanced with fractional-order calculus (ITSFO) is proposed to solve the optimized deployment problem of multi-buoy systems. First, an observation model is proposed to describe the observation capability of a single buoy, and the observation coverage ratio and communication energy consumption of the multi-buoy system are derived in detail to establish an optimized deployment model for multi-buoy systems. Secondly, tent chaotic mapping is introduced to improve the diversity of population initialization. The observation capability of the multi-buoy system is effectively enhanced by the improved tuna swarm optimizer enhanced with fractional-order calculus. Next, the proposed ITSFO method is compared with existing TSA, PSO, GWO, and WOA. Both simulation and analysis results show the superiority of the proposed algorithm in terms of adaptation and convergence speed. Finally, the feasibility of the observation model proposed in this paper is verified by simulation. The optimized deployment of a multi-buoy system based on ITSFO method is significantly better than that with TSA, PSO, GWO, and WOA and is capable of accomplishing the task of optimized deployment for cooperative observation. The underwater unmanned cluster, as a surface relay node connecting underwater and shore-based system, further improves the observation capability through wide coverage. Future research can explore more diversified application scenarios on this basis and further optimize the performance of the algorithm to adapt to a wider range of underwater mission requirements.

Author Contributions

R.R.: Methodology, Validation, Writing—original draft, Software. L.Z.: Conceptualization, Methodology, Supervision. G.P.: Writing—review & editing. X.Z.: Methodology—optimise. L.L.: Software—Investigation. G.H.: Writing—review & editing. All authors have read and agreed to the published version of the manuscript.

Funding

This research was funded by the Local Science and Technology Special Foundation under the guidance of the Central Government of Shenzhen under Grant No. 202103243003499, the National Research and Development Project under Grant2021YFC2803000 and 2020YFB1313200, the Local Science and Technology Special Foundation under the guidance of the Central Government of Shenzhen under Grant Nos. JCYJ20210324122406019 and JCYJ20210324122010027, the National Natural Science Foundation of China (Grant Nos. 52371339 and 12172283), and the Research Project of the Key Laboratory of Underwater Acoustic Adversarial Technology (Grant No. JCKY2023207CH02). This study was sponsored by the Innovation Foundation for Doctor Dissertation of Northwestern Polytechnical University.

Data Availability Statement

The data presented in this study are available on request from the corresponding author.

Conflicts of Interest

The authors declare no conflict of interest.

References

  1. Song, B.; Pan, G.; Zhang, L.; Huang, Q.; Yu, Y.; Tian, W.; Dong, H.; Zhang, H. Development trend and key technologies of autonomous underwater vehicles. Chin. J. Ship Res. 2022, 17, 27–44. [Google Scholar]
  2. Zhang, W.; Wang, N.X.; Wei, S.; Du, X.; Yan, Z. Overview of unmanned underwater vehicle swarm development status and key technologies. J. Harbin Eng. Univ. 2020, 41, 289–297. [Google Scholar]
  3. Burguera, A.; Bonin-Font, F. Localization, Mapping and SLAM in Marine and Underwater Environments; MDPI-Multidisciplinary Digital Publishing Institute: Basel, Switzerland, 2022. [Google Scholar]
  4. Ren, R.; Zhang, L.; Liu, L.; Pan, G.; Huang, Q.; Chen, Y. Cooperative Deployment Planning of Underwater Unmanned Clusters Based on Hybrid Heuristic Algorithms. In Proceedings of the 2023 8th International Conference on Automation, Control and Robotics Engineering (CACRE), Hong Kong, China, 13–15 July 2023; pp. 300–306. [Google Scholar]
  5. Cheng, Z.; Fan, X.; Guo, L.; Cui, Y. A UUV target detection method based on informer. In Proceedings of the 2022 4th International Conference on Frontiers Technology of Information and Computer (ICFTIC), Qingdao, China, 2–4 December 2022; pp. 774–778. [Google Scholar]
  6. Andriyanov, N.; Soloviev, V.; Solomatin, D. Application of deep learning for augmentation and generation of an underwater dataset with industrial facilities. Bulletin of the South Ural State University. Ser. Comput. Technol. Autom. Control Radioelectron. 2023, 23, 5–16. [Google Scholar]
  7. Ren, R.; Zhang, L.; Liu, L.; Yuan, Y. Two AUVs guidance method for self-reconfiguration mission based on monocular vision. IEEE Sens. J. 2021, 21, 10082–10090. [Google Scholar] [CrossRef]
  8. Wang, H.; Li, Y.; Zhang, L.; Fan, Y.; Li, Z. A self-deployment algorithm for maintaining maximum coverage and connectivity in underwater acoustic sensor networks based on an ant colony optimization. Appl. Sci. 2019, 9, 1479. [Google Scholar] [CrossRef]
  9. Yang, Y.; Xiao, Y.; Li, T. A survey of autonomous underwater vehicle formation: Performance, formation control, and communication capability. IEEE Commun. Surv. Tutor. 2021, 23, 815–841. [Google Scholar] [CrossRef]
  10. Allard, Y.; Shahbazian, E.; Isenor, A. Unmanned Underwater Vehicle (UUV) Information Study; Defence Research and Development Canada: Ottawa, ON, Canada, 2014. [Google Scholar]
  11. Li, J.; Wang, L. Research on searching submarine evaluation of effectiveness of UUV. Ship Sci. Technol. 2016, 38, 206–208. [Google Scholar]
  12. Wu, Y.; Low, K.H.; Lv, C. Cooperative path planning for heterogeneous unmanned vehicles in a search-and-track mission aiming at an underwater target. IEEE Trans. Veh. Technol. 2020, 69, 6782–6787. [Google Scholar] [CrossRef]
  13. Detweiler, C.; Doniec, M.; Vasilescu, I. Autonomous Depth Adjustment for Underwater Sensor Networks: Design and Applications. IEEE ASME Trans. Mechatron. 2012, 17, 16–24. [Google Scholar] [CrossRef]
  14. Shahanaghi, A.; Yang, Y.L.; Buehrer, R.M. Stochastic Link Modeling of Static Wireless Sensor Networks over the Ocean Surface. IEEE Trans. Wirel. Commun. 2020, 19, 4154–4169. [Google Scholar] [CrossRef]
  15. Binitha, S.; Sathya, S.S. A survey of bio inspired optimization algorithms. Int. J. Soft Comput. Eng. 2012, 2, 137–151. [Google Scholar]
  16. Dhiman, G.; Kaur, A. STOA: A bio-inspired based optimization algorithm for industrial engineering problems. Eng. Appl. Artif. Intell. 2019, 82, 148–174. [Google Scholar] [CrossRef]
  17. Kar, A.K. Bio inspired computing—A review of algorithms and scope of applications. Expert Syst. Appl. 2016, 59, 20–32. [Google Scholar] [CrossRef]
  18. Sajith, G.; Srinivas, R.; Golberg, A.; Magner, J. Bio-inspired and artificial intelligence enabled hydro-economic model for diversified agricultural management. Agric. Water Manag. 2022, 269, 107638. [Google Scholar] [CrossRef]
  19. Qazi, W.; Qazi, S.; Iqbal, N.; Raza, K. The scope and applications of nature-inspired computing in bioinformatics. In Nature-Inspired Intelligent Computing Techniques in Bioinformatics; Springer Nature Singapore: Singapore, 2022; pp. 3–18. [Google Scholar]
  20. Xie, L.; Han, T.; Zhou, H.; Zhang, Z.R.; Han, B.; Tang, A. Tuna swarm optimization: A novel swarm-based metaheuristic algorithm for global optimization. Comput. Intell. Neurosci. 2021, 2021, 9210050. [Google Scholar] [CrossRef]
  21. Yan, Z.; Yan, J.; Wu, Y.; Cai, S.; Wang, H. A novel reinforcement learning based tuna swarm optimization algorithm for autonomous underwater vehicle path planning. Math. Comput. Simul. 2023, 209, 55–86. [Google Scholar] [CrossRef]
  22. Tan, M.; Li, Y.; Ding, D.; Zhou, R.; Huang, C. An improved jade hybridizing with tuna swarm optimization for numerical optimization problems. Math. Probl. Eng. 2022, 2022, 7726548. [Google Scholar] [CrossRef]
  23. Wang, J.; Zhu, L.; Wu, B.; Ryspayev, A. Forestry canopy image segmentation based on improved tuna swarm optimization. Forests 2022, 13, 1746. [Google Scholar] [CrossRef]
  24. Fan, C.; Wang, W.; Tian, J. Flexible job shop scheduling with stochastic machine breakdowns by an improved tuna swarm optimization algorithm. J. Manuf. Syst. 2024, 74, 180–197. [Google Scholar] [CrossRef]
  25. Kulkarni, R.V.; Venayagamoorthy, G.K. Bio-inspired algorithms for autonomous deployment and localization of sensor nodes. IEEE Trans. Syst. Man Cybern. Part C (Appl. Rev.) 2010, 40, 663–675. [Google Scholar] [CrossRef]
  26. Attea BA, A.; Abbas, M.N.; Al-Ani, M.; Özdemir, S. Bio-inspired multi-objective algorithms for connected set K-covers problem in wireless sensor networks. Soft Comput. 2019, 23, 11699–11728. [Google Scholar] [CrossRef]
  27. Senel, F. Coverage-aware connectivity-constrained unattended sensor deployment in underwater acoustic sensor networks. Wirel. Commun. Mob. Comput. 2016, 16, 2052–2064. [Google Scholar] [CrossRef]
  28. Su, Y.; Guo, L.; Jin, Z.; Fu, X. A Voronoi-based optimized depth adjustment deployment scheme for underwater acoustic sensor networks. IEEE Sens. J. 2020, 20, 13849–13860. [Google Scholar]
  29. Mosekilde, E.; Aracil, J.; Allen, P.M. Instabilities and chaos in nonlinear dynamic systems. Syst. Dyn. Rev. 1988, 4, 14–55. [Google Scholar] [CrossRef]
  30. Li, Y.-M.; Deng, Y.; Jiang, M.; Wei, D. Fast Encryption Algorithm Based on Chaotic System and Cyclic Shift in Integer Wavelet Domain. Fractal Fract. 2024, 8, 75. [Google Scholar] [CrossRef]
  31. Li, Y.-M.; Jiang, M.; Wei, D.; Deng, Y. A Novel Image Encryption Algorithm Based on Compressive Sensing and a Two-Dimensional Linear Canonical Transform. Fractal Fract. 2024, 8, 92. [Google Scholar] [CrossRef]
  32. Karolyi, G.; Péntek, A.; Scheuring, I.; Tél, T.; Toroczkai, Z. Chaotic flow: The physics of species coexistence. Proc. Natl. Acad. Sci. 2000, 97, 13661–13665. [Google Scholar] [CrossRef]
  33. Kaneko, K. Overview of coupled map lattices. Chaos Interdiscip. J. Nonlinear Sci. 1992, 2, 279–282. [Google Scholar] [CrossRef]
  34. Gorenflo, R.; Mainardi, F. Fractional Calculus: Integral and Differential Equations of Fractional Order; Springer: Vienna, Austria, 1997. [Google Scholar]
  35. Atanackovic, T.M.; Pilipovic, S.; Stankovic, B.; Zorica, D. Fractional Calculus with Applications in Mechanics: Vibrations and Diffusion Processes; John Wiley & Sons: Hoboken, NJ, USA, 2014. [Google Scholar]
  36. Ren, Y.; Li, L.; Wang, W.; Wang, L.; Pang, W. Magnetically Suspended Control Sensitive Gyroscope Rotor High-Precision Deflection Decoupling Method using Quantum Neural Network and Fractional-Order Terminal Sliding Mode Control. Fractal Fract. 2024, 8, 120. [Google Scholar] [CrossRef]
  37. Tumari, M.Z.M.; Ahmad, M.A.; Rashid, M.I.M. A fractional order PID tuning tool for automatic voltage regulator using marine predators algorithm. Energy Rep. 2023, 9, 416–421. [Google Scholar] [CrossRef]
  38. Peng, Y.; He, S.; Sun, K. Chaos in the discrete memristor-based system with fractional-order difference. Results Phys. 2021, 24, 104106. [Google Scholar] [CrossRef]
  39. Yang, Q.; Chen, D.; Zhao, T.; Chen, Y. Fractional calculus in image processing: A review. Fract. Calc. Appl. Anal. 2016, 19, 1222–1249. [Google Scholar] [CrossRef]
  40. Houssein, E.H.; Sayed, A. Dynamic candidate solution boosted beluga whale optimization algorithm for biomedical classification. Mathematics 2023, 11, 707. [Google Scholar] [CrossRef]
  41. Shah, P.; Agashe, S. Review of fractional PID controller. Mechatronics 2016, 38, 29–41. [Google Scholar] [CrossRef]
  42. Nail, B.; Atoussi, M.A.; Saadi, S.; Tibermacine, I.E.; Napoli, C. Real-Time Synchronisation of Multiple Fractional-Order Chaotic Systems: An Application Study in Secure Communication. Fractal Fract. 2024, 8, 104. [Google Scholar] [CrossRef]
  43. Reina, D.G.; Tawfik, H.; Toral, S.L. Multi-subpopulation evolutionary algorithms for coverage deployment of UAV-networks. Ad Hoc Netw. 2018, 68, 16–32. [Google Scholar] [CrossRef]
  44. Zhuang, Y.; Pan, J.; Cai, L. Minimizing energy consumption with probabilistic distance models in wireless sensor networks. In Proceedings of the 2010 Proceedings IEEE INFOCOM, San Diego, CA, USA, 14–19 March 2010; pp. 1–9. [Google Scholar]
Figure 1. The observation range of the ocean buoy proposed in this paper.
Fractalfract 08 00625 g001
Figure 2. The schematic of the optimized deployment model.
Fractalfract 08 00625 g002
Figure 3. The flowchart of the ITSFO method proposed in this paper.
Fractalfract 08 00625 g003
Figure 4. The observation cover ratio and communication energy consumption under different values of λ 1 .
Fractalfract 08 00625 g004
Figure 5. The single-buoy observation model. (a) Buoy probabilistic perceptual model. (b) Buoy observation coverage ratio distribution.
Fractalfract 08 00625 g005
Figure 6. Random deployment. (a) Probability perception distributions. (b) Observation coverage ratio distribution.
Fractalfract 08 00625 g006
Figure 7. Probability perception distributions for four algorithms. (a) TSA, (b) WOA, (c) GWO, (d) PSO.
Fractalfract 08 00625 g007
Figure 8. Observation coverage ratio distribution with topology for four algorithms. (a) TSA, (b) WOA, (c) GWO, (d) PSO.
Fractalfract 08 00625 g008
Figure 9. Optimized deployment based on the ITSFO method. (a) Probability perception distributions. (b) Observation coverage ratio distribution.
Fractalfract 08 00625 g009
Figure 10. Iteration curves for each algorithm.
Fractalfract 08 00625 g010
Figure 11. Iteration curves over 50 runs.
Fractalfract 08 00625 g011
Table 1. Results of the Wilcoxon signed rank test.
FunctionDescriptionITSFO-TSO
pR
F1Unimodal benchmark
functions
3.5694 × 10⁻⁸+
F2Multimodal benchmark
functions
1.734398 × 10⁻⁶+
F37.56 × 10−10+
F43.6788340 × 10−5+
F5Fixed-dimension multimodal benchmark functions1.734398 × 10−6+
F64.254 × 10−9+
F73.181679 × 10−6+
F87.690859 × 10−6+
Table 2. Parameter settings.
ParameterValueParameterValue
W8 (km)wind speed1.5 (m/s)
L8 (km)noise frequency0.2 (kHz)
R m a x 3.5 (km)target radiated noise185 (dB)
R m i n 2.0 (km) R ϵ 0.3 (km)
Table 3. Experimental results of multiple algorithm runs.
ITSFOPSOGWOTSAWOATSO
Mean (Fitness)0.1890940.1904420.19688140.1948840.1990410.191472
Best (Fitness)0.1724170.1843090.1806760.1846440.1875260.180579
Worst (Fitness)0.2271680.2570090.220404200.220983100.2373930.246994
Running time (s)641.416883726.932109674.909515667.857276694.136488663.913382
Disclaimer/Publisher’s Note: The statements, opinions and data contained in all publications are solely those of the individual author(s) and contributor(s) and not of MDPI and/or the editor(s). MDPI and/or the editor(s) disclaim responsibility for any injury to people or property resulting from any ideas, methods, instructions or products referred to in the content.