Abstract
The pore-throat structure is a critical factor in the study of unconventional oil and gas reservoirs, drawing particular attention from petroleum geologists, and it is of paramount significance to analyze to enhance oil and gas production. In tight sandstone, which serves as a significant hydrocarbon reservoir, the internal pore-throat structure plays a decisive role in the storage and migration of fluids such as water, gases, and hydrocarbons. This paper employs casting thin section (CTS), field emission scanning electron microscope (FE-SEM), high-pressure mercury injection (HPMI), and low-temperature nitrogen gas adsorption (LT−N2−GA) experimental tests to qualitatively and quantitatively analyze the characteristics of the pore-throat structure in tight sandstone. The results indicate that the pore types in tight sandstone include intergranular residual pores, dissolution pores, intercrystalline pores, and microfractures, while the throat types encompass sheet-shaped, curved-sheet-shaped, and tubular throats. Analysis of the physical and structural parameters from 13 HPMI and 5 LT−N2−GA samples reveals a bimodal distribution of pore-throat radii. The complexity of the pore-throat structure is identified as a primary controlling factor for reservoir permeability. The fractal dimension (D) exhibits an average value of 2.45, displaying a negative correlation with porosity (R2 = 0.22), permeability (R2 = 0.65), the pore-throat diameter (R2 = 0.58), and maximum mercury saturation (R2 = 0.86) and a positive correlation with threshold pressure (R2 = 0.56), median saturation pressure (R2 = 0.49), BET specific surface area (R2 = 0.51), and BJH total pore volume (R2 = 0.14). As D increases, reservoir pores tend to decrease in size, leading to reduced flow and deteriorated physical properties, indicative of a more complex pore-throat structure.
1. Introduction
In the past decade, with breakthroughs in shale oil technology in the United States, unconventional oil and gas resources have received widespread attention [1,2,3,4,5,6]. Unconventional oil and gas resources typically refer to hydrocarbon reserves that cannot be extracted using conventional methods, including shale oil and gas, tight sandstone oil and gas, coalbed methane, and heavy oil [7,8,9,10]. Many researchers define reservoirs with porosity of less than 10% and permeability of less than 0.1 mD as tight sandstone reservoirs [11,12]. A microscopic pore-throat structure refers to characteristics such as the pore-throat size, geometric shape, and connectivity [13,14]. These characteristics play a pivotal role in determining the reservoir’s porosity and permeability and at the macroscopic level control the storage and transport of oil and gas [13,15]. Tight sandstone is characterized by fine pores and complex microscopic pore-throat structures, poor pore connectivity, and high heterogeneity, primarily distributed in the nanometer to micrometer range [10,16,17]. Understanding a reservoir’s microscopic pore-throat structure is crucial for predicting the “sweet spots” in oil and gas resources and improving petroleum production [18,19].
Nitrogen gas adsorption (N2−GA) has been widely used to study the micro- and nanopore structures of porous materials [20,21,22]. In petroleum geology, N2−GA is typically employed to characterize the pore-throat structures of micro-mesoporous reservoirs [20,21,22,23,24]. Lu et al. [23] conducted a study of reservoir pore-throat structures using N2−GA and high-pressure mercury intrusion (HPMI). They found that as the number of micro- and mesopores increased and the number of larger pores decreased, the total surface area and total pore volume of shale increased, while the average pore diameter decreased. Wang et al. [20] used N2−GA to investigate the nanoscale pore morphology and pore size distribution of lacustrine shale in the Yanchang Formation in Ordos Basin. Yuan and Rezaee [24] analyzed the surface fractal dimensions of ineffective water-occupied pores and the volume fractal dimension of effective pores in shale using the results of nuclear magnetic resonance (NMR) and N2−GA.
Currently, numerous experimental techniques are employed for the study of the pore structure in reservoirs. These primarily include casting thin section (CTS) [25], optical microscopy (OM) [26], field emission scanning electron microscopy (SEM) [26,27], X-ray diffraction (XRD) [27], small-angle neutron scattering (SANS) [28,29,30], N2−GA [21], HPMI [31,32], X-ray computed tomography (X-CT) [33,34], and NMR [35,36] testing. However, these experiments have their own strengths and limitations, making it challenging to effectively capture the structural characteristics of various types of pores and throats. Image analysis methods such as OM, SEM, atomic force microscopy (AFM), and X-ray computed tomography (X-CT) provide visual observations of material pores and throats but lack the capability for quantitative analysis of the pore-throat parameters [37]. Techniques like N2−GA, HPMI, NMR, and SANS can obtain parameters related to materials’ pores and throats but have certain technical and methodological defects [37,38]. For example, during HPMI testing, many small pores can expand or even collapse, resulting in measurements that exceed the theoretical values, with a measurement range of 6 nm to 1000 μm [39]. The N2−GA method, with a testing range of 0.35 nm to 120 nm, cannot adequately measure micron-scale pores [39]. Additionally, these techniques have inherent limitations in their measurement precision. It is essential to select the most suitable experimental method for characterization according to the different types of pores and throats. Accurate characterization of the pore-throat structure, achieved by combining various testing techniques, is crucial in the evaluation and analysis of tight sandstone reservoirs [10].
Fractal theory, introduced by Mandelbrot in 1967 [40], is primarily used to describe chaotic systems of fractal objects [31]. Today, fractal theory finds widespread application in quantitatively characterizing pore parameters in porous materials [31,41,42,43]. Lai and Wang [44] conducted a fractal analysis of the pore structure in tight sandstone using HPMI, revealing that the fractal correlations are more pronounced in smaller pores than in larger pores and fractures. Yu et al. [45] employed gas adsorption to perform fractal analysis of the micro- and mesoporous structures in coal, unveiling how pore volume and surface heterogeneity respond to structural deformation. Wu et al. [46] evaluated the pore-throat fractal dimensions in tight sandstone using HPMI and NMR, finding that complex pore-throat structures with higher fractal dimensions exhibit lower storage and permeability capabilities.
This paper intends to describe and assess the pore-throat structure of tight sandstone. The analysis is conducted from both qualitative and quantitative perspectives, exploring the pore-throat structure, aperture distribution, and pore connectivity of the samples. Additionally, the utilization of LT−N2−GA testing is introduced to address deficiencies in the range, precision, and technical methods associated with the quantitative analysis of reservoir pore-throat structures using HPMI. The paper is organized into four sections: (1) Qualitative analysis of the pore-throat types, aperture sizes, pore geometry, and connectivity of tight sandstone; (2) Detailed characterization and quantitative assessment of pore-throat structures using HPMI and LT−N2−GA; (3) Separate discussions exploring the relationships between pore-throat structure parameters based on HPMI and LT−N2−GA and reservoir properties; (4) Analysis of the fractal dimensions of tight sandstone pore-throat structures and their relationship with permeability, porosity, and pore-throat structure parameters.
2. Materials, Experiments, and Methods
2.1. Materials
In this study, samples were collected from 18 tight sandstone cores from 12 wells in Chang 6 to Chang 8 members in the Longdong area of the Ordos Basin. The burial depth of the samples ranges from 1500 to 2300 m (Table 1 and Table 2). The study area exhibited poor petrophysical properties and a high degree of heterogeneity due to the diagenetic evolution it has undergone.

Table 1.
Microscopic pore-throat structure parameters from HPMI analysis.
Table 2.
Microscopic pore-throat structure parameters from LT−N2−GA.
Cylindrical rock specimens with a diameter of 2.5 cm were obtained by coring the tight sandstone cores. These samples were subjected to an oil removal process using chloroform solvent and were then cleaned with water in an ultrasonic cleaner, followed by drying. The prepared rock specimens were further processed to create samples tailored to meeting the requirements of various experiments.
2.2. Experiments
2.2.1. Casting Thin Section (CTS) Imaging
Samples of tight sandstone measuring 25 × 25 × 0.5 mm were prepared. In a vacuum environment, colored liquid resin was injected into the pores of the samples, and once the liquid resin solidified, the sample was ground to create a rock thin section. The pore-throat structure and mineral composition of the rock were observed under a polarizing microscope.
2.2.2. Field Emission Scanning Electron Microscope (FE-SEM) Imaging
This experiment involved observing the samples using a JSM-7500F field emission scanning electron microscope produced by JEOL Japan Electronics Co., Ltd. (Tokyo, Japan). The samples were prepared as small cubic pieces measuring approximately 1 cm on each side. They were affixed to the specimen holder’s stub using conductive adhesive and applied with a gold sputter coating. The samples were observed after being placed in a vacuum within the microscope’s chamber. This experiment was conducted at the Xi’an Geological Survey Center of the China Geological Survey.
2.2.3. HPMI
Cylindrical tight sandstone with a diameter and length of 2.5 cm, exhibiting intact surfaces without cracks, was chosen for the HPMI test. A 9220-II mercury intrusion porosimeter (Micromeritics Instrument Corporation, Norcross, GA, USA) was employed to inject mercury into the rock samples. Various parameters, such as mercury saturation, pore radius, and pore surface area, were recorded at different pressures during the mercury intrusion and extrusion processes. Subsequently, curves for each parameter were plotted. The maximum capillary pressure for this experiment was 206.88 MPa, and the minimum measurable pore-throat radius was 3.55 nm. This experiment was conducted at the Analysis and Testing Center of the Exploration and Development Research Institute of Changqing Oilfield Branch Company (Qingyang, China).
2.2.4. LT−N2−GA
This experiment was conducted using an ASAP 2460 fully automatic surface area and porosity analyzer (Micromeritics Instrument Corporation, Norcross, GA, USA). We took a 3 g sample and ground it to less than 250 μm before loading it into the sample tube and recording the weight. The sample tube was then sealed and placed in a degassing station. A heating jacket was wrapped around the sample tube, and the degassing parameters were set. The vacuum pump was turned on to subject the samples to vacuum degassing to remove any gases adsorbed on the material’s surface. After degassing, the sample was re-weighed, and the weight was recorded again. The sample tube was then placed in liquid nitrogen, and the analyzer was used to measure the nitrogen adsorption at different pressure points to obtain the adsorption isotherms. This experiment was conducted at Xi’an Shiyou University.
2.3. Methods
2.3.1. Fractal Dimension Based on HPMI
According to the basic principles of fractals, the relationship between the number of pores with a radius of () and the pore-throat radius () can be obtained [47]:
where D is the fractal dimensions.
Based on the Brooks–Corey model [48], the equation for pore-throat volume can be expressed as:
The cumulative volume of pores with a radius smaller than r is given by:
Therefore, the cumulative volume percentage of pores with a radius less than can be expressed as:
where is the minimum value of is the maximum value of .
The radius of the pore throat () and the capillary pressure () have the following relationship [49]:
where is the surface tension of the material; is the wetting angle.
From Equations (4) and (5), we see:
where is the maximum value of . can be expressed as ( is the mercury saturation of the reservoir).
The value D is from the slope of the fitted line (6). The range of D is 2 to 3, and the larger D, the more complex the pore-throat structure [44].
2.3.2. Fractal Dimensions Based on N2−GA
- Calculation of pore-specific surface area using the BET equation
In the LT−N2−GA experiments, the specific surface area of the pores is typically calculated using the Brunauer–Emmett–Teller (BET) equation [50]. The calculation equation is as follows [51]:
where is the total volume of gas adsorbed at equilibrium pressure; is the amount of gas adsorbed in a monolayer; is the saturation vapor pressure of the adsorbate; is the adsorption equilibrium pressure; is a constant.
Typically, data within the range of 0.05 to 0.35 have a good fit with the BET equation, so this study selected seven data points within this range [52]. From Equation (7), it is evident that the BET equation represents a linear relationship, and the slope (m) and intercept (n) of this linear equation can be inferred as follows:
Based on Equations (8) and (9), it can be derived that:
The specific surface area can be inferred from .
- 2.
- BJH method for pore size analysis
The use of the Barret–Joyner–Halenda (BJH) method to calculate pore sizes in porous materials is widely accepted among researchers [53]. The pore size () is calculated using the Kelvin correction equation [21]:
where is the surface tension of liquid nitrogen; is the shape factor of the gas–liquid interface; is the molar volume of liquid nitrogen; T is the absolute temperature (77 K); is the gas constant; is the Halsey empirical equation for liquid nitrogen.
- 3.
- Calculation of fractal dimensions using the FHH fractal model
The Frenkel–Halsey–Hill (FHH) fractal model has been proverbially used to characterize irregular porous materials’ surfaces [54,55]. By using the data obtained from the LT−N2−GA measurements and applying them to the FHH fractal model, we can derive the equation for calculating the fractal dimension.
where is a constant.
The value D can be calculated from the slope () of the straight line in the plot of against :
3. Results
3.1. Microscopic Characteristics of Pores and Throats
In reservoirs, pores serve as fluid storage spaces, while throats control fluid flowability [56]. Utilizing the CTS and FE-SEM images (Figure 1), four primary pore types are evident in tight sandstone: residual intergranular pores (Figure 1a,c,e), dissolution pores (Figure 1b,d,f), intercrystalline pores (Figure 1g), and microfractures (Figure 1h).
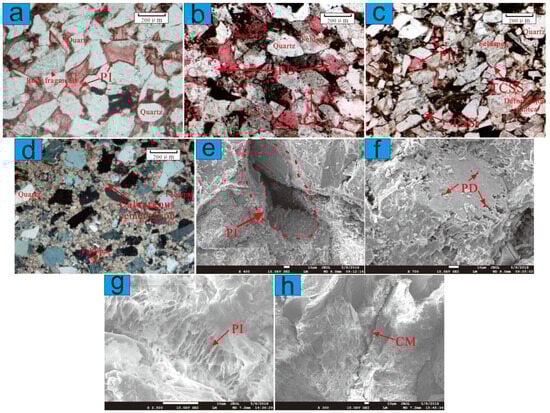
Figure 1.
Microscopic pore types under CTS and FE-SEM imaging. (a) Intergranular pores (PI), B111, Chang 63, 2114.0 m; (b) well-developed feldspar dissolution pores (PD), grain-to-grain line contact with irregularities (CL), B143, Chang 62, 1923.25 m; (c) intergranular pores (PI), sheet-shaped throats (TSS), and curved-sheet-shaped throats (TCSS), B143, Chang 63, 1951.40 m; (d) calcareous cementation prone to forming carbonate dissolution pores, B239, Chang 63, 2105.85 m; (e) intergranular pores (PI), B23, Chang 81, 2060.2 m; (f) intragranular dissolution pores (PD), B23, Chang 81, 2060.2 m; (g) montmorillonite-filling intergranular pores (PI), intercrystalline throats within montmorillonite aggregates (TI), tubular-shaped throats (TTS), B29, Chang 71, 1549.5 m; (h) micro-cracks within rock particles (CM), B29, Chang 81, 1634.9 m.
Residual intergranular pores are remnants of the original primary pores in the reservoir, in the shape of triangles or irregular polygons due to compaction and cementation (Figure 1a,c,e). Dissolution pores primarily consist of intragranular dissolution pores (Figure 1f) and intergranular dissolution pores (Figure 1b). They form during the process of minerals transitioning into other minerals due to environmental changes, leading to the creation of dissolution pores. They are commonly found in minerals like feldspar (Figure 1b,f), lithic fragments, and carbonate rocks (Figure 1d). Intergranular pores are typically fine pores formed by the accumulation of clay minerals such as kaolinite, illite, and chlorite. They make a minor contribution to the reservoir’s storage and permeability. Microfractures are formed by fracturing brittle minerals such as quartz under pressure, significantly enhancing the reservoir’s flowability.
The throat types primarily include sheet-shaped throats, curved-sheet-shaped throats (Figure 1c), and tubular (Figure 1g) throats. Sheet-shaped and curved-sheet-shaped throats are mainly determined by early diagenetic compaction and represent the primary types of throats between the grains in tight sandstone. Tubular throats are mainly formed among clay minerals.
3.2. Pore-Throat Distribution Characteristics Based on HPMI
3.2.1. Basic Features
Analysis of the pore-throat structure and pore size distribution using HPMI on 13 samples of tight sandstone reveals that the threshold pressure (Pmin) ranges from 1.1 to 3.45 MPa (Table 1), with an average of 1.87 MPa. A lower initial slope of the threshold pressure and capillary pressure curve corresponds to the larger porosity and permeability of tight sandstone (Table 1) (Figure 2). Other pore-throat structure parameters include the pressure at 50% mercury saturation (P50) ranging from 2.76 MPa to 16.55 MPa, averaging 6.25 MPa; the maximal pore-throat radius (rmax,), ranging from 0.21 μm to 0.67 μm, averaging 0.45 μm; the median pore-throat radius (r50), ranging from 0.044 μm to 0.266 μm, averaging 0.153 μm; and the maximum mercury saturation (SHgmax), ranging from 84.35–98.81%, averaging 93.29%. The pore-throat radius distribution spans from 0.003 to 100 μm, primarily concentrated between 0.025 and 1.5 μm (Figure 3). The HPMI analysis indicates that tight sandstone exhibits complex and highly heterogeneous pore-throat structures.
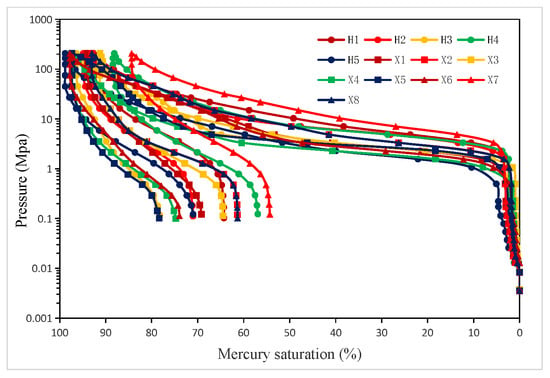
Figure 2.
Characteristics of HPMI capillary pressure curve.
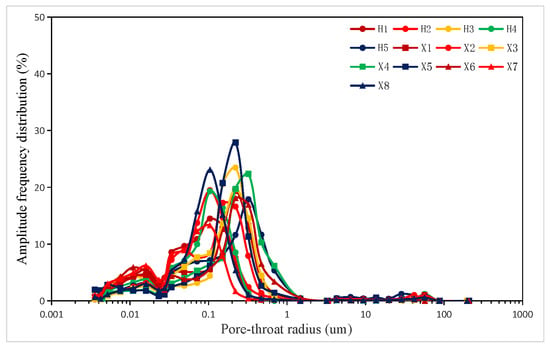
Figure 3.
HPMI pore-throat radius distribution features.
3.2.2. Pore-Throat Fractal Dimensions (D)
A fractal analysis was conducted by plotting the − graph for the 13 samples (Figure 4). The results reveal high correlation coefficients (R12) ranging from 0.921 to 0.995 (average of 0.972) for small pores and (R22) from 0.654 to 0.993 (average of 0.896) for large pores. It indicates a strong correlation between and , allowing the application of fractal geometry theory to characterize the tight sandstone samples. Figure 4 shows that all the samples exhibit dual-fractal features, with a transition point at = 1 MPa, corresponding to small pores (radius less than 0.735 μm) and large pores (radius greater than 0.735 μm). The fractal dimensions for small pores (D1) range from 2.21 to 2.61 (average of 2.44), while for large pores (D2), the range is 2.9867–2.9983 (average of 2.9949) (Table 1). This suggests that the structure complexity of large pores is higher than that of small pores. The total reservoir fractal dimensions (D) and the fractal dimensions for each pore type are related as expressed by Equation (15) [57]:
where is the porosity of small pores; is the porosity of large pores.
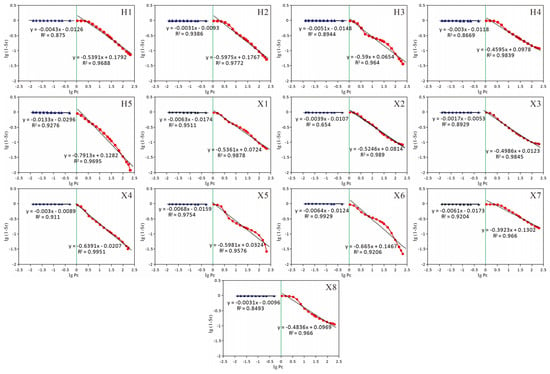
Figure 4.
The curve of pore-throat size fractal features intersecting .
As shown in Figure 3, it is obvious that the proportion of large pores is minimal, constituting less than 5% of the total pores. In other words, the fractal dimensions of large pores have a minimal impact on the total fractal dimensions (Table 1). In the 13 samples, the maximum difference between the fractal dimensions of small pores and the total fractal dimensions is 0.04 (Table 1). Therefore, the fractal dimensions of small pores can be approximated as the total fractal dimensions for the analysis of the pore-throat structures in this tight sandstone.
3.3. Pore Distribution Characteristics Based on LT−N2−GA
3.3.1. Basic Characteristics
LT−N2−GA experiments were conducted on five samples, and the adsorption–desorption isotherms were plotted (Figure 5). In the classification of adsorption–desorption isotherms by the International Union of Pure and Applied Chemistry (IUPAC) [58], it was found that the curves of the five samples are close to Type IV. In the 0 ≤ P/P0 ≤ 0.1 range, N2 molecules were adsorbed in the micropores of the samples as a monolayer. At relatively low pressures, the adsorption increased, and the desorption process could not be completed (Figure 5). In the 0.1 ≤ P/P0 ≤ 0.47 range, the mesopores began to adsorb the N2 molecules as a multi-layer. With increasing pressure, the N2 adsorption increased slowly, and the adsorption–desorption isotherms overlapped (Figure 5). In the 0.47 ≤ P/P0 ≤ 1.0 range, the mesopores were in the capillary condensation stage. With increasing pressure, the N2 adsorption increased rapidly, and the adsorption–desorption isotherms formed an H3-type hysteresis loop (Figure 5). The steeper the capillary condensation segment of the adsorption–desorption isotherms, the more uniform the mesopore distribution. The larger the mesopore diameter, the higher the pressure required for capillary condensation [59]. The capillary condensation segment of the tight sandstone samples is steep. After capillary condensation, there is no adsorption termination plateau, indicating a relatively uniform mesopore distribution with the presence of macropores inside the samples (Figure 5).
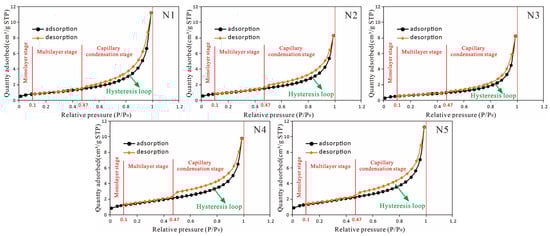
Figure 5.
LT−N2−GA isotherms of different samples.
The use of the BJH analysis method to calculate materials’ pore size has been widely accepted by scholars [60,61,62]. Based on the LT−N2−GA experiments, this study plotted curves of the pore size distribution using the BJH analysis method (Figure 6). Figure 6 shows that the pore radius distribution of the five samples is highly similar. The N2 adsorption volume exhibits two consecutive peaks, indicating a relatively high rate with the corresponding pore radius distribution. The two high peaks are in the ranges of 3–22 nm and 25–63 nm, suggesting that tight sandstone is mainly dominated by mesopores, with few macropores larger than 50 nm, and larger pores of an increasing pore size gradually decrease (Figure 6).
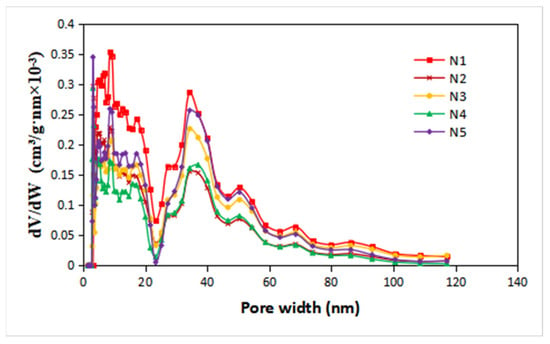
Figure 6.
Pore size distribution curves of different tight sandstone samples based on LT−N2−GA.
3.3.2. Pore-Throat Fractal Dimensions (D)
Utilizing the FHH fractal theory, the − curves for the five samples were fitted (Figure 7). As shown in Figure 7, there is a strong linear correlation between ln V and , and R2 exceeds 0.98 for all the samples (Table 2). This demonstrates the pronounced fractal characteristics in the pore-throat structure of tight sandstone. According to the calculation method for D, D primarily ranges from 2.458 to 2.591 (averaging 2.527). This indicates a high level of complexity in the pore-throat structure and strong heterogeneity (Table 2).
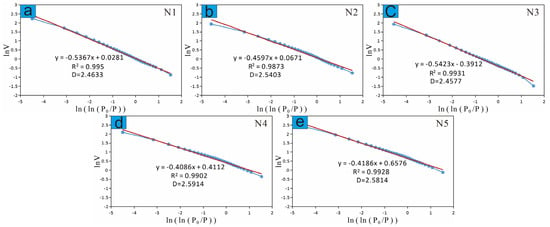
Figure 7.
D calculation results from LT−N2−GA experiment.
4. Analysis and Discussion
4.1. Analysis of Tight Sandstone Pores Based on HPMI
4.1.1. Reservoir Pore-Throat Structure Characteristics
The analysis of the reservoir’s porosity and permeability through HPMI revealed that its porosity ranges from 8.37 to 12.81%, averaging 10.82%, and its permeability ranges from 0.025 to 0.262 mD, averaging 0.122 mD (Table 1). The observations indicate a certain correlation between porosity and permeability (Figure 8). The correlation between the reservoir pore-throat structure parameters and porosity is relatively weak (all R2 values are below 0.4), but there is a stronger correlation with permeability (all R2 values are above 0.5) (Figure 9 and Figure 10). Porosity and permeability show a negative correlation with Pmin and P50 but a positive correlation with rmax, r50, and SHgmax (Figure 9 and Figure 10). This suggests that the reservoir exhibits significant heterogeneity, with throat characteristics being the main controlling factor for reservoir permeability.
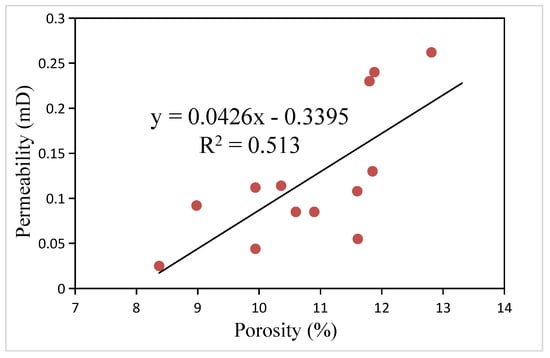
Figure 8.
Porosity–permeability relationship chart.
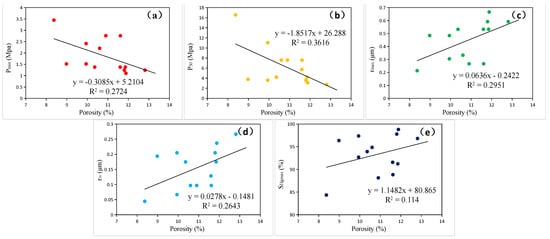
Figure 9.
Relationship between porosity and pore-throat structure parameters. (a) porosity vs. Pmin; (b) porosity vs. P50; (c) porosity vs. rmax; (d) porosity vs. r50; (e) porosity vs. SHgmax.
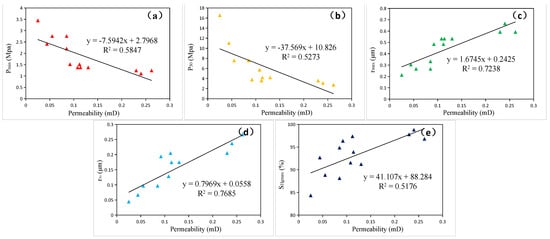
Figure 10.
Relationship between permeability and pore-throat structure parameters. (a) permeability vs. Pmin; (b) permeability vs. P50; (c) permeability vs. rmax; (d) permeability vs. r50; (e) permeability vs. SHgmax.
4.1.2. Relationship between D and Physical Properties
D shows a clear negative correlation with physical properties, with a weaker correlation with porosity and a stronger correlation with permeability (Figure 11). Ruifei et al. found that porosity is mainly controlled by large to medium pores, while permeability is controlled by small pores and pore-throat connectivity [63]. Therefore, this shows that the reservoirs studied here have fewer large pores, mainly consisting of medium to small pores and good pore-throat connectivity.
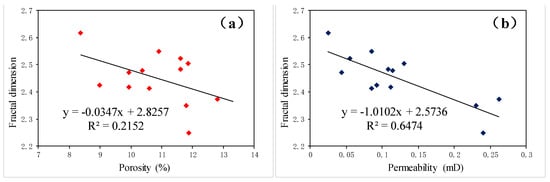
Figure 11.
The relationship between D and porosity (a) and permeability (b).
4.1.3. Relationship between D and Pore-Throat Structure Parameters
Figure 12a,b demonstrate a strong positive correlation between the fractal dimensions and Pmin, as well as P50. As the fractal dimensions increase, both Pmin and P50 also increase. This indicates that the complex pore-throat structure reduces the permeability of hydrocarbons, requiring higher pressure for fluid flow within the reservoir.
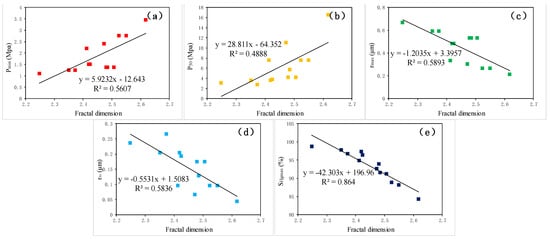
Figure 12.
The relationship between the fractal dimensions (D) and pore-throat structure parameters. (a) Pmin; (b) P50; (c) rmax; (d) r50; (e) SHgmax.
rmax and r50 are two physical parameters reflecting the pore-throat size in the reservoir [57]. Both parameters exhibit a strong negative correlation with the fractal dimensions, R2, close to 0.6 (Figure 12c,d). This indicates that as D increases, the maximum mercury saturation decreases, the pore-throat connectivity worsens, and the heterogeneity of the reservoir properties becomes more pronounced.
The maximum mercury saturation represents the volume percentage of the connected pore space when mercury enters at maximum pressure, indicating the proportion of the connected pore volume to the total pore volume [57]. As shown in Figure 12e, there is a strong negative correlation between D and the maximum mercury saturation, R2, of 0.864. This suggests that as the fractal dimensions increase, reflecting a more complex pore-throat structure, the maximum mercury saturation decreases, indicating poorer pore-throat connectivity and stronger heterogeneity in the reservoir properties.
4.2. Analysis of Tight Sandstone Pores Based on LT−N2−GA
4.2.1. Relationships between Porosity and Permeability and Pore-Throat
Structure Parameters
The pore-throat structure parameters play a pivotal role in determining the fundamental qualities of materials [64,65]. The utilization of pore-throat structure parameters obtained from LT−N2−GA analysis for investigating oil and gas reservoirs has found wide applications in the field of petroleum geology [66,67,68]. As depicted in Figure 13a,b, the BET specific surface area exhibits an inverse relationship with the porosity and permeability of tight sandstone. It exhibits a weaker correlation with porosity but a stronger one with permeability. Porosity is determined by pore size and quantity, while the specific surface area is influenced by pore size and quantity and also by factors like pore shape. The difference in the physical properties between porosity and specific surface area accounts for their relatively poor negative correlation. The surface of material pores serves as the boundary for fluid flow, and during the process of fluid infiltration, the fluid interacts with the rock surface, leading to adsorption phenomena that increase the resistance to fluid flow [69,70,71,72]. An increase in the specific surface area results in greater resistance, slowing down the fluid flow and reducing permeability.
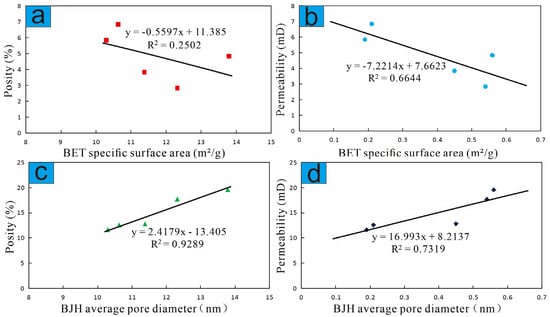
Figure 13.
Relationships between porosity and permeability and pore-throat structure parameters. (a) Porosity vs. BET specific surface area. (b) Permeability vs. BET specific surface area. (c) Porosity vs. BJH average pore diameter. (d) Permeability vs. BJH average pore diameter.
In Figure 13c, the BJH mean pore diameter exhibits an extremely strong positive correlation with porosity. This suggests that pore size is the primary controlling factor for porosity, indicating that larger pores result in higher porosity. Additionally, the BJH mean pore diameter displays a strong correlation with permeability as well (Figure 13d), implying that larger pore throats are favorable for fluid permeation.
4.2.2. Relationship between D, Porosity, and Permeability
The application of pore fractal dimension analysis to porosity and permeability in porous materials has been universally adopted in the oil and gas reservoir field [37,44,46,57,73]. Fit analysis of the relationships between D, porosity, and permeability revealed a strong correlation among these three parameters (Figure 14a–c). There is a clear positive correlation between porosity and permeability (Figure 14a). This indicates that in tight sandstone reservoirs, the predominant types of throats are sheet-shaped and curved-sheet-shaped. There are fewer pores such as closed pores or dead-end pores, which can increase porosity but reduce permeability.
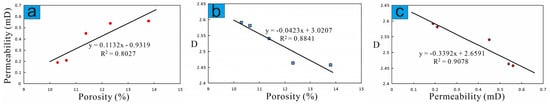
Figure 14.
The correlation between D, porosity, and permeability based on LT−N2−GA. (a) Porosity vs. permeability. (b) D vs. porosity. (c) D vs. permeability.
In Figure 14b,c, D exhibits a strong negative correlation with both porosity and permeability. As D increases, the reservoir’s porosity and permeability decrease. The value of D of mesopores is significantly negatively correlated with porosity and permeability in tight sandstone reservoirs [57]. As is evident from Figure 6, the pore size distribution in tight sandstone predominantly comprises mesopores. Therefore, the strong negative correlation between D and porosity, as well as permeability, can be utilized to characterize the permeability characteristics of tight sandstone.
4.2.3. Relationship between D and Pore-Throat Structure Parameters
The value of D can effectively characterize the complexity of the pore-throat structure. As D increases, the complexity and heterogeneity of the pore-throat structure also increase [74,75]. As shown in Figure 15a, D has a strong correlation with the BET specific surface area. The more complex the pore-throat structure, the larger the BET specific surface area. In contrast, Figure 15b reveals a weak correlation between the fractal dimensions and the BJH total pore volume, suggesting that the complexity of the pore-throat structure is not related to the pore volume. Figure 15c demonstrates a very strong negative correlation between D and the BJH average pore diameter. This indicates that the pore size is the primary factor in the complexity of the pore-throat structure.

Figure 15.
Relationships between D and pore-throat structure parameters based on LT−N2−GA. (a) D and BET specific surface area. (b) D and BJH total pore volume. (c) D and BJH average pore diameter.
5. Conclusions
This study utilized CTS, FE-SEM, HPMI, and LT−N2−GA experiments to analyze the pore-throat structure characteristics of tight sandstone. The following conclusions were drawn:
- (1)
- The pore types in the tight sandstone reservoirs of Chang 6 to Chang 8 members in the Longdong area include residual intergranular pores, dissolution pores, intercrystalline pores, and microfractures. The throat types primarily include sheet-shaped throats, curved-sheet-shaped throats, and tubular throats.
- (2)
- In the studied area, there is a relatively small proportion of pores with a radius larger than 735 nm in reservoirs. For pores with a radius smaller than 735 nm, the fractal dimensions serve as an effective metric to characterize the complexity of pore-throat structures (all the R2 values are above 0.9). Integrated analysis of the HPMI and LT−N2−GA tests reveals that for smaller pores, utilizing fractal dimensions is more effective in characterizing pore-throat structures.
- (3)
- D shows a relatively poor negative correlation with porosity but a strong negative correlation with permeability. It exhibits a significant positive correlation with Pmin and P50, a favorable negative correlation with rmax and r50, and a very strong negative correlation with SHgmax.
- (4)
- The fractal dimensions (D) exhibit a strong negative correlation with porosity, permeability, and BJH average pore diameter; a strong positive correlation with BET specific surface area; and a relatively weak positive correlation with BJH total pore volume. The pore-throat structure of the tight sandstone reservoir in the target area is complex, and the heterogeneity is significant.
- (5)
- There is a strong positive correlation between porosity and permeability. As porosity, permeability, and pore connectivity develop, the reservoir’s storage performance and oil and gas recovery efficiency improve.
Author Contributions
Conceptualization, T.H.; methodology, T.H. and Z.C.; software, T.H.; validation, Y.S. and Z.Z.; formal analysis, G.C.; investigation, T.H.; resources, Z.C.; data curation, T.H.; writing—original draft preparation, T.H.; writing—review and editing, H.X.; visualization, Z.Z.; supervision, Y.Z.; funding acquisition, Y.Z. All authors have read and agreed to the published version of the manuscript.
Funding
This research was funded by the National Science and Technology Major Project of China (Grant No. 2016ZX05050006).
Data Availability Statement
The data presented in this study are available from the author upon request.
Conflicts of Interest
Author Z.Z. was employed by the PetroChina Qinghai Oilfield Company. The remaining authors declare that the research was conducted in the absence of any commercial or financial relationships that could be construed as a potential conflict of interest.
References
- Katz, B.; Lin, F. Lacustrine Basin Unconventional Resource Plays: Key Differences. Mar. Pet. Geol. 2014, 56, 255–265. [Google Scholar] [CrossRef]
- Wang, S.; Qin, C.; Feng, Q.; Javadpour, F.; Rui, Z. A Framework for Predicting the Production Performance of Unconventional Resources Using Deep Learning. Appl. Energy 2021, 295, 117016. [Google Scholar] [CrossRef]
- Slatt, R. Important Geological Properties of Unconventional Resource Shales. Open Geosci. 2011, 3, 435–448. [Google Scholar] [CrossRef]
- Pang, X.; Jia, C.; Wang, W.; Chen, Z.; Li, M.; Jiang, F.; Hu, T.; Wang, K.; Wang, Y. Buoyance-Driven Hydrocarbon Accumulation Depth and Its Implication for Unconventional Resource Prediction. Geosci. Front. 2021, 12, 101133. [Google Scholar] [CrossRef]
- Ashayeri, C.; Jha, B. Evaluation of Transfer Learning in Data-Driven Methods in the Assessment of Unconventional Resources. J. Pet. Sci. Eng. 2021, 207, 109178. [Google Scholar] [CrossRef]
- Davies, R.J.; Almond, S.; Ward, R.S.; Jackson, R.B.; Adams, C.; Worrall, F.; Herringshaw, L.G.; Gluyas, J.G.; Whitehead, M.A. Oil and Gas Wells and Their Integrity: Implications for Shale and Unconventional Resource Exploitation. Mar. Pet. Geol. 2014, 56, 239–254. [Google Scholar] [CrossRef]
- Zheng, M.; Li, J.; Wu, X.; Wang, S.; Guo, Q.; Yu, J.; Zheng, M.; Chen, N.; Yi, Q. China’s Conventional and Unconventional Natural Gas Resources: Potential and Exploration Targets. J. Nat. Gas Geosci. 2018, 3, 295–309. [Google Scholar] [CrossRef]
- Rani, S.; Padmanabhan, E.; Prusty, B.K. Review of Gas Adsorption in Shales for Enhanced Methane Recovery and CO2 Storage. J. Pet. Sci. Eng. 2019, 175, 634–643. [Google Scholar] [CrossRef]
- Alafnan, S.; Awotunde, A.; Glatz, G.; Adjei, S.; Alrumaih, I.; Gowida, A. Langmuir Adsorption Isotherm in Unconventional Resources: Applicability and Limitations. J. Pet. Sci. Eng. 2021, 207, 109172. [Google Scholar] [CrossRef]
- Lai, J.; Wang, G.; Wang, Z.; Chen, J.; Pang, X.; Wang, S.; Zhou, Z.; He, Z.; Qin, Z.; Fan, X. A Review on Pore Structure Characterization in Tight Sandstones. Earth-Sci. Rev. 2018, 177, 436–457. [Google Scholar] [CrossRef]
- Zou, C.; Zhu, R.; Liu, K.; Su, L.; Bai, B.; Zhang, X.; Yuan, X.; Wang, J. Tight Gas Sandstone Reservoirs in China: Characteristics and Recognition Criteria. J. Pet. Sci. Eng. 2012, 88–89, 82–91. [Google Scholar] [CrossRef]
- Gao, H.; Li, H.A. Pore Structure Characterization, Permeability Evaluation and Enhanced Gas Recovery Techniques of Tight Gas Sandstones. J. Nat. Gas Sci. Eng. 2016, 28, 536–547. [Google Scholar] [CrossRef]
- Xie, J.-Y.; Zhang, J.-J.; Xiang, W.; Fang, Y.-P.; Xue, Y.-J.; Cao, J.-X.; Tian, R.-F. Effect of Microscopic Pore Structures on Ultrasonic Velocity in Tight Sandstone with Different Fluid Saturation. Pet. Sci. 2022, 19, 2683–2694. [Google Scholar] [CrossRef]
- Li, G.; Qin, Y.; Zhou, X.; Zhang, Y.; Hu, W. Comparative Analysis of the Pore Structure of Fusain in Lignite and High-Volatile Bituminous Coal. J. Nat. Gas Sci. Eng. 2021, 90, 103955. [Google Scholar] [CrossRef]
- Yongzan, W.; Guanhua, N.; Xinyue, Z.; Yicheng, Z.; Gang, W.; Zhenyang, W.; Qiming, H. Fine Characterization of Pore Structure of Acidified Anthracite Based on Liquid Intrusion Method and Micro-CT. Energy 2023, 263, 125639. [Google Scholar] [CrossRef]
- Xia, D.; Yang, Z.; Gao, T.; Li, H.; Lin, W. Characteristics of Micro- and Nano-Pores in Shale Oil Reservoirs. J. Pet. Explor. Prod. Technol. 2021, 11, 157–169. [Google Scholar] [CrossRef]
- Xiao, D.; Jiang, S.; Thul, D.; Lu, S.; Zhang, L.; Li, B. Impacts of Clay on Pore Structure, Storage and Percolation of Tight Sandstones from the Songliao Basin, China: Implications for Genetic Classification of Tight Sandstone Reservoirs. Fuel 2018, 211, 390–404. [Google Scholar] [CrossRef]
- Lai, J.; Wang, G.; Ran, Y.; Zhou, Z.; Cui, Y. Impact of Diagenesis on the Reservoir Quality of Tight Oil Sandstones: The Case of Upper Triassic Yanchang Formation Chang 7 Oil Layers in Ordos Basin, China. J. Pet. Sci. Eng. 2016, 145, 54–65. [Google Scholar] [CrossRef]
- Lai, J.; Wang, G.; Wang, S.; Cao, J.; Li, M.; Pang, X.; Zhou, Z.; Fan, X.; Dai, Q.; Yang, L.; et al. Review of Diagenetic Facies in Tight Sandstones: Diagenesis, Diagenetic Minerals, and Prediction via Well Logs. Earth-Sci. Rev. 2018, 185, 234–258. [Google Scholar] [CrossRef]
- Wang, Y.; Zhu, Y.; Wang, H.; Feng, G. Nanoscale Pore Morphology and Distribution of Lacustrine Shale Reservoirs: Examples from the Upper Triassic Yanchang Formation, Ordos Basin. J. Energy Chem. 2015, 24, 512–519. [Google Scholar] [CrossRef]
- Cao, Z.; Liu, G.; Zhan, H.; Li, C.; You, Y.; Yang, C.; Jiang, H. Pore Structure Characterization of Chang-7 Tight Sandstone Using MICP Combined with N2GA Techniques and Its Geological Control Factors. Sci. Rep. 2016, 6, 36919. [Google Scholar] [CrossRef] [PubMed]
- Liu, X.; Song, D.; He, X.; Wang, Z.; Zeng, M.; Wang, L. Quantitative Analysis of Coal Nanopore Characteristics Using Atomic Force Microscopy. Powder Technol. 2019, 346, 332–340. [Google Scholar] [CrossRef]
- Lu, Y.; Liu, J.; Tang, J.; Ao, X.; Li, H.; Zhou, J.; Sun, X. Pore Changes of Slickwater-Containing Shale under Supercritical CO2 Treatment. Fuel 2022, 312, 122775. [Google Scholar] [CrossRef]
- Yuan, Y.; Rezaee, R. Fractal Analysis of the Pore Structure for Clay Bound Water and Potential Gas Storage in Shales Based on NMR and N2 Gas Adsorption. J. Pet. Sci. Eng. 2019, 177, 756–765. [Google Scholar] [CrossRef]
- Kellerhals, R.; Shaw, J.; Arora, V.K. On Grain Size from Thin Sections. J. Geol. 1975, 83, 79–96. [Google Scholar] [CrossRef]
- Lloreda-Jurado, P.J.; Hernández-Saz, J.; Chicardi, E.; Paúl, A.; Sepúlveda, R. Pore Morphology Evolution and Atom Distribution of Doped Fe2O3 Foams Developed by Freeze-Casting after Redox Cycling. J. Mater. Res. Technol. 2021, 13, 1887–1898. [Google Scholar] [CrossRef]
- Karin, P.; Chammana, P.; Oungpakornkaew, P.; Rungsritanapaisan, P.; Amornprapa, W.; Charoenphonphanich, C.; Sriprapha, K. Impact of Soot Nanoparticle Size and Quantity on Four-Ball Steel Wear Characteristics Using EDS, XRD and Electron Microscopy Image Analysis. J. Mater. Res. Technol. 2022, 16, 1781–1791. [Google Scholar] [CrossRef]
- Hollamby, M.J. Practical Applications of Small-Angle Neutron Scattering. Phys. Chem. Chem. Phys. 2013, 15, 10566–10579. [Google Scholar] [CrossRef] [PubMed]
- Avdeev, M.V.; Tropin, T.V.; Aksenov, V.L.; Rosta, L.; Garamus, V.M.; Rozhkova, N.N. Pore Structures in Shungites as Revealed by Small-Angle Neutron Scattering. Carbon 2006, 44, 954–961. [Google Scholar] [CrossRef]
- Zhang, R.; Liu, S.; Bahadur, J.; Elsworth, D.; Melnichenko, Y.; He, L.; Wang, Y. Estimation and Modeling of Coal Pore Accessibility Using Small Angle Neutron Scattering. Fuel 2015, 161, 323–332. [Google Scholar] [CrossRef]
- Yang, Y.; Wang, B.; Yuan, Q.; Huang, D.; Peng, H. Characterization, Factors, and Fractal Dimension of Pore Structure of Fly Ash-Based Geopolymers. J. Mater. Res. Technol. 2023, 26, 3395–3407. [Google Scholar] [CrossRef]
- Zhang, D.-W.; Sun, X.-M.; Wang, Y.-R.; Li, H. Relationship between Fractal Characteristics of Pore-Structure and Thermal Properties of FA-Based AAM under Different Curing Conditions. J. Mater. Res. Technol. 2023, 26, 961–972. [Google Scholar] [CrossRef]
- Wang, A.; Cao, S.; Yilmaz, E. Quantitative Analysis of Pore Characteristics of Nanocellulose Reinforced Cementitious Tailings Fills Using 3D Reconstruction of CT Images. J. Mater. Res. Technol. 2023, 26, 1428–1444. [Google Scholar] [CrossRef]
- Li, J.; Zhang, Z.; Guo, Z.; Yang, Z.; Qian, W.; Chen, Y.; Li, H.; Zhao, Q.; Xing, Y.; Zhao, Y. Improved Corrosion Resistance of ZrO2/MgO Coating for Magnesium Alloys by Manipulating the Pore Structure. J. Mater. Res. Technol. 2023, 24, 2403–2415. [Google Scholar] [CrossRef]
- Zhang, C.; Wang, J.; Song, W.; Fu, J. Pore Structure, Mechanical Behavior and Damage Evolution of Cemented Paste Backfill. J. Mater. Res. Technol. 2022, 17, 2864–2874. [Google Scholar] [CrossRef]
- Li, X.; Rao, F.; Song, S.; Ma, Q. Deterioration in the Microstructure of Metakaolin-Based Geopolymers in Marine Environment. J. Mater. Res. Technol. 2019, 8, 2747–2752. [Google Scholar] [CrossRef]
- Zhang, L.; Lu, S.; Xiao, D.; Li, B. Pore Structure Characteristics of Tight Sandstones in the Northern Songliao Basin, China. Mar. Pet. Geol. 2017, 88, 170–180. [Google Scholar] [CrossRef]
- Li, J.; Yin, J.; Zhang, Y.; Lu, S.; Wang, W.; Li, J.; Chen, F.; Meng, Y. A Comparison of Experimental Methods for Describing Shale Pore Features—A Case Study in the Bohai Bay Basin of Eastern China. Int. J. Coal Geol. 2015, 152, 39–49. [Google Scholar] [CrossRef]
- Huang, H.; Chen, L.; Dang, W.; Luo, T.; Sun, W.; Jiang, Z.; Tang, X.; Zhang, S.; Ji, W.; Shao, S.; et al. Discussion on the Rising Segment of the Mercury Extrusion Curve in the High Pressure Mercury Intrusion Experiment on Shales. Mar. Pet. Geol. 2019, 102, 615–624. [Google Scholar] [CrossRef]
- Mandelbrot, B. How Long Is the Coast of Britain? Statistical Self-Similarity and Fractional Dimension. Science 1967, 156, 636–638. [Google Scholar] [CrossRef]
- Ou, K.; Wang, C.; Cao, R.; Lin, H.; Fang, L. Experimental Investigation of the Pore Fractal Characteristics and Damage Degradation Mechanism of Sandstone after Cyclic Freeze-thaw Treatments. J. Mater. Res. Technol. 2023, 23, 4843–4859. [Google Scholar] [CrossRef]
- Zhao, Y.; Wang, C.; Ning, L.; Zhao, H.; Bi, J. Pore and Fracture Development in Coal under Stress Conditions Based on Nuclear Magnetic Resonance and Fractal Theory. Fuel 2022, 309, 122112. [Google Scholar] [CrossRef]
- Kim, J.; Hong, G.; Oh, S.; Choi, S. Application of Various Fractal Models in Characterizing the Morphology of Pore Structures of Hydrating Cement Pastes. J. Mater. Res. Technol. 2022, 20, 3818–3835. [Google Scholar] [CrossRef]
- Lai, J.; Wang, G. Fractal Analysis of Tight Gas Sandstones Using High-Pressure Mercury Intrusion Techniques. J. Nat. Gas Sci. Eng. 2015, 24, 185–196. [Google Scholar] [CrossRef]
- Yu, S.; Bo, J.; Fengli, L.; Jiegang, L. Structure and Fractal Characteristic of Micro- and Meso-Pores in Low, Middle-Rank Tectonic Deformed Coals by CO2 and N2 Adsorption. Microporous Mesoporous Mater. 2017, 253, 191–202. [Google Scholar] [CrossRef]
- Wu, Y.; Liu, C.; Ouyang, S.; Luo, B.; Zhao, D.; Sun, W.; Awan, R.S.; Lu, Z.; Li, G.; Zang, Q. Investigation of Pore-Throat Structure and Fractal Characteristics of Tight Sandstones Using HPMI, CRMI, and NMR Methods: A Case Study of the Lower Shihezi Formation in the Sulige Area, Ordos Basin. J. Pet. Sci. Eng. 2022, 210, 110053. [Google Scholar] [CrossRef]
- Mandelbrot, B.B.; Passoja, D.E.; Paullay, A.J. Fractal Character of Fracture Surfaces of Metals. Nature 1984, 308, 721–722. [Google Scholar] [CrossRef]
- Brooks, R.H.; Corey, A.T. Hydraulic Properties of Porous Media; Hydrology Paper; Colorado State University: Fort Collins, CO, USA, 1964; pp. 3–27. [Google Scholar]
- Geological Applications of Capillary Pressure: A Review1|AAPG Bulletin|GeoScienceWorld. Available online: https://pubs.geoscienceworld.org/aapgbull/article/76/6/840/38801/Geological-Applications-of-Capillary-Pressure-A (accessed on 25 May 2024).
- Dollimore, D.; Spooner, P.; Turner, A. The Bet Method of Analysis of Gas Adsorption Data and Its Relevance to the Calculation of Surface Areas. Surf. Technol. 1976, 4, 121–160. [Google Scholar] [CrossRef]
- Naderi, M. Chapter Fourteen—Surface Area: Brunauer–Emmett–Teller (BET). In Progress in Filtration and Separation; Tarleton, S., Ed.; Academic Press: Oxford, UK, 2015; pp. 585–608. ISBN 978-0-12-384746-1. [Google Scholar]
- Brunauer, S.; Emmett, P.H.; Teller, E. Adsorption of Gases in Multimolecular Layers. J. Am. Chem. Soc. 1938, 60, 309–319. [Google Scholar] [CrossRef]
- Kruk, M.; Jaroniec, M.; Sayari, A. Adsorption Study of Surface and Structural Properties of MCM-41 Materials of Different Pore Sizes. J. Phys. Chem. B 1997, 101, 583–589. [Google Scholar] [CrossRef]
- Liu, X.; Nie, B. Fractal Characteristics of Coal Samples Utilizing Image Analysis and Gas Adsorption. Fuel 2016, 182, 314–322. [Google Scholar] [CrossRef]
- Chengyang, W.; Shixiong, H.; Wenjing, S.; Wei, C. Fractal Dimension of Coal Particles and Their CH4 Adsorption. Int. J. Min. Sci. Technol. 2012, 22, 855–858. [Google Scholar] [CrossRef]
- Liu, D.; Ren, D.; Du, K.; Qi, Y.; Ye, F. Impacts of Mineral Composition and Pore Structure on Spontaneous Imbibition in Tight Sandstone. J. Pet. Sci. Eng. 2021, 201, 108397. [Google Scholar] [CrossRef]
- Li, P.; Zheng, M.; Bi, H.; Wu, S.; Wang, X. Pore Throat Structure and Fractal Characteristics of Tight Oil Sandstone: A Case Study in the Ordos Basin, China. J. Pet. Sci. Eng. 2017, 149, 665–674. [Google Scholar] [CrossRef]
- Everett, D.H. Manual of Symbols and Terminology for Physicochemical Quantities and Units, Appendix II: Definitions, Terminology and Symbols in Colloid and Surface Chemistry. Pure Appl. Chem. 1972, 31, 577–638. [Google Scholar] [CrossRef]
- Al-Ghouti, M.A.; Da’ana, D.A. Guidelines for the Use and Interpretation of Adsorption Isotherm Models: A Review. J. Hazard. Mater. 2020, 393, 122383. [Google Scholar] [CrossRef]
- Hayati-Ashtiani, M. Characterization of Nano-Porous Bentonite (Montmorillonite) Particles Using FTIR and BET-BJH Analyses. Part. Part. Syst. Charact. 2011, 28, 71–76. [Google Scholar] [CrossRef]
- Ojeda, M.L.; Esparza, J.M.; Campero, A.; Cordero, S.; Kornhauser, I.; Rojas, F. On Comparing BJH and NLDFT Pore-Size Distributions Determined from N2 Sorption on SBA-15 Substrata. Phys. Chem. Chem. Phys. 2003, 5, 1859–1866. [Google Scholar] [CrossRef]
- Bardestani, R.; Patience, G.S.; Kaliaguine, S. Experimental Methods in Chemical Engineering: Specific Surface Area and Pore Size Distribution Measurements—BET, BJH, and DFT. Can. J. Chem. Eng. 2019, 97, 2781–2791. [Google Scholar] [CrossRef]
- Ruifei, W.; Pingping, S.; Ziqi, S.; Hua, Y. Characteristics of Micro-Pore Throat in Ultra-Low Permeability Sandstone Reservoir. Acta Pet. Sin. 2009, 30, 560. [Google Scholar] [CrossRef]
- Wang, Z.; Cheng, Y.; Wang, G.; Ni, G.; Wang, L. Comparative Analysis of Pore Structure Parameters of Coal by Using Low Pressure Argon and Nitrogen Adsorption. Fuel 2022, 309, 122120. [Google Scholar] [CrossRef]
- Yu, F.; Guo, J.; Liu, J.; Cai, H.; Huang, Y. A Review of the Pore Structure of Pervious Concrete: Analyzing Method, Characterization Parameters and the Effect on Performance. Constr. Build. Mater. 2023, 365, 129971. [Google Scholar] [CrossRef]
- Pang, P.; Han, H.; Hu, L.; Guo, C.; Gao, Y.; Xie, Y. The Calculations of Pore Structure Parameters from Gas Adsorption Experiments of Shales: Which Models Are Better? J. Nat. Gas Sci. Eng. 2021, 94, 104060. [Google Scholar] [CrossRef]
- An, S.; Yao, J.; Yang, Y.; Zhang, L.; Zhao, J.; Gao, Y. Influence of Pore Structure Parameters on Flow Characteristics Based on a Digital Rock and the Pore Network Model. J. Nat. Gas Sci. Eng. 2016, 31, 156–163. [Google Scholar] [CrossRef]
- Wei, M.; Xiong, Y.; Zhang, L.; Li, J.; Peng, P. The Effect of Sample Particle Size on the Determination of Pore Structure Parameters in Shales. Int. J. Coal Geol. 2016, 163, 177–185. [Google Scholar] [CrossRef]
- Rabbani, A.; Jamshidi, S. Specific Surface and Porosity Relationship for Sandstones for Prediction of Permeability. Int. J. Rock Mech. Min. Sci. 2014, 71, 25–32. [Google Scholar] [CrossRef]
- Odler, I.; Köster, H. Investigation on the Structure of Fully Hydrated Portland Cement and Tricalcium Silicate Pastes. III. Specific Surface Area and Permeability. Cem. Concr. Res. 1991, 21, 975–982. [Google Scholar] [CrossRef]
- Luhmann, A.J.; Tutolo, B.M.; Bagley, B.C.; Mildner, D.F.R.; Seyfried, W.E., Jr.; Saar, M.O. Permeability, Porosity, and Mineral Surface Area Changes in Basalt Cores Induced by Reactive Transport of CO2-Rich Brine. Water Resour. Res. 2017, 53, 1908–1927. [Google Scholar] [CrossRef]
- Sibiryakov, B.; Leite, L.W.B.; Sibiriakov, E. Porosity, Specific Surface Area and Permeability in Porous Media. J. Appl. Geophys. 2021, 186, 104261. [Google Scholar] [CrossRef]
- Wei, D.; Gao, Z.; Zhang, C.; Fan, T.; Karubandika, G.M.; Meng, M. Pore Characteristics of the Carbonate Shoal from Fractal Perspective. J. Pet. Sci. Eng. 2019, 174, 1249–1260. [Google Scholar] [CrossRef]
- Lyu, C.; Cheng, Q.; Zuo, R.; Wang, X. Mapping Spatial Distribution Characteristics of Lineaments Extracted from Remote Sensing Image Using Fractal and Multifractal Models. J. Earth Sci. 2017, 28, 507–515. [Google Scholar] [CrossRef]
- Wang, F.-Y.; Yang, K.; Zai, Y. Multifractal Characteristics of Shale and Tight Sandstone Pore Structures with Nitrogen Adsorption and Nuclear Magnetic Resonance. Pet. Sci. 2020, 17, 1209–1220. [Google Scholar] [CrossRef]
Disclaimer/Publisher’s Note: The statements, opinions and data contained in all publications are solely those of the individual author(s) and contributor(s) and not of MDPI and/or the editor(s). MDPI and/or the editor(s) disclaim responsibility for any injury to people or property resulting from any ideas, methods, instructions or products referred to in the content. |
© 2024 by the authors. Licensee MDPI, Basel, Switzerland. This article is an open access article distributed under the terms and conditions of the Creative Commons Attribution (CC BY) license (https://creativecommons.org/licenses/by/4.0/).