Article

Fractal and Multifractal Analysis of Microscopic Pore Structure of UHPC Matrix Modified with Nano Silica

by
Dian Guan
1,2,3,†,
Tinghong Pan
1,2,3,†,
Rongxin Guo
1,2,3,*,
Ya Wei
4,*,
Rongqing Qi
1,2,3,
Chaoshu Fu
1,2,3,
Ziqi Zhang
1,2,3 and
Yukai Zhu
1,2,3
1
Faculty of Civil Engineering and Mechanics, Kunming University of Science and Technology, Kunming 650500, China
2
Yunnan Key Laboratory of Disaster Reduction in Civil Engineering, Kunming 650500, China
3
International Joint Laboratory for Green Construction and Intelligent Maintenance of Yunnan Province, Kunming 650500, China
4
Key Laboratory of Civil Engineering Safety and Durability of China Education Ministry, Department of Civil Engineering, Tsinghua University, Beijing 100084, China
*
Authors to whom correspondence should be addressed.
These authors contributed equally to this work and should be regarded as co-first authors.
Fractal Fract. 2024, 8(6), 360; https://doi.org/10.3390/fractalfract8060360
Submission received: 30 April 2024 / Revised: 28 May 2024 / Accepted: 5 June 2024 / Published: 17 June 2024
(This article belongs to the Special Issue Fractal Mechanics of Engineering Materials)

Abstract

:
Nano silica (NS) has been found to have a positive impact on enhancing the microporous structure of Ultra-High-Performance Concrete (UHPC). However, there is a lack of effective methods to accurately characterize the regulatory improvement mechanism of NS on the pore structure of UHPC. In this study, our objective is to investigate the influence of NS on various characteristic parameters of the pore structure in UHPC, including porosity, average pore size, box fractal dimension, and multifractal spectral parameters. To analyze these effects, we employ a combination of X- CT image processing techniques and fractal theory. Furthermore, we conducted regression analysis using linear functions to explore the correlation between these parameters and the 28d compressive strength of UHPC. The experimental results demonstrate that NS promotes the refinement of matrix pore size, leading to a denser microstructure of the matrix. Fractal analysis revealed that the pore structure of NS-modified UHPC exhibited favorable fractal characteristics. The fractal dimension and multiple fractal parameters provided complementary insights into the pore structure of NS-modified UHPC from different perspectives. The fractal dimension described the global information, indicating that NS improved matrix defects and reduced the complexity of the pore structure. On the other hand, the multiple fractal parameters supplemented local information, highlighting how the increase in micropores contributed to the heterogeneity of the pore structure. The results of the correlation analysis indicate that the developed mathematical model has a good fit with the 28d compressive strength of UHPC.

1. Introduction

Ultra-High-Performance Concrete (UHPC), as a new type of high-performance mate-rial, has a wide range of potential applications in high-performance structures, such as bridges, building rehabilitation, tunnels, and nuclear power plants [1]. UHPC has a particle filler density of about 0.825~0.855, a high compression strength of no less than 150 MPa and high tensile strength of no less than 7 MPa [2], The presence of fibers changes the damage mode of UHPC from brittle to ductile damage [3]. The key to these excellent and outstanding properties is the very low water-to-cement ratio and high powder dosage, which reduces the internal defects of the matrix. Concrete, as a typical porous medium material, has pores ranging from a few micrometers to nanometers in size [4], and the pore size, shape, and distribution are related to the overall nature of the material [5]. The presence of pores reduces the strength of concrete, and pores act as defective points, leading to stress concentrations and localized damage. The typical compressive strength and elasticity are related to total porosity, and shrinkage and creep are functions of pore properties [6]. Therefore, characterizing the microscopic pore structure is important for a better assessment of the macroscopic properties of cementitious materials.
In recent years, there has been a large amount of literature reporting the effect of nano silica (NS) oxide on the properties of UHPC, and NS can promote the hydration of cement and the refinement of the microscopic pore structure [7,8,9], thus improving the macroscopic properties of cement products. There are more studies on the promotion of cement hydration by NS, the mechanism has been relatively mature, and it has been clarified that NS promotes the hydration of cement and the improvement of cementitious structure through the nucleation effect and volcanic ash effect [10,11]. However, the mechanism of the effect of NS on the pore structure of UHPC is still unclear due to the lack of effective microscopic pore structure characterization. The most commonly used parameters for pore structure characterization include porosity, pore size distribution, and specific surface area [12], and researchers have quantitatively characterized the refinement of the matrix microstructure through the trend of porosity and the trend of pore size distribution movement [13,14,15,16,17]. For example, Li et al. [18] used scanning electron microscopy and energy dispersive X-ray spectroscopy to evaluate the effect of NS on the microstructure of UHPC, and a 1.0% doping of NS reduced the number of porous regions and calcium hydroxide crystals, and lowered the porosity of the hardened matrix. Guo et al. [19] quantified the effect of NS on the improvement of the pore structure of the UHPC matrix in terms of the total porosity and the average pore diameter, and found that NS can optimize the pore size distribution to make the microstructure denser. This characterization method, based on geometrical parameters such as pore shape and volume, is easy to calculate and simple to understand, and this method provides intuitive information about the pore structure. However, it has a limited ability to provide more detailed information about the spatial distribution and connectivity of the pores, thus making it challenging to fully capture the complexity and heterogeneity of the structure [20,21].
In recent years, fractal and multifractal concepts have been increasingly used in various scientific fields to characterize the complexity and self-similarity of nature [22]. Fractal theory can provide a novel and effective method for characterizing the microstructure of cementitious materials [23], linking the geometrical forms, spatial properties, and mechanical behaviors of objects [24]. Existing fractal analysis methods include single and multiple fractal analysis [25], where single fractals can directly characterize the geometry of the material through the fractal dimension [23], explaining the scaling properties of irregular behavior [26,27,28,29]. The multifractal analysis captures the internal variations of a system by resolving local densities (probabilities) and expresses more detailed information about the pore structure by means of successive fractal dimension spectra called singularity spectra and generalized dimension spectra [30]. A large number of studies have been conducted to show that fractal theory exhibits great potential in characterizing the internal structure of porous media [31,32,33]. Wang et al. [34] quantified the pore structure of composite cementitious materials by fractal theory and assessed the shrinkage behavior of cementitious materials in terms of pore-surface fractal dimensionality. Xie et al. [35] quantitatively assessed the microstructure of carbonates by fractal theory and established a multiplicity of fractal relationships between parameters and rock physical properties. Gao et al. [36] demonstrated the feasibility of the concept of fractals to characterize the heterogeneity of pore structure in cement paste. In addition, the application of fractal theory provides a new perspective for understanding and predicting geologic structures. Goryainov et al. [37] showed that the fractal properties of topography not only reveal the intrinsic structure and energy flow of a geologic body, but also can be used as an important tool for the exploration of mineral resources [38]. Fractal theory can characterize the complexity and inhomogeneity of the pore structure and analyze the pore structure characteristics from multiple perspectives to quantitatively assess the influence on the macroscopic mechanical properties. Therefore, the fractal theory is expected to obtain the pore structure information of NS-modified UHPC from multiple dimensions, establish the quantitative relationship between the pore structure characteristics and the macroscopic mechanical properties, and reveal the mechanism of the influence of NS on the properties of UHPC at a deep level.
The prerequisite for pore structure characterization using fractal theory is the acquisition of pore information. Mercury intrusion porosity (MIP) is one of the commonly used pore testing techniques, which can obtain more information with pore diameters ranging from 5 nm to 200 μm [39], but the “ink-bottle” effect affects the test results, meaning they are not precise enough, and the intrusion of mercury destroys the pore structure, which makes it difficult to satisfy the cylindrical shape of the pore structure [6,20,39,40]. Nuclear magnetic resonance (NMR) method is a widely used method covering a wide range of applications, and it is a measurement method that extensively covers pore size [6], with the advantage of it being non-destructive and non-invasive, and it does not require sample drying; however, it is more difficult to fit the relaxation data according to the relaxation time distribution, and the selection of the regularization parameters is harsh [41]. X-ray computed tomography (X-CT) tomography is also used as a non-destructive testing method to obtain 3D visualization information of cementitious materials [42], which is much less precise than the other testing methods, and, compared to the other testing methods, the X-CT tomography is more accurate. The most significant advantage of X-CT tomography is that it can obtain the spatial distribution and physical information of pores [43]. Wang et al. [44] used X-ray CT to characterize the complexity, randomness, and incomplete connectivity of the pore system in cementitious mortar, based on which the diffusivity and permeability of the matrix were simulated. Wang et al. [45] used a combination of CT inspection techniques and fractal theory to characterize the microstructure of coal, and investigated the effect of real coal macropore structure on coal fluid flow.
Taken together, NS, as a commonly used nanomaterial, has a large application prospect in UHPC, and the principle of NS influence on the hydration reaction of UHPC has been relatively mature, but due to the lack of effective pore structure characterization methods, the mechanism of the influence of NS on the internal pore structure of UHPC and the quantitative relationship between the pore structure characteristics and the macroscopic mechanical properties are still not clear. Therefore, in this study, NS was doped into UHPC according to the equal mass of cement (0%, 1%, 2%, 3%, and 4%), and the multidimensional pore structure features were quantitatively evaluated by multifractal based on 2D images obtained by X-CT, the pore network was visualized in 3D, fractal theory was introduced to characterize the fractal and multifractal features of the pore structure of NS-modified UHPC, and the counting box dimensions and multifractal spectra. The fractal and multifractal properties of the internal structure of the matrix are quantified by selecting the counting box dimension and multifractal spectrum parameters, the relationship between the microstructure and the macroscopic properties is analyzed to study the mechanism of the influence of NS on the properties of UHPC from the perspective of the pore structural features, and the results of the study can provide guidance for the application of NS in UHPC.

2. Materials and Methods

2.1. Raw Materials

The binders used in this study included PO52.5 ordinary silicate cement (C) supplied by Huaxin Cement of China (Kunming, China), fly ash (FA) from Xuanwei Power Plant of Yunnan Province (Xuanwei, China), and Yongchang silica fume (SF) from Baoshan City of Yunnan Province. NS was provided by Xuancheng Jingrui New Material Co., Ltd. (Kunming, China), with a SiO2 content of 99.8%, an average particle size of 40 nm, and a specific surface area of 200 m2/g. The chemical compositions and particle sizes of these materials are shown in Table 1 and Figure 1, and the aggregates were chosen from standard sand, i.e., Chinese ISO standard sand produced by GB-T 17671-2021 [46], with a range of particle sizes from 0.08 mm to 2.0 mm, and the steel fibers had a length of 20 mm, a diameter of 0.3 mm and a density of 8.35 g/cm3; the polycarboxylic acid high-performance water reducing agent was used for the admixture, with a water reduction rate of ≥25%, and the water was laboratory tap water.

2.2. Sample Preparation Procedures

In this experiment, the dosage of NS was 0%, 1%, 2%, 3% and 4% of the cement mass. The specimens were named according to the amount of NS replacement; for example, N1 denotes 1% dosage of nano silica and OPC is the blank group without nano silica. The mixing ratios of the UHPC mixtures are shown in Table 2. The UHPC mixtures were prepared by ultrasonic dispersion to ensure the uniform dispersion of the NS and the nano silica, as shown in Figure 2.
Considering the easily agglomerated nature of NS, we used ultrasonic dispersion to ensure its homogeneous dispersion in UHPC, as shown in Figure 2. The preparation process of UHPC was as follows: (1) Weigh the raw materials according to the proportion shown in Table 2. (2) Pour NS and SP into a beaker and mix with water. (3) Put the beaker containing the mixed solution into the ultrasonic machine and vibrate it under the power of 90 w (the water surface of the ultrasonic machine must be higher than the liquid surface of the beaker), at the same time, it was supplemented with the stirring blade rotating at a speed of 1200 r/min to increase the dispersibility of NS, and the whole NS dispersion process time was 15 min. (4) Add the cementitious material and the aggregate into the B30-S blender and mix them at a speed of 110 r/min for 2 min to make the mixture homogeneous. (5) Pour in the solution for 6 min mixing at 200 r/min to form a flat and homogeneous freshly mixed slurry. In this process, slowly and evenly put in steel fiber for mixing. (6) After the preparation of the new UHPC slurry, it was loaded into a 40 mm × 40 mm × 160 mm plastic mold at one time, and the mold was placed on the vibration table for 2 s. The surface was compacted and smoothed, and then covered with plastic film. (7) The specimens were put in a closed room for 24 h after natural curing and demolded, and after demolding the specimens were moved to a standard curing room (temperature 20 ± 2 °C, humidity ≥95%) for 28d. The specimens were then placed into the molds for 2 s, and the surface was compacted and smoothed, then covered with plastic film.
Ultra-low water–cement ratio is the key to the excellent macroscopic performance of UHPC, and this experiment uses a water–cement ratio of 0.18, a volume doping of steel fiber of 2%, and a cementitious material of 8 wt% of the water reducing agent to ensure its working performance.

2.3. Compressive Strength

Three samples of each fitment were tested after 3d, 7d and 28d of maintenance, and the uniaxial compression test was carried out on samples with specification size of 40 mm × 40 mm × 40 mm by using HCT206E pressure tester (Shenzhen Wan Testing Equipment Co., Ltd., Shenzhen, China). The maximum load capacity was 200 kN and the loading rate was 1800 N/s. According to GB-T 17671-2021, three specimens were used for each group of samples, and the results were taken as the average of the compressive strength of the three specimens.

2.4. Quantitative Characterization of Microstructure

To quantitatively characterize the effect of NS on the microporous structure of UHPC, a combination of X-CT and quantitative image-processing methods were used to quantify the microporous structural features of NS-modified UHPC by multiple fractal analysis.

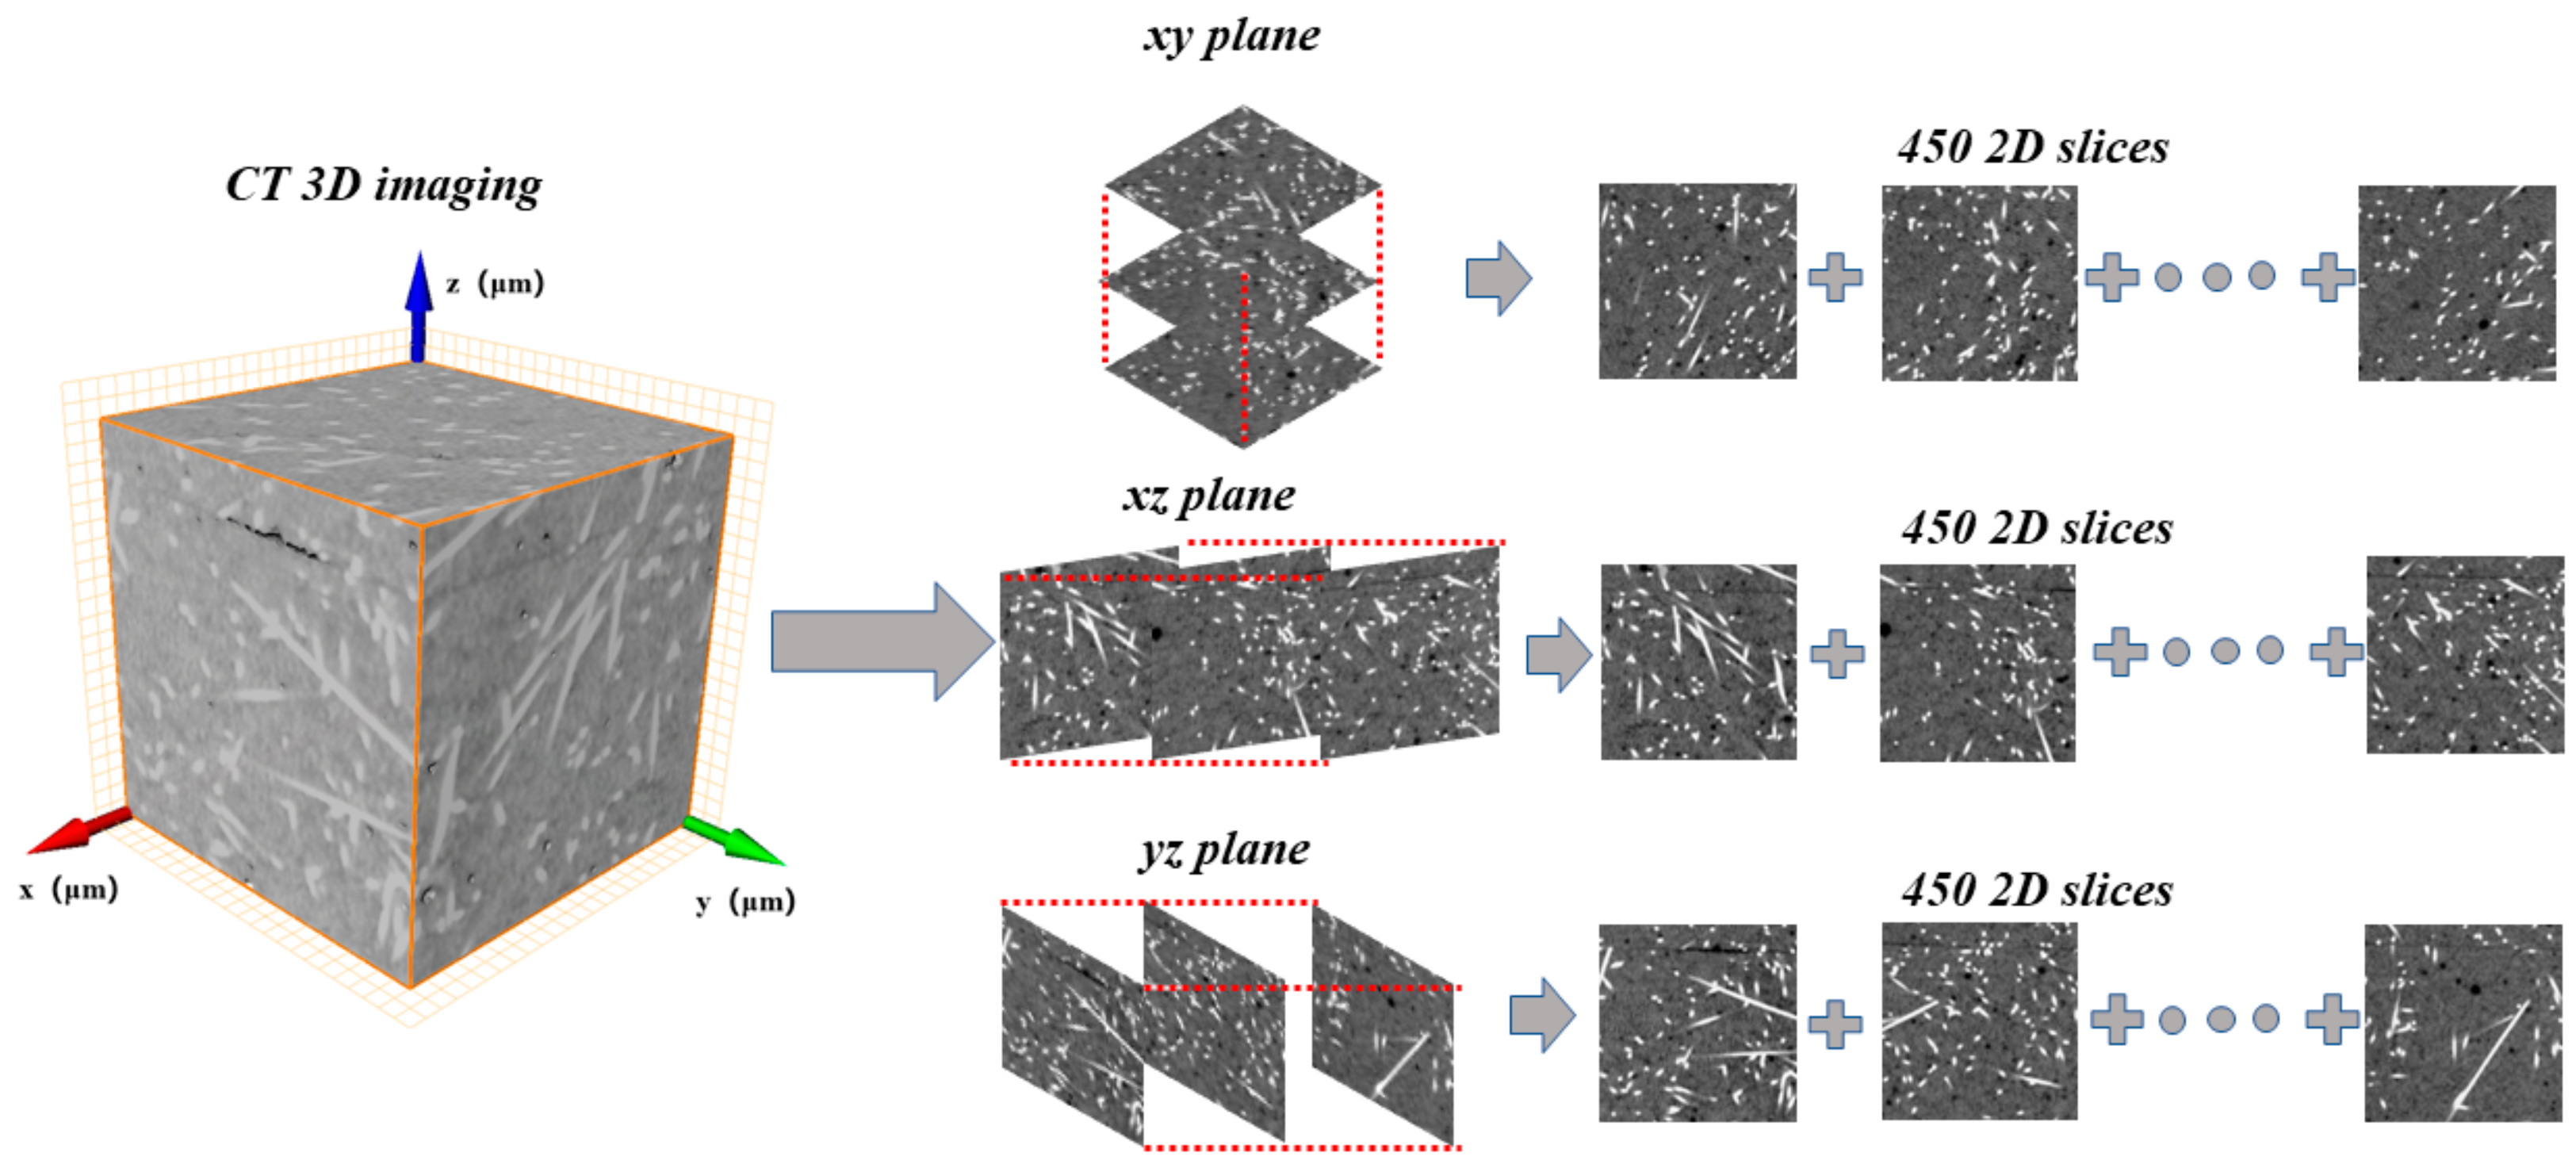
2.4.1. Acquisition and Reconstruction of Microstructure

X-CT is a non-destructive technique that virtually eliminates the need for preliminary sample preparation [39]. In this study, a FF85 X-ray CT scanner from Comet Yxlon, Germany, was used for tomography. The size of the test sample UHPC was cropped to 30 mm × 30 mm × 30 mm and the test resolution was 49 μm (Figure 3).
Before the quantitative analysis of the X-CT images, the images need to be pre-processed, and the process is as follows: select the appropriate image brightness, with which the phases of the material can be clearly distinguished. Secondly, a suitable filter is selected to remove the noise in the background of the image, a non-local means filter is used to avoid the change of the shape and size of the pores, and a bilateral filter is used to ensure that the boundary of the pores has a clear contour. Finally, a reasonable threshold segmentation is chosen to distinguish the pores and matrix of the material, and the image is binarized as shown in Figure 4. In the binarized image matrix shown in Figure 4c, the foreground voxel (white) represents the pores and the corresponding pixel is 1, and the background voxel (black) represents the matrix and the corresponding pixel is 0.

2.4.2. Fractal Analysis

Fractal theory can relate concrete micromorphology to macroscopic properties [24,25,29], and the self-similarity and complexity of natural objects can be described through fractal dimension [47]. In this study, we evaluated the fractal features of NS-modified UHPC 2D slices based on the processed binarized images using the box counting method to compute the counting box dimensions. The box counting method calculated the minimum number of boxes required to cover a pixel point in differently sized boxes, describing the global fractal features of the structure. The box fractal dimension D was calculated as follows:
First, traverse the binarized image covering side length L using a box of size ε, as shown in Figure 5. Second, determine whether each small box contains a pixel marked as 1. If so, mark the small box as 1; otherwise, mark it as 0. Then, count the total number of small boxes containing a box marked as 1, denoted as N(ε). Repeat the above operation continuously by changing the size of the box to obtain the value of box size ε and the corresponding value of the number of boxes N(ε). Plot the double logarithmic plot of box size ε versus the number of boxes N(ε) and fit a least squares regression line through the data points, and the opposite of the slope of the regression line is the box fractal dimension D, which is shown in Figure 5b with a box fractal dimension of 1.21005.

2.4.3. Multifractal Analysis

The multifractal form, which involves decomposing a self-similar measure into intertwined fractal sets, each characterized by its singularity strength and fractal dimension [22], provides a novel characterization of disordered porous media in terms of local singularity and scale dependence [36], revealing the locally singular behavior of the measurements statistically and geometrically [48].
The multifractal analysis is divided into two categories, the box counting method and wavelet method; in this study multifractal analysis is carried out by box counting method, the schematic diagram of multiple fractals is shown in Figure 6, the number of boxes and the probability distribution of the pixel points in the boxes are also considered to obtain detailed information of the structure, and the specific procedure of the box counting method is as follows:
After binarizing the image in black and white, the apertures are denoted as black pix-els and the rest are denoted as white pixels, and the number of boxes obtained is N(ε) by traversing the binarized image covering an edge length of L using a box of size ε, where ε = 2kL:
N ε = 2 k ,
Denote the probability measure of the ith box by pi(ε):
p i ε = v i / i = 1 N ( ε ) v ,
where the number of black pixel points in the ith box is v i , and the sum of the number of pixel points in the entire image area is i = 1 N ( ε ) v .
The singularity index is determined by Equation (3), which becomes Equation (4) when pi(ε) meets the definition of multiple fractals in the statistical category:
p i ε a i ,
N a ( ε ) ε f ( a ) ,
where a i is the local crowding index of the ith box, which describes the fractal property of the ith box when pi varies with the box size ε. a describes the singularity of each square lattice, and the number of boxes with the same α is denoted as N(a,ε).
The contribution of the different boxes covering the pore space is calculated by weighing the metric values of all the boxes using the partition function χ(q, ε) to produce a partition function of order q, as in Equation (5):
χ q , ε = i = 1 N ( ε ) p i q ε = ε τ q ,
The matrix order q is mentioned as a real number in the range [-∞,+∞], and is used as a “microscope” for exploring different regions of the singularity measure, emphasizing the contribution of high-probability boxes for q > 0, and low-probability boxes for q < 0 [49].
The mass index τ(q) can be determined by plotting the lnχ(q,ε)-lnε curve as in Equation (6):
τ q = lim ε 0 l n χ q , ε l n ε ,
The relationship between the singularity index a and the Hausdorff dimension f(a) is expressed as Equation (7) via the Legendre transform:
τ q = a q f a , a = d τ q d q .

3. Results and Discussion

3.1. Compressive Strength

Figure 7 illustrates the relationship between the compressive strength of the samples and the amount of NS in the standard curing room at 3d, 7d, and 28d. The impact of NS on the sample strength remained consistent across all three ages, with a noticeable in-crease in the compressive strength of UHPC as the NS dosage increased. Compared to the blank group, the introduction of NS resulted in the following percentage increase in com-pressive strength at the 3d age: 2.59% (N1), 6.24% (N2), 7.46% (N3), and 16.74% (N4). Similarly, at the 28d age, the percentage increase in compressive strength was: 6.02% (N1), 20.04% (N2), 22.67% (N3), and 27.38% (N4). Among different dosages, the most significant strength increase was generally observed at the 28d age, followed by the 3d age, while the increase in strength at the 7d age was slightly lower than that at the 3d age. Additionally, at the same age, the trend of strength increase with varying NS dosages revealed that higher NS dosages led to greater improvements in strength, with the 4% dosage exhibiting the most prominent increase. The fact that NS can enhance the compressive strength of cementitious materials has been consistently affirmed by previous studies. NS possesses high-purity amorphous silica with a very small nanoscale size and exhibits high volcanic ash activity. These properties enable NS to function as nucleation sites in the cement paste, thereby accelerating cement hydration [8], which is advantageous for UHPC strength. Moreover, NS acts as a filler, optimizing the particle size distribution and microscopically densifying the matrix. This, in turn, improves the matrix microstructure [14]. Additionally, NS reacts with calcium hydroxide (Ca(OH)2) crystals present in the interfacial zone between the hardened cement paste and aggregates, resulting in the production of C-S-H gel and acting as a filler [9]. Consequently, the interfacial transition zone of concrete exhibits a significantly denser and more homogeneous microstructure [50].

3.2. Pore Size Distribution

In order to quantify the pore size distribution characteristics of NS-modified UHPCC, the percentage of pores in different pore size intervals (less than 100 μm, 100~200 μm, 200~500 μm, 500~1000 μm, and greater than 1000 μm) was investigated.
Figure 8 shows the pore size distribution of all UHPC samples after 28d. The pore size distribution of the UHPC samples after 28d was investigated. It can be seen that the pore size distribution of UHPC is mainly concentrated in the range of 0~1000 μm, and the addition of NS increases the proportion of pores in the small pore size range of UHPC, as shown in the following: for the pore size in the range of 200~500 μm, there is a slight increase of 1.9% for N1 compared to 27.505% for OPC, N2 (25.433%), N3 (20.56%) and N4 (19.54%) decreased by 7.5%, 25.26% and 28.98%, respectively. In the pore size range of 100~200 um, the effect of NS on pore size refinement seems to be limited, with only N2 and N3 improving by 0.58% and 1.23%, respectively. For the pore size of 0~100 μm, the content of small pores increased significantly with the increase of doping, by 1.93%, 5.33%, 19%, and 23.78% for N1, N2, N3, and N4, respectively, implying that the doping of NS facilitates the matrix pore size to evolve in a finer direction (100~500 μm in the present work), promotes the generation of more tiny pores, and the pore structure becomes denser. This is attributed to the high volcanic ash activity as well as the filling effect of NS, which promotes the generation of hydration products after the introduction of NS, and the growth of more dense hydrated calcium silicate products further fills the microscopic pores, significantly refines the microscopic pores of the matrix, reduces the presence of large pores within the matrix, and promotes the matrix pore size evolution in the direction of small pores, which is in agreement with the results of Wang et al. [39].
In addition, the content of macropores in all UHPC matrices is relatively low regard-less of whether NS is doped or not, as observed in Figure 8, the pore percentage of OPC is 0.01%, and the pore percentages of N1, N2, N3 and N4 are 0.015%, 0, 0.01%, and 0.009% within the range of 1000~1500 μm, which is basically unchanged, which implies that no matter whether or not NS is doped, macropores are generated in UHPC, i.e., the ability of NS to limit the generation of macropores in UHPC matrix is limited. On the one hand, this is because the water-to-cement ratio of UHPC is too low to provide enough water for the hydration of NS particles, which weakens the ability of NS to fill the macropores. On the other hand, the high water demand of NS increases the viscosity of the fresh slurry, which makes it difficult to expel the remaining large air bubbles inside the slurry during vibration and form large pores after hardening.
The above experimental data indicate that the addition of NS improves the micrometer-scale pore structure of the UHPC matrix to a certain extent, but does not completely fill these small pores, and does not show a significant refining effect on large pores with pore diameters of more than 1000 μm. In order to visualize the 3D pore structure inside the UHPC matrix, Figure 9 shows the 3D reconstruction of the pores under different NS doping for X-CT scan images, each color in Figure 9 represents the independent pores in the same pore size interval delineated, and the qualitative visual assessment of these 3D pore structures shows that the NS doping obviously reduced the number of small pores in all colors, i.e., the porosity decreased overall and the matrix densification of the matrix was improved. Among them, the number of light blue and blue small pores increased, and the decrease in the number of green small pores can be directly and clearly observed from the edges of the model, while the pink and yellow small pores, due to their small percentage in the pore space, do not show any obvious change in Figure 9. This 3D visualization image is useful to help understand the spatial distribution of pores and morphological characteristics of NS-modified UHPC substrates.

3.3. Porosity and Mean Pore Size

The total porosity and average pore size of the matrix present at different doping levels of NS are shown in Figure 10, and the results shown represent the average of all the 2D CT slices. The total porosity of the matrix is in the range of 6.76% to 9%, and the incorporation of NS significantly reduces the total porosity of the UHPC samples. For example, compared to the OPC reference group, N1, N2, N3 and N4 decreased by about 9.5%, 14.2%, 20.67% and 24.86%, respectively. As can be seen in Figure 10b, the average pore size of all the matrices ranged from 219.12 μm to 197.43 μm, and the average pore sizes of the NS-containing UHPC matrices were lower than that of the OPC, and the average pore size of the N4 group, especially, was 10.98% lower than that of the OPC.
The above phenomenon suggests that the incorporation of NS particles reduces the total porosity of the matrix, densifies the matrix, and thus improves the macroscopic compressive properties of UHPC [51,52]. NS serves as a new nucleation site or “seed” for the growth of C-S-H gels, and this nucleation effect can lead to the formation of a denser and more homogeneous microstructure of C-S-H gels [53,54]. In addition, the small pores of 0~200 μm play a dominant role in the pore size distribution. With the addition of NS particles and the continuation of the hydration reaction of the gelling material, the change of the pore structure within the UHPC matrix was manifested as a gradual shift from 200~500 μm pores to 0~200 μm pores, and thus UHPC containing NS exhibited a decrease in the average pore size.

3.4. Fractal and Multifractal

To improve the statistical significance, binarized images of the slices were taken from xy, xz, and yz directions of the 3D images of the X-CT reconstructed samples, respectively, for a total of 1350 images for each sample for fractal analysis.

3.4.1. Fractal Dimension

As mentioned earlier, the box fractal dimension not only quantifies the complexity of the pore structure, but also provides information about the global or average characteristics of the pore structure. The complexity characteristics of pore structures are greatly influenced by porosity, and in general, the larger the porosity, the larger the complexity of pore structures and the larger the corresponding box fractal dimension [54].
In this study, the box counting method was used to calculate the fractal dimension of the pore structure of NS-modified UHPC to explore its fractal characteristics. By analyzing the data in Figure 11b, we found that the pore box fractal dimension of NS-modified UHPC was generally lower than that of the unmodified blank group. This result indicates that the high volcanic ash activity of NS, the generation of more C-S-H by nucleation, and the filling effect gradually filled the pore structure and the defects of the matrix, which reduced the number and size of pores through microstructure optimization, resulting in a more homogeneous pore structure and a reduced complexity. This global structural change coincides with the trend of decreasing porosity with increasing NS doping. When the NS dosing reaches 4%, the box fractal dimension decreases to the minimum value, indicating that the pore structure has the lowest complexity at this time. Specifically, the box fractal dimension of Ordinary Portland Cement (OPC) is 1.488 and decreases to 1.453, 1.432, 1.403, and 1.374 for N1, N2, N3, and N4, in that order, as the NS dosage increases.
In addition, the decrease in the box fractal dimension not only reflects the decrease in the number of pores, but may also imply that the distribution of pores in the same number becomes more regular. This increased regularity may be due to the fact that NS promotes the homogenization of the pore structure and reduces the complexity of the whole pore system. This optimization of the microstructure enhances the macroscopic mechanical properties of UHPC.
However, we note that NS has different effects on the pore occupancy at different scales of UHPC, and the box fractal dimension, although it can provide the characteristic information of the overall pore structure, obscures the detailed information of the local variation in the pores (e.g., the increase in pores in the interval of 0~200 μm), and therefore, it is necessary to introduce the multifractal analysis for further discussion of the detailed variations in the pore structure at different scales ranges.

3.4.2. Multifractal

Three conditions need to be satisfied for an object to have multifractal features [53]. D(q) and a(q) must be strictly monotonically decreasing q. τ(q) is an increasing convex function; and f(a) is a convex function about a. According to Equation (7), singularity index a and the Hausdorff dimension f(a) were calculated [36], The plot with a as the horizontal coordinate and f(a) as the vertical coordinate is called the multifractal singularity spectrum, as shown in Figure 12b. The singularity spectra of the pore distribution of the UHPC matrix with different dopant amounts of NS are shown in Figure 12a. All the curves show a continuous parabolic tendency, which indicates that the pore size distribution of the matrix has a multifractal behavior. The results of the singularity spectra show that the decrease in porosity increases the local probability measure Pi, and a as a local singularity, the absolute value of which responds to the size of the porosity [33]. Meanwhile, it can be observed from Figure 12a that the value of a at the same q value always decreases with the increase in NS doping, in other words, along with the increase in NS doping, the porosity is always decreasing, which is consistent with the analytical results of the counting box dimension. From Figure 12b, it is found that with the doping of NS, the curve shifts regularly to the lower left and moves to the low a region of the multifractal spectrum, which is caused by the decrease in porosity.
The spectral width ∆a (∆a = amaxamin) describes the size of the opening of the multifractal spectral curve and is used to quantitatively characterize the information of the pore size distribution, and an increase or decrease in the value of ∆a reflects a widening or a narrowing of the pore size distribution of UHPC. In this study, the spectral width of the multifractal spectrum was affected by NS, which increased from 1.846 (OPC) to 1.88 (N4) in the N4 group compared to the blank group OPC, as shown in Figure 13, indicating that the effect of NS on pore size refinement increased the complexity of the pore size distribution of the UHPC matrix, with an increase in the local variability of the pore size distribution and an increase in the discretization of the pore size distribution in the dense region. This is consistent with the increase in the number of pores with a pore size of less than 200 μm in the matrix observed in Section 3.2. After the incorporation of NS, NS participates in the hydration of the cementitious material to generate additional hydration products, which fill the pores and at the same time introduce more small pores with a pore size of 0~200 μm, but it has a limited ability to limit the generation of large pores with a pore size of more than 1000 μm, and the proportion of tiny pores in localized regions within the matrix increases. The proportion of macropores tends to be stabilized, widening the gap between large and small pores, accelerating the development of matrix pore structure, and the pore size distribution becomes more complex and diversified.
As mentioned earlier, multifractals are advantageous for revealing the heterogeneity and diversity of the pore size distribution, and can capture the finer detailed changes in the structure. Multifractals take into account the variability of the pore size distribution on different scales and quantify this change, which is manifested as an increase in the spectral width. In general, the higher the number of micropores, the more dispersed and randomly distributed they are, so the higher the spatial heterogeneity, while the relatively fewer and well-connected channels formed by macropores exhibit low spatial heterogeneity [55]. Therefore, the shift of the curve and the change of the spectral width can be used to characterize the evolution of the pores.
In addition, the change in the spectral width of the multifractal spectrum highlights the difference between multifractal and fractal, both of which describe the complementary information of the NS-modified UHPC pore structure from the global and local perspectives, respectively.
The decrease in the dimensionality of the box fractal indicates that the introduction of NS makes the pore structure of the UHPC matrix denser overall. This is exemplified by the changes observed in OPC and N4, where the porosity and average pore diameter in N4 decreased by 24.86% and 10.98%, respectively, compared to OPC, resulting in a reduction in pore structure complexity. Additionally, the increase in spectral width suggests that NS enhances the heterogeneity diversity of the pore size distribution within the UHPC matrix. This is evidenced by fluctuations in the pore percentage across different size intervals, such as a decrease in the 200~500 μm range and an increase in the 0~200 μm range after NS incorporation.

4. Further Discussion

4.1. Mechanism of NS Effect on Pore Structure

The pore structure evolution mechanism of NS-modified UHPC is demonstrated in Figure 14, where partially hydrated NS particles produce hydrated calcium silicate products that gradually fill the pore space of the matrix, while non-hydrated NS particles act as physical fillers in the space between the matrix and other cementitious materials, as well as in the pores. The nucleation effect and space filling effect work together to refine the small-scale pores, thus improving the densification of the matrix, reducing the complexity of the pore structure, and increasing the heterogeneity of the pore structure. This micro-level structural optimization is a key factor for UHPC to exhibit excellent mechanical properties. Specifically, the nucleation effect promotes the uniform distribution and growth of hydration products in the pores, while the space-filling effect reduces the volume and number of pores through physical filling. It should be noted that in this study, although NS can improve the microstructure of the UHPC matrix, this micro-level change may not be sufficient to significantly alter the large-scale pores with pore diameters exceeding 1000 μm. This implies that although the optimization of microstructure is crucial for improving the macroscopic mechanical properties of the material, the presence of large-scale pores may still have an impact on the overall properties of the material.

4.2. Correlation Analysis

In this study, based on the combination of X-CT and quantitative image processing methods, the microporous structure characteristics of NS-modified UHPC were quantified by multifractal analysis, and the parameters characterizing the microporous structure of UHPC were obtained, including porosity, average pore diameter, box fractal dimension, and the spectral width of the multifractal spectrum, and a regression analysis was carried out to analyze the relationship between these parameters and the 28d compressive strength of UHPC by using a linear function, as shown in Figure 15. An F-test and a T-test were used to reveal the significance of the regression function and regression parameters, respectively, and the significance test results of the regression equation and regression parameters are shown in Table 3 and Table 4. The test values of the regression equations and the regression parameters are all less than 0.05, which implies that the established linear regression models with the corresponding slopes and intercepts are statistically significant. Therefore, the mathematical model of these parameters concerning the UHPC 28d compressive strength can be expressed by Equations (8)–(11) [56].
σ = 8.9787 P + 189.1925 ,
σ = 1.1103 d ¯ + 353.8228 ,
σ = 253.714 D + 483.9281 ,
σ = 753.4481 α 1282.9383 ,
where σ denotes the 28d compressive strength of UHPC, P denotes porosity, d ¯ denotes the average pore size, D denotes the box fractal dimension, and ∆α denotes the spectral width of the multifractal spectrum.
As shown in Table 4, the compressive strength of UHPC is closely correlated with porosity and average pore size with R 2 of 0.80 and 0.82, respectively, and in this work, this correlation can be explained by the changes in porosity and average pore size, and with the increase in NS doping, P and d ¯ decrease, and the defects inside the UHPC matrix decrease; these defects may lead to the phenomenon of stress concentration weakening compressive strength of UHPC. The box fractal dimension responds to the complexity of the overall pore structure and has a good negative correlation with the compressive strength, with an R 2 of 0.85. The effect of different dosages of NS on the compressive strength of UHPC can be understood in terms of D, specifically, D decreases with the addition of NS, and this decrease in complexity stems from the overall homogenization of the pore structure such that the UHPC with 4 wt% NS at 28d has the smallest D value and exhibits the best mechanical properties.
The strongest positive correlation between spectral width and compressive strength can be observed in Table 4, with an R 2 of 0.97 and the best fit. It indicates that the spectral width can describe the changes of pores in the small-scale pore size distribution interval in more detail, distinguish the internal differences of the microscopic pores of NS-modified UHPC, and explain that NS modulates the improvement of the pore structure of UHPC by promoting the generation of more micro-small pores.

5. Conclusions

In this study, a combination of X-CT and quantitative image processing methods were used to quantify the microscopic pore structure characteristics of NS-modified UHPC by multifractal analysis, which revealed the pore structure evolution mechanism of NS-modified UHPC, and linear fitting was used for the regression analysis of the pore structure parameters and compressive strength of NS-modified UHPC. The main conclusions are as follows:
(1)
NS played a positive role in improving the microporous structure of UHPC, and this microstructural improvement increased the densification of the microstructure of the UHPC matrix and significantly improved the mechanical properties. Compared with the blank group, the 28d compressive strengths of N1, N2, N3 and N4 were increased by 6.02%, 20.04%, 22.67% and 27.38%.
(2)
NS could effectively reduce the porosity and significantly refine the pore size of UHPC, and the total porosity P of N1, N2, N3 and N4 decreased by 9.5%, 14.2%, 20.67% and 24.86%, and the average pore size d ¯ decreased by 0.93%, 2.79%, 8.8% and 9.9% compared with that of the control OPC. NS has the most obvious effect on the optimization of small pores in the scale of 0~100 μm, while it has a limited effect on the refinement of pores with a pore size of more than 1000 μm.
(3)
The fractal dimension and multifractal parameters describe the complementary information of the pore structure of NS-modified UHPC from different perspectives. At the global level, the densification of the UHPC matrix by NS is reflected in the decrease in the counting box dimension, with a D-value of 1.488 for OPC, and D-values of 1.453, 1.432, 1.403, and 1.374 for N1, N2, N3, and N4, respectively. At the local level, the increase in the number of tiny pores leads to the increase in the complexity and heterogeneity of the pore size distribution of the UHPC matrix, which is manifested as the increase in the width of the multifractal spectral spectrum. As an increase in the spectral width of the multifractal spectrum, with ∆a values of 1.846 for OPC and 1.851, 1.864, 1.878 and 1.80 for N1, N2, N3 and N4, respectively.
(4)
The pore structure parameters of NS-modified UHPC showed a good fit to the 28d compressive strength, which conformed to a linear functional relationship. p and d ¯ had regression correlation coefficients of 0.804 and 0.82, respectively, and the fit with D was 0.85, and it had the best fit with ∆a, which was 0.97. F-tests and T-tests indicated that each of the regression equations and the corresponding parameters were statistically significant.
In summary, the innovation of this study is the quantitative characterization of the microscopic pore structure of NS-modified UHPC by combining X-CT with fractal theory. In this study, we successfully captured the variation in NS-modified UHPC pores on the micrometer scale. However, due to the limitation of image pixels, it has not yet been possible to acquire pore information on the nanoscale. Therefore, future studies need to introduce higher precision NDT equipment (e.g., nano-CT) or combine NDT techniques, such as small-angle X-ray scattering (SAXS) and small-angle neutron scattering (SANS), to obtain more accurate and comprehensive information about the microscopic pore structure. This will help to further deepen the understanding of the microstructural properties of NS-modified UHPC.

Author Contributions

Conceptualization, C.F., D.G. and T.P.; methodology, D.G. and T.P.; software, D.G. and T.P.; validation, D.G., T.P. and Z.Z.; formal analysis, Y.Z. and R.Q.; investigation, C.F.; resources, D.G. and T.P.; data curation, D.G. and T.P.; writing—original draft preparation, D.G. and T.P.; writing—review and editing, D.G. and T.P.; visualization, Z.Z. and R.Q.; supervision, C.F. and R.Q.; project administration, C.F., R.G. and Y.W.; funding acquisition, R.G. and Y.W. All authors have read and agreed to the published version of the manuscript.

Funding

This research was funded by Scientific Research Project of Yunnan Provincial Department of Education, grant number 2023Y0442; Yunnan Fundamental Research Projects, grant number 202201BE070001-010; Yunnan Provincial Science and Technology Department major science and technology special plan, grant number 202102AG050043.

Data Availability Statement

The data presented in this study are available on request from the corresponding author.

Conflicts of Interest

The authors declare no conflicts of interest.

References

  1. Du, J.; Meng, W.; Khayat, K.H.; Bao, Y.; Guo, P.; Lyu, Z.; Abu-Obeidah, A.; Nassif, H.; Wang, H. New development of ultra-high-performance concrete (UHPC). Compos. Part B Eng. 2021, 224, 109220. [Google Scholar] [CrossRef]
  2. Sidodikromo, E.P.; Chen, Z.; Habib, M. Review of the cement-based composite ultra-high-performance concrete (UHPC). Open Civ. Eng. J. 2019, 13, 147–162. [Google Scholar] [CrossRef]
  3. Wille, K.; Naaman, A.E.; El-Tawil, S.; Parra-Montesinos, G.J. Ultra-high performance concrete and fiber reinforced concrete: Achieving strength and ductility without heat curing. Mater. Struct. 2012, 45, 309–324. [Google Scholar] [CrossRef]
  4. Aili, A.; Maruyama, I. Review of several experimental methods for characterization of micro-and nano-scale pores in cement-based material. Int. J. Concr. Struct. Mater. 2020, 14, 55. [Google Scholar] [CrossRef]
  5. Kang, S.H.; Hong, S.G.; Moon, J. The effect of superabsorbent polymer on various scale of pore structure in ultra-high performance concrete. Constr. Build. Mater. 2018, 172, 29–40. [Google Scholar] [CrossRef]
  6. Jiang, Z.L.; Pan, Y.J.; Lu, J.F.; Wang, Y.-C. Pore structure characterization of cement paste by different experimental methods and its influence on permeability evaluation. Cem. Concr. Res. 2022, 159, 106892. [Google Scholar] [CrossRef]
  7. Yu, R.; Spiesz, P.; Brouwers, H.J.H. Effect of nano-silica on the hydration and microstructure development of Ultra-High Performance Concrete (UHPC) with a low binder amount. Constr. Build. Mater. 2014, 65, 140–150. [Google Scholar] [CrossRef]
  8. Luo, Z.; Zhi, T.; Liu, X.; Yin, K.; Pan, H.; Feng, H.; Song, Y.; Su, Y. Effects of different nanomaterials on the early performance of ultra-high performance concrete (UHPC): C–S–H seeds and nano-silica. Cem. Concr. Compos. 2023, 142, 105211. [Google Scholar] [CrossRef]
  9. Janković, K.; Stanković, S.; Bojović, D.; Stojanović, M.; Antić, L. The influence of nano-silica and barite aggregate on properties of ultra high performance concrete. Constr. Build. Mater. 2016, 126, 147–156. [Google Scholar] [CrossRef]
  10. Rupasinghe, M.; San Nicolas, R.; Mendis, P.; Sofi, M.; Ngo, T. Investigation of strength and hydration characteristics in nano-silica incorporated cement paste. Cem. Concr. Compos. 2017, 80, 17–30. [Google Scholar] [CrossRef]
  11. Oh, T.; Chun, B.; Lee, S.K.; Kim, G.W.; Banthia, N.; Yoo, D.Y. Effect of high-volume substituted nanosilica on the hydration and mechanical properties of Ultra-High-Performance Concrete (UHPC). Cem. Concr. Res. 2024, 175, 107379. [Google Scholar] [CrossRef]
  12. Zeng, Q.; Luo, M.; Pang, X.; Li, L.; Li, K. Surface fractal dimension: An indicator to characterize the microstructure of cement-based porous materials. Appl. Surf. Sci. 2013, 282, 302–307. [Google Scholar] [CrossRef]
  13. Ghafari, E.; Costa, H.; Júlio, E.; Li, L.; Li, K. The effect of nanosilica addition on flowability, strength and transport properties of ultra high performance concrete. Mater. Des. 2014, 59, 1–9. [Google Scholar] [CrossRef]
  14. Wu, Z.; Khayat, K.H.; Shi, C.; Tutikian, B.F.; Chen, Q. Mechanisms underlying the strength enhancement of UHPC modified with nano-SiO2 and nano-CaCO3. Cem. Concr. Compos. 2021, 119, 103992. [Google Scholar] [CrossRef]
  15. Janković, K.; Bojović, D.; Stojanović, M. Influence of nanoparticles on the strength of ultra-high performance concrete. In Nanotechnology in Eco-Efficient Construction; Woodhead Publishing: Sawston, UK, 2019; pp. 13–42. [Google Scholar] [CrossRef]
  16. Yoo, D.Y.; Oh, T.; Banthia, N. Nanomaterials in ultra-high-performance concrete (UHPC)—A review. Cem. Concr. Compos. 2022, 134, 104730. [Google Scholar] [CrossRef]
  17. Wu, Z.; Shi, C.; Khayat, K.H.; Wan, S. Effects of different nanomaterials on hardening and performance of ultra-high strength concrete (UHSC). Cem. Concr. Compos. 2016, 70, 24–34. [Google Scholar] [CrossRef]
  18. Li, W.; Huang, Z.; Cao, F.; Sun, Z.; Shah, S.P. Effects of nano-silica and nano-limestone on flowability and mechanical properties of ultra-high-performance concrete matrix. Constr. Build. Mater. 2015, 95, 366–374. [Google Scholar] [CrossRef]
  19. Guo, D.; Guo, M.; Zhou, Y.; Zhu, Z. Use of nano-silica to improve the performance of LC3-UHPC: Mechanical behavior and microstructural characteristics. Constr. Build. Mater. 2024, 411, 134280. [Google Scholar] [CrossRef]
  20. Kim, J.; Choi, S. A fractal-based approach for reconstructing pore structures of GGBFS-blended cement pastes. Constr. Build. Mater. 2020, 265, 120350. [Google Scholar] [CrossRef]
  21. Wang, L.; Zeng, X.; Yang, H.; Lv, X.; Guo, F.; Shi, Y.; Hanif, A. Investigation and application of fractal theory in cement-based materials: A review. Fractal Fract. 2021, 5, 247. [Google Scholar] [CrossRef]
  22. Dathe, A.; Tarquis, A.M.; Perrier, E. Multifractal analysis of the pore-and solid-phases in binary two-dimensional images of natural porous structures. Geoderma 2006, 134, 318–326. [Google Scholar] [CrossRef]
  23. Tang, S.; Huang, J.; Duan, L.; Yu, P.; Chen, E. A review on fractal footprint of cement-based materials. Powder Technol. 2020, 370, 237–250. [Google Scholar] [CrossRef]
  24. Yang, X.; Wang, F.; Yang, X.; Zhou, Q. Fractal dimension in concrete and implementation for meso-simulation. Constr. Build. Mater. 2017, 143, 464–472. [Google Scholar] [CrossRef]
  25. Pan, L.; Carrillo, J.; Cao, M.; Sha, G. Multifractal-spectrum shape parameters for characterizing distribution and evolution of multiple cracks in concrete structures. Eng. Fract. Mech. 2022, 264, 108329. [Google Scholar] [CrossRef]
  26. Tang, S.W.; Cai, R.J.; He, Z.; Cai, X.H.; Shao, H.Y.; Li, Z.J.; Yang, H.M.; Chen, E. Continuous microstructural correlation of slag/superplasticizer cement pastes by heat and impedance methods via fractal analysis. Fractals 2017, 25, 1740003. [Google Scholar] [CrossRef]
  27. Tang, S.W.; Wang, L.; Cai, R.J.; Cai, X.H.; He, Z.; Chen, E. The evaluation of electrical impedance of three-dimensional fractal networks embedded in a cube. Fractals 2017, 25, 1740005. [Google Scholar] [CrossRef]
  28. Tang, S.W.; Yu, P.; Wang, L.; Cai, R.J.; Chen, E. The analysis of thermal resistance of three-dimensional fractal networks embedded in a sphere. Fractals 2018, 26, 1850036. [Google Scholar] [CrossRef]
  29. Martínez, F.S.J.; Martín, M.A.; Caniego, F.J.; Tuller, M.; Guber, A.; Pachepsky, Y.; García-Gutiérrez, C. Multifractal analysis of discretized X-ray CT images for the characterization of soil macropore structures. Geoderma 2010, 156, 32–42. [Google Scholar] [CrossRef]
  30. Li, W.; Liu, H.; Song, X. Multifractal analysis of Hg pore size distributions of tectonically deformed coals. Int. J. Coal Geol. 2015, 144, 138–152. [Google Scholar] [CrossRef]
  31. Zarnaghi, V.N.; Fouroghi-Asl, A.; Nourani, V.; Ma, H. On the pore structures of lightweight self-compacting concrete containing silica fume. Constr. Build. Mater. 2018, 193, 557–564. [Google Scholar] [CrossRef]
  32. Zeng, Q.; Li, K.; Fen-Chong, T.; Dangla, P. Surface fractal analysis of pore structure of high-volume fly-ash cement pastes. Appl. Surf. Sci. 2010, 257, 762–768. [Google Scholar] [CrossRef]
  33. Lü, Q.; Qiu, Q.; Zheng, J.; Wang, J.; Zeng, Q. Fractal dimension of concrete incorporating silica fume and its correlations to pore structure, strength and permeability. Constr. Build. Mater. 2019, 228, 116986. [Google Scholar] [CrossRef]
  34. Wang, L.; Jin, M.; Wu, Y.; Zhou, Y.; Tang, S. Hydration, shrinkage, pore structure and fractal dimension of silica fume modified low heat Portland cement-based materials. Constr. Build. Mater. 2021, 272, 121952. [Google Scholar] [CrossRef]
  35. Xie, S.; Cheng, Q.; Ling, Q.; Li, B.; Bao, Z.; Fan, P. Fractal and multifractal analysis of carbonate pore-scale digital images of petroleum reservoirs. Mar. Pet. Geol. 2010, 27, 476–485. [Google Scholar] [CrossRef]
  36. Gao, Y.; Jiang, J.; De Schutter, G.; Ye, G.; Sun, W. Fractal and multifractal analysis on pore structure in cement paste. Constr. Build. Mater. 2014, 69, 253–261. [Google Scholar] [CrossRef]
  37. Goryainov, P.M.; Ivanyuk, G.Y.; Kalashnikov, A.O. Topography formation as an element of lithospheric self-organization. Russ. Geol. Geophys. 2013, 54, 1071–1082. [Google Scholar] [CrossRef]
  38. Nikulin, I.I.; Kalashnikov, A.O.; Krylov, I.O.; Mikhailova, J.A.; Groshev, N.Y.; Kadyrov, R.I. Fractal Analysis of the Composition and Structure of Sulfide Disseminated Ores in Picritic Gabbro-Dolerites of the Oktyabrsky Deposit, Norilsk Ore Cluster. Mosc. Univ. Geol. Bull. 2023, 78, 239–253. [Google Scholar] [CrossRef]
  39. Wang, J.; Wang, X.; Ding, S.; Ashour, A.; Yu, F.; Lv, X.; Han, B. Micro-nano scale pore structure and fractal dimension of ultra-high performance cementitious composites modified with nanofillers. Cem. Concr. Compos. 2023, 141, 105129. [Google Scholar] [CrossRef]
  40. Wang, Y.; Yuan, Q.; Deng, D.; Ye, T.; Fang, L. Measuring the pore structure of cement asphalt mortar by nuclear magnetic resonance. Constr. Build. Mater. 2017, 137, 450–458. [Google Scholar] [CrossRef]
  41. Valori, A.; McDonald, P.J.; Scrivener, K.L. The morphology of C–S–H: Lessons from 1H nuclear magnetic resonance relaxometry. Cem. Concr. Res. 2013, 49, 65–81. [Google Scholar] [CrossRef]
  42. Mohan, M.K.; Rahul, A.V.; Van Stappen, J.F.; Cnudde, V.; De Schutter, G.; Van Tittelboom, K. Assessment of pore structure characteristics and tortuosity of 3D printed concrete using mercury intrusion porosimetry and X-ray tomography. Cem. Concr. Compos. 2023, 140, 105104. [Google Scholar] [CrossRef]
  43. Zeng, Q.; Wang, X.; Yang, P.; Wang, J.; Zhou, C. Tracing mercury entrapment in porous cement paste after mercury intrusion test by X-ray computed tomography and implications for pore structure characterization. Mater. Charact. 2019, 151, 203–215. [Google Scholar] [CrossRef]
  44. Wang, Y.S.; Dai, J.G. X-ray computed tomography for pore-related characterization and simulation of cement mortar matrix. Ndt E Int. 2017, 86, 28–35. [Google Scholar] [CrossRef]
  45. Wang, G.; Shen, J.; Liu, S.; Jiang, C.; Qin, X. Three-dimensional modeling and analysis of macro-pore structure of coal using combined X-ray CT imaging and fractal theory. Int. J. Rock Mech. Min. Sci. 2019, 123, 104082. [Google Scholar] [CrossRef]
  46. GB/T 17671-2021; Test Method of Cement Mortar Strength (IOS Method). National Standard of the People's Republic of China: Beijing, China, 2021.
  47. Mandelbrot, B.B.; Mandelbrot, B.B. The fractal geometry of nature. Am. J. Phys. 1982, 51, 286–287. [Google Scholar] [CrossRef]
  48. Liu, K.; Ostadhassan, M.; Kong, L. Multifractal characteristics of Longmaxi Shale pore structures by N2 adsorption: A model comparison. J. Pet. Sci. Eng. 2018, 168, 330–341. [Google Scholar] [CrossRef]
  49. Lopes, R.; Betrouni, N. Fractal and multifractal analysis: A review. Med. Image Anal. 2009, 13, 634–649. [Google Scholar] [CrossRef] [PubMed]
  50. Nili, M.; Ehsani, A. Investigating the effect of the cement paste and transition zone on strength development of concrete containing nanosilica and silica fume. Mater. Des. 2015, 75, 174–183. [Google Scholar] [CrossRef]
  51. Liao, Y.; Wang, S.; Wang, K.; Al Qunaynah, S.; Wan, S.; Yuan, Z.; Xu, P.; Tang, S. A study on the hydration of calcium aluminate cement pastes containing silica fume using non-contact electrical resistivity measurement. J. Mater. Res. Technol. 2023, 24, 8135–8149. [Google Scholar] [CrossRef]
  52. Liao, Y.; Yao, J.; Deng, F.; Li, H.; Wang, K.; Tang, S. Hydration behavior and strength development of supersulfated cement prepared by calcined phosphogypsum and slaked lime. J. Build. Eng. 2023, 80, 108075. [Google Scholar] [CrossRef]
  53. Wang, F.; Zai, Y. Fractal and multifractal characteristics of shale nanopores. Results Phys. 2021, 25, 104277. [Google Scholar] [CrossRef]
  54. Geng, Z.; Tang, S.; Wang, Y.; He, Z.; Wu, K.; Wang, L. Stress relaxation properties of calcium silicate hydrate: A molecular dynamics study. J. Zhejiang Univ.-Sci. A 2024, 25, 97–115. [Google Scholar] [CrossRef]
  55. Ju, X.; Jia, Y.; Li, T.; Gao, L.; Gan, M. Morphology and multifractal characteristics of soil pores and their functional implication. Catena 2021, 196, 104822. [Google Scholar] [CrossRef]
  56. Han, X.; Feng, J.; Wang, B. Relationship between fractal feature and compressive strength of fly ash-cement composite cementitious materials. Cem. Concr. Compos. 2023, 139, 105052. [Google Scholar] [CrossRef]
Figure 1. Particle size distribution of cementitious materials.
Fractalfract 08 00360 g001
Figure 2. Experimental flowchart.
Fractalfract 08 00360 g002
Figure 3. X-CT three-dimensional imaging to obtain two-dimensional slices.
Fractalfract 08 00360 g003
Figure 4. Processing of X-CT images. (a) Original image; (b) Pore image after threshold segmentation; (c) binarization.
Fractalfract 08 00360 g004
Figure 5. Cartridge dimension determination process: (a) Principle of box movement during cartridge dimension determination; (b) cartridge dimension obtained from linear fitting.
Fractalfract 08 00360 g005
Figure 6. Box fractal process in the multifractal dimension. (a) Binary image of pore structure, (b) the curve of ln ε VS ln χ(q, ε), (c) the curve of q VS a and (d) the curve of q VS f(a).
Fractalfract 08 00360 g006aFractalfract 08 00360 g006b
Figure 7. Compressive strength.
Fractalfract 08 00360 g007
Figure 8. Pore size distribution of UHPC.
Fractalfract 08 00360 g008
Figure 9. Three-dimensional visualization of pores in UHPC.
Fractalfract 08 00360 g009
Figure 10. Pore characterization parameters. (a) Porosity; (b) Mean pore size.
Fractalfract 08 00360 g010
Figure 11. The calculation of cartridge dimension. (a) The curves of Log(1/ε)~LogN(ε); (b) the box cartridge dimension of different NS doped UHPC.
Fractalfract 08 00360 g011
Figure 12. Calculated results of multifractal spectra. (a) Singularity spectra for different NS doping levels; (b) Multifractal spectra of samples with different NS doped.
Fractalfract 08 00360 g012
Figure 13. Patterns of change in multifractal spectral parameter (∆a) with NS doping.
Fractalfract 08 00360 g013
Figure 14. Schematic diagram of the mechanism of NS modulation to improve the pore structure of UHPC.
Fractalfract 08 00360 g014
Figure 15. Correlation analysis. (a) 28d compressive strength vs. Porosity; (b) 28d compressive strength vs. Mean pore size; (c) 28d compressive strength vs. D; (d) 28d compressive strength vs. ∆a.
Fractalfract 08 00360 g015
Table 1. Chemical composition and physical properties of the binder.
Chemical AnalysisCaOFe2O3MgOSO3K2OSiO2Na2OAl2O3TiO2
C66.132.953.243.840.4117.510.424.221.28
FA3.38.091.340.671.37530.3424.19-
SF1.820.240.871.653.07910.40.460.05
Table 2. Mixing ratio of UHPC mixture (kg/m3).
No.CNSFASFWSSteel FiberSP
OPC7000100200180115015680
N170010100200180115015680
N270020100200180115015680
N370030100200180115015680
N470040100200180115015680
Table 3. The regression function and significance test results.
No.FunctionF ValueProb > F
28d compressive strength
vs. Porosity
σ = 8.9787 P + 189.1925 17.4222752.25 × 10−2
28d compressive strength
vs. Mean pore size
σ = 1.1103 d ¯ + 353.8228 19.192.20 × 10−2
28d compressive strength
vs. D
σ = 253.714 D + 483.9281 22.831.74 × 10−2
28d compressive strength
vs. ∆a
σ = 753.4481 α 1282.9383 190.5924558.23 × 10−4
Table 4. The regression parameter and significance test results.
No.ParameterValueStandard ErrorT ValueProb > |t|R2
28d compressive strength vs. PorosityA−8.982.15−4.170.0250.804
b189.1982.3480.854.17 × 10−6
28d compressive strength vs. Mean pore sizeA−1.1180.25−4.380.0220.82
b353.8282.24157.625.63 × 10−7
28d compressive strength vs. DA−253.71851.59−4.910.0160.85
b483.932.03238.081.63 × 10−7
28d compressive strength vs. ∆aA753.450.003243,889.80.00080.979
b−1282.940.005−256,3244.58 × 10−10
Disclaimer/Publisher’s Note: The statements, opinions and data contained in all publications are solely those of the individual author(s) and contributor(s) and not of MDPI and/or the editor(s). MDPI and/or the editor(s) disclaim responsibility for any injury to people or property resulting from any ideas, methods, instructions or products referred to in the content.

