Abstract
Wind energy is a clean, sustainable, and renewable source. It is receiving a large amount of attention from governments and energy companies worldwide as it plays a significant role as an alternative source of energy in reducing carbon emissions. However, due to long-term operation in reduced and difficult weather conditions, wind turbine blades are always seriously damaged. Hence, damage detection in blade structure is essential to evaluate its operational condition and ensure its structural integrity and safety. We aim to use fractal, entropy, and chaos concepts as descriptors for the diagnosis of wind turbine blade condition. They are, respectively, estimated by the correlation dimension, approximate entropy, and the Lyapunov exponent. Formal statistical tests are performed to check how they are different across wind turbine blade conditions. The experimental results follow. First, the correlation dimension is not able to distinguish between all conditions of wind turbine blades. Second, approximate entropy is suitable to distinguish between healthy and erosion conditions and between healthy and mass imbalance conditions. Third, chaos is not a discriminative feature to distinguish between wind turbine blade conditions. Fourth, wind turbine blades with either erosion or mass imbalance exhibit less irregularity in their respective signals than healthy wind turbine blades.
1. Introduction
The maintenance and integrity of wind turbine blades are major challenges in the renewable and sustainable energy industry. Indeed, wind turbine blades play a major role in the viability and effectiveness of wind-based systems used to generate electricity. However, weather conditions always cause different blade irregularities including, for instance, cracks, erosion, and mass imbalance. As a result, such irregularities in blades lead to a decrease in produced energy and represent serious risks related to safety. Thus, wind turbine blade maintenance is crucial for energy generation and risk control and management.
To better inspect wind turbine irregularities, various research works were undertaken to classify wind turbine blade vibrations. For instance, machine learning algorithms were applied to vibration measurements to diagnose faults, including support vector machines [1,2], k-nearest neighbor [3], radial basis function neural networks and multi-layer perceptron [4], adaptive network-based fuzzy inference systems [5,6], weighted kernel extreme learning machines [7], deep shallow neural networks [8], the Adaboost algorithm based on transfer learning [9], Bayesian filtering and estimation [10], ensemble learning including XGBoost, random forests, and extra tree models [11], cascaded and bidirectional deep learning networks [12], convolutional neural networks [13,14,15], gated recurrent unit and long short-term memory networks [16], and ensemble systems based on random forests, backpropagation neural networks, and convolutional neural networks [17].
In addition, to better analyze and characterize wind turbine blade vibrations, various features were considered in the literature, including wind speed, generator speed, power, wind direction, yaw position and speed, pitch angle and speed [7], tip speed ratio, Von Mises stresses, blade mass, natural frequency, rotor power coefficient [8], statistical moments (expected mean, variance, skewness, kurtosis), fast Fourier transform-based features (power spectral density, maximum power spectral density, mean frequency), time–frequency (wavelet transform and Hilbert–Huang transform) and modal domains (variation in fundamental frequencies, mode shapes, damping ratios) [10], short-time features (mechanical loss, electrical loss, yaw error loss, rotor loss) and their average value and standard deviation over a sliding window [16], the temporal–spatial joint distribution of recorded vibrations [17], and the wavelet packet [18].
Nowadays, there is growing attention on various mechanical fault diagnosis problems based on measures of statistical mechanics including fractals [19,20,21,22,23,24], entropy concepts [25,26,27,28,29,30,31,32,33], and chaos theory [34,35,36,37,38,39]. For instance, the singular attractor of a chaotic signal can be represented by three descriptors, namely the correlation dimension [40,41] that represents the fractal dimension of an attractor, entropy [42,43] that indicates the frequency of information arrivals, and the Lyapunov exponent [44,45] used to measure the divergence rate of two adjacent trajectories. Specifically, the fractal method has the ability to measure long-range dependence and, thus, the level of persistence in the original signal. Furthermore, entropy measures the uncertainty or disorder within the signal, and the Lyapunov exponent determines the stability of a chaotic dynamic system. In short, fractal, entropy, and chaos are the main descriptors of an attractor or a nonlinear dynamic system. We consider that the signals recorded from wind turbine blades behave like a nonlinear dynamic system.
The main purpose of the current study is to examine how fractal, entropy, and chaos can be used as descriptors of the state of wind turbine blades by considering that the concepts of the nonlinearity and complexity of systems may be useful in the study of the reliability of wind turbine blades. In this regard, we focus on the aforementioned nonlinear descriptors since nonlinearity is related to numerous aspects of nonlinear behavior, such as chaos, fractals, and complex self-organization [46]. In this regard, we estimate fractal, entropy, and chaos, respectively, based on estimations of the correlation dimension [40,41], approximate entropy [43], and the Lyapunov exponent [44,45]. We recall that fractal, entropy, and chaos theories were found to be effective in various applications for engineering problems [47,48,49,50,51,52,53,54,55,56,57,58].
Since mechanical vibrations are basically nonlinear signals, the conventional linear pattern extraction methods cannot successfully extract the nonlinear fault patterns. Therefore, the advance in the theory of nonlinear dynamic systems has brought about new techniques to analyze and describe the complexity in the behavior of such systems. In this regard, in equipment analysis and diagnosis, fractal, entropy, and chaos theories can be regarded as new monitoring research methods. Indeed, they can be considered the best way to show the attractor dynamic structure in the signal of a mechanical system. As a result, the fault diagnosis method based on fractal, entropy, and chaos theories can effectively extract the nonlinear features of wind turbine blades. For instance, fractal, entropy, and chaos, respectively, characterize the long-memory, information content, and convergence in a signal.
By assumption, fractal, entropy, and chaos-based descriptors may have the ability to identify and diagnose the type of wind turbine blade failure as they were found to be effective in characterizing various mechanical faults [19,20,21,22,23,24,25,26,27,28,29,30,31,32,33,34,35,36,37,38,39] and engineering problems [47,48,49,50,51,52,53,54,55,56,57,58].
For instance, the statistical analysis of complexity values resulting from wind turbine blade vibration measurements could show correlation between complexity measures and wind turbine blade condition. In other words, the statistical analysis of fractal, entropy, and chaos concept-based descriptors may help establish a quantitative relationship between these complexity measures and turbine blade condition. In short, the question is whether the correlation dimension, approximate entropy, and the Lyapunov exponent are suitable for characterizing wind turbine blade condition. The present work shows that they are indeed.
Our research contributes to the existing literature in the following ways. First, this study enriches the current research contents of wind turbine fault diagnosis [1,2,3,4,5,6,7,8,9,10,11,12,13,14,15,16,17] by focusing on fault detection in blades as this topic has received less attention compared to wind turbines. Second, fractal, entropy, and chaos measures are used for analyzing four different states of wind turbine blades including cracks, erosion, mass imbalance, and healthy (normal) conditions. Third, rigorous statistical tests are applied to the estimated attractor descriptors (considering that wind turbine blade signal is a complex and chaotic system) to check how they are different across pairs of blade states. In this regard, we check if such nonlinear descriptors can differentiate between healthy and fault conditions and between various fault conditions too. Fourth, our research work, through analyzing fractal, entropy, and chaos characteristics of four different conditions of wind turbine blades, can be seen as a fine addition to previous works on fault diagnosis in wind turbine blades [7,8,9,10,11,12,13,14,15,16,17,18].
The rest of this paper is organized as follows. Section 2 describes the methods used to estimate the fractal dimension by means of the correlation dimension, entropy by calculating approximate entropy, and chaos by estimating the Lyapunov exponent. Section 3 presents the data and provides the results. Finally, the discussion is presented and the conclusions are drawn in Section 4.
2. Materials and Methods
From a theoretical perspective, complexity in signals is basically described by nonlinear statistical mechanics measures such as fractal, entropy, and chaos. In theory, the signal becomes more complex as the descriptors of its fractal, entropy, and chaos increase. In this regard, the physical anomalies in wind turbine blades may alter the fractal, entropy, and chaos measurements. For instance, physical anomalies may lead to a change in regularity, randomness, and stability in signals recorded from wind turbine blades. Specifically, regularity, randomness, and chaos characteristics may be affected by the loss of information due to the presence of significant physical anomalies. However, it is worth mentioning that it is difficult to predict the direction of the change in complexity measures due to the presence of physical anomalies in wind turbine blades. Therefore, in this study, both two-sided and one-sided statistical tests are applied to the measured complexity descriptors from wind turbine blade signals. The technical description of the correlation dimension, approximate entropy, and the Lyapunov exponent is provided next.
2.1. Fractal Estimation Based on Correlation Dimension
The fractal theory is used to describe the regularity in a signal. Consider the signal {x1, x2, …, xN} and the phase space vectors expressed by Yi = (xi, xi+τ, …, xi+(m−1)τ) for i = 1, 2, …, N − (m − 1)τ, where m is the embedding dimension and τ is the time delay. Then, the integral is given by the following:
where M is the number of points in the phase space and θ(x) is the Heaviside step function. The association between (r) and r is given by the following:
where D is expressed as follows:
Finally, the correlation dimension [40,41] is the parameter D(m), which is the slope of the plot of ln[C(r)] versus ln(r). In this study, the embedding dimension and the time delay are, respectively, set to two and one based on the method of the nearest neighbor.
2.2. Approximate Entropy
The entropy concept is used to assess information content and randomness in a signal. Consider the signal {x1, x2, …, xN} and the m-vectors (xi, xi+1, …, xN−m+1), where for i = 1, 2, …, N − (m − 1), and m is the embedding dimension (reconstruction scalar). The distance between x(i) and x(j) is given by the following:
Afterward, for i = 1, (N − m + 1), the quantities
and
are calculated as follows:
where r is the filter factor. Finally, the approximate entropy denoted as AE(m,r,N) [43] is computed as follows:
In this study, the embedding dimension is set to two.
2.3. Lyapunov Exponent
The chaos theory describes the rate of convergence in a signal to its attractor. Let us consider the signal {x1, x2, …, xN} and the phase space vectors expressed as Yi = (xi, xi+τ, …, xi+(m−1)τ) for i = 1, 2, …, N − (m − 1)τ, where m is the embedding dimension and τ is the time delay. In this context, the nearest neighbor of each point in the trajectory is identified after reconstructing the system’s dynamics [45]. As it varies with time, the distance between each point and its nearest neighbor increases exponentially. As a result, the divergence of each point and its neighbor is expressed as follows:
where λ is the Lyapunov exponent, C is the initial separation between neighbors, i is the time step, and Δt is the sampling. Taking the logarithm to both sides of Equation (8), we obtain the following:
Finally, the Lyapunov exponent given by λ is approximated using a least-squares fit to the average line expressed in Equation (9). In other words, the parameter λ is used to measure the chaos in the original signal. In this study, the embedding dimension and the time delay are, respectively, set to two and one.
3. Results
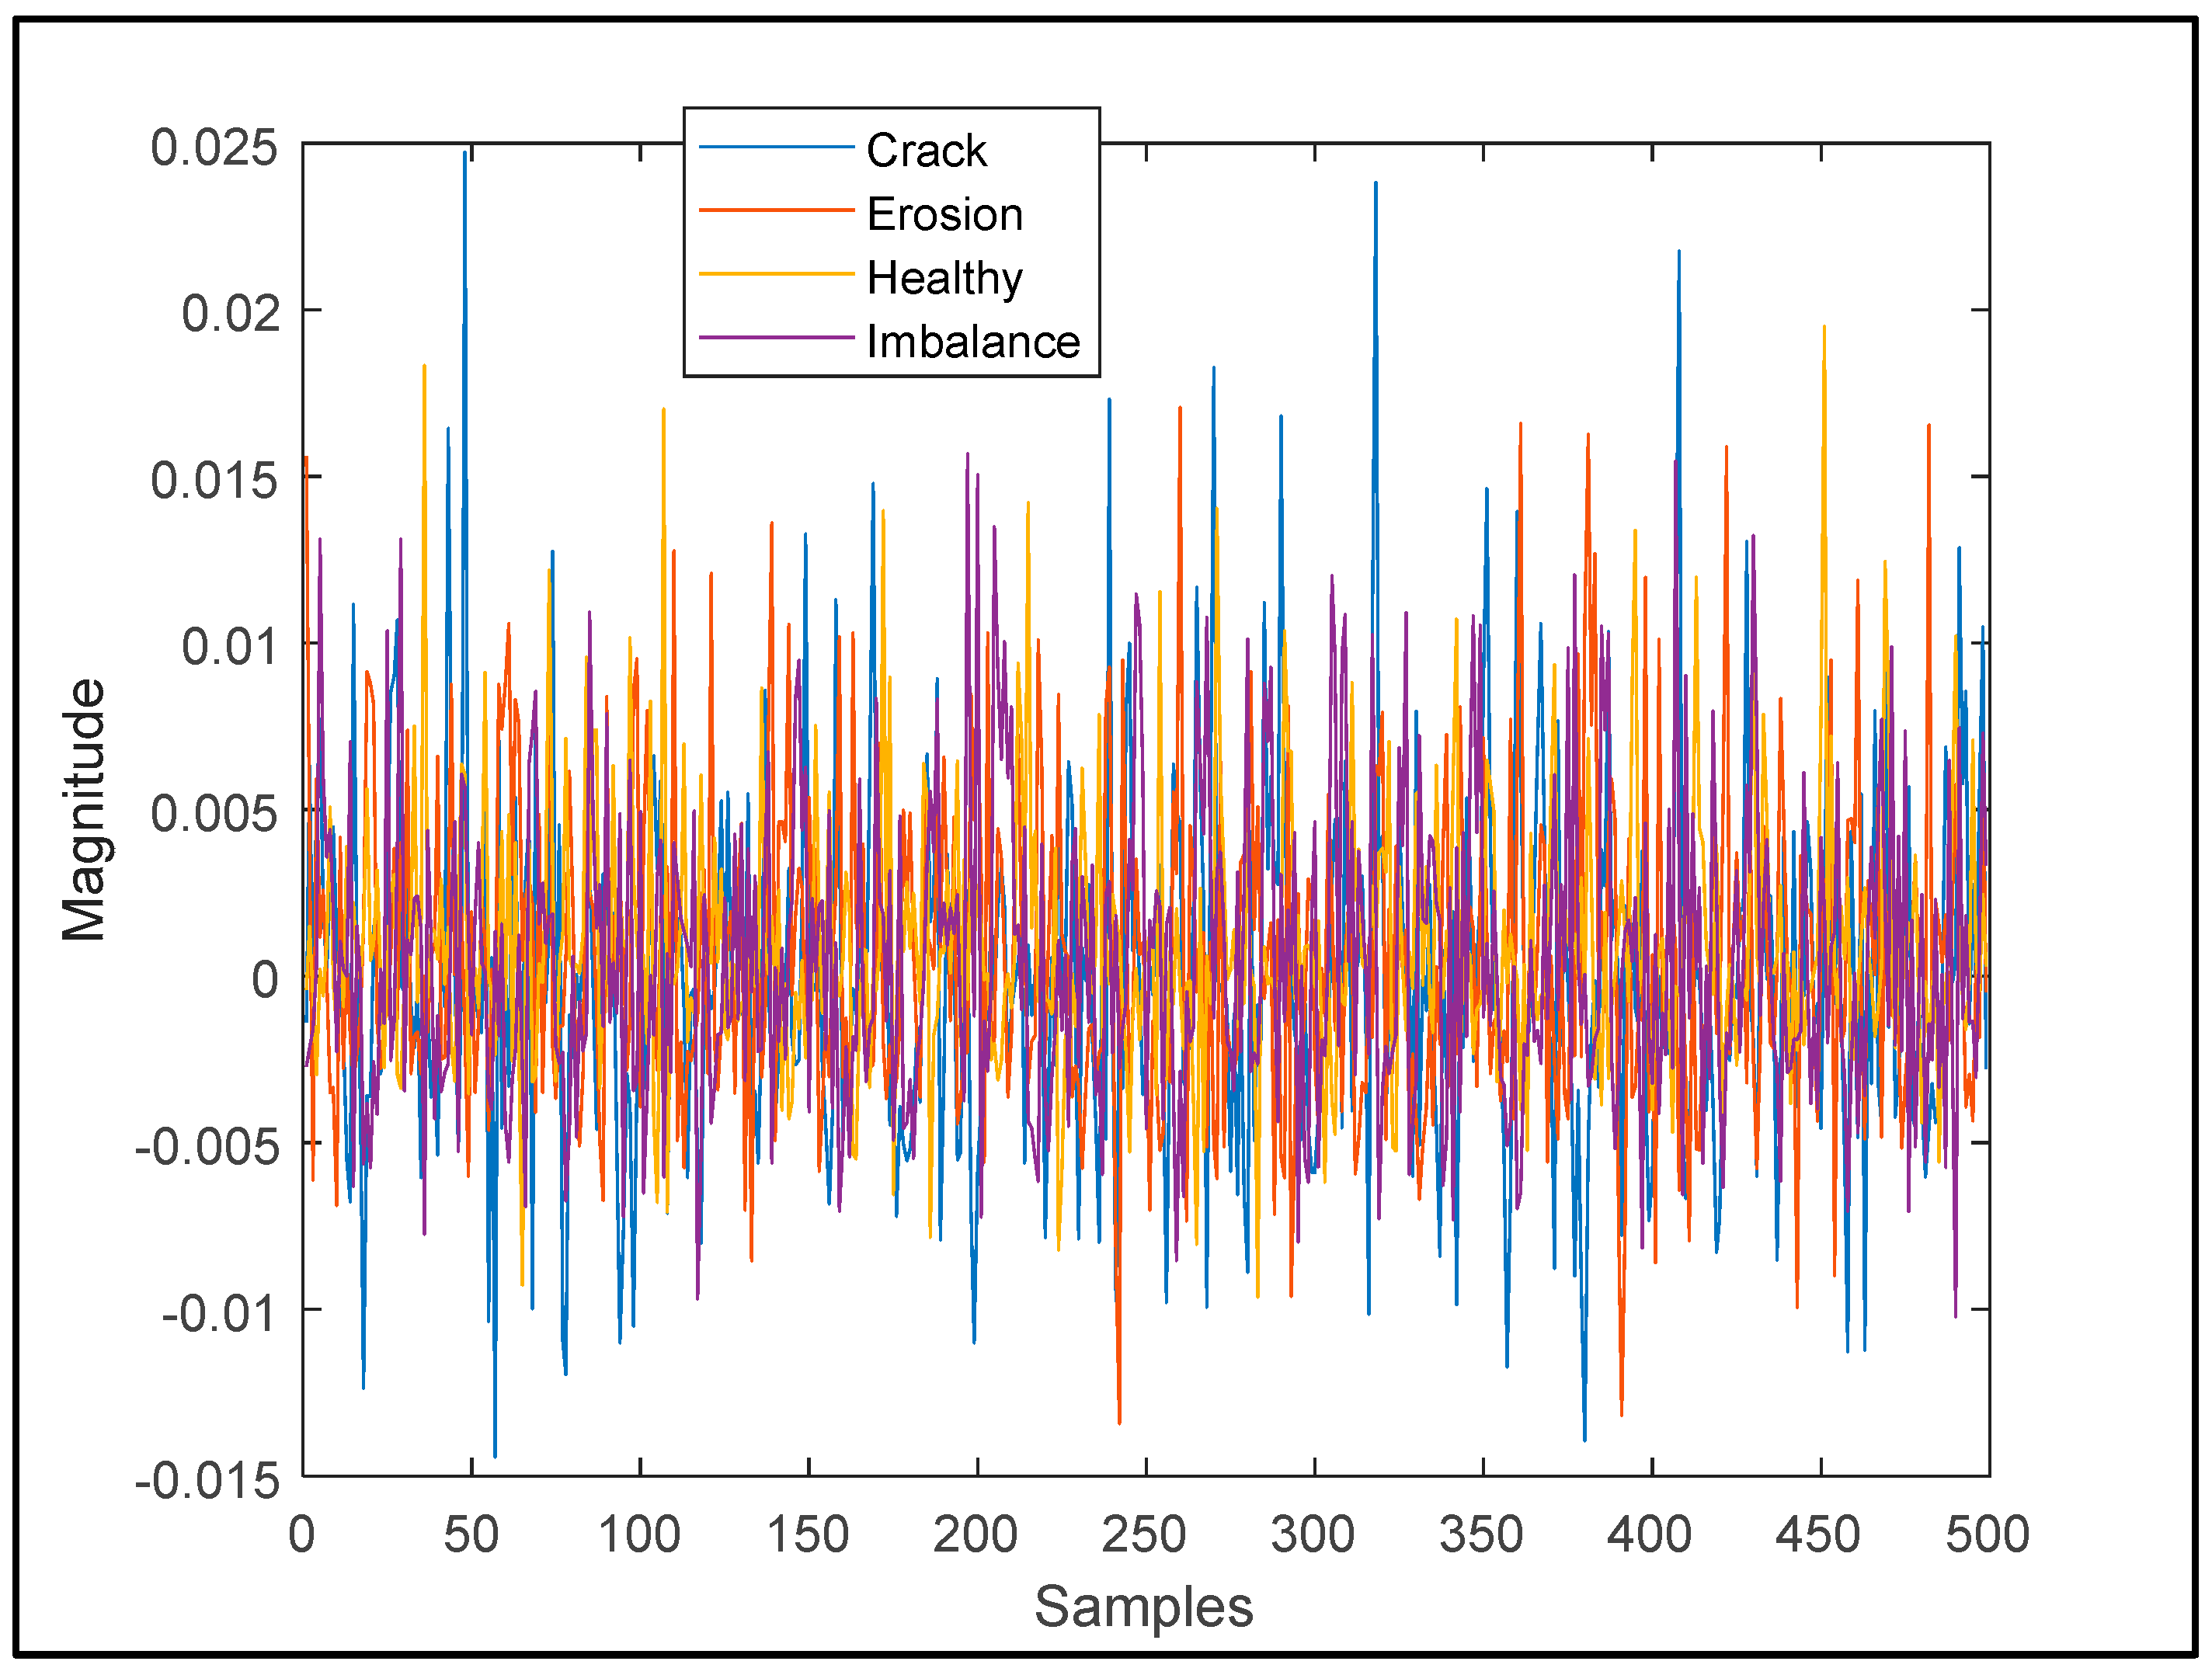
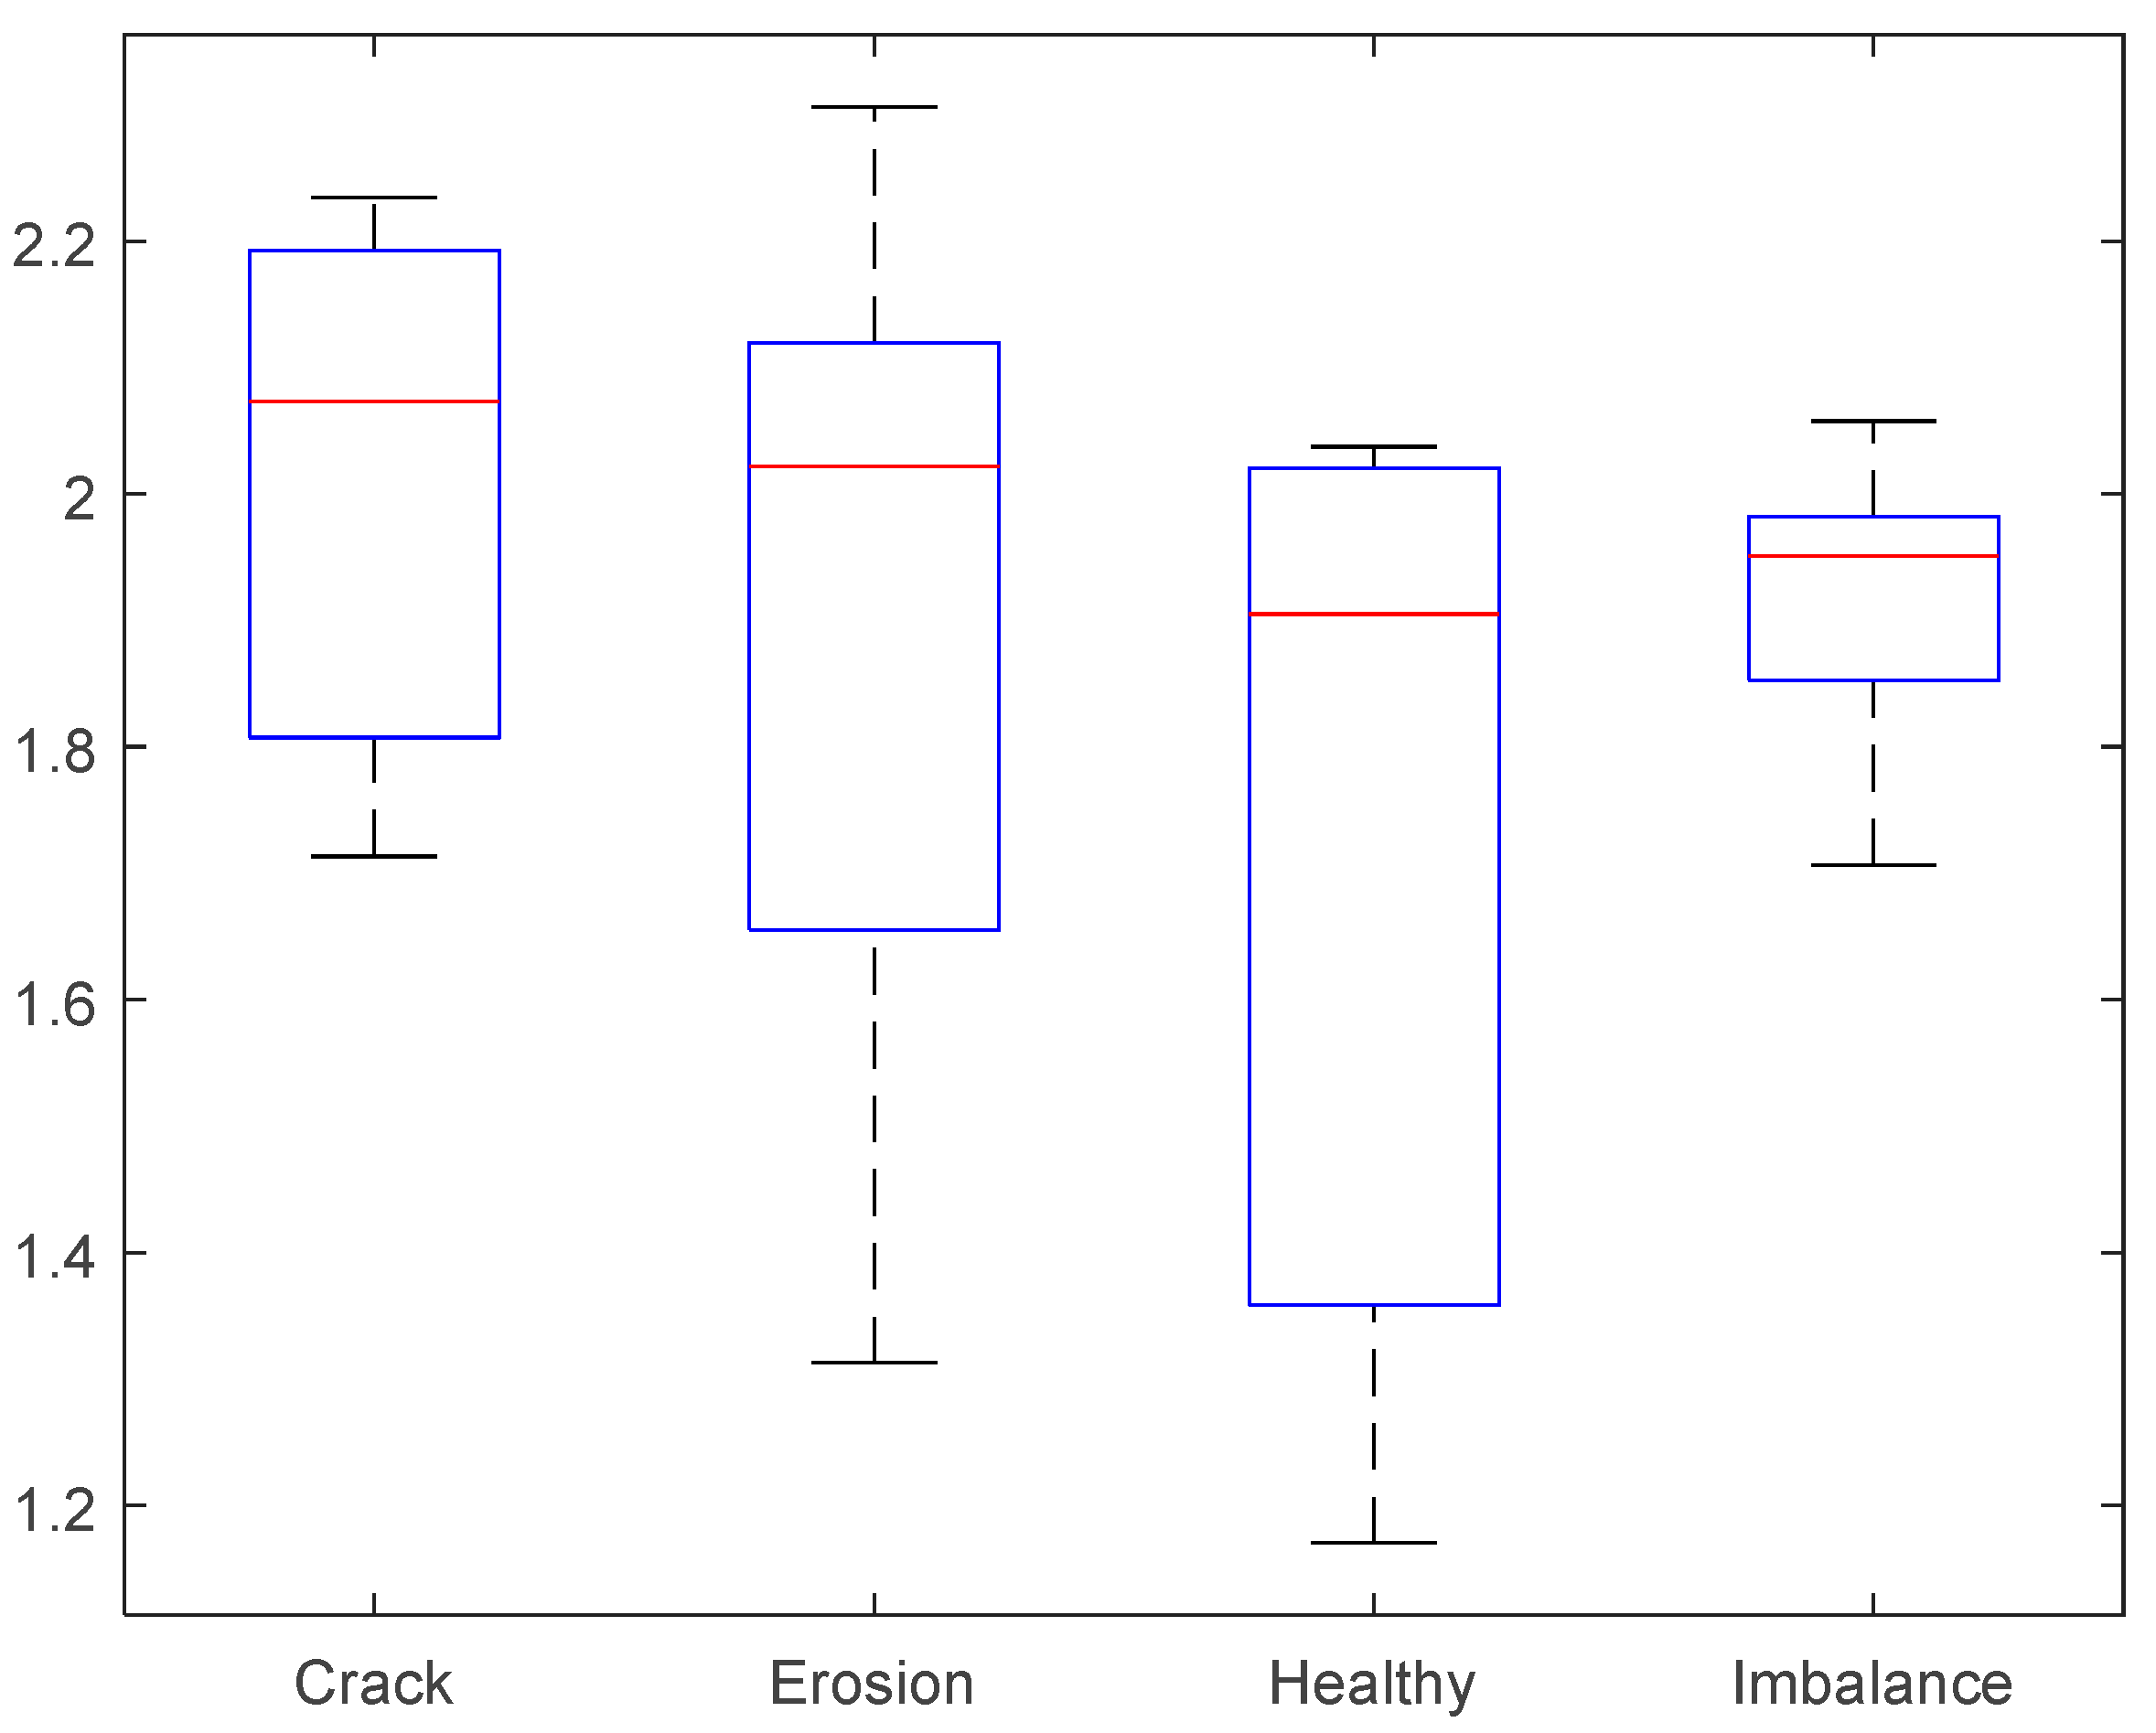
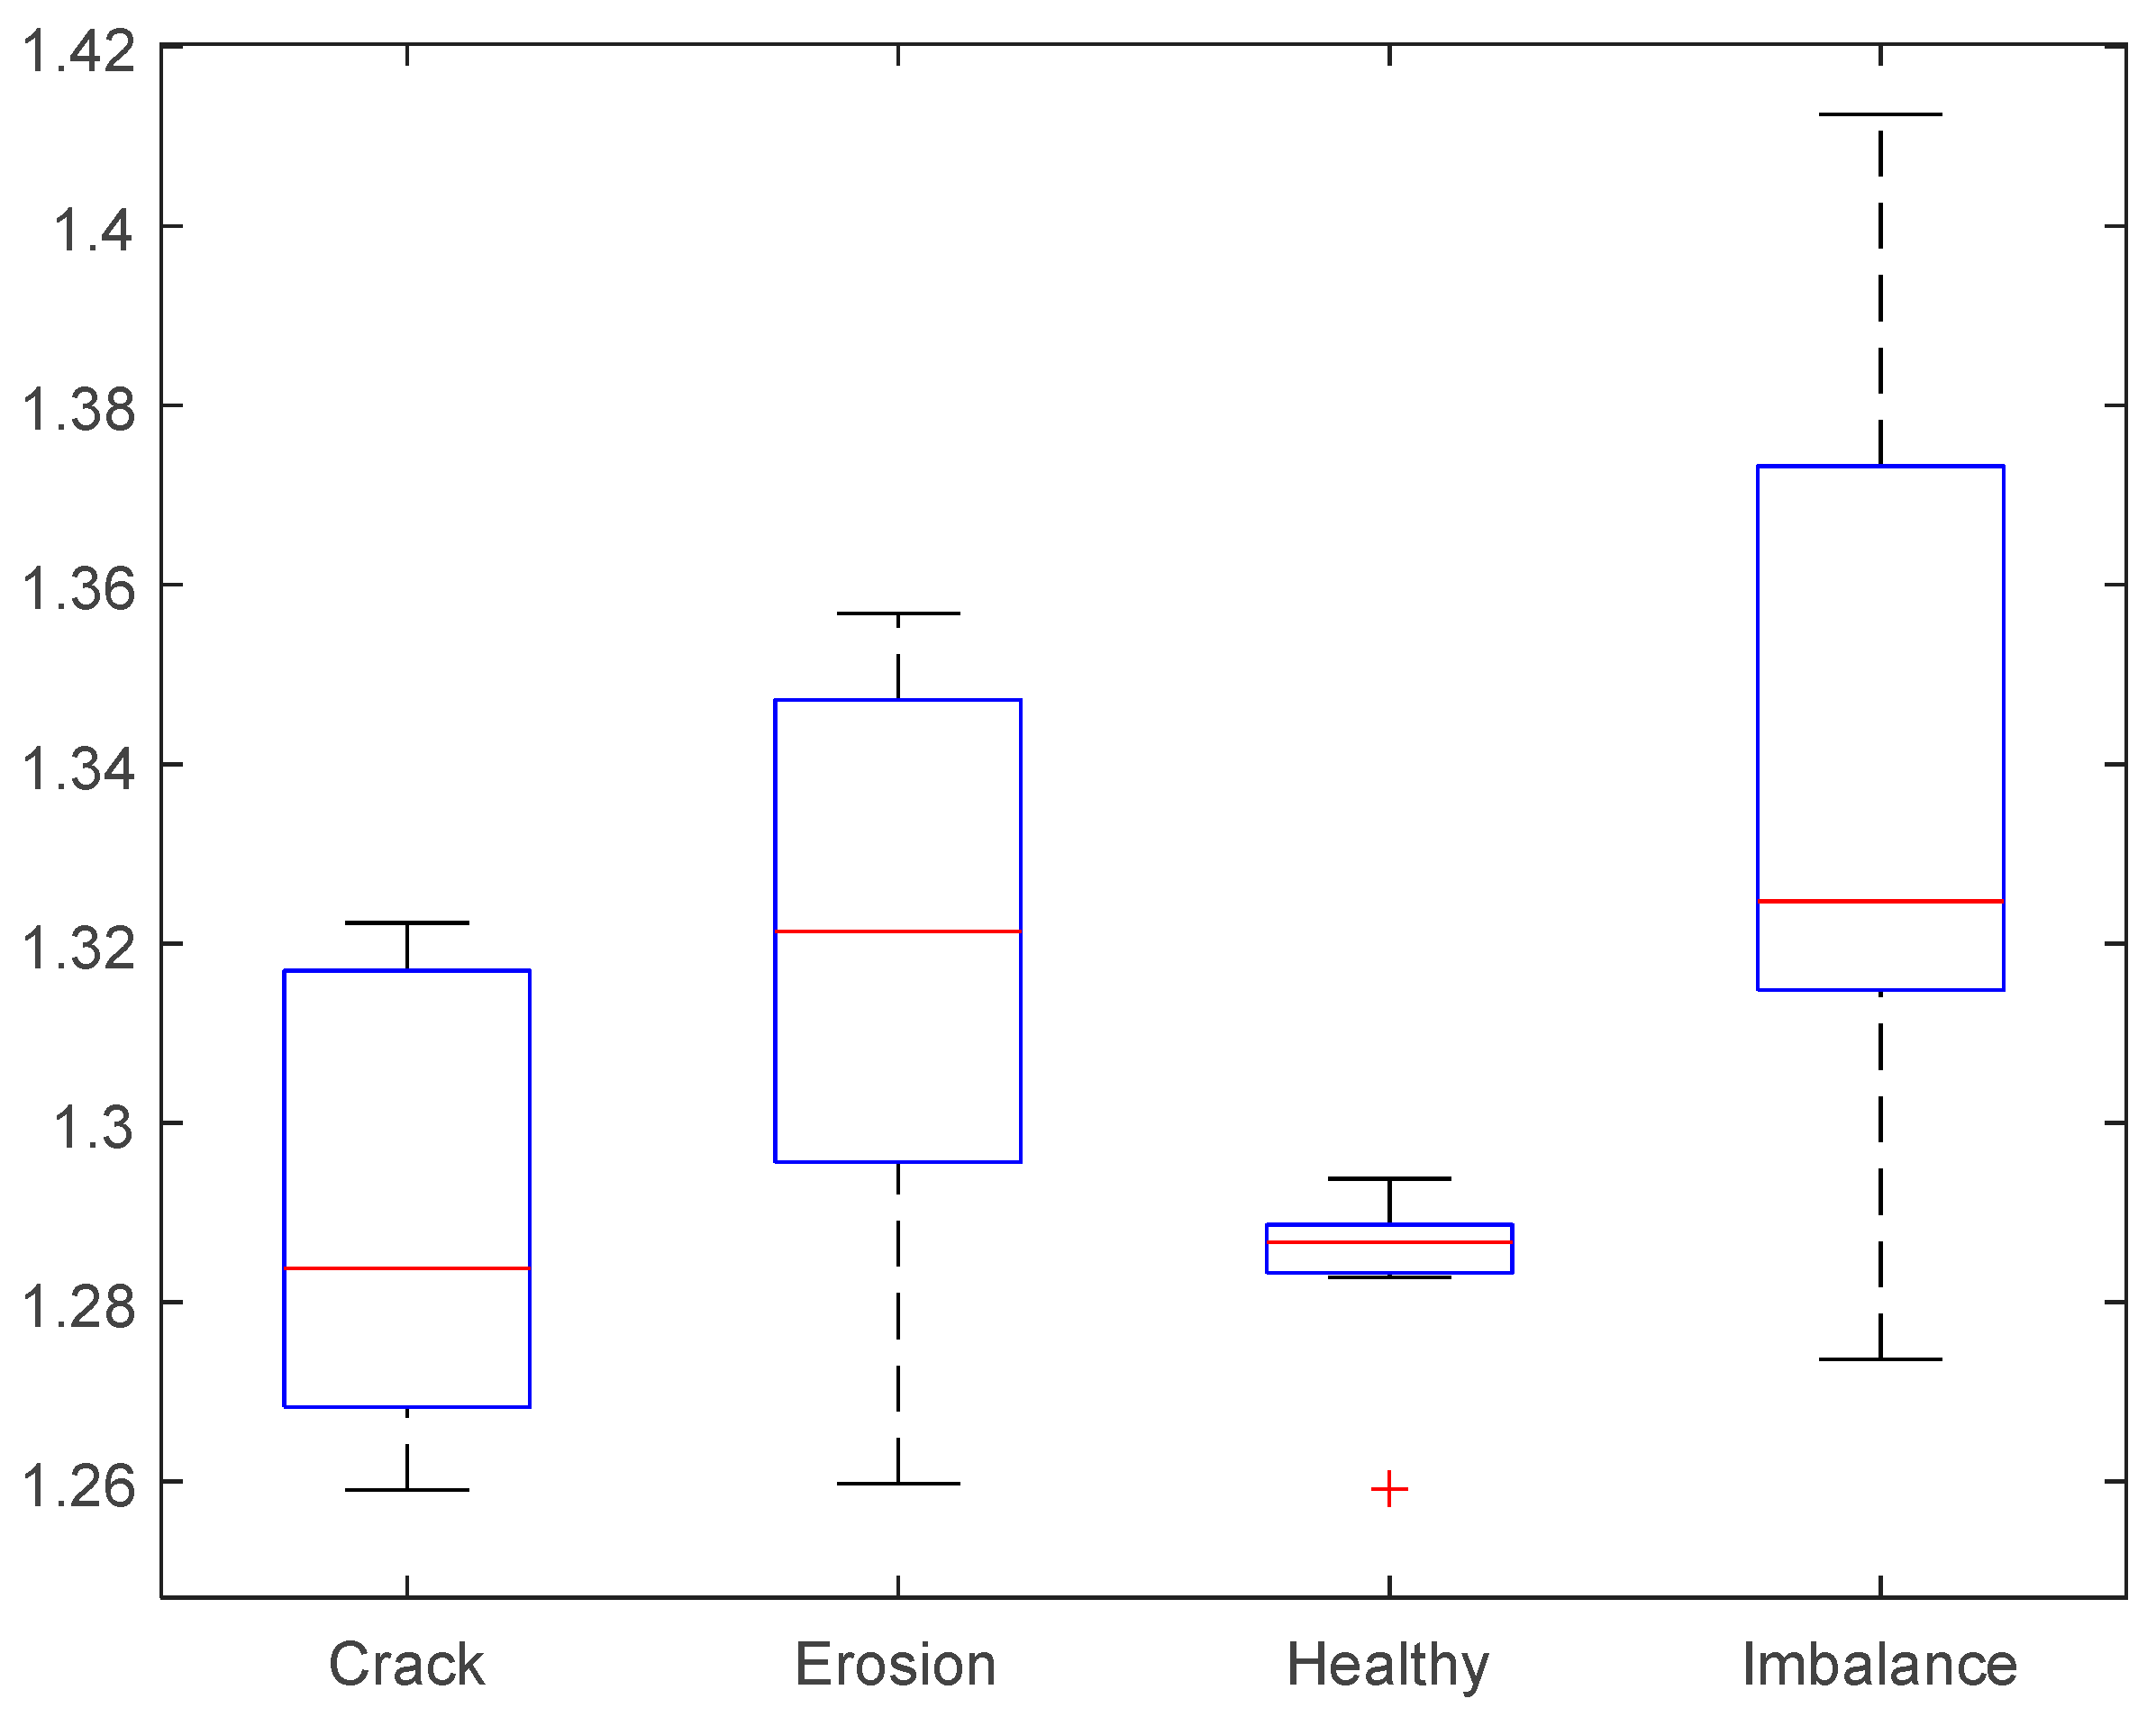
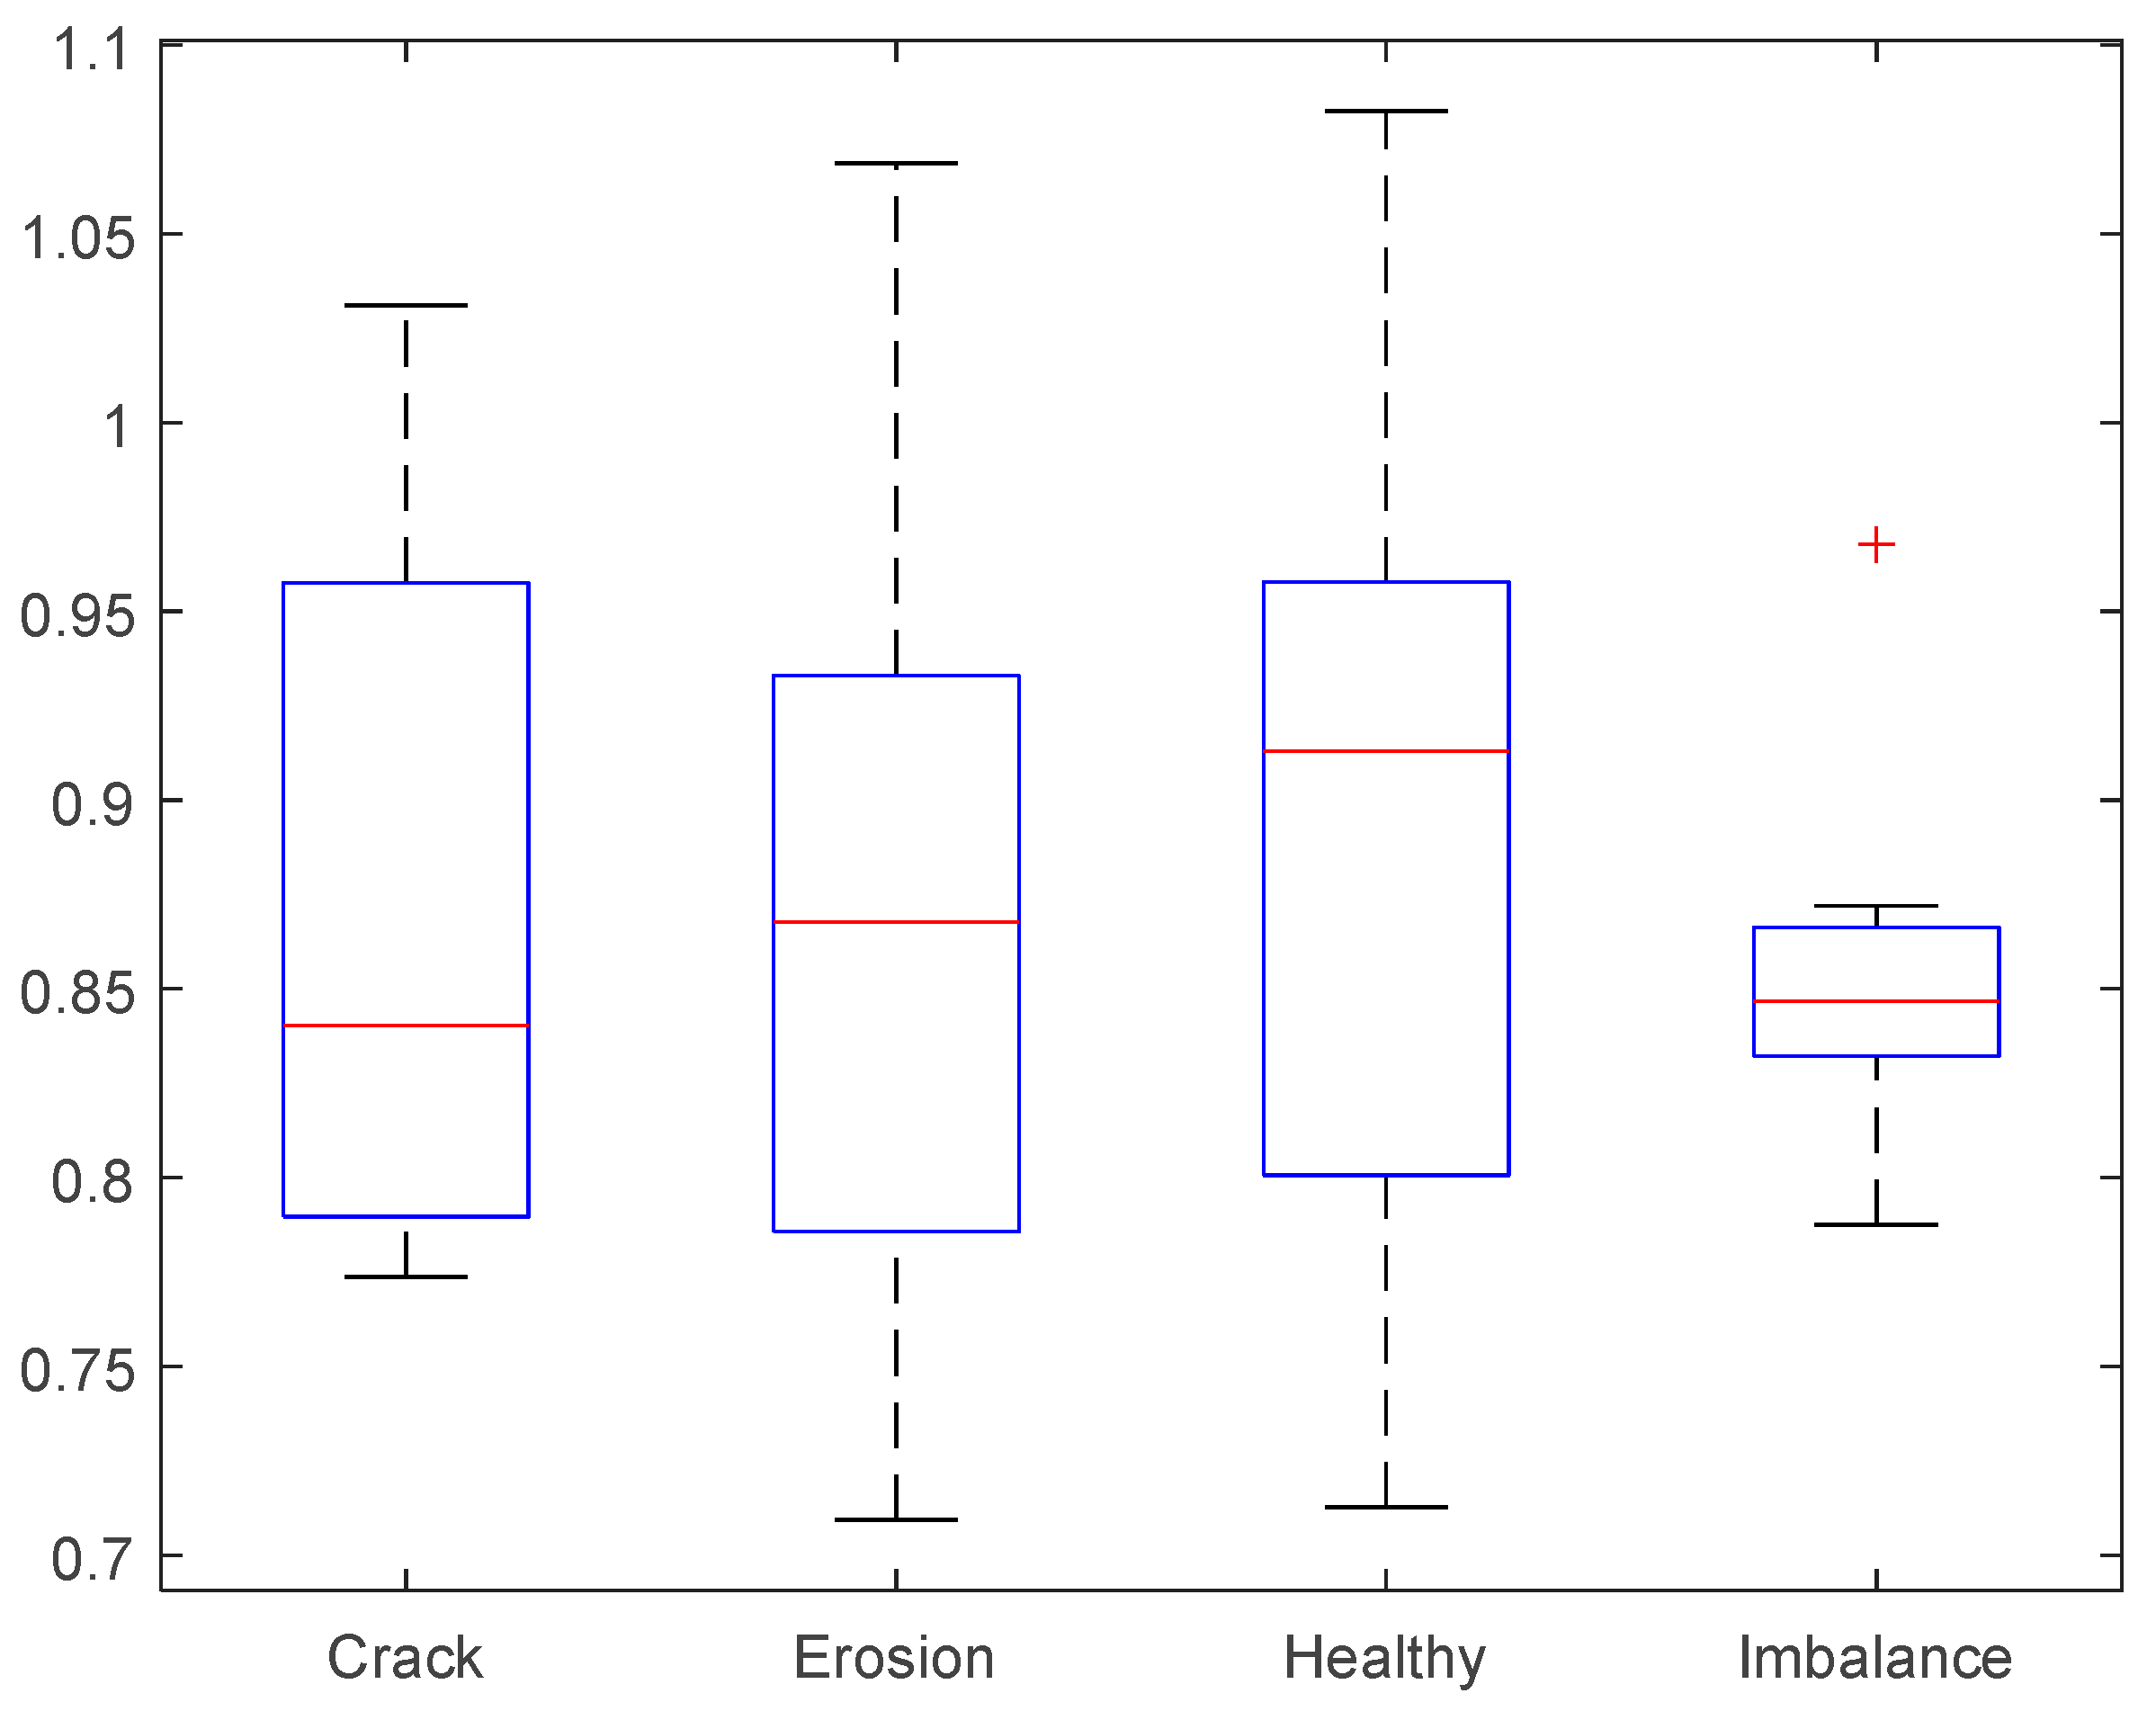
We analyze uniaxial vibration data collected from wind turbines under various operating conditions caused by different wind speeds. Specifically, the vibration measurements are obtained from an induction wind turbine in healthy and faulty states including cracked blades, erosion of the blade surface, and mass imbalance. The vibration measurements are expressed in g (1 g = 9.80665 m/s2). Each file presents unique data collected under various operating conditions and the health status of the wind turbine. There are seven recorded signals from each condition at various wind speeds: 1.3 m/s, 2.3 m/s, 3.2 m/s, 3.7 m/s, 4.5 m/s, and 5 m/s. The data set was obtained from [59]. More details can be found in [59]. Examples of recorded signals from wind turbine blades under different conditions are shown in Figure 1. In addition, Figure 2 exhibits the boxplots of the estimated correlation dimension, Figure 3 exhibits the boxplots of the estimated approximate entropy, and Figure 4 exhibits the boxplots of the estimated Lyapunov exponent.

Figure 1.
Examples of measured wind turbine blade signals under different conditions at wind speed 1.3 m/s.
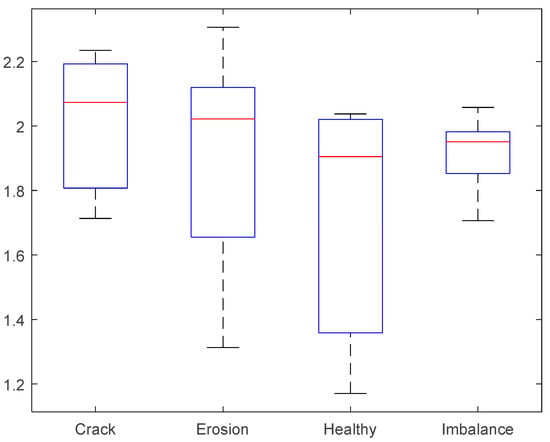
Figure 2.
Boxplots of estimated correlation dimension under different conditions.
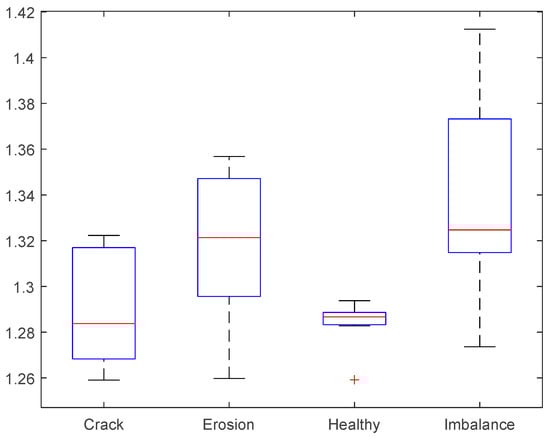
Figure 3.
Boxplots of estimated approximate entropy under different conditions.
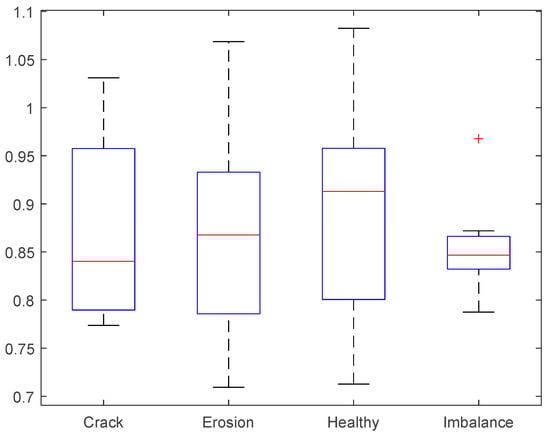
Figure 4.
Boxplots of estimated Lyapunov exponent under different conditions.
Let us recall that the main objective of this study is to verify if the estimated nonlinear descriptors (the correlation dimension, approximate entropy, and the Lyapunov exponent) can differentiate between healthy and fault conditions and between various fault conditions. In this regard, we aim to apply formal statistical tests, namely the Student t-test and F-test. The former is performed to check the null hypothesis equality of means and the latter is performed to check the null hypothesis equality of variance. Both tests are performed at a 5% significance level. The results follow next.
The analysis of Figure 2 and Figure 3 was performed by applying formal statistical tests. Specifically, to check if the estimated attractor descriptors (the correlation dimension, approximate entropy, and the Lyapunov exponent) are different across pairs of wind turbine blade conditions, we applied the Student t-test for equality of means and the F-test for equality of variances at a 5% statistical significance level. The calculated p-values from these statistical tests are shown in Table 1 for the correlation dimension, Table 2 for approximate entropy, and Table 3 for the estimated Lyapunov exponents.

Table 1.
The p-value from the statistical tests applied to the correlation dimension.
Table 2.
The p-value from the statistical tests applied to approximate entropy.
Table 3.
The p-value from the statistical tests applied to the Lyapunov exponent.
According to Table 1, the mean of the correlation dimension is statistically similar across all pairs of wind turbine blade conditions. In addition, the variance of the correlation dimension is statistically similar across all pairs of wind turbine blade conditions, except between healthy versus mass imbalance and between erosion versus mass imbalance. Thus, the correlation dimension used to describe fractals is not able to distinguish between all conditions of wind turbine blades, although its variance is different across healthy and mass imbalance conditions and across erosion and mass imbalance conditions.
Moreover, according to Table 2, the mean of approximate entropy is statistically similar across healthy and crack fault conditions, crack fault and erosion fault conditions, and erosion and mass imbalance conditions. However, the mean of approximate entropy is different between healthy and erosion fault conditions, between healthy and mass imbalance conditions, and between crack fault and mass imbalance conditions. The variance of approximate entropy is statistically different only between healthy and erosion fault conditions and between healthy and mass imbalance conditions. Therefore, approximate entropy is a suitable attractor descriptor to distinguish between healthy and erosion conditions and between healthy and mass imbalance conditions.
In addition, according to the reported p-values in Table 3, there is no significant difference in the mean and variance of the Lyapunov exponent across all wind turbine blade conditions. Hence, chaos is not a discriminative feature to distinguish between wind turbine blade conditions.
Finally, a one-sided t-test and F-test are performed to check under which condition wind turbine blades show a higher correlation dimension, approximate entropy, and Lyapunov exponent. The p-values from these statistical tests are provided in Table 4. As shown, there is strong evidence that the mean and variance of approximate entropy are larger in healthy blades compared to blades with erosion, and they are larger in healthy blades compared to blades with mass imbalance. As a result, since a large value of approximate entropy indicates irregularity in the system [43], wind turbine blades with either erosion or with mass imbalance exhibit less irregularity in their respective signals than healthy wind turbine blades.
Table 4.
The p-value from the one-sided tests.
4. Discussion and Conclusions
Because of the increasing demand for energy and due to climate change, wind energy is becoming a dominant renewable energy. Indeed, wind energy is attractive because of its benefits including its strong potential and being the cleanest and the safest sustainable energy resource. In this regard, a normal and healthy condition of wind turbine blades is essential to maximize energy production. However, operating wind turbine blades under different loading and environmental conditions causes significant anomalies in the structural dynamics of the blade. Therefore, to enable timely proactive maintenance tasks, there is a necessity to correctly distinguish abnormalities and deviations from the normal behavior of wind turbine blades. Certainly, since early fault diagnosis of wind turbine blades is essential for the timely maintenance and control of hazardous risks, various methods were proposed to characterize blades under different conditions including standard weather and turbine mechanical characteristics [7,8], statistical moments and time domain features [10,16], and frequency and time–frequency domain features [10,18]. Other studies used fractals [19,20,21,22,23,24], entropy concepts [25,26,27,28,29,30,31,32,33], and chaos theory [34,35,36,37,38,39].
Aiming at the characterization of wind turbine blades under different conditions, this study focuses on the investigation of the usefulness of fractals, entropy, and chaos in distinguishing between different conditions of wind turbine blades, including healthy blades (normal), cracked blades, erosion of the blade surface, and mass imbalance. Specifically, by using formal statistical tests, we verify the discriminative power of fractals estimated by the correlation dimension, approximate entropy, and the Lyapunov exponent when applied to wind turbine blade signals. We rely on these attractor descriptors as they were found to be effective in various applications to characterize fractals [60,61,62,63,64,65], entropy [66,67,68], and chaos [69,70,71].
In sum, we have found that the correlation dimension used to describe fractals is not able to distinguish between all conditions of wind turbine blades, although its variance is different across healthy and mass imbalance conditions and across erosion and mass imbalance conditions. In addition, approximate entropy is a suitable attractor descriptor to distinguish between healthy and erosion conditions and between healthy and mass imbalance conditions. Furthermore, chaos is not a discriminative feature to distinguish between wind turbine blade conditions. Moreover, wind turbine blades with either erosion or with mass imbalance exhibit less irregularity in their respective signals than healthy wind turbine blades. In future work, the effect of wind on complexity across blade conditions will be examined.
Funding
This study received no external funding.
Data Availability Statement
The data can be obtained from reference [59].
Conflicts of Interest
The author declares no conflicts of interest.
References
- Santos, P.; Villa, L.; Reñones, A.; Bustillo, A.; Maudes, J. An SVM-based solution for fault detection in wind turbines. Sensors 2015, 15, 5627–5648. [Google Scholar] [CrossRef]
- Wang, Z.; Li, G.; Yao, L.; Cai, Y.; Lin, T.; Zhang, J.; Dong, H. Intelligent fault detection scheme for constant-speed wind turbines based on improved multiscale fuzzy entropy and adaptive chaotic Aquila optimization-based support vector machine. ISA Trans. 2023, 138, 582–602. [Google Scholar] [CrossRef] [PubMed]
- Qian, X.; Sun, T.; Zhang, Y.; Wang, B.; Gendeel, M.A.A. Wind turbine fault detection based on spatial-temporal feature and neighbor operation state. Renew. Energy 2023, 219, 119419. [Google Scholar] [CrossRef]
- Ohunakin, O.S.; Henry, E.U.; Matthew, O.J.; Ezekiel, V.U.; Adelekan, D.S.; Oyeniran, A.T. Conditional monitoring and fault detection of wind turbines based on Kolmogorov-Smirnov non-parametric test. Energy Rep. 2024, 11, 2577–2591. [Google Scholar] [CrossRef]
- Pérez-Pérez, E.-J.; Puig, V.; López-Estrada, F.-R.; Valencia-Palomo, G.; Santos-Ruiz, I.; Samada, S.E. Fault detection and isolation in wind turbines based on neuro-fuzzy qLPV zonotopic observers. Mech. Syst. Signal Process. 2023, 191, 110183. [Google Scholar] [CrossRef]
- Pérez-Pérez, E.-J.; López-Estrada, F.-R.; Puig, V.; Valencia-Palomo, G.; Santos-Ruiz, I. Fault diagnosis in wind turbines based on ANFIS and Takagi-Sugeno interval observers. Expert Syst. Appl. 2022, 206, 117698. [Google Scholar] [CrossRef]
- Tong, R.; Li, P.; Lang, X.; Liang, J.; Cao, M. A novel adaptive weighted kernel extreme learning machine algorithm and its application in wind turbine blade icing fault detection. Measurement 2021, 185, 110009. [Google Scholar] [CrossRef]
- Jordi, Z.J.; Erasmo, C.; Rafael, C.-A. Multi-criteria optimal design of small wind turbine blades based on deep learning methods. Energy 2024, 293, 130625. [Google Scholar] [CrossRef]
- Chen, W.; Qiu, Y.; Feng, Y.; Li, Y.; Kusiak, A. Diagnosis of wind turbine faults with transfer learning algorithms. Renewable Energy 2021, 163, 2053–2067. [Google Scholar] [CrossRef]
- Jaramillo, F.; Gutiérrez, J.M.; Orchard, M.; Guarini, M.; Astroza, R. A Bayesian approach for fatigue damage diagnosis and prognosis of wind turbine blades. Mech. Syst. Signal Process. 2022, 174, 109067. [Google Scholar] [CrossRef]
- Khan, P.W.; Yeun, C.Y.; Byun, Y.C. Fault detection of wind turbines using SCADA data and genetic algorithm-based ensemble learning. Eng. Fail. Anal. 2023, 148, 107209. [Google Scholar] [CrossRef]
- Ling, X.; Xin, Y.; Aijun, H.; Hao, S.; Penghe, W. Condition monitoring and anomaly detection of wind turbine based on cascaded and bidirectional deep learning networks. Appl. Energy 2022, 305, 117925. [Google Scholar]
- Reihane, R.; Zhiwei, G.; Nanlin, J.; Aihua, Z. Convolutional neural network fault classification based on time-series analysis for benchmark wind turbine machine. Renew. Energy 2022, 185, 916–931. [Google Scholar]
- Dibaj, A.; Gao, Z.; Nejad, A.R. Fault detection of offshore wind turbine drivetrains in different environmental conditions through optimal selection of vibration measurements. Renew. Energy 2023, 203, 161–176. [Google Scholar] [CrossRef]
- Qiao, L.; Zhang, Y.; Wang, Q. Fault detection in wind turbine generators using a meta-learning-based convolutional neural network. Mech. Syst. Signal Process. 2023, 200, 110528. [Google Scholar] [CrossRef]
- Tao, C.; Tao, T.; He, S.; Bai, X.; Liu, Y. Wind turbine blade icing diagnosis using B-SMOTE-Bi-GRU and RFE combined with icing mechanism. Renew. Energy 2024, 221, 119741. [Google Scholar] [CrossRef]
- Liu, W.-X.; Yin, R.-P.; Zhu, P.-Y. Deep learning approach for sensor data prediction and sensor fault diagnosis in wind turbine blade. IEEE Access 2022, 10, 117225–117234. [Google Scholar] [CrossRef]
- Huang, X.; Zhang, X.; Xiong, Y.; dai, f.; Zhang, Y. Intelligent fault diagnosis of turbine blade cracks via multiscale sparse filtering and multi-kernel support vector machine for information fusion. Adv. Eng. Inform. 2023, 56, 101979. [Google Scholar] [CrossRef]
- Yao, Y.; Wang, N. Fault diagnosis model of adaptive miniature circuit breaker based on fractal theory and probabilistic neural network. Mech. Syst. Signal Process. 2020, 142, 106772. [Google Scholar] [CrossRef]
- Dao, P.B.; Staszewski, W.J. Lamb wave based structural damage detection using cointegration and fractal signal processing. Mech. Syst. Signal Process. 2014, 49, 285–301. [Google Scholar] [CrossRef]
- Yang, J.; Zhang, Y.; Zhu, Y. Intelligent fault diagnosis of rolling element bearing based on SVMs and fractal dimension. Mech. Syst. Signal Process. 2007, 21, 2012–2024. [Google Scholar] [CrossRef]
- Liu, H.; Song, W.; Niu, Y.; Zio, E. A generalized cauchy method for remaining useful life prediction of wind turbine gearboxes. Mech. Syst. Signal Process. 2021, 153, 107471. [Google Scholar] [CrossRef]
- Hao, Q.; Shen, Y.; Wang, Y.; Liu, J. An adaptive extraction method for rail crack acoustic emission signal under strong wheel-rail rolling noise of high-speed railway. Mech. Syst. Signal Process. 2021, 154, 107546. [Google Scholar] [CrossRef]
- Zhang, Y.; Ren, G.; Wu, D.; Wang, H. Rolling bearing fault diagnosis utilizing variational mode decomposition based fractal dimension estimation method. Measurement 2021, 181, 109614. [Google Scholar] [CrossRef]
- Wang, B.; Li, H.; Hu, X.; Wang, C.; Sun, D. Rolling bearing fault diagnosis based on fine-grained multi-scale Kolmogorov entropy and WOA-MSVM. Heliyon 2024, 10, e27986. [Google Scholar] [CrossRef] [PubMed]
- Wang, S.; Li, Y.; Noman, K.; Wang, D.; Feng, K.; Liu, Z.; Deng, Z. Cumulative spectrum distribution entropy for rotating machinery fault diagnosis. Mech. Syst. Signal Process. 2024, 206, 110905. [Google Scholar] [CrossRef]
- Zhou, J.; Chen, C.; Guo, J.; Wang, L.; Liu, Z.; Feng, C. A novel rolling bearing fault diagnosis method based on continuous hierarchical fractional range entropy. Measurement 2023, 220, 113395. [Google Scholar] [CrossRef]
- Ye, Y.; Wei, L.; Li, F.; Zeng, J.; Hecht, M. Multislice Time-Frequency image Entropy as a feature for railway wheel fault diagnosis. Measurement 2023, 216, 112862. [Google Scholar] [CrossRef]
- Jin, Z.; Xiao, Y.; He, D.; Wei, Z.; Sun, Y.; Yang, W. Fault diagnosis of bearing based on refined piecewise composite multivariate multiscale fuzzy entropy. Digit. Signal Process. 2023, 133, 103884. [Google Scholar] [CrossRef]
- Ma, C.; Li, Y.; Wang, X.; ZCai, Z. Early fault diagnosis of rotating machinery based on composite zoom permutation entropy. Reliab. Eng. Syst. Saf. 2023, 230, 108967. [Google Scholar] [CrossRef]
- Tan, H.; Xie, S.; Zhou, H.; Ma, W.; Yang, C.; Zhang, J. Sensible multiscale symbol dynamic entropy for fault diagnosis of bearing. Int. J. Mech. Sci. 2023, 256, 108509. [Google Scholar] [CrossRef]
- Zhou, C.; Jia, Y.; Zhao, S.; Yang, Q.; Liu, Y.; Zhang, Z.; Wang, T. A mechanical part fault diagnosis method based on improved multiscale weighted permutation entropy and multiclass LSTSVM. Measurement 2023, 214, 112671. [Google Scholar] [CrossRef]
- Zhao, D.; Liu, S.; Du, H.; Wang, L.; Miao, Z. Deep branch attention network and extreme multi-scale entropy based single vibration signal-driven variable speed fault diagnosis scheme for rolling bearing. Adv. Eng. Inform. 2023, 55, 101844. [Google Scholar] [CrossRef]
- Huang, P.; Chen, X.; Chai, Y.; Ma, L. A unified framework of fault detection and diagnosis based on fractional-order chaos system. Aerosp. Sci. Technol. 2022, 130, 107871. [Google Scholar] [CrossRef]
- Zhao, Z.; Jia, M.; Wang, F.; Wang, S. Intermittent chaos and sliding window symbol sequence statistics-based early fault diagnosis for hydraulic pump on hydraulic tube tester. Mech. Syst. Signal Process. 2009, 23, 1573–1585. [Google Scholar] [CrossRef]
- Hsieh, C.-H.; Yau, H.-T.; Lin, H.-C. Study on real-time extension fault detection for a XXY stage by using chaos synchronization. J. Appl. Res. Technol. 2015, 13, 305–312. [Google Scholar] [CrossRef]
- Li, Z.; Peng, Z. A new nonlinear blind source separation method with chaos indicators for decoupling diagnosis of hybrid failures: A marine propulsion gearbox case with a large speed variation. Chaos Solitons Fractals 2016, 89, 27–39. [Google Scholar] [CrossRef]
- Lucena-Junior, J.A.; de Vasconcelos Lima, T.L.; Pereira Bruno, G.; Brito, A.V.; de Souza Ramos, J.G.G.; Belo, F.A.; Cavalcante Lima-Filho, A. Chaos theory using density of maxima applied to the diagnosis of three-phase induction motor bearings failure by sound analysis. Comput. Ind. 2020, 123, 103304. [Google Scholar] [CrossRef]
- Przystałka, P.; Moczulski, W. Methodology of neural modelling in fault detection with the use of chaos engineering. Eng. Appl. Artif. Intell. 2015, 41, 25–40. [Google Scholar] [CrossRef]
- Grassberger, P.; Procaccia, I. Measuring the strangeness of strange attractors. Phys. D 1983, 9, 189–208. [Google Scholar] [CrossRef]
- Grassberger, P.; Procaccia, I. Characterization of strange attractors. Phys. Rev. Lett. 1983, 50, 346–349. [Google Scholar] [CrossRef]
- Shannon, C.E. A mathematical theory of communication. Bell Syst. Tech. J. 1948, 27, 379–423. [Google Scholar] [CrossRef]
- Pincus, S.M. Approximate entropy as a measure of system complexity. Proc. Natl. Acad. Sci. USA 1991, 88, 2297–2301. [Google Scholar] [CrossRef] [PubMed]
- Wolf, A.; Swift, J.B.; Swinney, H.L.; Vastano, J.A. Determining Lyapunov exponents from a time series. Phys. D 1985, 16, 285–317. [Google Scholar] [CrossRef]
- Rosenstein, M.T.; Collins, J.J.; De Luca, C.J. A practical method for calculating largest Lyapunov exponents from small data sets. Phys. D 1993, 65, 117–134. [Google Scholar] [CrossRef]
- Phillips, J.D. Sources of nonlinearity and complexity in geomorphic systems. Prog. Phys. Geogr. 2003, 27, 1–23. [Google Scholar] [CrossRef]
- Shu, Z.R.; Chan, P.W.; Li, Q.S.; He, X.H.; Cai, C.Z. Characterising the variability in ocean data using fractal and correlation dimension analysis. Appl. Ocean Res. 2023, 138, 103590. [Google Scholar] [CrossRef]
- Camastra, F.; Capone, V.; Ciaramella, A.; Riccio, A.; Staiano, A. Prediction of environmental missing data time series by support vector machine regression and correlation dimension estimation. Environ. Model. Softw. 2022, 150, 105343. [Google Scholar] [CrossRef]
- Zheng, Y.; Wen, Y.; Pan, T.; Liu, Y.; Zhou, Y.; Li, R.; Zhou, Y. Fractal characteristics and damage evaluation of corroded beams under four-point bending tests based on acoustic emission techniques. Measurement 2022, 202, 111792. [Google Scholar] [CrossRef]
- Ocak, H. Automatic detection of epileptic seizures in EEG using discrete wavelet transform and approximate entropy. Expert Syst. Appl. 2009, 36, 2027–2036. [Google Scholar] [CrossRef]
- Jones, K.A.; Paterson, C.A.; Hamilton, D.J.; Small, A.D.; Martin, W.; Robinson, J.; Goodfield, N.E.R. Optimising approximate entropy for assessing cardiac dyssynchrony with radionuclide ventriculography. Biomed. Signal Process. Control 2021, 68, 102703. [Google Scholar] [CrossRef]
- Cao, Y.; He, Y.; Yang, J.; Gan, C. A method for weak impact signal discrimination based on para-approximate entropy. Prog. Nucl. Energy 2012, 60, 53–60. [Google Scholar] [CrossRef]
- Lahmiri, S.; Bekiros, S. Complexity measures of high oscillations in phonocardiogram as biomarkers to distinguish between normal heart sound and pathological murmur. Chaos Solitons Fractals 2022, 154, 111610. [Google Scholar] [CrossRef]
- Lahmiri, S.; Bekiros, S.; Bezzina, F. Complexity analysis and forecasting of variations in cryptocurrency trading volume with support vector regression tuned by Bayesian optimization under different kernels: An empirical comparison from a large dataset. Expert Syst. Appl. 2022, 209, 118349. [Google Scholar] [CrossRef]
- Lahmiri, S.; Tadj, C.; Gargour, C.; Bekiros, S. Characterization of infant healthy and pathological cry signals in cepstrum domain based on approximate entropy and correlation dimension. Chaos Solitons Fractals 2021, 143, 110639. [Google Scholar] [CrossRef]
- Fei, K.; Wang, W.; Yang, Q.; Tang, S. Chaos feature study in fractional Fourier domain for preictal prediction of epileptic seizure. Neurocomputing 2017, 249, 290–298. [Google Scholar] [CrossRef]
- Eskandari, A.H.; Ghezelbash, F.; Shirazi-Adl, A.; Larivière, C. Comparative evaluation of different spinal stability metrics. J. Biomech. 2024, 162, 111901. [Google Scholar] [CrossRef] [PubMed]
- Chakraborty, S.; Nandy, A.; Yamaguchi, T.; Bonnet, V.; Venture, G. Accuracy of image data stream of a markerless motion capture system in determining the local dynamic stability and joint kinematics of human gait. J. Biomech. 2020, 104, 109718. [Google Scholar] [CrossRef] [PubMed]
- Ogaili, A.A.F.; Jaber, A.A.; Hamzah, M.N. Wind turbine blades fault diagnosis based on vibration dataset analysis. Data Brief 2023, 49, 109414. [Google Scholar] [CrossRef]
- Zhang, H.; Zhang, Z.; Wang, Z.; Wang, Y.; Yang, R.; Zhu, T.; Luo, F.; Liu, K. Using Fractal Theory to Study the Influence of Movable Oil on the Pore Structure of Different Types of Shale: A Case Study of the Fengcheng Formation Shale in Well X of Mahu Sag, Junggar Basin, China. Fractal Fract. 2024, 8, 242. [Google Scholar] [CrossRef]
- Hu, F.; Zhang, K.; Zhu, K.; Li, B.; Zhang, Z.; He, Y. Fractal analysis on the crushing characteristics of soil-soft rock mixtures under compaction. Fractal Fract. 2024, 8, 90. [Google Scholar] [CrossRef]
- Zhang, J.; Ni, X.; Liu, X.; Su, E. Influences of different acid solutions on pore structures and fractal features of coal. Fractal Fract. 2024, 8, 82. [Google Scholar] [CrossRef]
- Guo, S.; Zhang, L.; Pu, H.; Zheng, Y.; Li, B.; Wu, P.; Qiu, P.; Ma, C.; Feng, Y. Dynamic compressive mechanical property characteristics and fractal dimension applications of coal-bearing mudstone at real-time temperatures. Fractal Fract. 2023, 7, 695. [Google Scholar] [CrossRef]
- Ozturk, N.; Begovic, H.; Demir, P.; Can, F.; Yagcioglu, S. Effects of transverse friction massage on the electromechanical delay components and fractal dimension of surface electromyography in quadriceps muscles. Fractal Fract. 2023, 7, 620. [Google Scholar] [CrossRef]
- Zhang, Q.; Pei, Y.; Shen, Y.; Wang, X.; Lai, J.; Wang, M. A New Perspective on Predicting Roughness of Discontinuity from Fractal Dimension D of Outcrops. Fractal Fract. 2023, 7, 496. [Google Scholar] [CrossRef]
- Machorro-Lopez, J.M.; Yanez-Borjas, J.J.; Valtierra-Rodriguez, M.; Amezquita-Sanchez, J.P. Entropy wavelet-based method to increase efficiency in highway bridge damage identification. Appl. Sci. 2024, 14, 3298. [Google Scholar] [CrossRef]
- Yao, B.; Wu, C.; Zhang, X.; Yao, J.; Xue, J.; Zhao, Y.; Li, T.; Pu, J. The EEG-based fusion entropy-featured identification of isometric contraction forces under the same action. Sensors 2024, 24, 2323. [Google Scholar] [CrossRef] [PubMed]
- Rojas, A.J. Differential entropy-based fault-detection mechanism for power-constrained networked control systems. Entropy 2024, 26, 259. [Google Scholar] [CrossRef] [PubMed]
- Cui, Z.; Zhou, Y.; Li, R. Complex dynamics analysis and chaos control of a fractional-order three-population food chain model. Fractal Fract. 2023, 7, 548. [Google Scholar] [CrossRef]
- Ren, L.; Muhsen, S.; Shateyi, S.; Saberi-Nik, H. Dynamical behaviour, control, and boundedness of a fractional-order chaotic system. Fractal Fract. 2023, 7, 492. [Google Scholar] [CrossRef]
- Vonesch, A.; Duhot, C.; Lelard, T.; Léonard, G.; Błażkiewicz, M.; Mouras, H. Non-linear measures of postural control in response to painful and non-painful visual stimuli. Entropy 2023, 25, 1561. [Google Scholar] [CrossRef] [PubMed]
Disclaimer/Publisher’s Note: The statements, opinions and data contained in all publications are solely those of the individual author(s) and contributor(s) and not of MDPI and/or the editor(s). MDPI and/or the editor(s) disclaim responsibility for any injury to people or property resulting from any ideas, methods, instructions or products referred to in the content. |
© 2024 by the author. Licensee MDPI, Basel, Switzerland. This article is an open access article distributed under the terms and conditions of the Creative Commons Attribution (CC BY) license (https://creativecommons.org/licenses/by/4.0/).