
Time-Varying Market Efficiency: A Focus on Crude Oil and Commodity Dynamics


Abstract
:1. Introduction
- This study examines the efficiency of 20 commodity assets, providing a more comprehensive analysis based on a richer dataset than previous research. By assessing the market efficiency of major commodities, including crude oil, we offer valuable insights into the overall efficiency of the commodity market.
- To ensure a comprehensive evaluation, we employ both static analysis, which assesses efficiency over the entire period, and a rolling window approach, which captures dynamic fluctuations over time. This dual methodology provides a holistic perspective on commodity market efficiency, from both static and dynamic viewpoints. By analyzing the entire period for all 20 commodity assets, we identify the most and least efficient markets, while also examining variations in efficiency across individual assets, offering a detailed assessment of these changes.
- Furthermore, we analyze the influence of crude oil on the broader commodity market from an efficiency perspective, rather than the conventional focus on price or volatility. This novel approach offers market participants new insights into the interrelationships within the commodity market.
2. Literature Review
2.1. Crude Oil Market Efficiency
2.2. The Market Efficiency of Other Commodities
2.3. Financial Market Analysis Using the MF-DFA Method
3. Data Description and Method
3.1. Commodity Market Data
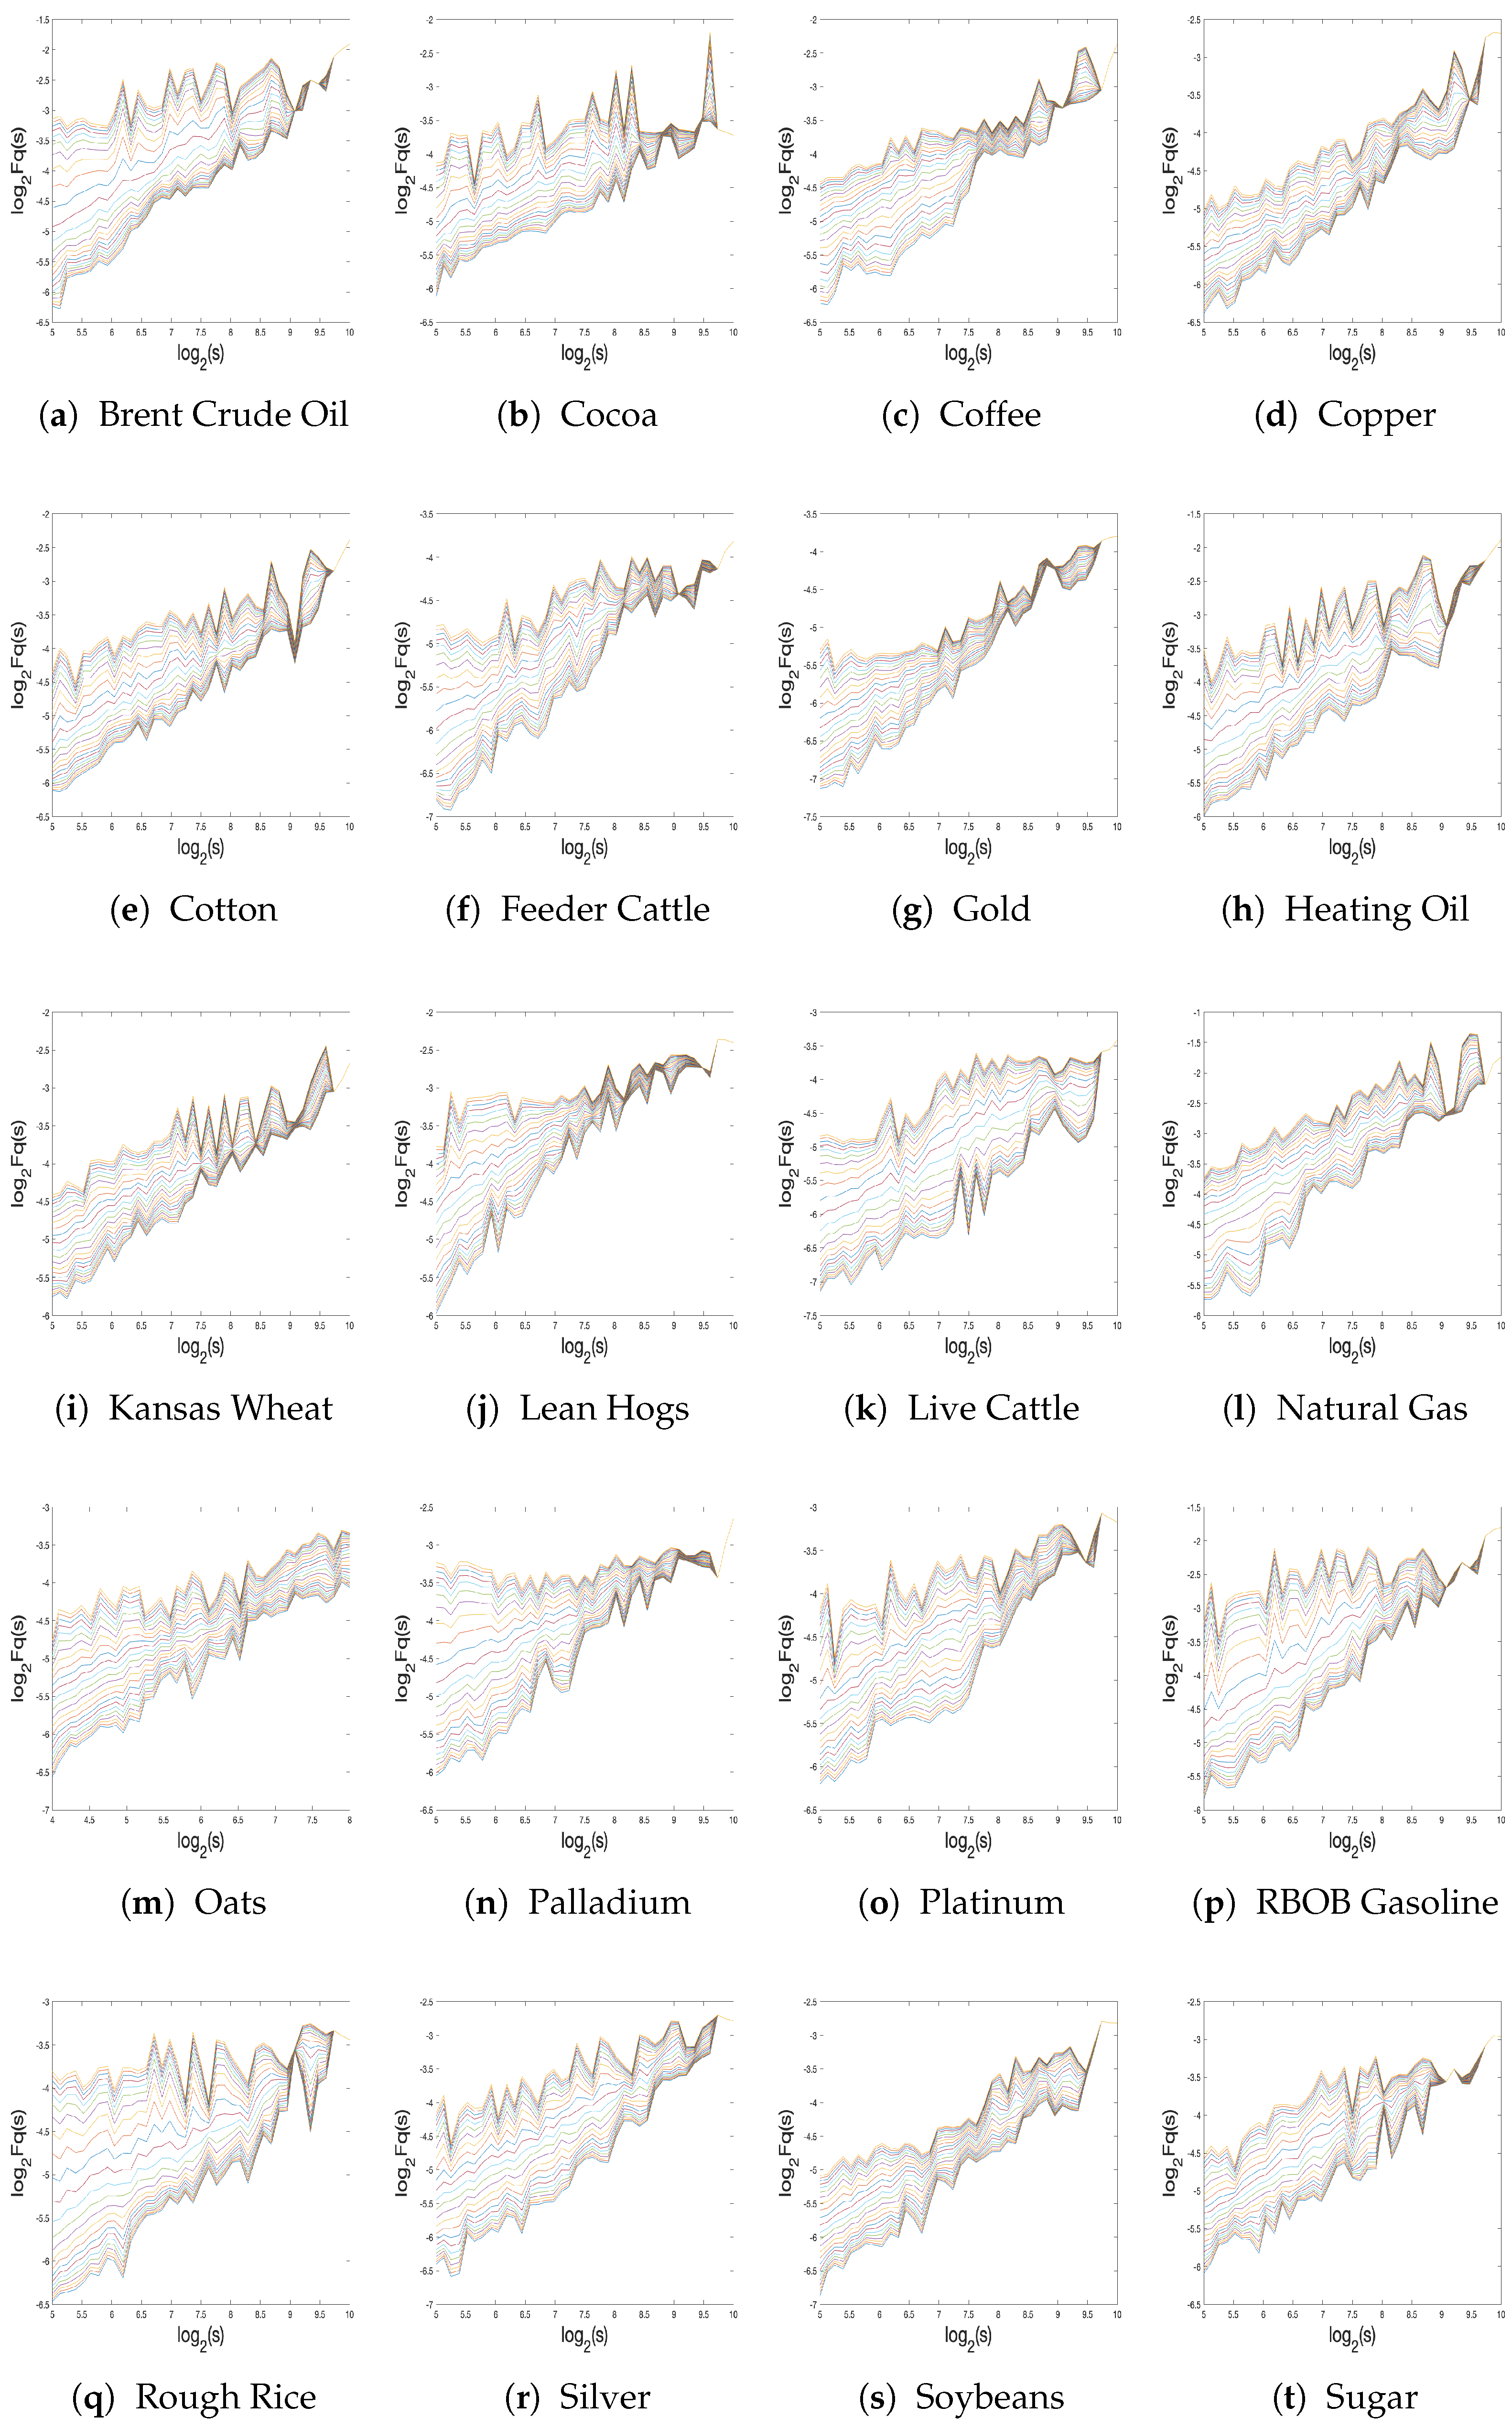
3.2. MF-DFA
- Step 1: Compute the Profile
- Step 2: Segment the Profile
- Step 3: Calculate the Variance
- Step 4: Compute the Fluctuation Function
- Step 5: Analyze the Scaling Properties
4. Results
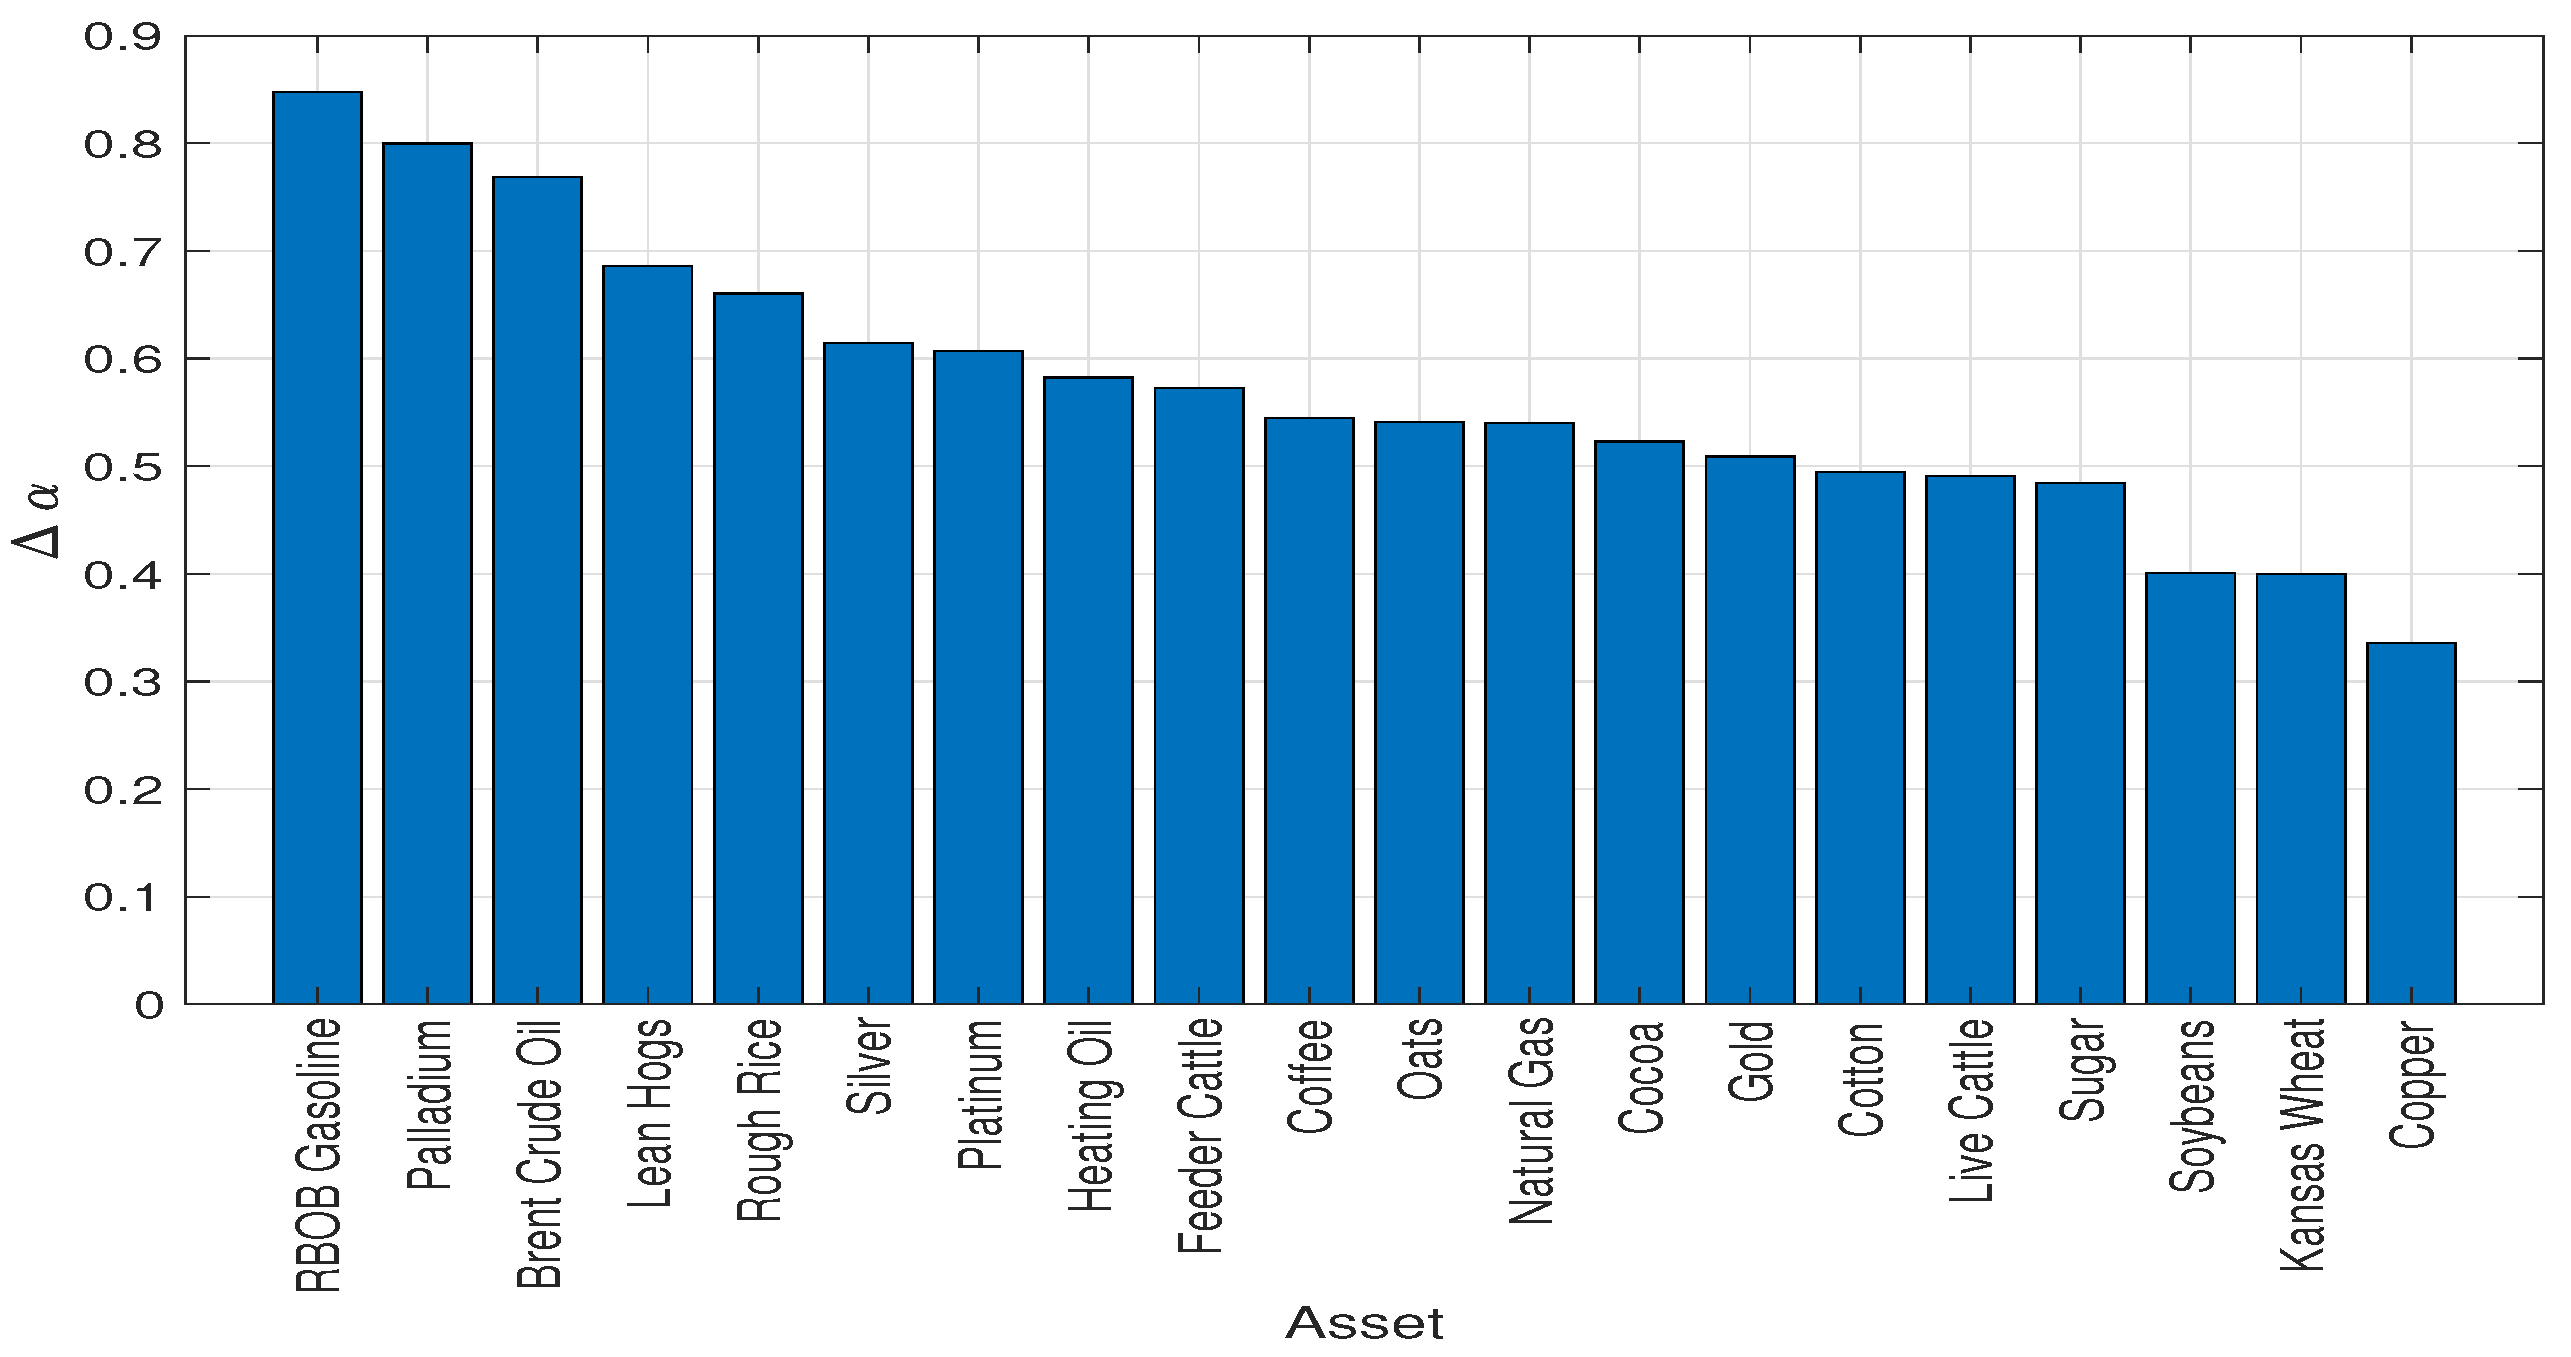
4.1. Full Period
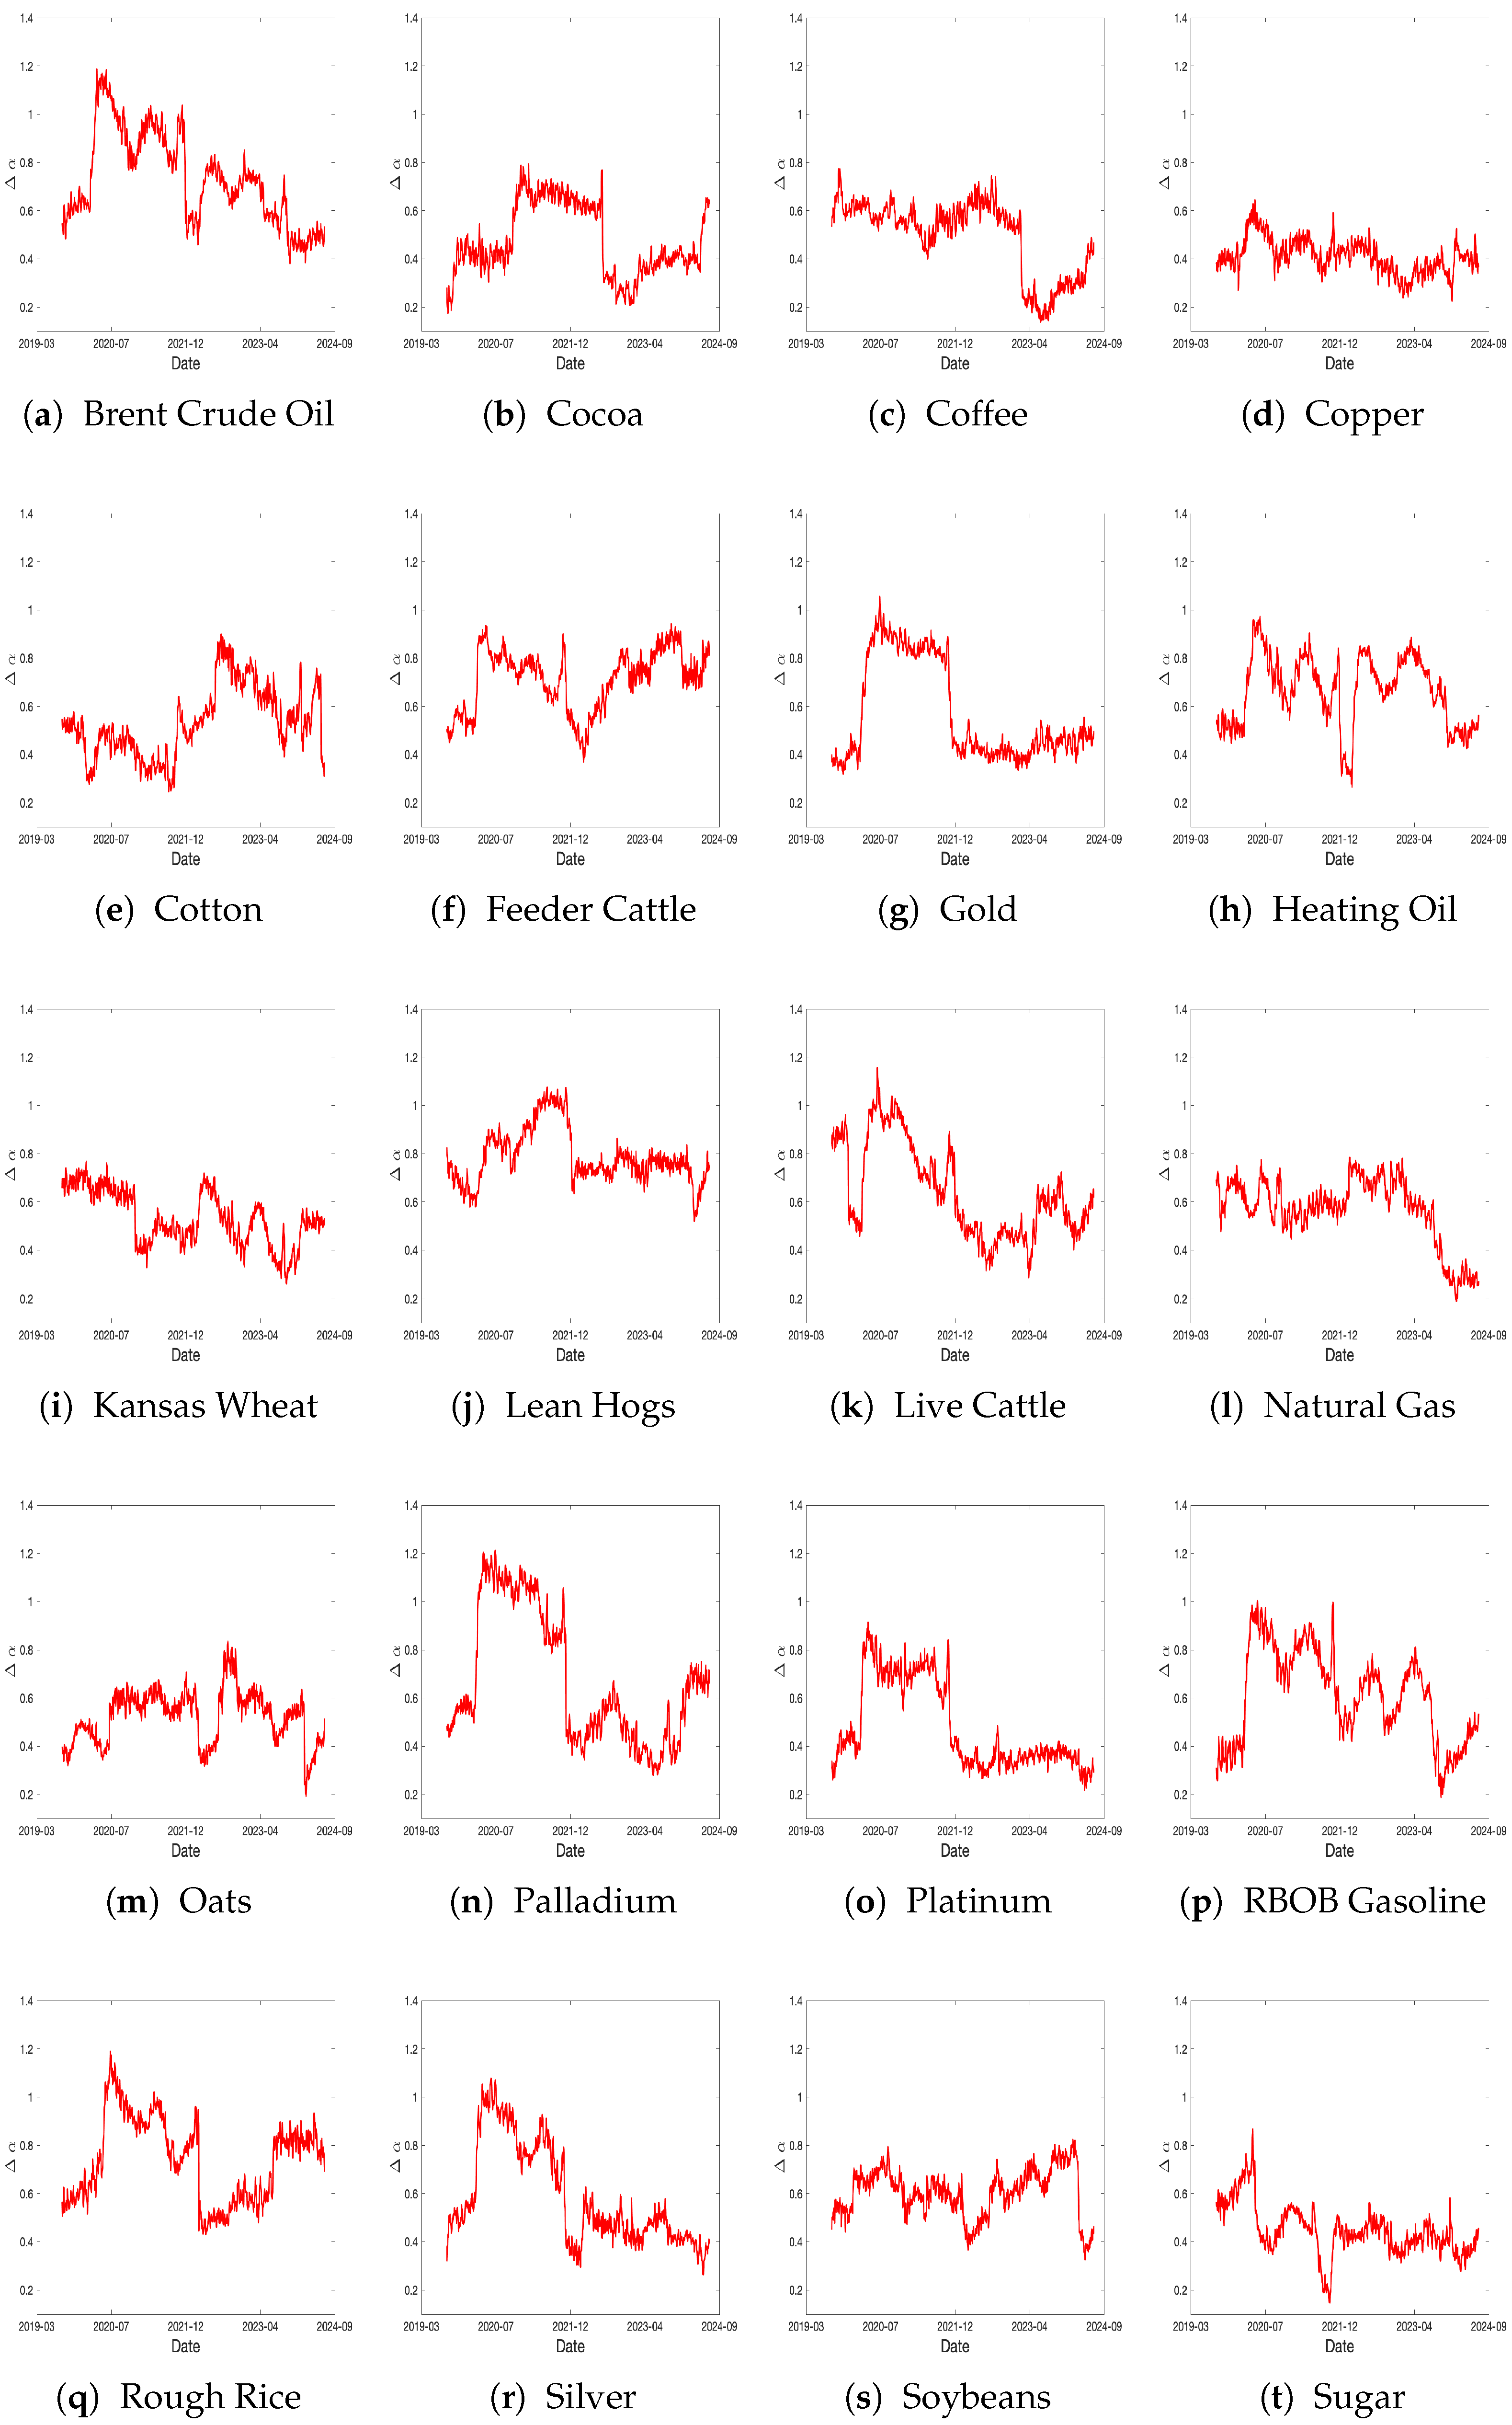
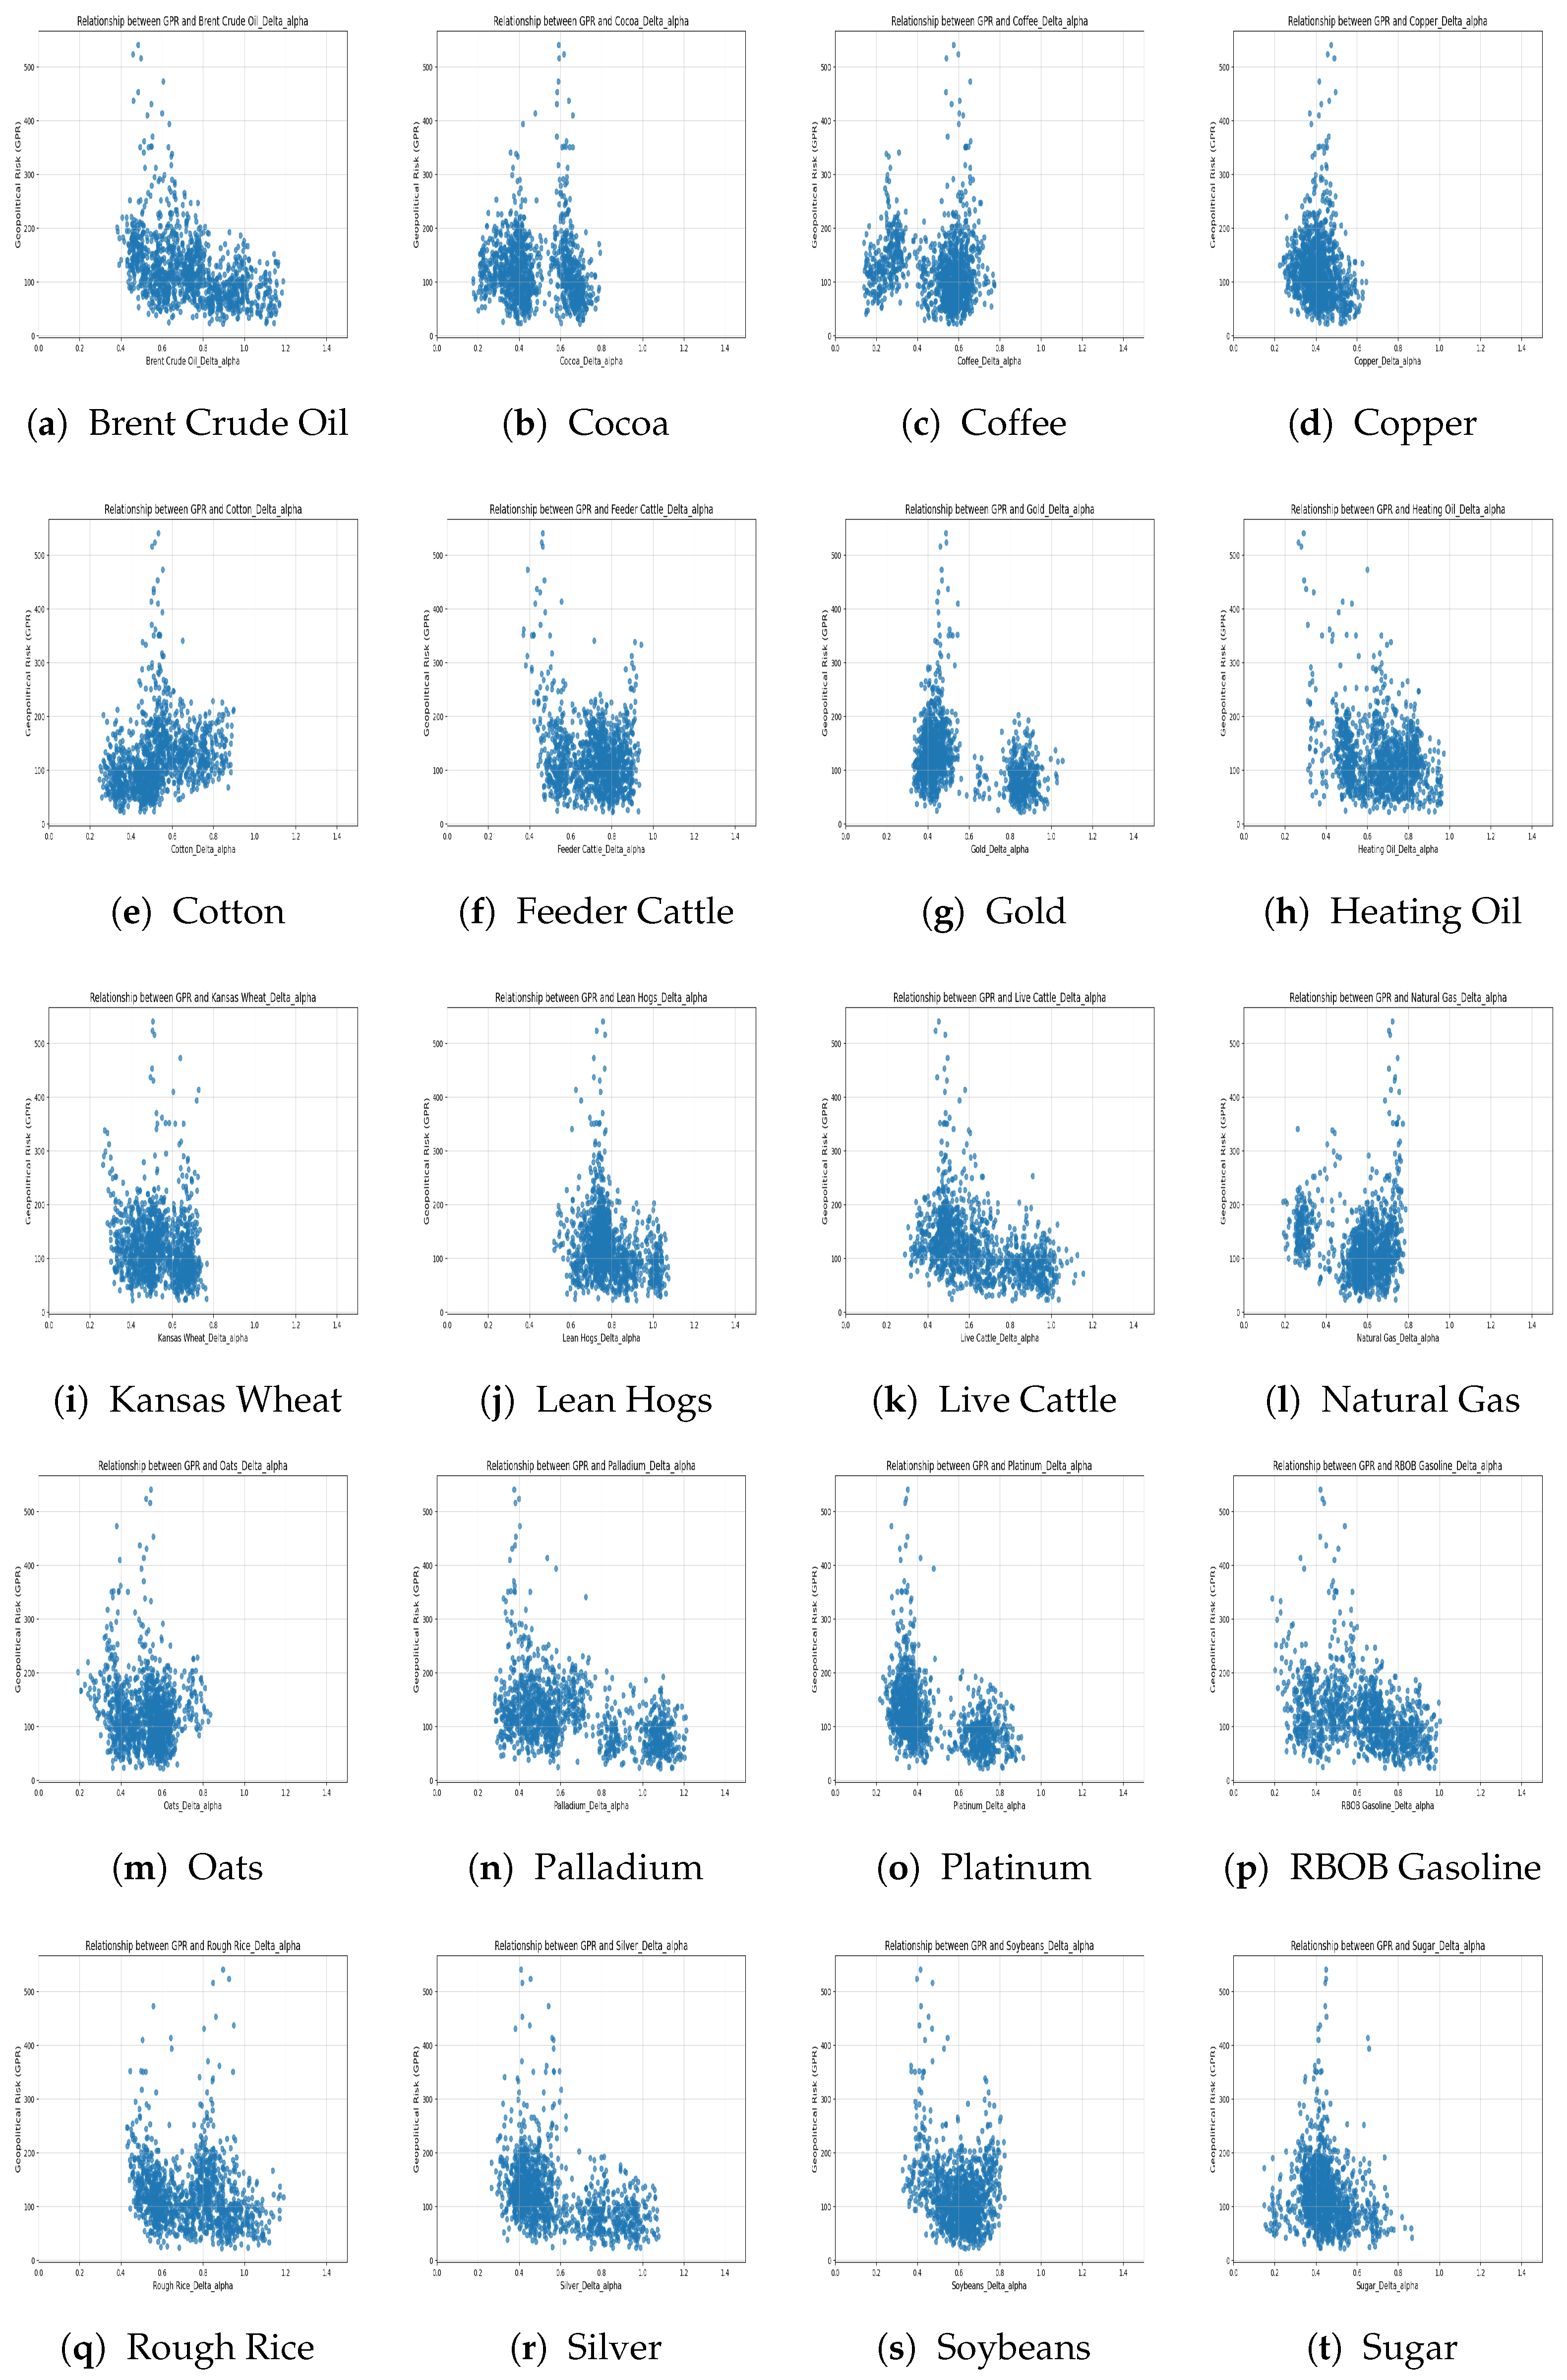
4.2. Dynamic Market Efficiency
4.3. Granger Causality
5. Discussion and Concluding Remarks
Author Contributions
Funding
Data Availability Statement
Acknowledgments
Conflicts of Interest
References
- Li, X.; Li, B.; Wei, G.; Bai, L.; Wei, Y.; Liang, C. Return connectedness among commodity and financial assets during the COVID-19 pandemic: Evidence from China and the US. Resour. Policy 2021, 73, 102166. [Google Scholar] [CrossRef] [PubMed]
- Lo, G.D.; Marcelin, I.; Bassène, T.; Sène, B. The Russo-Ukrainian war and financial markets: The role of dependence on Russian commodities. Financ. Res. Lett. 2022, 50, 103194. [Google Scholar] [CrossRef]
- Fama, E.F. Efficient capital markets. J. Financ. 1970, 25, 383–417. [Google Scholar] [CrossRef]
- Rizvi, S.A.R.; Arshad, S. Investigating the efficiency of East Asian stock markets through booms and busts. Pac. Sci. Rev. 2014, 16, 275–279. [Google Scholar] [CrossRef]
- Anagnostidis, P.; Varsakelis, C.; Emmanouilides, C.J. Has the 2008 financial crisis affected stock market efficiency? The case of Eurozone. Phys. A Stat. Mech. Its Appl. 2016, 447, 116–128. [Google Scholar] [CrossRef]
- Arshad, S.; Rizvi, S.A.R.; Ghani, G.M.; Duasa, J. Investigating stock market efficiency: A look at OIC member countries. Res. Int. Bus. Financ. 2016, 36, 402–413. [Google Scholar] [CrossRef]
- Han, C.; Wang, Y.; Xu, Y. Efficiency and multifractality analysis of the Chinese stock market: Evidence from stock indices before and after the 2015 stock market crash. Sustainability 2019, 11, 1699. [Google Scholar] [CrossRef]
- Alvarez-Ramirez, J.; Alvarez, J.; Solis, R. Crude oil market efficiency and modeling: Insights from the multiscaling autocorrelation pattern. Energy Econ. 2010, 32, 993–1000. [Google Scholar] [CrossRef]
- Mensi, W.; Aloui, C.; Hamdi, M.; Nguyen, D.K. Crude oil market efficiency: An empirical investigation via the Shannon entropy. Écon. Int. 2012, 129, 119–137. [Google Scholar]
- Mensi, W.; Beljid, M.; Managi, S. Structural breaks and the time-varying levels of weak-form efficiency in crude oil markets: Evidence from the Hurst exponent and Shannon entropy methods. Int. Econ. 2014, 140, 89–106. [Google Scholar] [CrossRef]
- Gu, R.; Zhang, B. Is efficiency of crude oil market affected by multifractality? Evidence from the WTI crude oil market. Energy Econ. 2016, 53, 151–158. [Google Scholar] [CrossRef]
- McKenzie, A.M.; Holt, M.T. Market efficiency in agricultural futures markets. Appl. Econ. 2002, 34, 1519–1532. [Google Scholar] [CrossRef]
- Fernandez, V. Commodity futures and market efficiency: A fractional integrated approach. Resour. Policy 2010, 35, 276–282. [Google Scholar] [CrossRef]
- Adhikari, R.; Putnam, K.J. Comovement in the commodity futures markets: An analysis of the energy, grains, and livestock sectors. J. Commod. Mark. 2020, 18, 100090. [Google Scholar] [CrossRef]
- Wei, W.C. Liquidity and market efficiency in cryptocurrencies. Econ. Lett. 2018, 168, 21–24. [Google Scholar] [CrossRef]
- Zhang, Y.; Chan, S.; Chu, J.; Sulieman, H. On the market efficiency and liquidity of high-frequency cryptocurrencies in a bull and bear market. J. Risk Financ. Manag. 2020, 13, 8. [Google Scholar] [CrossRef]
- Kakinaka, S.; Umeno, K. Cryptocurrency market efficiency in short-and long-term horizons during COVID-19: An asymmetric multifractal analysis approach. Financ. Res. Lett. 2022, 46, 102319. [Google Scholar] [CrossRef]
- Likitratcharoen, D.; Chudasring, P.; Pinmanee, C.; Wiwattanalamphong, K. The efficiency of value-at-risk models during extreme market stress in cryptocurrencies. Sustainability 2023, 15, 4395. [Google Scholar] [CrossRef]
- Zhang, Y.J.; Wei, Y.M. The crude oil market and the gold market: Evidence for cointegration, causality and price discovery. Resour. Policy 2010, 35, 168–177. [Google Scholar] [CrossRef]
- Du, X.; Cindy, L.Y.; Hayes, D.J. Speculation and volatility spillover in the crude oil and agricultural commodity markets: A Bayesian analysis. Energy Econ. 2011, 33, 497–503. [Google Scholar] [CrossRef]
- Ji, Q.; Fan, Y. How does oil price volatility affect non-energy commodity markets? Appl. Energy 2012, 89, 273–280. [Google Scholar] [CrossRef]
- Jadidzadeh, A.; Serletis, A. The global crude oil market and biofuel agricultural commodity prices. J. Econ. Asymmetries 2018, 18, e00094. [Google Scholar] [CrossRef]
- Dahl, R.E.; Oglend, A.; Yahya, M. Dynamics of volatility spillover in commodity markets: Linking crude oil to agriculture. J. Commod. Mark. 2020, 20, 100111. [Google Scholar] [CrossRef]
- Balcilar, M.; Gabauer, D.; Umar, Z. Crude Oil futures contracts and commodity markets: New evidence from a TVP-VAR extended joint connectedness approach. Resour. Policy 2021, 73, 102219. [Google Scholar] [CrossRef]
- Sun, Y.; Mirza, N.; Qadeer, A.; Hsueh, H.P. Connectedness between oil and agricultural commodity prices during tranquil and volatile period. Is crude oil a victim indeed? Resour. Policy 2021, 72, 102131. [Google Scholar] [CrossRef]
- Okhrin, Y.; Uddin, G.S.; Yahya, M. Nonlinear and asymmetric interconnectedness of crude oil with financial and commodity markets. Energy Econ. 2023, 125, 106853. [Google Scholar] [CrossRef]
- Li, H.; Huang, X.; Guo, L. Extreme risk dependence and time-varying spillover between crude oil, commodity market and inflation in China. Energy Econ. 2023, 127, 107090. [Google Scholar] [CrossRef]
- Bird, P.J. Commodities as a hedge against inflation. Appl. Econ. 1984, 16, 855–867. [Google Scholar] [CrossRef]
- Conlon, T.; Lucey, B.M.; Uddin, G.S. Is gold a hedge against inflation? A wavelet time-scale perspective. Rev. Quant. Financ. Account. 2018, 51, 317–345. [Google Scholar] [CrossRef]
- Liu, C.; Zhang, X.; Zhou, Z. Are commodity futures a hedge against inflation? A Markov-switching approach. Int. Rev. Financ. Anal. 2023, 86, 102492. [Google Scholar] [CrossRef]
- Di Matteo, T.; Aste, T.; Dacorogna, M.M. Long-term memories of developed and emerging markets: Using the scaling analysis to characterize their stage of development. J. Bank. Financ. 2005, 29, 827–851. [Google Scholar] [CrossRef]
- Zunino, L.; Tabak, B.M.; Figliola, A.; Pérez, D.G.; Garavaglia, M.; Rosso, O.A. A multifractal approach for stock market inefficiency. Phys. A Stat. Mech. Its Appl. 2008, 387, 6558–6566. [Google Scholar] [CrossRef]
- Kristoufek, L.; Vosvrda, M. Measuring capital market efficiency: Global and local correlations structure. Phys. A Stat. Mech. Its Appl. 2013, 392, 184–193. [Google Scholar] [CrossRef]
- Mali, P.; Mukhopadhyay, A. Multifractal characterization of gold market: A multifractal detrended fluctuation analysis. Phys. A Stat. Mech. Its Appl. 2014, 413, 361–372. [Google Scholar] [CrossRef]
- Al-Yahyaee, K.H.; Mensi, W.; Yoon, S.M. Efficiency, multifractality, and the long-memory property of the Bitcoin market: A comparative analysis with stock, currency, and gold markets. Financ. Res. Lett. 2018, 27, 228–234. [Google Scholar] [CrossRef]
- Lahmiri, S.; Bekiros, S. Chaos, randomness and multi-fractality in Bitcoin market. Chaos Solitons Fractals 2018, 106, 28–34. [Google Scholar] [CrossRef]
- Cheng, Q.; Liu, X.; Zhu, X. Cryptocurrency momentum effect: DFA and MF-DFA analysis. Phys. A Stat. Mech. Its Appl. 2019, 526, 120847. [Google Scholar] [CrossRef]
- Jiang, Z.Q.; Xie, W.J.; Zhou, W.X.; Sornette, D. Multifractal analysis of financial markets: A review. Rep. Prog. Phys. 2019, 82, 125901. [Google Scholar] [CrossRef]
- Al-Yahyaee, K.H.; Mensi, W.; Ko, H.U.; Yoon, S.M.; Kang, S.H. Why cryptocurrency markets are inefficient: The impact of liquidity and volatility. N. Am. J. Econ. Financ. 2020, 52, 101168. [Google Scholar] [CrossRef]
- Lee, M.J.; Choi, S.Y. Insights into the dynamics of market efficiency spillover of financial assets in different equity markets. Phys. A Stat. Mech. Its Appl. 2024, 641, 129719. [Google Scholar] [CrossRef]
- Dewandaru, G.; Masih, R.; Bacha, O.I.; Masih, A.M.M. Developing trading strategies based on fractal finance: An application of MF-DFA in the context of Islamic equities. Phys. A Stat. Mech. Its Appl. 2015, 438, 223–235. [Google Scholar] [CrossRef]
- Maciel, L. A new approach to portfolio management in the Brazilian equity market: Does assets efficiency level improve performance? Q. Rev. Econ. Financ. 2021, 81, 38–56. [Google Scholar] [CrossRef]
- Ali, S.; Raza, S.A.; Khan, K.A. Asymmetric market efficiency of the Eurozone using the MF-DFA: A comparison between global financial crisis and COVID-19 era. Eur. J. Manag. Bus. Econ. 2023; ahead of print. [Google Scholar] [CrossRef]
- Wang, M.; Zhong, C.; Yue, K.; Zheng, Y.; Jiang, W.; Wang, J. Modified MF-DFA Model Based on LSSVM Fitting. Fractal Fract. 2024, 8, 320. [Google Scholar] [CrossRef]
- Rizvi, S.A.R.; Dewandaru, G.; Bacha, O.I.; Masih, M. An analysis of stock market efficiency: Developed vs Islamic stock markets using MF-DFA. Phys. A Stat. Mech. Its Appl. 2014, 407, 86–99. [Google Scholar] [CrossRef]
- Mensi, W.; Tiwari, A.K.; Yoon, S.M. Global financial crisis and weak-form efficiency of Islamic sectoral stock markets: An MF-DFA analysis. Phys. A Stat. Mech. Its Appl. 2017, 471, 135–146. [Google Scholar] [CrossRef]
- Han, C.; Wang, Y.; Ning, Y. Analysis and comparison of the multifractality and efficiency of Chinese stock market: Evidence from dynamics of major indexes in different boards. Phys. A Stat. Mech. Its Appl. 2019, 528, 121305. [Google Scholar] [CrossRef]
- Ameer, S.; Nor, S.M.; Ali, S.; Zawawi, N.H.M. The Impact of COVID-19 on BRICS and MSCI Emerging Markets Efficiency: Evidence from MF-DFA. Fractal Fract. 2023, 7, 519. [Google Scholar] [CrossRef]
- Naeem, M.A.; Farid, S.; Yousaf, I.; Kang, S.H. Asymmetric efficiency in petroleum markets before and during COVID-19. Resour. Policy 2023, 86, 104194. [Google Scholar] [CrossRef]
- Charles, A.; Darné, O. The efficiency of the crude oil markets: Evidence from variance ratio tests. Energy Policy 2009, 37, 4267–4272. [Google Scholar] [CrossRef]
- Jiang, Z.Q.; Xie, W.J.; Zhou, W.X. Testing the weak-form efficiency of the WTI crude oil futures market. Phys. A Stat. Mech. Its Appl. 2014, 405, 235–244. [Google Scholar] [CrossRef]
- Zhang, B.; Li, X.M.; He, F. Testing the evolution of crude oil market efficiency: Data have the conn. Energy Policy 2014, 68, 39–52. [Google Scholar] [CrossRef]
- Espinosa-Paredes, G.; Rodriguez, E.; Alvarez-Ramirez, J. A singular value decomposition entropy approach to assess the impact of Covid-19 on the informational efficiency of the WTI crude oil market. Chaos Solitons Fractals 2022, 160, 112238. [Google Scholar] [CrossRef]
- Zhu, B.; Tian, C.; Wang, P. Exploring the relationship between Chinese crude oil futures market efficiency and market micro characteristics. Energy Econ. 2024, 134, 107577. [Google Scholar] [CrossRef]
- Kristoufek, L.; Vosvrda, M. Commodity futures and market efficiency. Energy Econ. 2014, 42, 50–57. [Google Scholar] [CrossRef]
- Charles, A.; Darné, O.; Kim, J.H. Will precious metals shine? A market efficiency perspective. Int. Rev. Financ. Anal. 2015, 41, 284–291. [Google Scholar] [CrossRef]
- Mohanty, S.K.; Mishra, S. Regulatory reform and market efficiency: The case of Indian agricultural commodity futures markets. Res. Int. Bus. Financ. 2020, 52, 101145. [Google Scholar] [CrossRef]
- Bohl, M.T.; Pütz, A.; Sulewski, C. Speculation and the informational efficiency of commodity futures markets. J. Commod. Mark. 2021, 23, 100159. [Google Scholar] [CrossRef]
- Li, Z.; Mo, B.; Nie, H. Time and frequency dynamic connectedness between cryptocurrencies and financial assets in China. Int. Rev. Econ. Financ. 2023, 86, 46–57. [Google Scholar] [CrossRef]
- Lee, S.; Choeh, J.Y. Exploring the influence of online word-of-mouth on hotel booking prices: Insights from regression and ensemble-based machine learning methods. Data Sci. Financ. Econ. 2024, 4, 65–82. [Google Scholar] [CrossRef]
- Lee, Y.J.; Kim, N.W.; Choi, K.H.; Yoon, S.M. Analysis of the informational efficiency of the EU carbon emission trading market: Asymmetric MF-DFA approach. Energies 2020, 13, 2171. [Google Scholar] [CrossRef]
- Yao, C.Z.; Mo, Y.N.; Zhang, Z.K. A study of the efficiency of the Chinese clean energy stock market and its correlation with the crude oil market based on an asymmetric multifractal scaling behavior analysis. N. Am. J. Econ. Financ. 2021, 58, 101520. [Google Scholar] [CrossRef]
- Saâdaoui, F. Skewed multifractal scaling of stock markets during the COVID-19 pandemic. Chaos Solitons Fractals 2023, 170, 113372. [Google Scholar] [CrossRef]
- Liu, J. Analyzing the Co-movement of FinTech market efficiency and oil Resource efficiency: An Input-Output study. Resour. Policy 2024, 90, 104668. [Google Scholar] [CrossRef]
- He, L.Y.; Chen, S.P. Are crude oil markets multifractal? Evidence from MF-DFA and MF-SSA perspectives. Phys. A Stat. Mech. Its Appl. 2010, 389, 3218–3229. [Google Scholar] [CrossRef]
- Mensi, W.; Hamdi, A.; Yoon, S.M. Modelling multifractality and efficiency of GCC stock markets using the MF-DFA approach: A comparative analysis of global, regional and Islamic markets. Phys. A Stat. Mech. Its Appl. 2018, 503, 1107–1116. [Google Scholar] [CrossRef]
- Miloş, L.R.; Haţiegan, C.; Miloş, M.C.; Barna, F.M.; Boțoc, C. Multifractal detrended fluctuation analysis (MF-DFA) of stock market indexes. Empirical evidence from seven central and eastern European markets. Sustainability 2020, 12, 535. [Google Scholar] [CrossRef]
- Ock, S.E.; Lee, M.; Song, J.W. Multifractal Analysis of the Impact of Fuel Cell Introduction in the Korean Electricity Market. Fractal Fract. 2024, 8, 573. [Google Scholar] [CrossRef]
- Gao, J.; Wang, J.; Wei, D.; Zeng, B. An innovative decision-making system integrating multifractal analysis and volatility forecasting. Ann. Oper. Res. 2024, 1–43. [Google Scholar] [CrossRef]
- Kantelhardt, J.W.; Zschiegner, S.A.; Koscielny-Bunde, E.; Havlin, S.; Bunde, A.; Stanley, H.E. Multifractal detrended fluctuation analysis of nonstationary time series. Phys. A Stat. Mech. Its Appl. 2002, 316, 87–114. [Google Scholar] [CrossRef]
- Jiang, Z.Q.; Chen, W.; Zhou, W.X. Detrended fluctuation analysis of intertrade durations. Phys. A Stat. Mech. Its Appl. 2009, 388, 433–440. [Google Scholar] [CrossRef]
- Qian, X.Y.; Gu, G.F.; Zhou, W.X. Modified detrended fluctuation analysis based on empirical mode decomposition for the characterization of anti-persistent processes. Phys. A Stat. Mech. Its Appl. 2011, 390, 4388–4395. [Google Scholar] [CrossRef]
- Lashermes, B.; Abry, P.; Chainais, P. New insights into the estimation of scaling exponents. Int. J. Wavelets Multiresolution Inf. Process. 2004, 2, 497–523. [Google Scholar] [CrossRef]
- Ning, Y.; Wang, Y.; Su, C.w. How did China’s foreign exchange reform affect the efficiency of foreign exchange market? Phys. A Stat. Mech. Its Appl. 2017, 483, 219–226. [Google Scholar] [CrossRef]
- Calvet, L.; Fisher, A. Multifractality in asset returns: Theory and evidence. Rev. Econ. Stat. 2002, 84, 381–406. [Google Scholar] [CrossRef]
- Wang, Y.; Wu, C.; Pan, Z. Multifractal detrending moving average analysis on the US Dollar exchange rates. Phys. A Stat. Mech. Its Appl. 2011, 390, 3512–3523. [Google Scholar] [CrossRef]
- da Silva Filho, A.C.; Maganini, N.D.; de Almeida, E.F. Multifractal analysis of Bitcoin market. Phys. A Stat. Mech. Its Appl. 2018, 512, 954–967. [Google Scholar] [CrossRef]
- Ruan, Q.; Zhang, S.; Lv, D.; Lu, X. Financial liberalization and stock market cross-correlation: MF-DCCA analysis based on Shanghai-Hong Kong Stock Connect. Phys. A Stat. Mech. Its Appl. 2018, 491, 779–791. [Google Scholar] [CrossRef]
- Lu, X.; Tian, J.; Zhou, Y.; Li, Z. Multifractal detrended fluctuation analysis of the Chinese stock index futures market. Phys. A Stat. Mech. Its Appl. 2013, 392, 1452–1458. [Google Scholar] [CrossRef]
- Fu, Z.; Niu, H.; Wang, W. Market efficiency and cross-correlations of Chinese new energy market with other assets: Evidence from multifractality analysis. Comput. Econ. 2023, 62, 1287–1311. [Google Scholar] [CrossRef]
- Li, S.; Zhang, W.; Zhang, W. Dynamic time-frequency connectedness and risk spillover between geopolitical risks and natural resources. Resour. Policy 2023, 82, 103554. [Google Scholar] [CrossRef]
- Zhao, J. Time-varying impact of geopolitical risk on natural resources prices: Evidence from the hybrid TVP-VAR model with large system. Resour. Policy 2023, 82, 103467. [Google Scholar] [CrossRef]
- Ishikawa-Ishiwata, Y.; Furuya, J. Fungicide cost reduction with soybean rust-resistant cultivars in Paraguay: A supply and demand approach. Sustainability 2021, 13, 887. [Google Scholar] [CrossRef]
- Bosch, D.; Smimou, K. Traders’ motivation and hedging pressure in commodity futures markets. Res. Int. Bus. Financ. 2022, 59, 101529. [Google Scholar] [CrossRef]
- Zhang, L.; Chen, T.; Yang, J.; Cai, Z.; Sheng, H.; Yuan, Z.; Wu, H. Characterizing copper flows in international trade of China, 1975–2015. Sci. Total Environ. 2017, 601, 1238–1246. [Google Scholar] [CrossRef]
- Caldara, D.; Iacoviello, M. Measuring geopolitical risk. Am. Econ. Rev. 2022, 112, 1194–1225. [Google Scholar] [CrossRef]
- Plakandaras, V.; Gogas, P.; Papadimitriou, T. The effects of geopolitical uncertainty in forecasting financial markets: A machine learning approach. Algorithms 2018, 12, 1. [Google Scholar] [CrossRef]
- Alqahtani, A.; Bouri, E.; Vo, X.V. Predictability of GCC stock returns: The role of geopolitical risk and crude oil returns. Econ. Anal. Policy 2020, 68, 239–249. [Google Scholar] [CrossRef]
- Elsayed, A.H.; Helmi, M.H. Volatility transmission and spillover dynamics across financial markets: The role of geopolitical risk. Ann. Oper. Res. 2021, 305, 1–22. [Google Scholar] [CrossRef]
- Umar, Z.; Polat, O.; Choi, S.Y.; Teplova, T. The impact of the Russia-Ukraine conflict on the connectedness of financial markets. Financ. Res. Lett. 2022, 48, 102976. [Google Scholar] [CrossRef]
- Liu, X.; Zhang, X. Geopolitical risk and currency returns. J. Bank. Financ. 2024, 161, 107097. [Google Scholar] [CrossRef]
- Zhang, Z.; He, M.; Zhang, Y.; Wang, Y. Geopolitical risk trends and crude oil price predictability. Energy 2022, 258, 124824. [Google Scholar] [CrossRef]
- Elleby, C.; Domínguez, I.P.; Adenauer, M.; Genovese, G. Impacts of the COVID-19 pandemic on the global agricultural markets. Environ. Resour. Econ. 2020, 76, 1067–1079. [Google Scholar] [CrossRef] [PubMed]
- Ahmed, M.Y.; Sarkodie, S.A. COVID-19 pandemic and economic policy uncertainty regimes affect commodity market volatility. Resour. Policy 2021, 74, 102303. [Google Scholar] [CrossRef]
- Hung, N.T. Oil prices and agricultural commodity markets: Evidence from pre and during COVID-19 outbreak. Resour. Policy 2021, 73, 102236. [Google Scholar] [CrossRef]


| Asset | Brent Crude Oil | Cocoa | Coffee | Copper | Cotton |
| 0.7686 | 0.5229 | 0.5445 | 0.3358 | 0.4944 | |
| Asset | Feeder Cattle | Gold | Heating Oil | Kansas Wheat | Lean Hogs |
| 0.5724 | 0.5091 | 0.5824 | 0.4001 | 0.6863 | |
| Asset | Live Cattle | Natural Gas | Oats | Palladium | Platinum |
| 0.4908 | 0.5403 | 0.541 | 0.7999 | 0.6069 | |
| Asset | RBOB Gasoline | Rough Rice | Silver | Soybeans | Sugar |
| 0.8474 | 0.6604 | 0.6142 | 0.401 | 0.4841 |
| Cause | Effect | F-Statistic | p-Value |
|---|---|---|---|
| BRENT CRUDE OIL | COCOA | 0.20579 | 0.81403 |
| BRENT CRUDE OIL | COFFEE | 0.06075 | 0.94106 |
| BRENT CRUDE OIL | COPPER | 5.34766 | 0.00487 |
| BRENT CRUDE OIL | COTTON | 0.42245 | 0.65554 |
| BRENT CRUDE OIL | FEEDER CATTLE | 2.1287 | 0.11945 |
| BRENT CRUDE OIL | GOLD | 3.32919 | 0.03616 |
| BRENT CRUDE OIL | HEATING OIL | 6.90573 | 0.00104 |
| BRENT CRUDE OIL | KANSAS WHEAT | 1.39097 | 0.24924 |
| BRENT CRUDE OIL | LEAN HOGS | 7.17581 | 0.00080 |
| BRENT CRUDE OIL | LIVE CATTLE | 3.31557 | 0.03665 |
| BRENT CRUDE OIL | NATURAL GAS | 2.13997 | 0.11811 |
| BRENT CRUDE OIL | OATS | 3.68344 | 0.02542 |
| BRENT CRUDE OIL | PALLADIUM | 1.0524 | 0.34942 |
| BRENT CRUDE OIL | PLATINUM | 5.37412 | 0.00475 |
| BRENT CRUDE OIL | RBOB GASOLINE | 17.1459 | 0.000000046 |
| BRENT CRUDE OIL | ROUGH RICE | 5.41588 | 0.00456 |
| BRENT CRUDE OIL | SILVER | 3.70143 | 0.02497 |
| BRENT CRUDE OIL | SOYBEANS | 0.84072 | 0.43166 |
| BRENT CRUDE OIL | SUGAR | 0.29164 | 0.74700 |
| Cause | Effect | F-Statistic | p-Value |
|---|---|---|---|
| COCOA | BRENT CRUDE OIL | 1.98176 | 0.13828 |
| COFFEE | BRENT CRUDE OIL | 6.57874 | 0.00144 |
| COPPER | BRENT CRUDE OIL | 3.11391 | 0.04479 |
| COTTON | BRENT CRUDE OIL | 1.46307 | 0.23194 |
| FEEDER CATTLE | BRENT CRUDE OIL | 0.82367 | 0.43907 |
| GOLD | BRENT CRUDE OIL | 4.98068 | 0.00701 |
| HEATING OIL | BRENT CRUDE OIL | 1.30044 | 0.27280 |
| KANSAS WHEAT | BRENT CRUDE OIL | 2.32782 | 0.09795 |
| LEAN HOGS | BRENT CRUDE OIL | 1.32917 | 0.26509 |
| LIVE CATTLE | BRENT CRUDE OIL | 1.52184 | 0.21874 |
| NATURAL GAS | BRENT CRUDE OIL | 0.72870 | 0.48275 |
| OATS | BRENT CRUDE OIL | 1.44697 | 0.23570 |
| PALLADIUM | BRENT CRUDE OIL | 7.72348 | 0.00046 |
| PLATINUM | BRENT CRUDE OIL | 8.16214 | 0.00030 |
| RBOB GASOLINE | BRENT CRUDE OIL | 6.50198 | 0.00155 |
| ROUGH RICE | BRENT CRUDE OIL | 0.04102 | 0.95981 |
| SILVER | BRENT CRUDE OIL | 13.6859 | 0.0000013 |
| SOYBEANS | BRENT CRUDE OIL | 0.54979 | 0.57722 |
| SUGAR | BRENT CRUDE OIL | 0.84196 | 0.43112 |
Disclaimer/Publisher’s Note: The statements, opinions and data contained in all publications are solely those of the individual author(s) and contributor(s) and not of MDPI and/or the editor(s). MDPI and/or the editor(s) disclaim responsibility for any injury to people or property resulting from any ideas, methods, instructions or products referred to in the content. |
© 2025 by the authors. Licensee MDPI, Basel, Switzerland. This article is an open access article distributed under the terms and conditions of the Creative Commons Attribution (CC BY) license (https://creativecommons.org/licenses/by/4.0/).
Share and Cite
Kim, Y.-S.; Kim, D.-H.; Kim, D.-J.; Choi, S.-Y. Time-Varying Market Efficiency: A Focus on Crude Oil and Commodity Dynamics. Fractal Fract. 2025, 9, 162. https://doi.org/10.3390/fractalfract9030162
Kim Y-S, Kim D-H, Kim D-J, Choi S-Y. Time-Varying Market Efficiency: A Focus on Crude Oil and Commodity Dynamics. Fractal and Fractional. 2025; 9(3):162. https://doi.org/10.3390/fractalfract9030162
Chicago/Turabian StyleKim, Young-Sung, Do-Hyeon Kim, Dong-Jun Kim, and Sun-Yong Choi. 2025. "Time-Varying Market Efficiency: A Focus on Crude Oil and Commodity Dynamics" Fractal and Fractional 9, no. 3: 162. https://doi.org/10.3390/fractalfract9030162
APA StyleKim, Y.-S., Kim, D.-H., Kim, D.-J., & Choi, S.-Y. (2025). Time-Varying Market Efficiency: A Focus on Crude Oil and Commodity Dynamics. Fractal and Fractional, 9(3), 162. https://doi.org/10.3390/fractalfract9030162