
Optimal Coordination of Directional Overcurrent Relays Using an Innovative Fractional-Order Derivative War Algorithm


Abstract
1. Introduction
1.1. Conceptual Foundations and Motivational Frameworks
1.2. Literature Review
1.3. Key Contributions and Research Framework
- •
- Enhancing the mathematical model of the WO algorithm by incorporating FC and fractional derivatives (FDs) to improve its optimization capabilities, particularly its convergence speed.
- •
- Validating the performance of FODWO by solving eleven benchmark functions, incorporating both unimodal and multimodal problems, and evaluating the mean fitness value over a hundred autonomous runs.
- •
- Applying a novel FODWO algorithm to minimalize and improve the cumulative time of operation of DOCRs in standard test systems by altering TDS and PS values.
- •
- Designing the FODWO scheme to reduce the cumulative time of operation of DOCRs in orthodox networks by constraining the PS and TDS within tolerable limits, accounting for various topological and working conditions.
- •
- Developing statistical study plots, such as QQ, ECDF, stairs, and box plots, to assess the accuracy, robustness, and stability of the FODWO across autonomous runs.
2. Problem Formulation for DOCRs
2.1. Synchronization Criterion
- operating time for the primary relays.
- : operating time for the backup relays.
2.2. Bounds for Relay Settings
3. Design Framework
3.1. War Optimization (WO) Algorithm
3.1.1. Random Attack
3.1.2. Attack Strategy
3.1.3. Signaling by Drums
3.1.4. Defense Strategy
3.2. Mathematical Framework of the War Strategy
3.2.1. Fractional Calculus
3.2.2. Enhanced War Optimization Based on Fractional Calculus
Justification for Fractional Calculus in FODWO
- Step 1:
- Population Initialization. Generate an initial population of search agents (soldiers) by randomly creating n agents. Each agent’s dimensionality aligns with the number of controllable variables in the system. This population size is collectively represented by N and is taken as 30 for the algorithm.
- Step 2:
- Fitness Calculation. Assess the performance of each soldier by calculating its fitness value. This is achieved by inputting the agent’s parameters into an objective function designed to quantify total operational time, thereby determining its effectiveness.
- Step 3:
- Attack Strategy. Soldiers move towards the best solution found so far (attack the enemy). This step involves updating the positions of soldiers based on their fitness values
- Step 4:
- Defense Strategy. Soldiers also consider the worst solution found so far (defend against the weakest enemy). This step helps in maintaining diversity in the search space and prevents premature convergence.
- Step 5:
- Update Positions. Update the positions of soldiers using the attack and defense strategies. This involves calculating new positions based on the current best and worst solutions
- Step 6:
- Implement a fractional-order positioning strategy. Refine each soldier’s location by applying an FO update mechanism (refer to Equation (13)), which adjusts their current position relative to their prior coordinates.
- Step 7:
- Establish termination conditions. FODWO algorithm halts execution once a predefined maximum number of iterations is reached. The maximum number of iterations is taken as 200 for the algorithm.
- Step 8:
- Archive optimal outcomes. Determine the control variables for the DOCR problem by selecting the solution with the lowest active total operational time, corresponding to the optimal result identified by the moths or search agents.
- Step 9:
- Comparative analysis. A fair comparison with the state-of-the-art algorithms will be made, based upon the same parameters such as the population size and number of iterations.
- Step 10:
- Perform statistical evaluations. Analyze results from fifty independent runs using ECDF, stairs, QQ, and box plots, to assess performance consistency.
4. Results and Discussion
4.1. Test System 1: IEEE Three-Bus Configuration
4.1.1. Results and Discussions for Test System 1 (IEEE Three-Bus System)
4.1.2. Statistical Evaluation for IEEE Three-Bus Configuration (Test System 1)
4.2. Test System 2: IEEE Eight-Bus Configuration
4.2.1. Results and Discussions for Test System 2 (IEEE Eight-Bus System)
4.2.2. Statistical Evaluation for IEEE Eight-Bus Configuration (Test System 2)
4.3. Test System 3: IEEE Fifteen-Bus Configuration
4.3.1. Results and Discussions for Test System 3 (IEEE Fifteen-Bus System)
4.3.2. Statistical Evaluation for IEEE Fifteen-Bus Configuration (Test System 3)
5. Conclusions
Author Contributions
Funding
Data Availability Statement
Conflicts of Interest
References
- Damborg, M.; Ramaswami, R.; Venkata, S.; Postforoosh, J. Computer aided transmission protection system design part I: Alcorithms. IEEE Trans. Power Appar. Syst. 1984, PAS-103, 51–59. [Google Scholar] [CrossRef]
- Birla, D.; Maheshwari, R.; Gupta, H. A New nonlinear directional overcurrent relay coordination technique, and banes and boons of near-end faults based approach. IEEE Trans. Power Deliv. 2006, 21, 1176–1182. [Google Scholar] [CrossRef]
- Sharifian, H.; Abyaneh, H.A.; Salman, S.K.; Mohammadi, R.; Razavi, F. Determination of the minimum break point set using expert system and genetic algorithm. IEEE Trans. Power Deliv. 2010, 25, 1284–1295. [Google Scholar] [CrossRef]
- Omidi, P.; Abazari, S.; Madani, S.M. Optimal coordination of directional overcurrent relays for microgrids using hybrid interval linear programming-differential evolution. J. Oper. Autom. Power Eng. 2022, 10, 122–133. [Google Scholar]
- Merabet, O.; Bouchahdane, M.; Belmadani, H.; Kheldoun, A.; Eltom, A. Optimal coordination of directional overcurrent relays in complex networks using the Elite marine predators algorithm. Electr. Power Syst. Res. 2023, 221, 109446. [Google Scholar] [CrossRef]
- Sadeghi, M.H.; Dastfan, A.; Damchi, Y. Optimal coordination of directional overcurrent relays in distribution systems with DGs and FCLs considering voltage sag energy index. Electr. Power Syst. Res. 2021, 191, 106884. [Google Scholar] [CrossRef]
- Lu, Y.; Chung, J.-L. Detecting and solving the coordination curve intersection problem of overcurrent relays in subtransmission systems with a new method. Electr. Power Syst. Res. 2013, 95, 19–27. [Google Scholar] [CrossRef]
- Ezzeddine, M.; Kaczmarek, R.; Iftikhar, M. Coordination of directional overcurrent relays using a novel method to select their settings. IET Gener. Transm. Distrib. 2011, 5, 743–750. [Google Scholar] [CrossRef]
- Yu, J.; Kim, C.H.; Rhee, S.B. Oppositional Jaya algorithm with distance-adaptive coefficient in solving directional over current relays coordination problem. IEEE Access 2019, 7, 150729–150742. [Google Scholar] [CrossRef]
- Korashy, A.; Kamel, S.; Youssef, A.-R.; Jurado, F. Hybrid Whale Optimization Algorithm and Grey Wolf Optimizer Algorithm for Optimal Coordination of Directional Overcurrent Relays. Electr. Power Compon. Syst. 2019, 47, 644–658. [Google Scholar] [CrossRef]
- Wadood, A.; Khurshaid, T.; Farkoush, S.G.; Yu, J.; Kim, C.H.; Rhee, S.B. Nature-inspired whale optimization algorithm for optimal coordination of directional overcurrent relays in power systems. Energies 2019, 12, 2297. [Google Scholar] [CrossRef]
- Yu, J.; Kim, C.-H.; Rhee, S.-B. The Comparison of Lately Proposed Harris Hawks Optimization and Jaya Optimization in Solving Directional Overcurrent Relays Coordination Problem. Complexity 2020, 2020, 3807653. [Google Scholar] [CrossRef]
- Bhattacharya, S.K.; Goswami, S.K. Distribution network reconfiguration considering protection coordination constraints. Electr. Power Compon. Syst. 2008, 36, 1150–1165. [Google Scholar] [CrossRef]
- Abyaneh, H.; Al-Dabbagh, M.; Karegar, H.; Sadeghi, S.; Khan, R. A new optimal approach for coordination of overcurrent relays in interconnected power systems. IEEE Trans. Power Deliv. 2003, 18, 430–435. [Google Scholar] [CrossRef]
- Bedekar, P.P.; Bhide, S.R. Optimum coordination of directional overcurrent relays using the hybrid GA-NLP approach. IEEE Trans. Power Deliv. 2010, 26, 109–119. [Google Scholar] [CrossRef]
- Noghabi, A.S.; Sadeh, J.; Mashhadi, H.R. Considering different network topologies in optimal overcurrent relay coordination using a hybrid GA. IEEE Trans. Power Deliv. 2009, 24, 1857–1863. [Google Scholar] [CrossRef]
- Urdaneta, A.; Perez, L.; Restrepo, H. Optimal coordination of directional overcurrent relays considering dynamic changes in the network topology. IEEE Trans. Power Deliv. 1997, 12, 1458–1464. [Google Scholar] [CrossRef]
- Noghabi, A.S.; Mashhadi, H.R.; Sadeh, J. Optimal coordination of directional overcurrent relays considering different network topologies using interval linear programming. IEEE Trans. Power Deliv. 2010, 25, 1348–1354. [Google Scholar] [CrossRef]
- Najy, W.K.; Zeineldin, H.H.; Woon, W.L. Optimal protection coordination for microgrids with grid-connected and islanded capability. IEEE Trans. Ind. Electron. 2012, 60, 1668–1677. [Google Scholar] [CrossRef]
- Saleh, K.A.; Zeineldin, H.H.; El-Saadany, E.F. Optimal protection coordination for microgrids considering N-1 contingency. IEEE Trans. Ind. Inform. 2017, 13, 2270–2278. [Google Scholar] [CrossRef]
- Saleh, K.A.; Zeineldin, H.H.; Al-Hinai, A.; El-Saadany, E.F. Optimal coordination of directional overcurrent relays using a new time-current-voltage characteristic. IEEE Trans. Power Syst. 2014, 30, 537–544. [Google Scholar] [CrossRef]
- Saleh, K.A.; El-Saadany, E.F.; Al-Hinai, A.; Zeineldin, H.H. Dual-setting characteristic for directional overcurrent relays considering multiple fault locations. IET Gener. Transm. Distrib. 2015, 9, 1332–1340. [Google Scholar] [CrossRef]
- Korashy, A.; Kamel, S.; Alquthami, T.; Jurado, F. Optimal coordination of standard and non-standard direction overcurrent relays using an improved moth-flame optimization. IEEE Access 2020, 8, 87378–87392. [Google Scholar] [CrossRef]
- Irfan, M.; Wadood, A.; Khurshaid, T.; Khan, B.M.; Kim, K.C.; Oh, S.R.; Rhee, S.B. An optimized adaptive protection scheme for numerical and directional overcurrent relay coordination using Harris hawk optimization. Energies 2021, 14, 5603. [Google Scholar] [CrossRef]
- Amraee, T. Coordination of directional overcurrent relays using seeker algorithm. IEEE Trans. Power Deliv. 2012, 27, 1415–1422. [Google Scholar] [CrossRef]
- Urdaneta, A.; Nadira, R.; Jimenez, L.P. Optimal coordination of directional overcurrent relays in interconnected power systems. IEEE Trans. Power Deliv. 1988, 3, 903–911. [Google Scholar] [CrossRef]
- Wadood, A.; Farkoush, S.G.; Khurshaid, T.; Kim, C.-H.; Yu, J.; Geem, Z.W.; Rhee, S.-B. An optimized protection coordination scheme for the optimal coordination of overcurrent relays using a nature-inspired root tree algorithm. Appl. Sci. 2018, 8, 1664. [Google Scholar] [CrossRef]
- Wadood, A.; Khurshaid, T.; Farkoush, S.G.; Kim, C.H.; Rhee, S.B. A bio-inspired rooted tree algorithm for optimal coordination of overcurrent relays. In International Conference on Intelligent Technologies and Applications; Springer: Singapore, 2018; pp. 188–201. [Google Scholar]
- Assouak, A.; Benabid, R.; Ladjici, A.A. Optimal coordination of directional overcurrent relays with non-standard multi-characteristics for power systems transient instability protection. Electr. Eng. 2022, 104, 3697–3715. [Google Scholar] [CrossRef]
- Korashy, A.; Kamel, S.; Jurado, F. Optimal coordination of directional overcurrent relays and distance relays using different optimization algorithms. Electr. Eng. 2023, 105, 2935–2947. [Google Scholar] [CrossRef]
- Wadood, A.; Kim, C.-H.; Khurshiad, T.; Farkoush, S.G.; Rhee, S.-B. Application of a continuous particle swarm optimization (CPSO) for the optimal coordination of overcurrent relays considering a penalty method. Energies 2018, 11, 869. [Google Scholar] [CrossRef]
- Yang, M.-T.; Liu, A. Applying Hybrid PSO to Optimize Directional Overcurrent Relay Coordination in Variable Network Topologies. J. Appl. Math. 2013, 2013, 879078. [Google Scholar] [CrossRef]
- Habib, K.; Lai, X.; Wadood, A.; Khan, S.; Wang, Y.; Xu, S. An improved technique of Hybridization of PSO for the Optimal Coordination of Directional Overcurrent Protection Relays of IEEE bus system. Energies 2022, 15, 3076. [Google Scholar] [CrossRef]
- Mansour, M.M.; Mekhamer, S.F.; El-Kharbawe, N. A modified particle swarm optimizer for the coordination of directional overcurrent relays. IEEE Trans. Power Deliv. 2007, 22, 1400–1410. [Google Scholar] [CrossRef]
- Thangaraj, R.; Pant, M.; Deep, K. Optimal coordination of over-current relays using modified differential evolution algorithms. Eng. Appl. Artif. Intell. 2010, 23, 820–829. [Google Scholar] [CrossRef]
- Bouchekara, H.; Zellagui, M.; Abido, M.; Bouchekara, H.R.E.-H. Optimal coordination of directional overcurrent relays using a modified electromagnetic field optimization algorithm. Appl. Soft Comput. 2017, 54, 267–283. [Google Scholar] [CrossRef]
- Pil, R.S.; Hazlie, M.; Wong, W.R.; Muhammad, M.A.; Mansor, N.N. Optimal coordination of directional overcurrent relay based on combination of Firefly Algorithm and Linear Programming. Ain Shams Eng. J. 2022, 13, 101777. [Google Scholar]
- Damchi, Y.; Dolatabadi, M.; Mashhadi, H.R.; Sadeh, J. MILP approach for optimal coordination of directional overcurrent relays in interconnected power systems. Electr. Power Syst. Res. 2018, 158, 267–274. [Google Scholar] [CrossRef]
- Oravej, Z.; Ooreh, O.S. Coordination of Distance and Directional Overcurrent Relays using a New Algorithm: Grey Wolf Optimizer. Turk. J. Electr. Eng. Comput. Sci. 2018, 26, 3130–3144. [Google Scholar] [CrossRef]
- Albasri, F.A.; Alroomi, A.R.; Talaq, J.H. Optimal Coordination of directional overcurrent relays using biogeography-based optimization algorithm. IEEE Trans. Power Deliv. 2015, 30, 1810–1820. [Google Scholar] [CrossRef]
- Singh, M.; Panigrahi, B.; Abhyankar, A. Optimal coordination of directional over-current relays using teaching learning-based optimization (TLBO) algorithm. Int. J. Electr. Power Energy Syst. 2013, 50, 33–41. [Google Scholar] [CrossRef]
- El-Hana Bouchekara, H.R.; Zellagui, M.; Abido, M.A. Coordination of directional overcurret relays using the backtracking search algorithm. J. Electr. Syst. 2016, 12, 387–405. [Google Scholar]
- Kalage, A.A.; Ghawghawe, N.D. Optimum coordination of directional overcurrent relays using modified adaptive teaching learning based optimization algorithm. Intell. Ind. Syst. 2016, 2, 55–71. [Google Scholar] [CrossRef]
- Mahari, A.; Seyedi, H. An analytic approach for optimal coordination of overcurrent relays. IET Gener. Transm. Distrib. 2013, 7, 674–680. [Google Scholar] [CrossRef]
- Alipour, M.; Teimourzadeh, S.; Seyedi, H. Improved group search optimization algorithm for coordination of directional overcurrent relays. Swarm Evol. Comput. 2015, 23, 40–49. [Google Scholar] [CrossRef]
- Foqha, T.; Khammash, M.; Alsadi, S.; Omari, O.; Refaat, S.S.; Al-Qawasmi, K.; Elrashidi, A. Optimal coordination of directional overcurrent relays using hybrid firefly–genetic algorithm. Energies 2023, 16, 5328. [Google Scholar] [CrossRef]
- Ghamisi, P.; Couceiro, M.S.; Benediktsson, J.A. A novel feature selection approach based on FODPSO and SVM. IEEE Trans. Geosci. Remote Sens. 2014, 53, 2935–2947. [Google Scholar] [CrossRef]
- Ates, A.; Alagoz, B.B.; Kavuran, G.; Yeroglu, C. Implementation of fractional order filters discretized by modified fractional order darwinian particle swarm optimization. Measurement 2017, 107, 153–164. [Google Scholar] [CrossRef]
- Couceiro, M.S.; Rocha, R.P.; Ferreira, N.F.; Machado, J.T. Introducing the fractional-order Darwinian PSO. Signal, Image and Video Processing 2012, 6, 343–350. [Google Scholar] [CrossRef]
- Shahri, E.S.A.; Alfi, A.; Machado, J.T. Fractional fixed-structure H∞ controller design using augmented Lagrangian particle swarm optimization with fractional order velocity. Appl. Soft Comput. 2019, 77, 688–695. [Google Scholar] [CrossRef]
- Machado, J.T.; Kiryakova, V. The chronicles of fractional calculus. Fract. Calc. Appl. Anal. 2017, 20, 307–336. [Google Scholar] [CrossRef]
- Fan, Q.; Ma, Y.; Wang, P.; Bai, F. Otsu Image Segmentation Based on a Fractional Order Moth–Flame Optimization Algorithm. Fractal Fract. 2024, 8, 87. [Google Scholar] [CrossRef]
- Zhu, Q.; Yuan, M.; Liu, Y.L.; Chen, W.D.; Chen, Y.; Wang, H.R. Research and application on fractional-order Darwinian PSO based adaptive extended Kalman filtering algorithm. IAES Int. J. Robot. Autom. 2014, 3, 245. [Google Scholar] [CrossRef]
- Kuttomparambil Abdulkhader, H.; Jacob, J.; Mathew, A.T. Fractional-order lead-lag compensator-based multi-band power system stabiliser design using a hybrid dynamic GA-PSO algorithm. IET Gener. Transm. Distrib. 2018, 12, 3248–3260. [Google Scholar] [CrossRef]
- Kosari, M.; Teshnehlab, M. Non-linear fractional-order chaotic systems identification with approximated fractional-order derivative based on a hybrid particle swarm optimization-genetic algorithm method. J. AI Data Min. 2018, 6, 365–373. [Google Scholar]
- Khan, B.S.; Qamar, A.; Wadood, A.; Almuhanna, K.; Al-Shamma, A.A. Integrating economic load dispatch information into the blockchain smart contracts based on the fractional-order swarming optimizer. Front. Energy Res. 2024, 12, 1350076. [Google Scholar] [CrossRef]
- Muhammad, Y.; Raja, M.A.Z.; Shah, M.A.A.; Awan, S.E.; Ullah, F.; Chaudhary, N.I.; Cheema, K.M.; Milyani, A.H.; Shu, C.M. Optimal coordination of directional overcurrent relays using hybrid fractional computing with gravitational search strategy. Energy Rep. 2021, 7, 7504–7519. [Google Scholar] [CrossRef]
- Muhammad, Y.; Akhtar, R.; Khan, R.; Ullah, F.; Raja, M.A.Z.; Machado, J.T. Design of fractional evolutionary processing for reactive power planning with FACTS devices. Sci. Rep. 2021, 11, 593. [Google Scholar] [CrossRef]
- Ayyarao, T.S.; Ramakrishna, N.S.S.; Elavarasan, R.M.; Polumahanthi, N.; Rambabu, M.; Saini, G.; Alatas, B. War strategy optimization algorithm: A new effective metaheuristic algorithm for global optimization. IEEE Access 2022, 10, 25073–25105. [Google Scholar] [CrossRef]
- Khan, B.M.; Wadood, A.; Khan, S.; Ali, H.; Khurshaid, T.; Iqbal, A.; Kim, K.C. Analysis of War Optimization Algorithm in a Multi-Loop Power System Based on Directional Overcurrent Relays. Energies 2024, 17, 5542. [Google Scholar] [CrossRef]
- Teodoro, G.S.; Machado, J.T.; De Oliveira, E.C. A review of definitions of fractional derivatives and other operators. J. Comput. Phys. 2019, 388, 195–208. [Google Scholar] [CrossRef]
- Sabatier, J.A.T.M.J.; Agrawal, O.P.; Machado, J.T. Advances in Fractional Calculus; Springer: Dordrecht, The Netherlands, 2007; Volume 4, No. 9. [Google Scholar]
- Mirjalili, S. Moth-flame optimization algorithm: A novel nature-inspired heuristic paradigm. Knowl.-Based Syst. 2015, 89, 228–249. [Google Scholar] [CrossRef]


| F(x) | Dim | Moth Flame Opt [63] | Particle Swarm Opt [63] | Gravitational Search Opt [63] | Bat opt [63] | FODWO | |||||
|---|---|---|---|---|---|---|---|---|---|---|---|
| Mean | STD | Mean | STD | Mean | STD | Mean | STD | Mean | STD | ||
| 100 | 0.000117 | 0.00015 | 1.32115 | 1.15388 | 608.232 | 464.654 | 20,792.4 | 5892.40 | 4.23 × 10⁻³⁴ | 4.20 × 10⁻³⁴ | |
| 100 | 0.000639 | 0.000877 | 7.71556 | 4.13212 | 22.7526 | 3.36513 | 89.785 | 41.9577 | 4.02 × 10⁻¹⁷ | 1.80 × 10⁻¹⁷ | |
| 100 | 696.730 | 188.527 | 736.393 | 361.781 | 135,760 | 48,652.6 | 62,481.3 | 29,769.1 | 3.64 × 10⁻³³ | 4.64 × 10⁻³³ | |
| 100 | 70.6864 | 5.27505 | 12.9728 | 2.63443 | 78.7819 | 2.81410 | 49.7432 | 10.1436 | 1.77 × 10⁻¹⁷ | 6.40 × 10⁻¹⁸ | |
| 100 | 139.148 | 120.260 | 77,360.8 | 51,156.15 | 741.003 | 781.239 | 199,512 | 125,238 | 7.3340 | 0.1542 | |
| 100 | 0.00011 | 9.87 × 10⁻⁵ | 286.651 | 107.079 | 3080.96 | 898.635 | 17,053.4 | 4917.56 | 0.1210 | 0.0821 | |
| 100 | 0.09115 | 0.04642 | 1.037316 | 0.310315 | 0.112975 | 0.037607 | 6.045055 | 3.045277 | 2.34 × 10⁻⁴ | 1.73 × 10⁻⁴ | |
| 100 | 8496.78 | 725.873 | 3571 | 430.7989 | 2352.32 | 382.167 | 65535 | 0 | 2.51 × 10³ | 317.3344 | |
| 100 | 84.600 | 16.1665 | 124.29 | 14.2509 | 31.0001 | 13.6605 | 96.2152 | 19.5875 | 0.2530 | 1.9868 | |
| 100 | 1.2603 | 0.72956 | 9.1679 | 1.56898 | 3.74098 | 0.17126 | 15.9460 | 0.77495 | 3.98 × 10⁻¹⁵ | 1.20 × 10⁻¹⁵ | |
| 100 | 0.0190 | 0.02173 | 12.418 | 4.16583 | 0.04978 | 0.04978 | 220.281 | 54.7066 | 0.0055 | 0.0291 | |
| Functions | Dim | FPA [63] | SMS [63] | FA [63] | GA [63] | FODWO | |||||
|---|---|---|---|---|---|---|---|---|---|---|---|
| Mean | STD | Mean | STD | Mean | STD | Mean | STD | Mean | STD | ||
| 100 | 203.638 | 78.3984 | 120 | 0 | 7480.74 | 894.849 | 21,886.0 | 2879.58 | 4.23 × 10⁻³⁴ | 4.20 × 10⁻³⁴ | |
| 100 | 11.1687 | 2.91959 | 0.0205 | 0.00471 | 39.3253 | 2.46586 | 56.5175 | 5.66085 | 4.02 × 10⁻¹⁷ | 1.80 × 10⁻¹⁷ | |
| 100 | 237.56 | 136.6463 | 37820 | 0 | 17357.3 | 1740.11 | 37010.2 | 5572.21 | 3.64 × 10⁻³³ | 4.64 × 10⁻³³ | |
| 100 | 12.5728 | 4 2.29 | 69.1700 | 3.87666 | 33.9535 | 1.86966 | 59.1433 | 4.64852 | 1.77 × 10⁻¹⁷ | 6.40 × 10⁻¹⁸ | |
| 100 | 10,974. | 12,057.2 | 638,224 | 729,967 | 3,795,009 | 75,9030. | 3,132,141 | 5,264,496 | 7.3340 | 0.1542 | |
| 100 | 175.38 | 63.4525 | 41,439. | 3295.23 | 7828.72 | 975.210 | 20,964.8 | 3868.10 | 0.1210 | 0.0821 | |
| 100 | 0.13594 | 0.061212 | 0.04952 | 0.024015 | 1.906313 | 0.460056 | 13.37504 | 3.08149 | 2.34 × 10⁻⁴ | 1.73 × 10⁻⁴ | |
| 100 | −8086.74 | 155.346 | −3942.82 | 404.160 | −3662.05 | 214.163 | −6331.19 | 332.566 | −2.51 × 10³ | 317.3 | |
| 100 | 92.6917 | 14.2239 | 152.844 | 18.5535 | 214.895 | 17.2191 | 236.82 | 19.0335 | 0.2530 | 1.9868 | |
| 100 | 6.84483 | 1.24998 | 19.1325 | 0.23852 | 14.5676 | 0.46751 | 17.8461 | 0.53114 | 3.98 × 10⁻¹⁵ | 1.20 × 10⁻¹⁵ | |
| 100 | 2.7160 | 0.72771 | 420.525 | 25.2561 | 69.6575 | 12.11393 | 179.904 | 32.4395 | 0.0055 | 0.0291 | |
| Common Setting | Default Settings | ||
|---|---|---|---|
| Algorithm | Population Size | Number of Iteration | |
| JAYA | 50 | 100 | Distance-adaptive coefficient: dynamically adjusted during iterations. |
| OJAYA | 50 | 100 | |
| DJAYA | 50 | 100 | |
| LM | 20 | 100 | Constraints: CTI (0.2–0.3 s) |
| GA | 50 | 100 | Crossover probability (Pc): 0.8 Mutation probability (Pm): 0.01 |
| GA-LP | 50 | 100 | |
| PSO | 30 | 1000 | Inertia weight = 0.7 |
| SA | 50 | 500 | Perception value (β): 1.5 to 2 Learning coefficient (α): 0.5 to 1 |
| EFO | 50 | 200 | Perturbation factor: 0.01 to 0.1 |
| TLBO | 20 | 500 | Teaching factor (TF): 1 to 2 |
| MTLBO | 50 | 200 | Mutation or perturbation operators: sometimes added to avoid local minima |
| GA | 20 | 200 | Crossover rate (Pc): 0.6 to 0.9 Mutation rate (Pm): 0.01 to 0.1 |
| FAGA | 50 | 100 | Adaptive crossover rate (Pc): 0.9 to 1.0 Adaptive mutation rate (Pm): 0.1 to 0.3 |
| BBO | 50 | 200 | Migration rate (λ, μ): 0.1 to 1.0 |
| BBO-LP | 50 | 200 | Adaptive migration rate: adjusted dynamically |
| Relay # | WO | Relay # | FODWO | ||
|---|---|---|---|---|---|
| 0.1000 | 2.2766 | 0.1129 | 1.6628 | ||
| 0.1000 | 1.8337 | 0.1001 | 1.5221 | ||
| 0.1001 | 2.0500 | 0.1087 | 1.6128 | ||
| 0.1107 | 1.5108 | 0.1001 | 2.0973 | ||
| 0.1001 | 2.1028 | 0.1000 | 1.6880 | ||
| 0.1001 | 1.8141 | 0.1001 | 1.5219 | ||
| Objective function (s) | 1.4640 | 1.4225 | |||
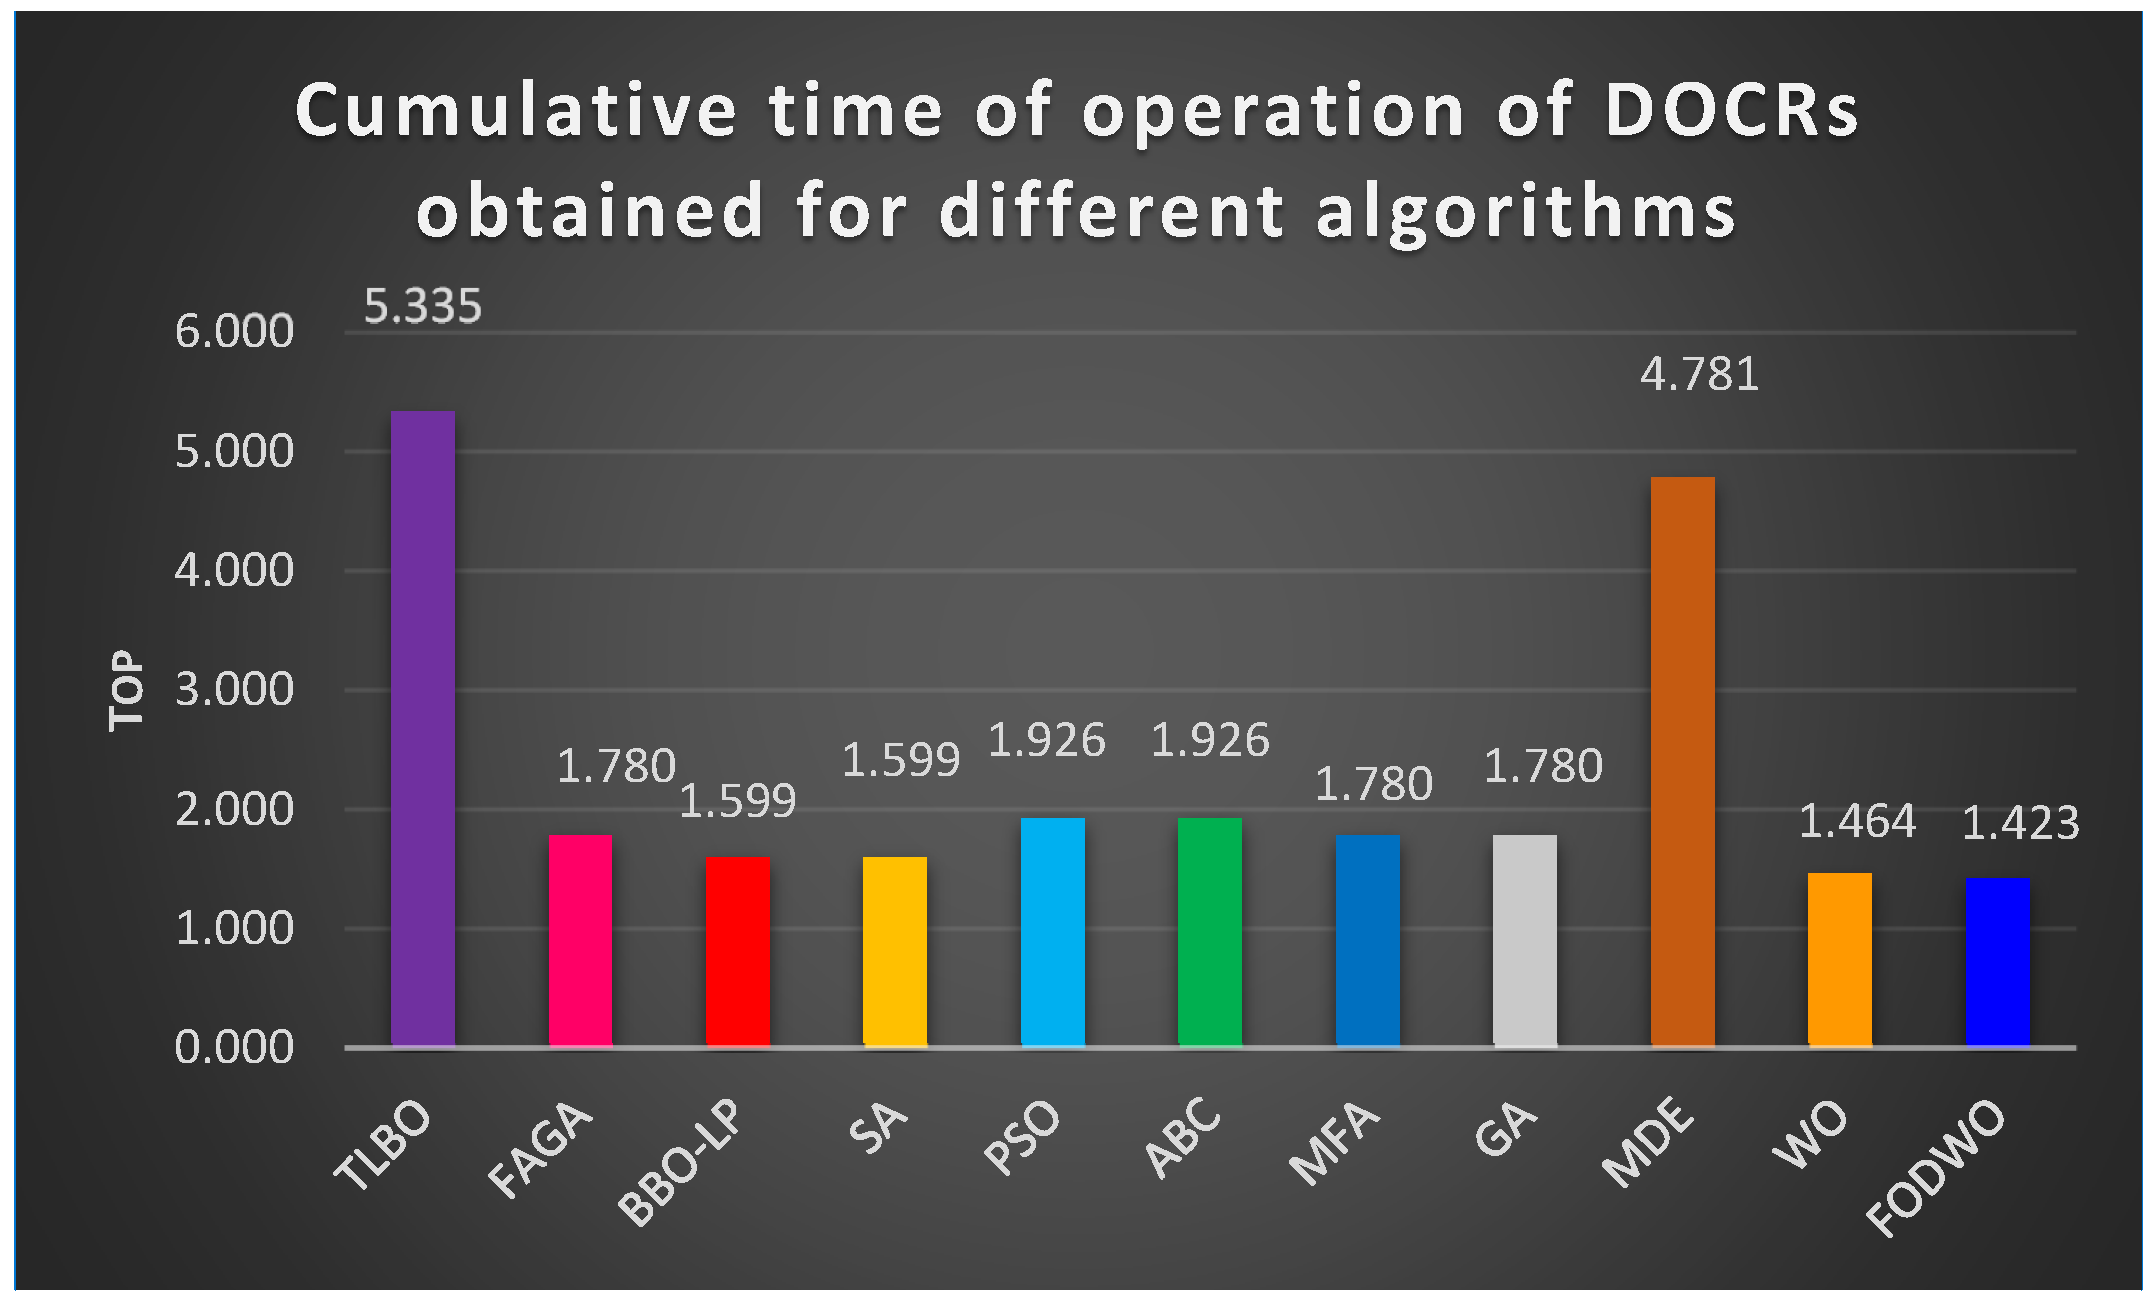
| Algorithm | Objective Function (s) |
|---|---|
| SA [25] | 1.599 |
| PSO [34] | 1.9258 |
| MDE [35] | 4.7806 |
| BBO-LP [40] | 1.59871 |
| TLBO [41] | 5.3349 |
| ABC [46] | 1.9258 |
| FAGA [46] | 1.78039 |
| GA [46] | 1.78047 |
| MFA [46] | 1.78039 |
| WO | 1.4640 |
| FODWO | 1.4225 |
| Relay # | WO | Relay # | FODWO | ||
|---|---|---|---|---|---|
| TDS | PTS | TDS | PTS | ||
| 0.1000 | 2.0434 | 0.1000 | 2.4087 | ||
| 0.2422 | 1.8816 | 0.1834 | 2.3610 | ||
| 0.2326 | 1.6063 | 0.1781 | 2.0070 | ||
| 0.1829 | 1.5224 | 0.1328 | 2.0695 | ||
| 0.1000 | 2.2871 | 0.1103 | 1.5083 | ||
| 0.1732 | 1.6493 | 0.1540 | 2.3034 | ||
| 0.2062 | 2.1902 | 0.1941 | 1.8277 | ||
| 0.1525 | 2.1339 | 0.1731 | 1.6451 | ||
| 0.1098 | 2.1426 | 0.1020 | 2.3769 | ||
| 0.1156 | 2.4385 | 0.1246 | 2.2134 | ||
| 0.1476 | 1.7523 | 0.1473 | 1.8677 | ||
| 0.2110 | 1.5966 | 0.2050 | 1.8461 | ||
| 0.1000 | 2.1756 | 0.1000 | 2.0883 | ||
| 0.1933 | 1.7436 | 0.1790 | 2.1321 | ||
| Objective function (s) | 6.6187 | 6.2711 | |||
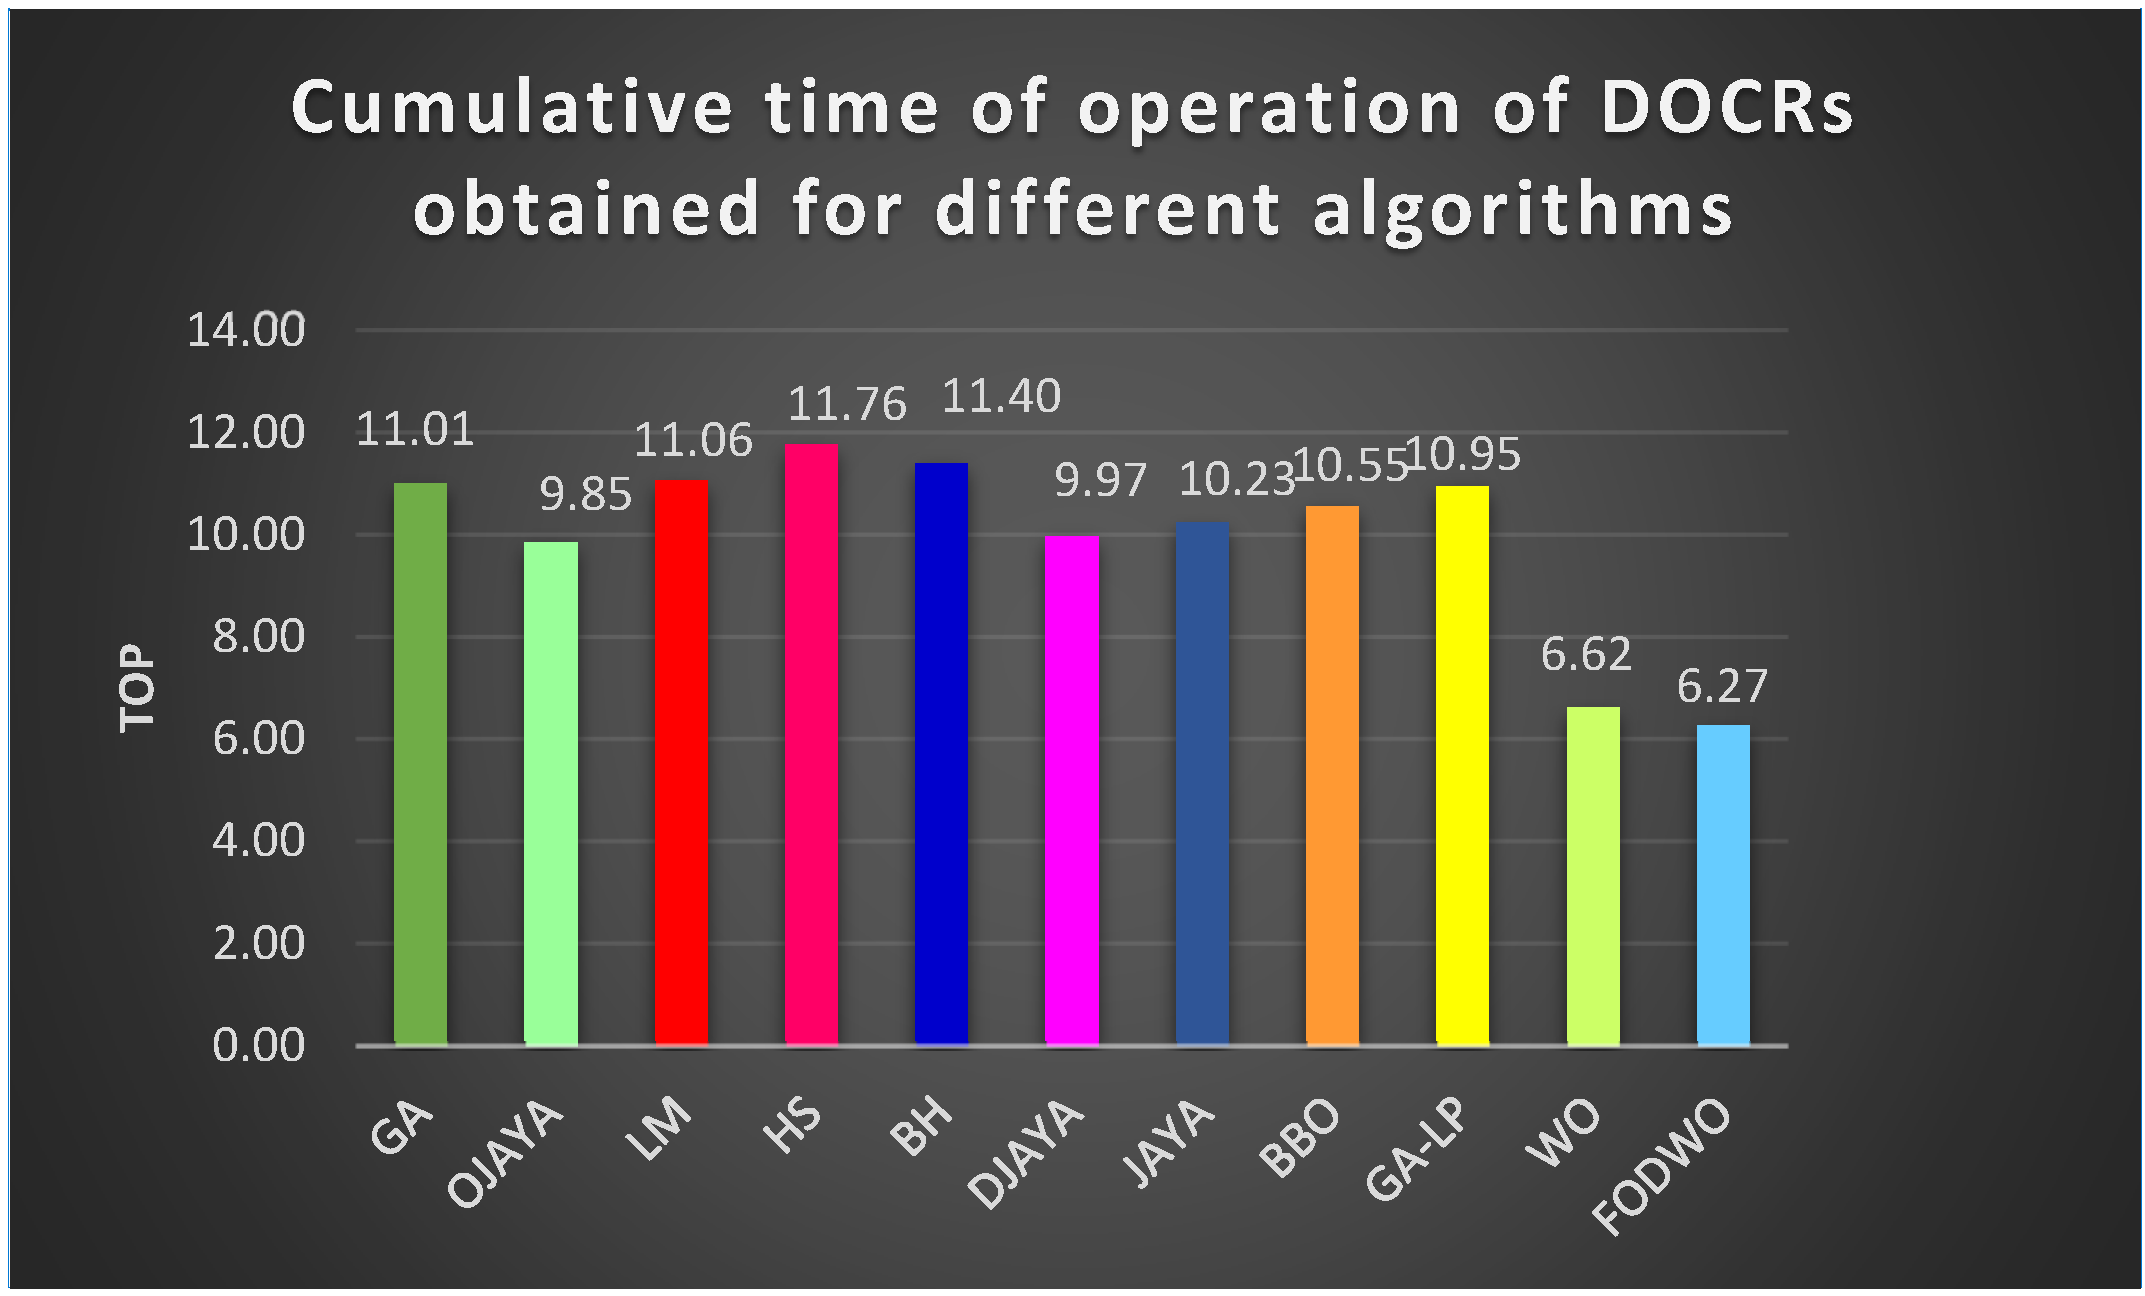
| Method | Objective Function (s) |
|---|---|
| LM [8] | 11.0645 |
| JAYA [9] | 10.2325 |
| DJAYA [9] | 9.9661 |
| OJAYA [9] | 9.8520 |
| GA [16] | 11.001 |
| GA-LP [16] | 10.9499 |
| BH [23] | 11.401 |
| HS [23] | 11.760 |
| BBO [40] | 10.5495 |
| WO | 6.6187 |
| FODWO | 6.2711 |
| Relay # | WO | Relay # | FODWO | ||
|---|---|---|---|---|---|
| TDS | PTS | TDS | PTS | ||
| 0.1000 | 1.9687 | 0.1000 | 1.8511 | ||
| 0.1000 | 2.4115 | 0.1000 | 1.8188 | ||
| 0.1000 | 2.4554 | 0.1001 | 2.2238 | ||
| 0.1000 | 1.7577 | 0.1000 | 2.2376 | ||
| 0.1127 | 2.1764 | 0.1185 | 1.9390 | ||
| 0.1018 | 2.3793 | 0.1023 | 2.3136 | ||
| 0.1326 | 1.6711 | 0.1160 | 2.0299 | ||
| 0.1000 | 2.0865 | 0.1000 | 1.7412 | ||
| 0.1000 | 2.3439 | 0.1091 | 1.8556 | ||
| 0.1225 | 1.5184 | 0.1000 | 2.1254 | ||
| 0.1000 | 2.2989 | 0.1000 | 1.8158 | ||
| 0.1000 | 1.7872 | 0.1067 | 1.5192 | ||
| 0.1072 | 1.5771 | 0.1000 | 2.1449 | ||
| 0.1000 | 2.3759 | 0.1000 | 1.8201 | ||
| 0.1000 | 1.6649 | 0.1000 | 2.1367 | ||
| 0.1000 | 2.1795 | 0.1000 | 2.1672 | ||
| 0.1057 | 1.6571 | 0.1000 | 2.4099 | ||
| 0.1000 | 1.8209 | 0.1000 | 2.1158 | ||
| 0.1081 | 1.8204 | 0.1000 | 2.1009 | ||
| 0.1000 | 2.1216 | 0.1000 | 2.0098 | ||
| 0.1000 | 2.2860 | 0.1000 | 1.7188 | ||
| 0.1000 | 2.2645 | 0.1000 | 1.9796 | ||
| 0.1000 | 2.3577 | 0.1000 | 2.4046 | ||
| 0.1000 | 2.4526 | 0.1000 | 1.8402 | ||
| 0.1137 | 1.8584 | 0.1000 | 2.3607 | ||
| 0.1220 | 1.4983 | 0.1049 | 1.8724 | ||
| 0.1259 | 1.5443 | 0.1213 | 1.6949 | ||
| 0.1529 | 1.5313 | 0.1266 | 2.1286 | ||
| 0.1000 | 1.9518 | 0.1000 | 1.9104 | ||
| 0.1002 | 2.0262 | 0.1010 | 1.9678 | ||
| 0.1000 | 2.4828 | 0.1265 | 1.5080 | ||
| 0.1000 | 2.0277 | 0.1101 | 1.5663 | ||
| 0.1346 | 1.7904 | 0.1204 | 1.9749 | ||
| 0.1622 | 1.5098 | 0.1442 | 1.6224 | ||
| 0.1147 | 1.9840 | 0.1220 | 1.7793 | ||
| 0.1000 | 2.4676 | 0.1000 | 2.0501 | ||
| 0.14863 | 1.5420 | 0.1238 | 2.2221 | ||
| 0.1289 | 2.0262 | 0.1171 | 2.1745 | ||
| 0.1236 | 1.9334 | 0.1443 | 1.6403 | ||
| 0.1162 | 2.3507 | 0.1096 | 2.4088 | ||
| 0.1269 | 2.0351 | 0.1090 | 2.4190 | ||
| 0.1003 | 1.8421 | 0.1000 | 2.3580 | ||
| Objective function (s) 13.5394 | 13.2292 | ||||
Disclaimer/Publisher’s Note: The statements, opinions and data contained in all publications are solely those of the individual author(s) and contributor(s) and not of MDPI and/or the editor(s). MDPI and/or the editor(s) disclaim responsibility for any injury to people or property resulting from any ideas, methods, instructions or products referred to in the content. |
© 2025 by the authors. Licensee MDPI, Basel, Switzerland. This article is an open access article distributed under the terms and conditions of the Creative Commons Attribution (CC BY) license (https://creativecommons.org/licenses/by/4.0/).
Share and Cite
Khan, B.M.; Wadood, A.; Park, H.; Khan, S.; Ali, H. Optimal Coordination of Directional Overcurrent Relays Using an Innovative Fractional-Order Derivative War Algorithm. Fractal Fract. 2025, 9, 169. https://doi.org/10.3390/fractalfract9030169
Khan BM, Wadood A, Park H, Khan S, Ali H. Optimal Coordination of Directional Overcurrent Relays Using an Innovative Fractional-Order Derivative War Algorithm. Fractal and Fractional. 2025; 9(3):169. https://doi.org/10.3390/fractalfract9030169
Chicago/Turabian StyleKhan, Bakht Muhammad, Abdul Wadood, Herie Park, Shahbaz Khan, and Husan Ali. 2025. "Optimal Coordination of Directional Overcurrent Relays Using an Innovative Fractional-Order Derivative War Algorithm" Fractal and Fractional 9, no. 3: 169. https://doi.org/10.3390/fractalfract9030169
APA StyleKhan, B. M., Wadood, A., Park, H., Khan, S., & Ali, H. (2025). Optimal Coordination of Directional Overcurrent Relays Using an Innovative Fractional-Order Derivative War Algorithm. Fractal and Fractional, 9(3), 169. https://doi.org/10.3390/fractalfract9030169