


Experimental Study of Rock Failure and Fractal Characteristics Under True Triaxial Unloading


Abstract
1. Introduction
2. Experimental
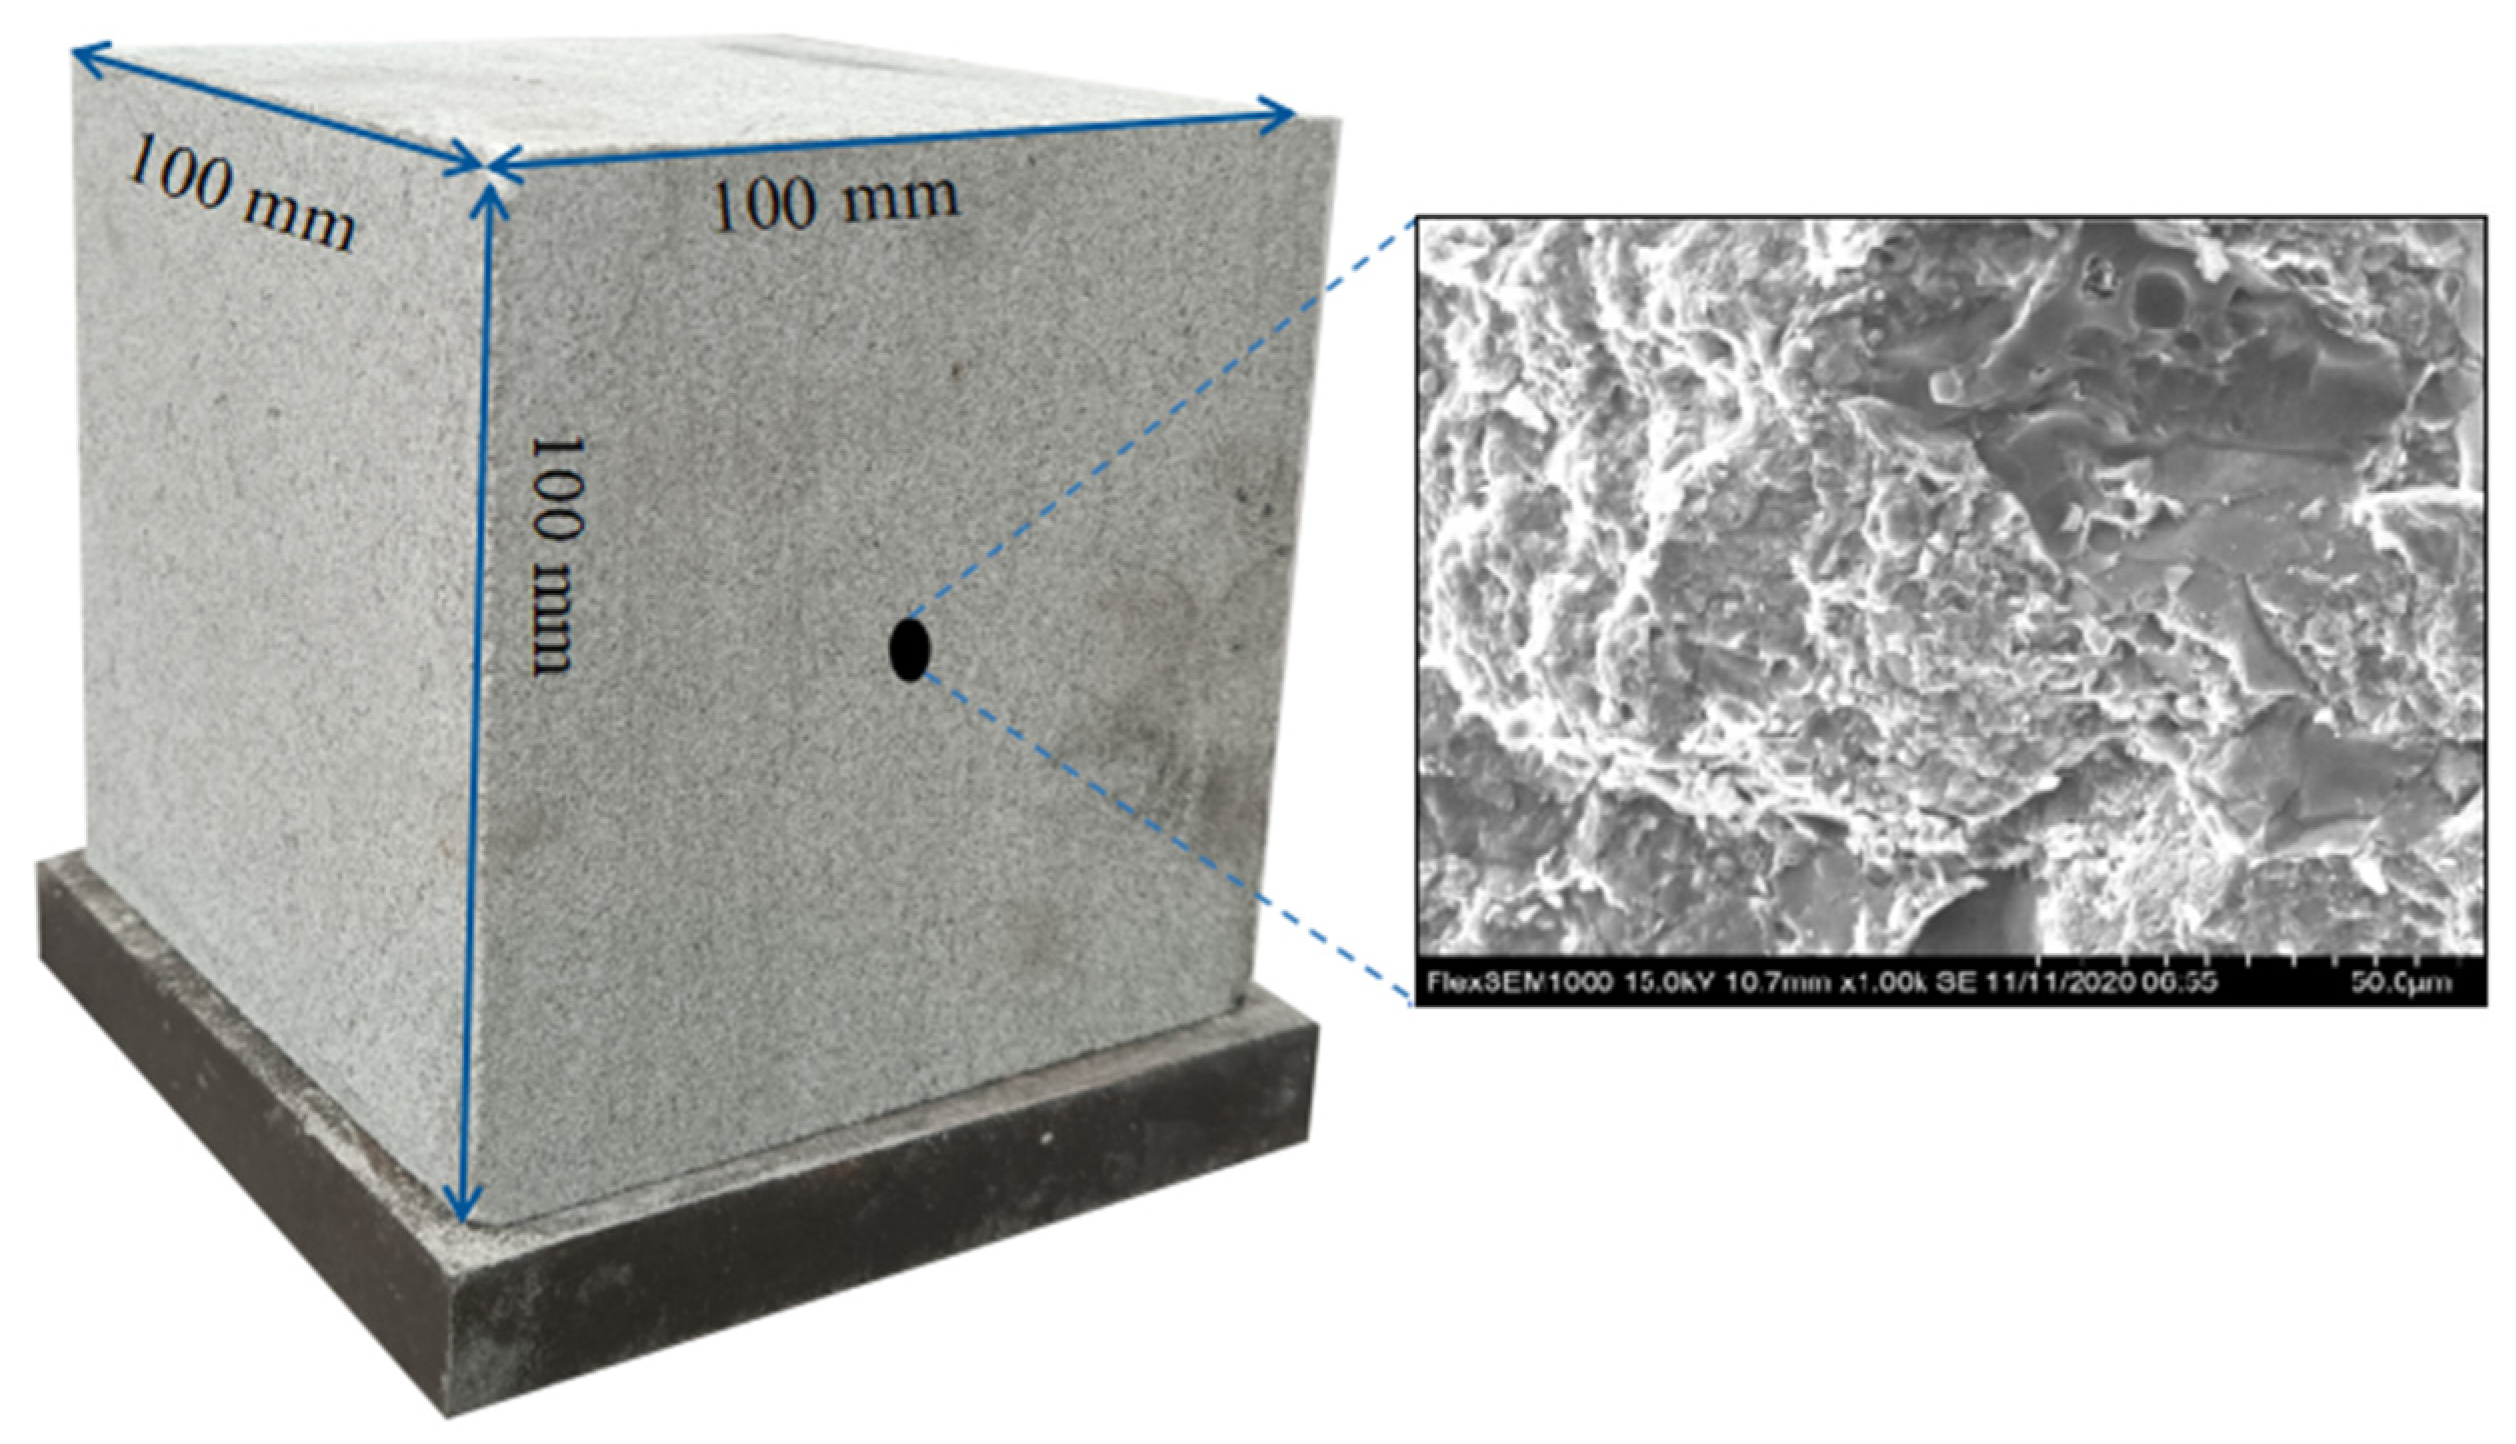
2.1. Rock Sample Collection
2.2. Experimental System
2.3. Load Path for the Tests
3. Experimental Results and Analysis
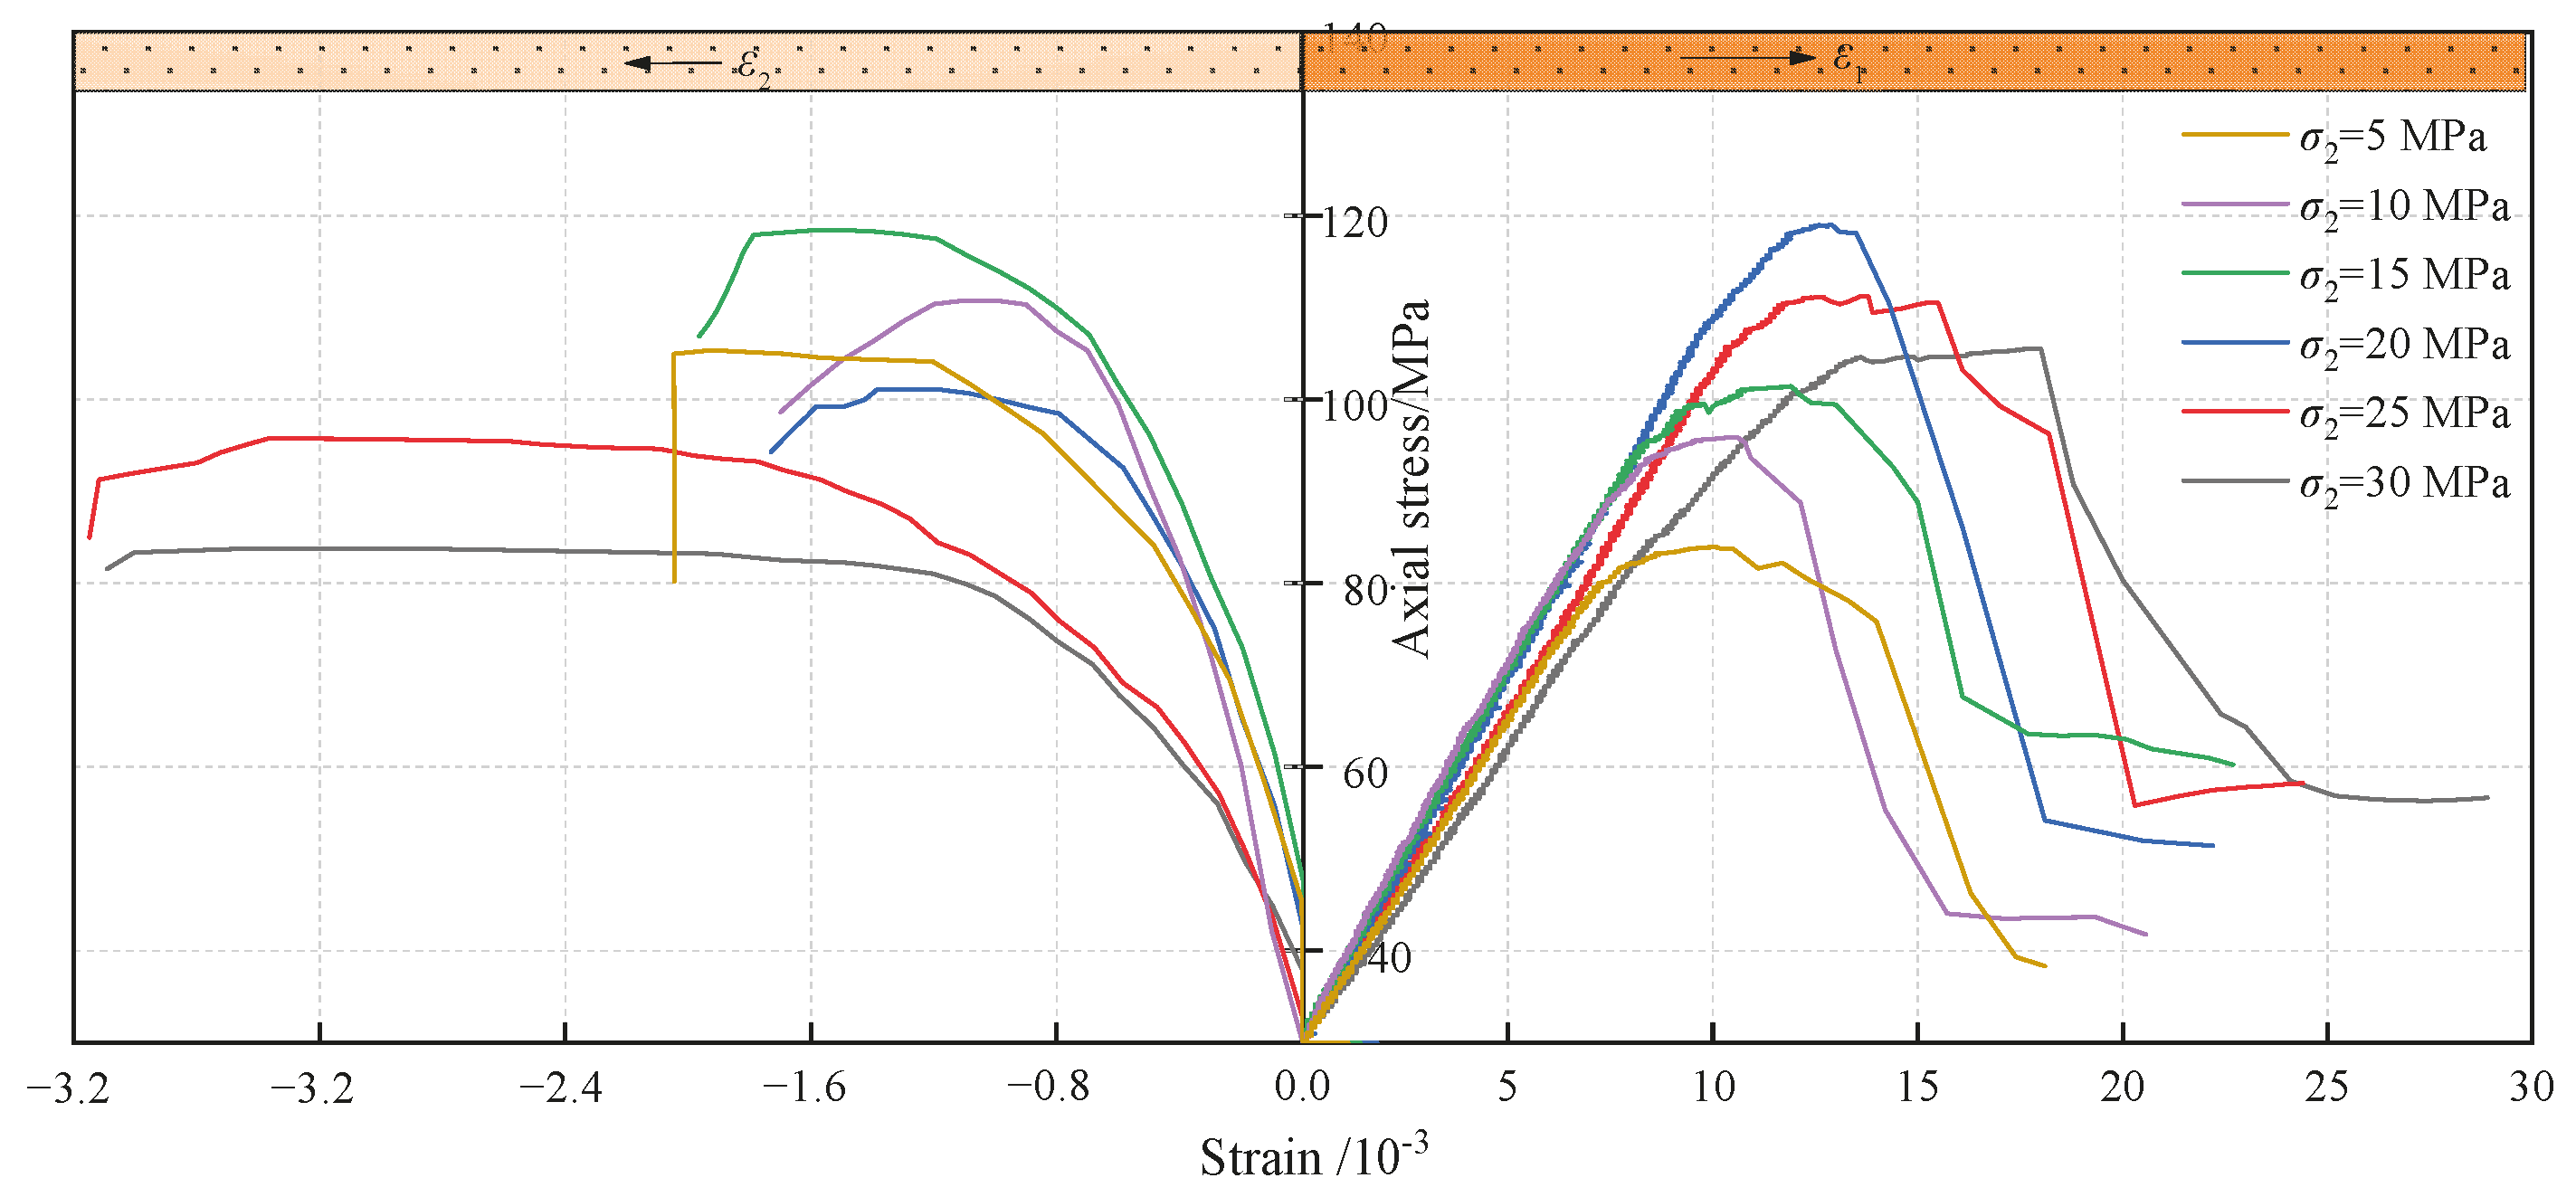
3.1. Mechanical Characteristics of Rocks in True Triaxial Unloading Tests
3.2. Failure Characteristics of Rocks Under Unloading
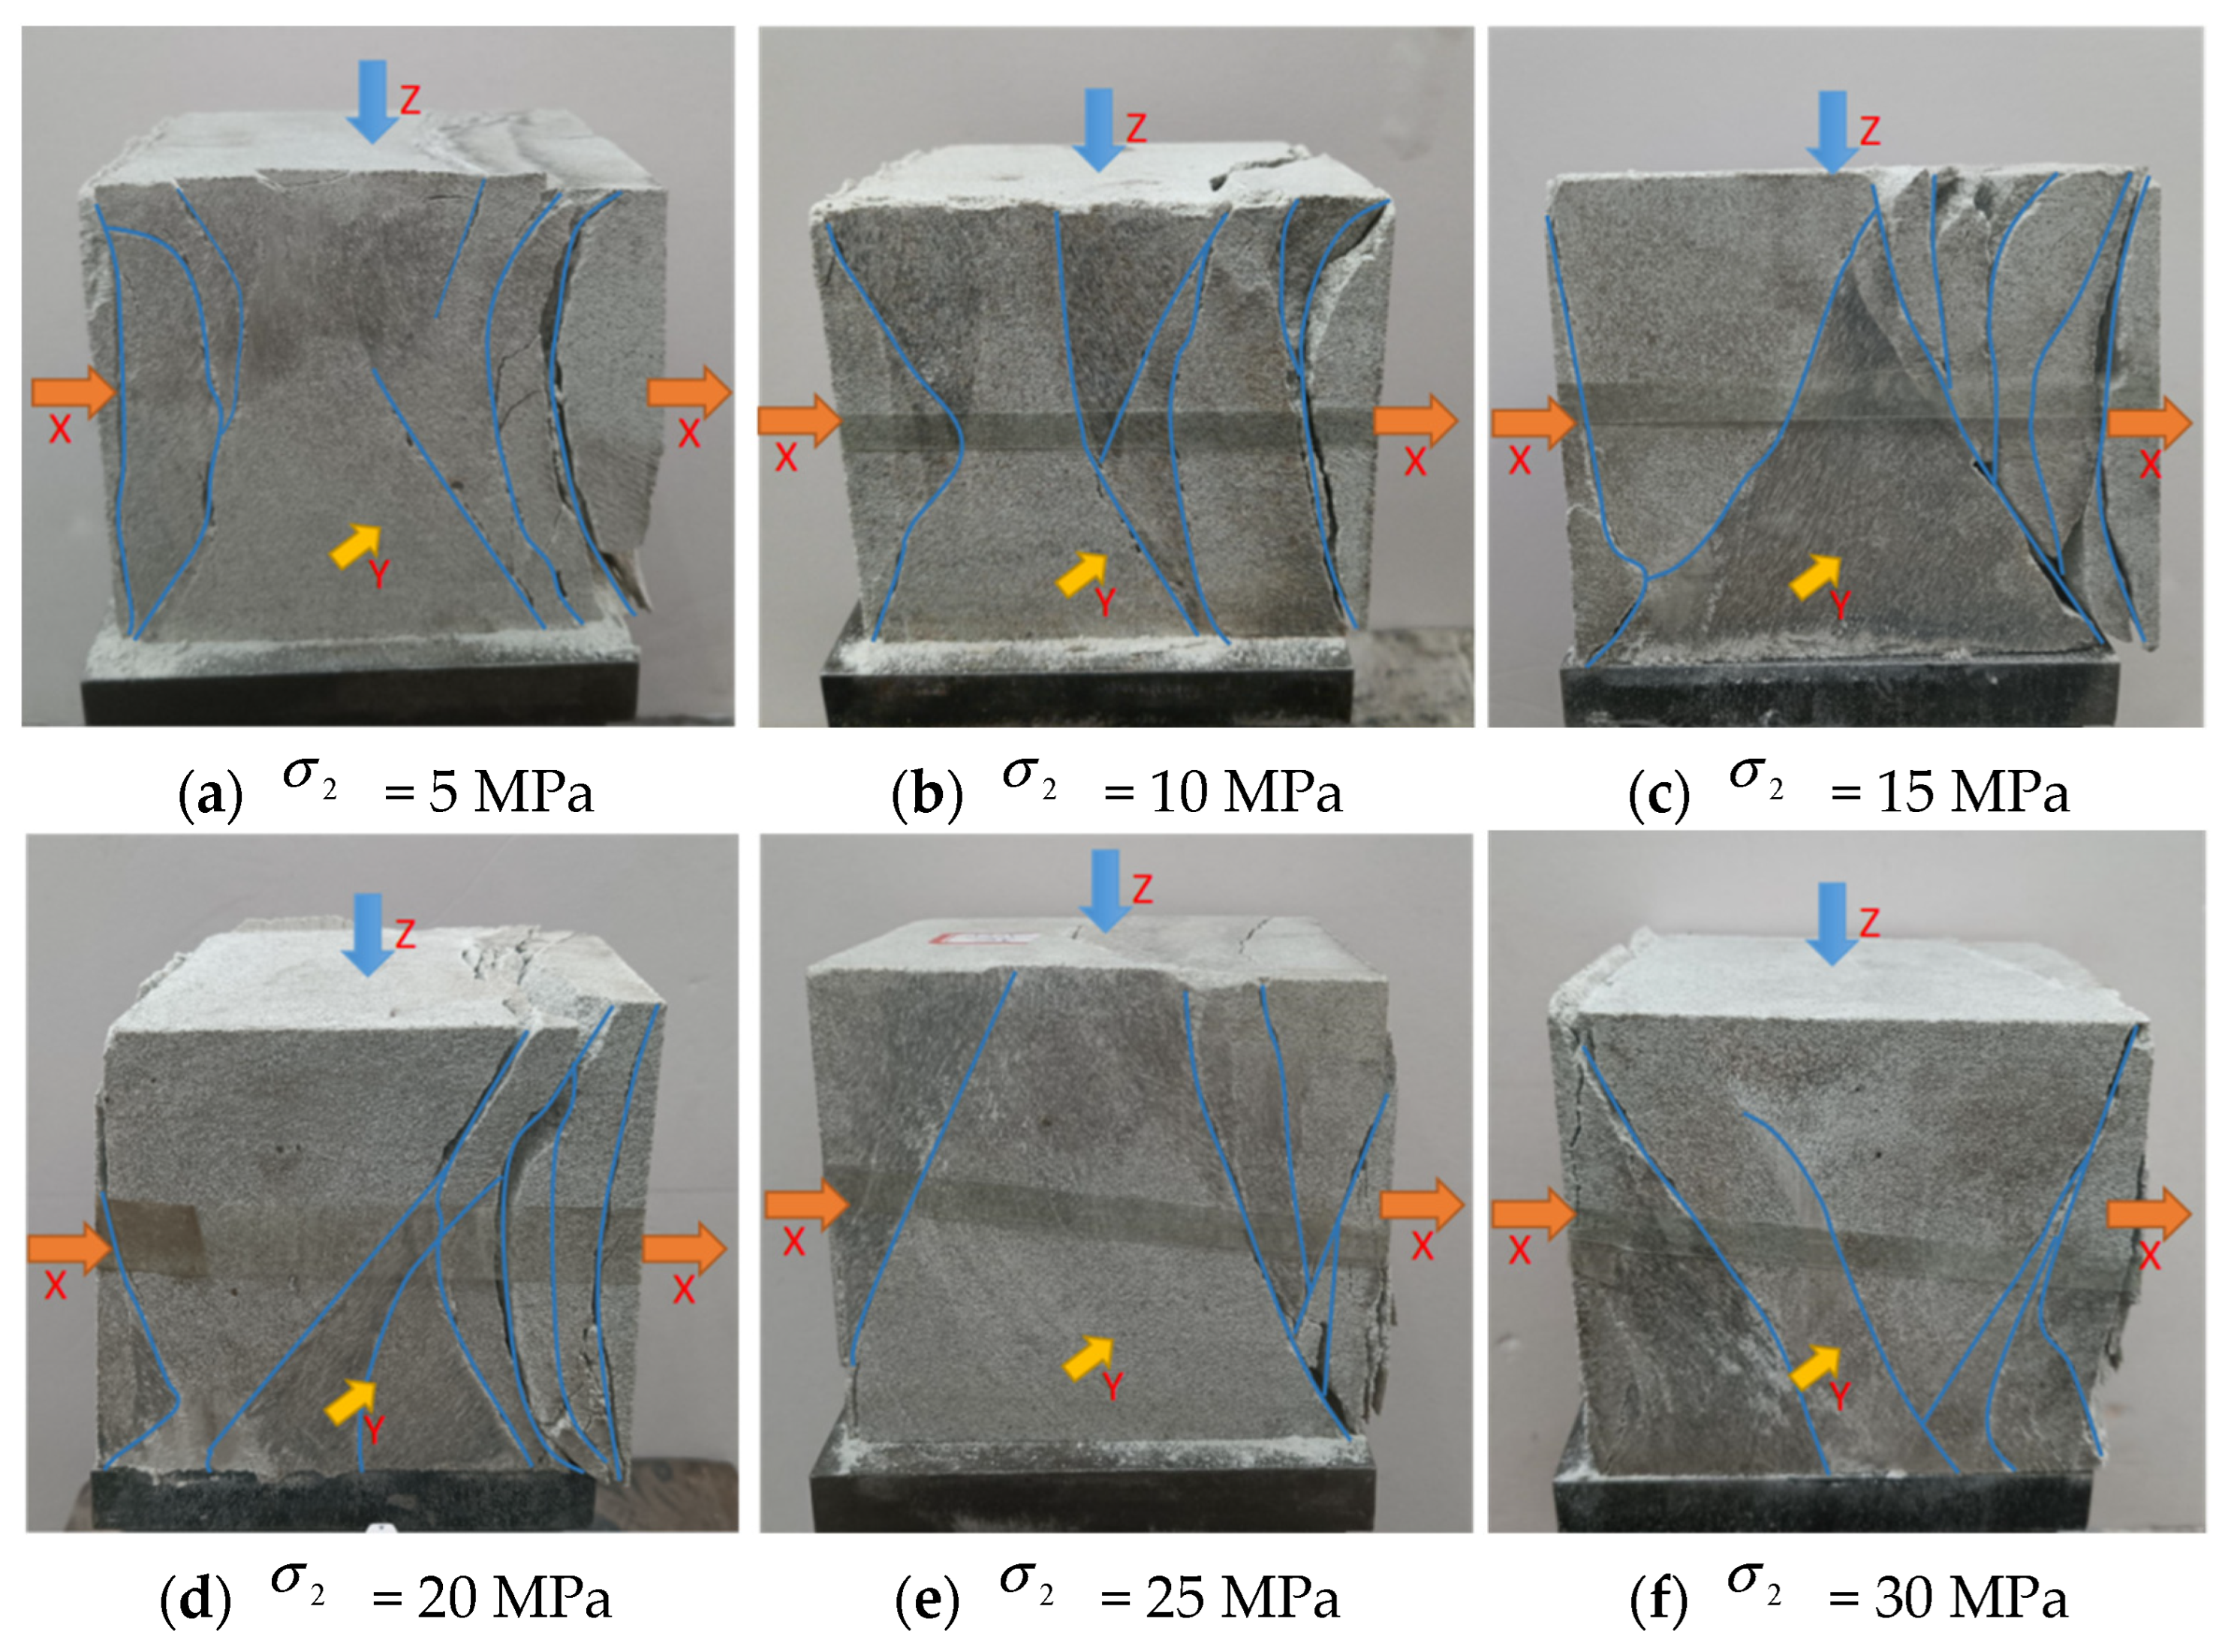
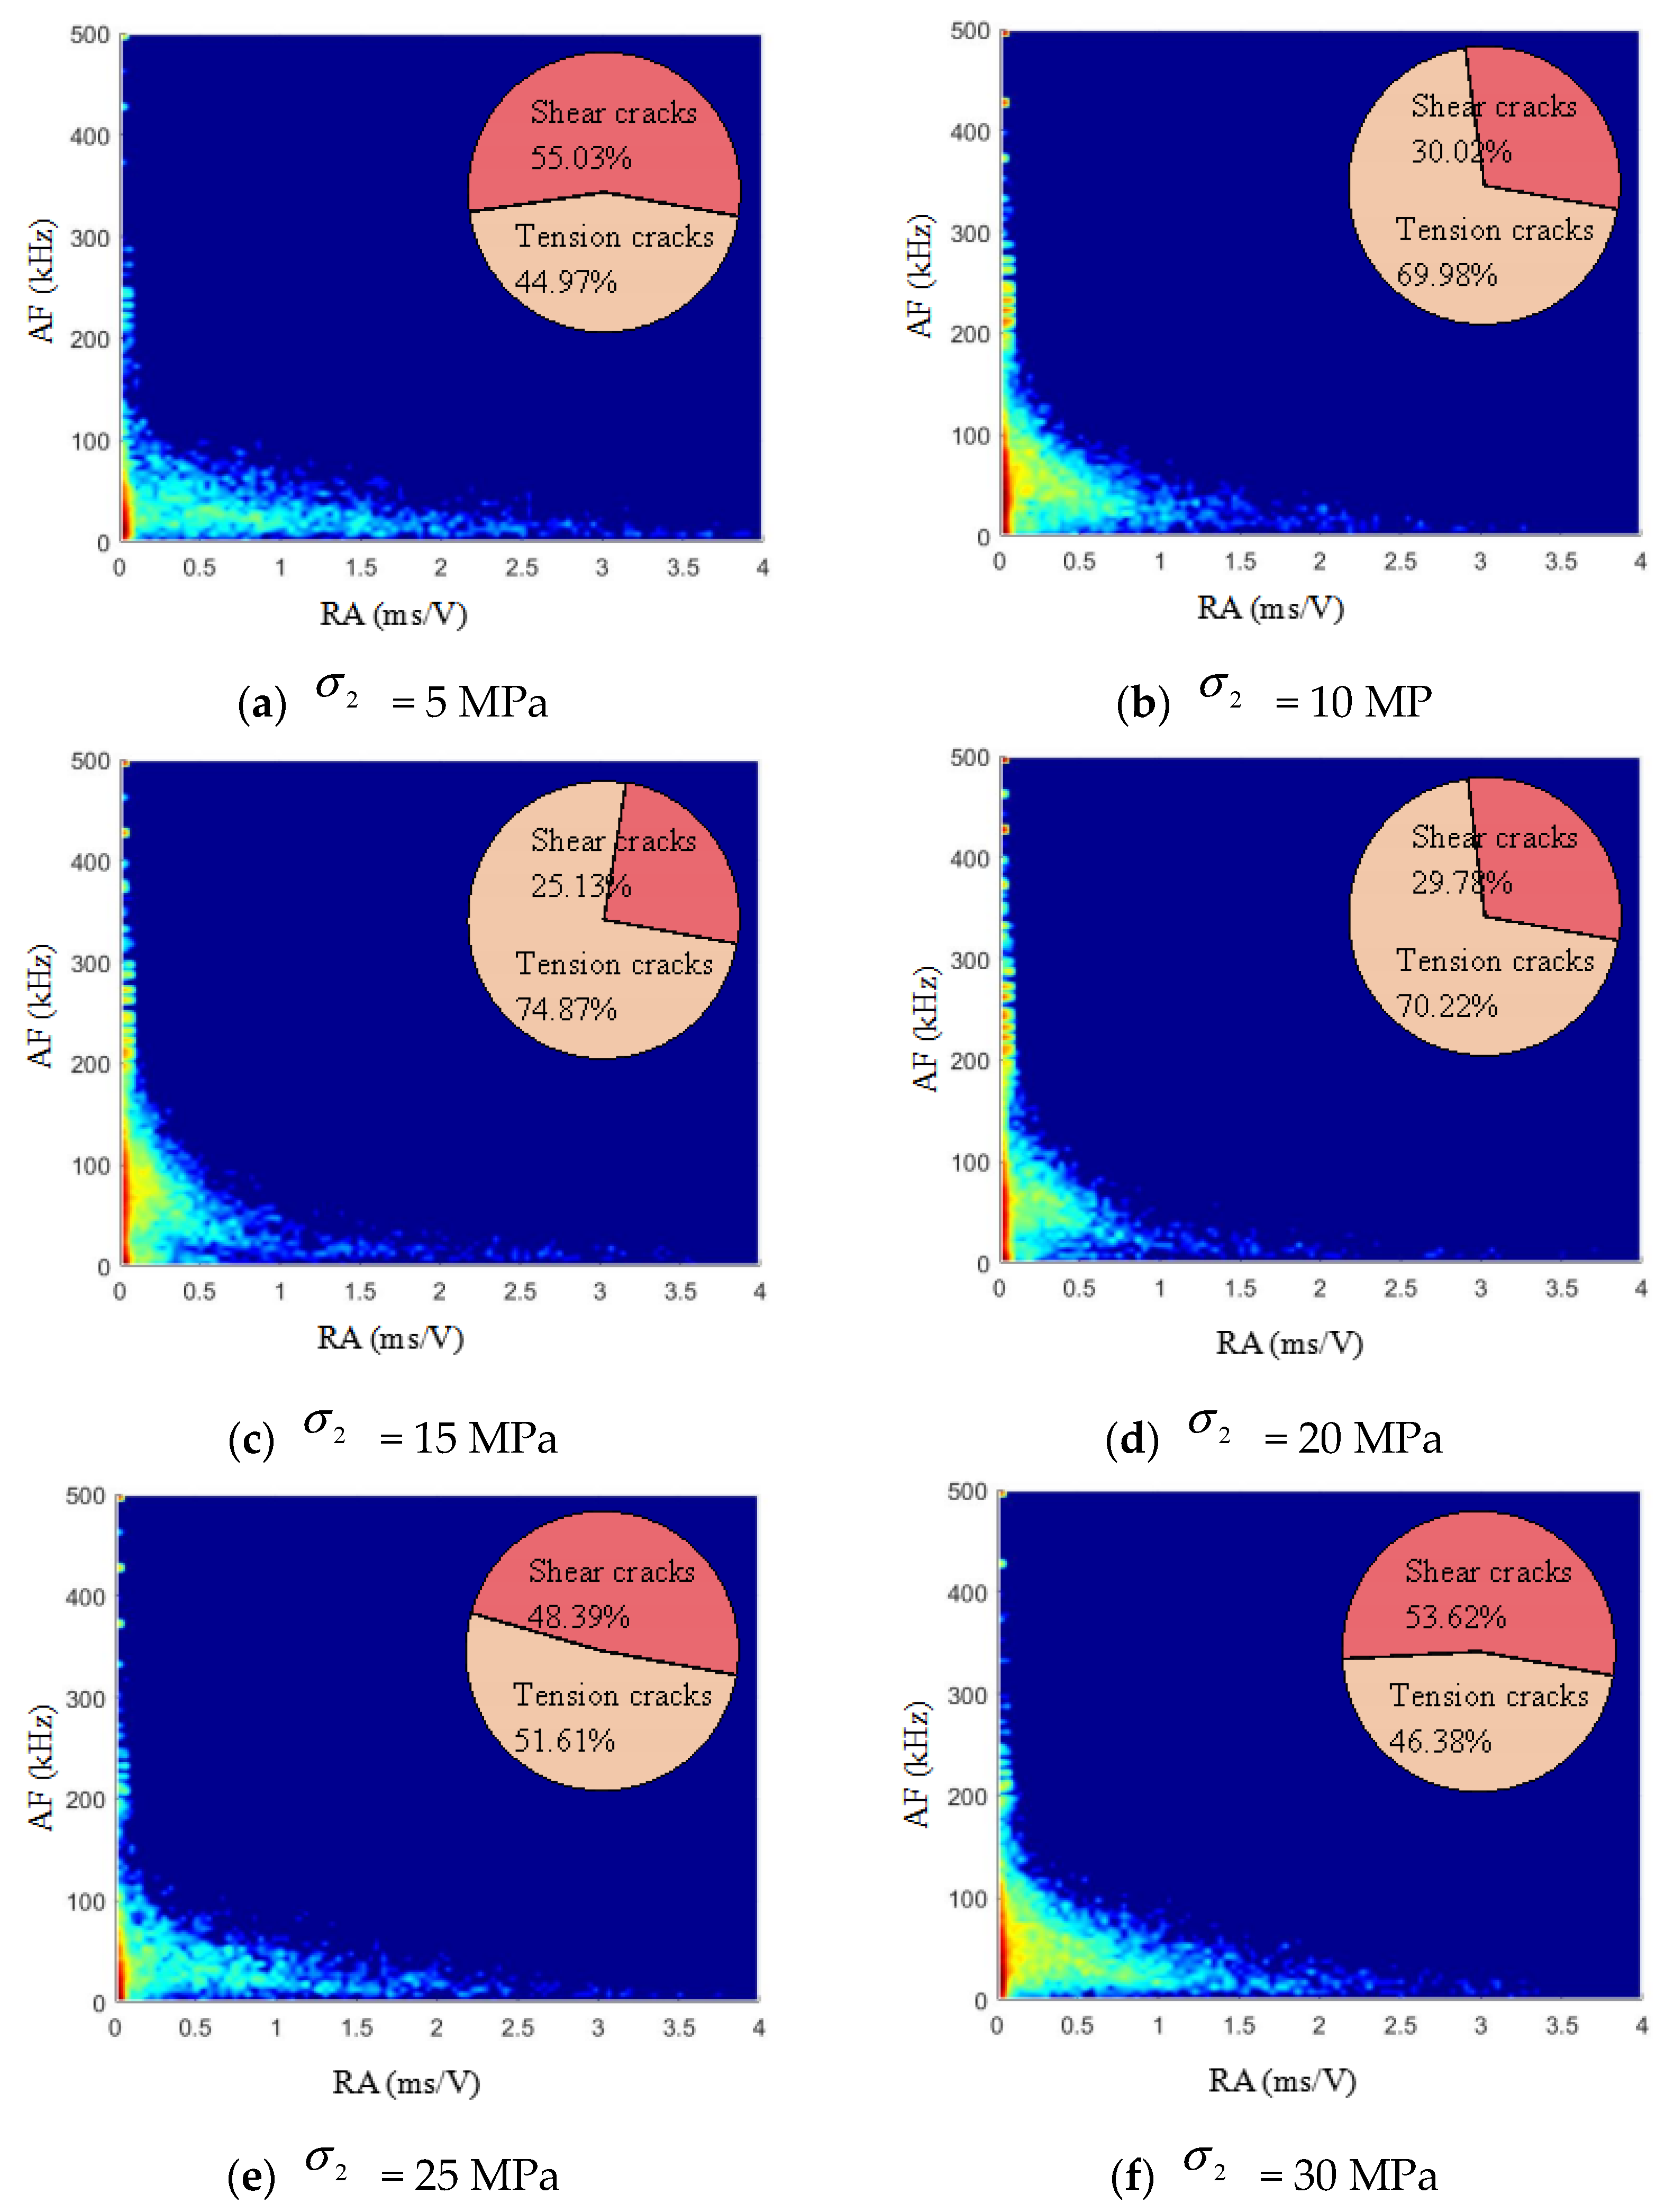
3.3. Failure Modes of Rocks Under Unloading
3.4. Fractal Dimension of Rocks Under Unloading
4. Rock Failure Law and Multifractal Features
4.1. Evolution Pattern of Unloading-Induced Rock Failure
4.2. Calculation Method for Multifractals of Ring-Down Count
4.3. Analysis of Multifractal Features of Ring-Down Count
5. Discussion
6. Conclusions
- (1)
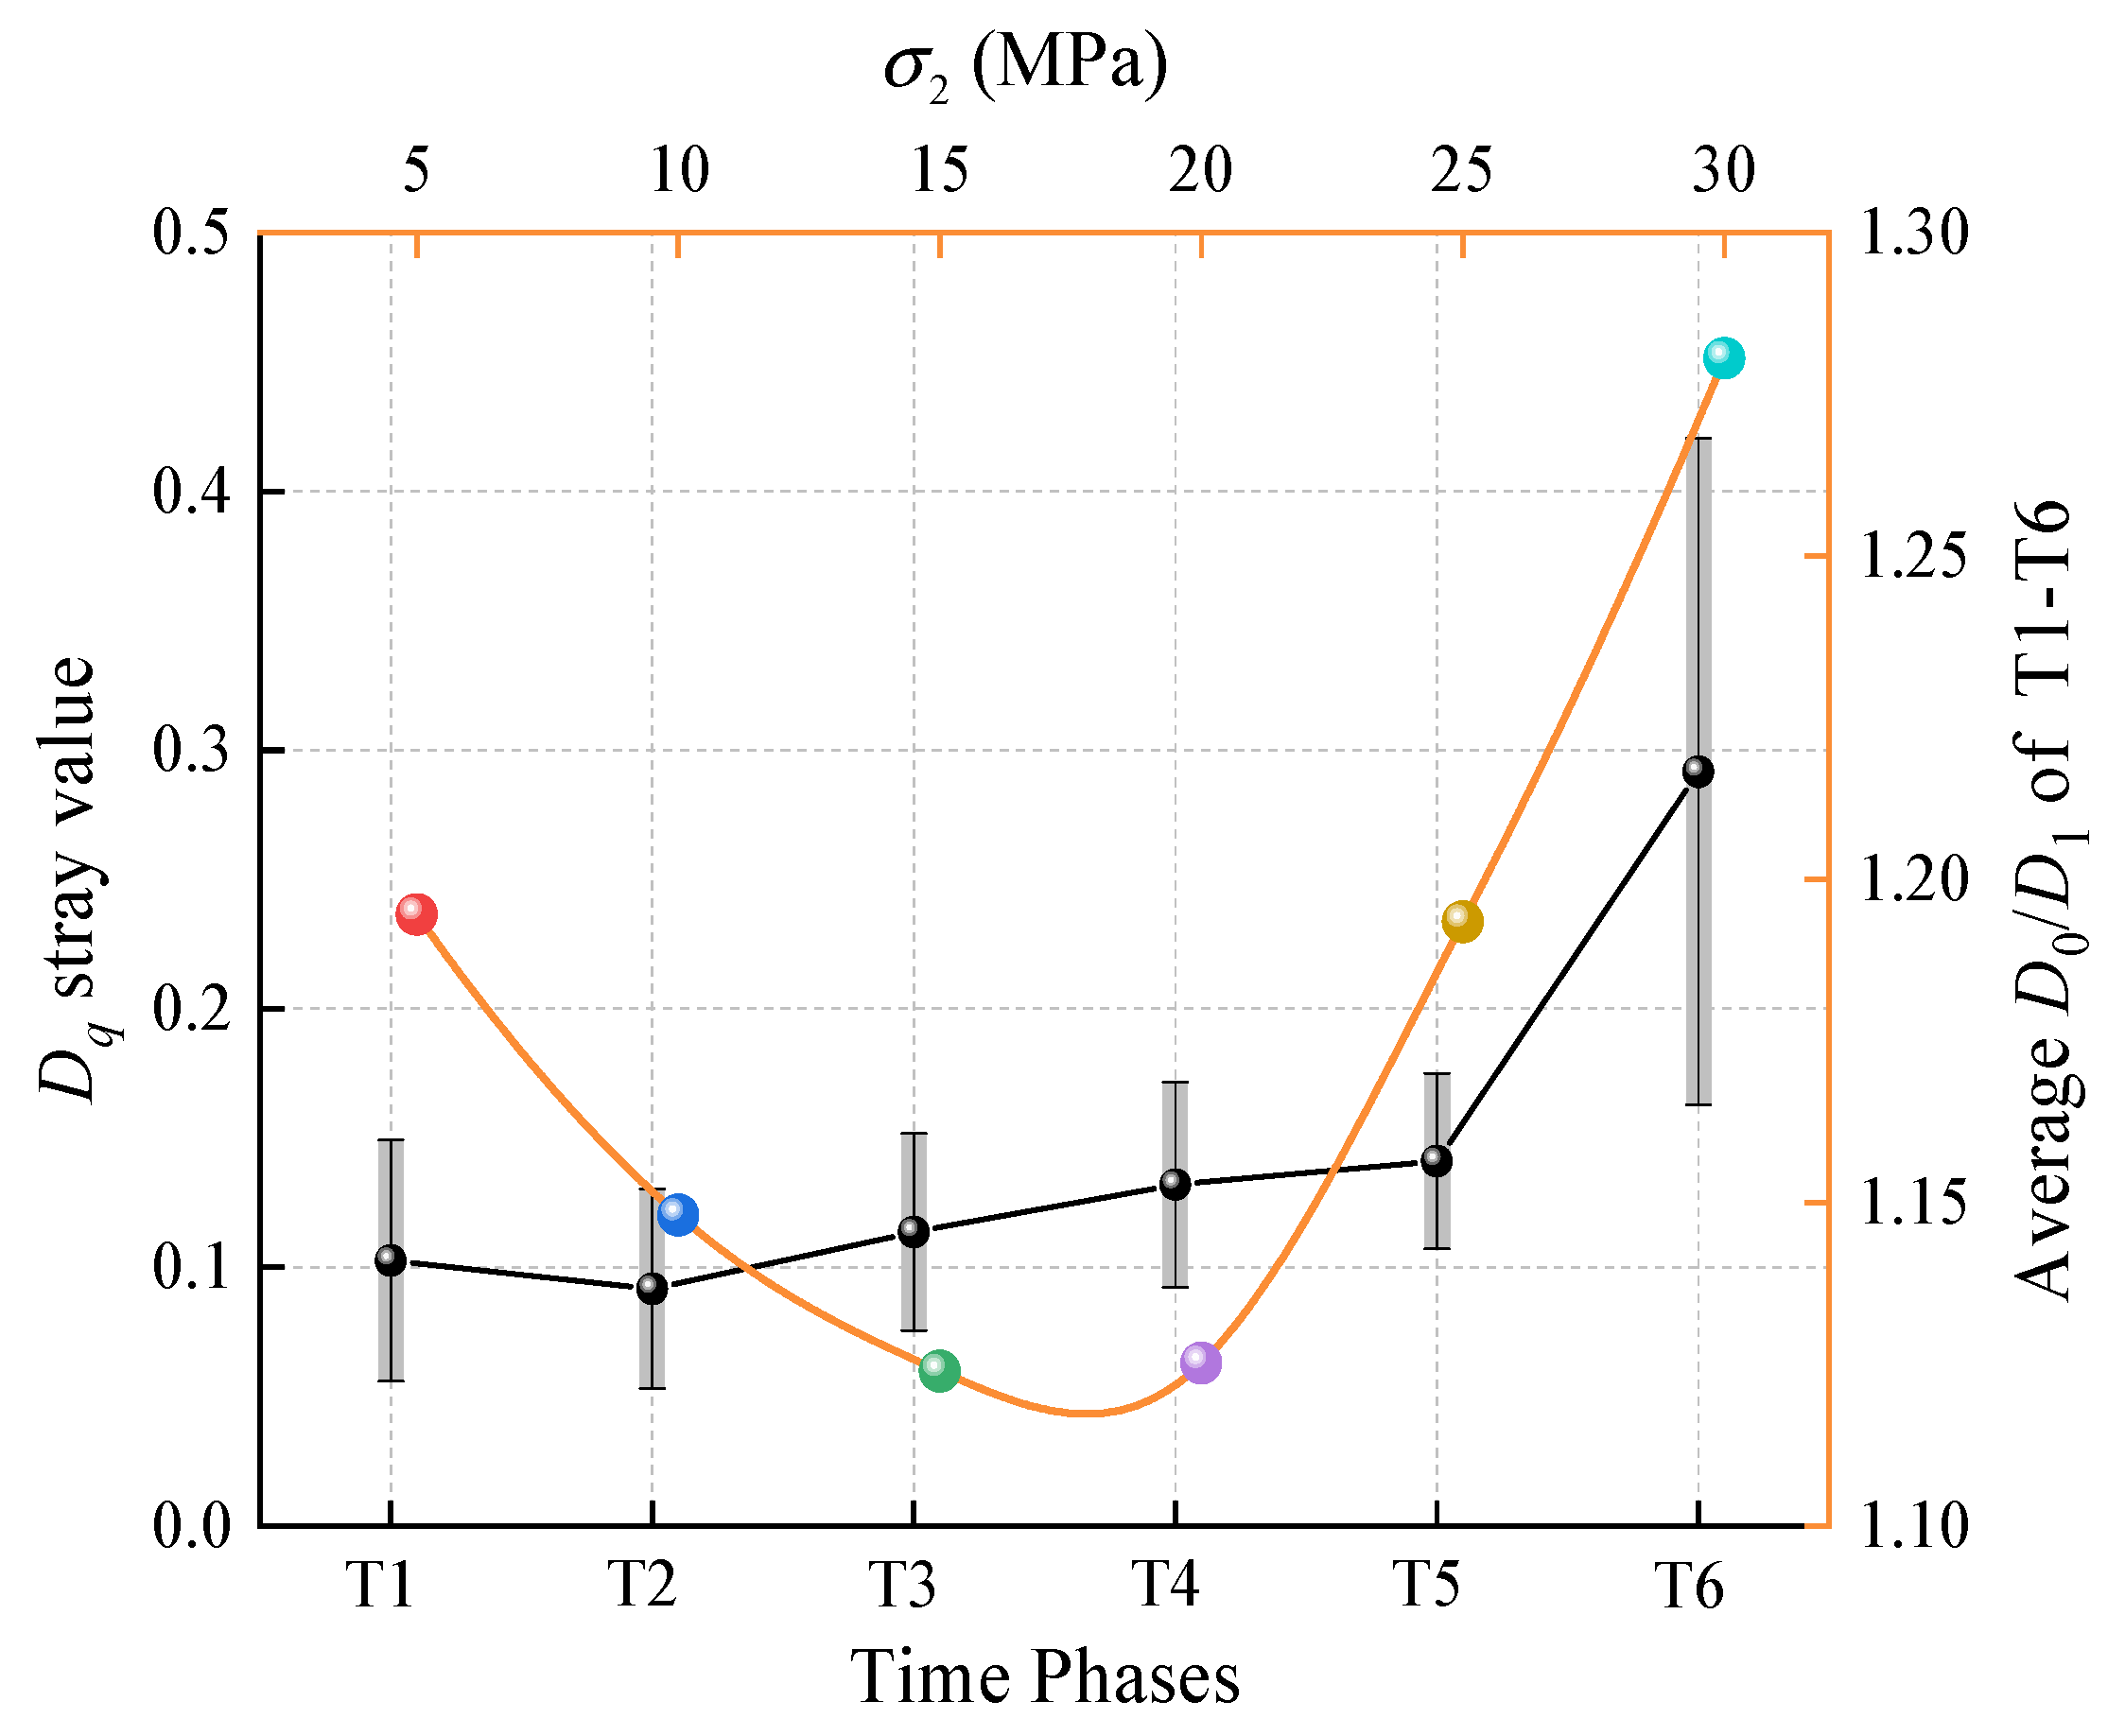
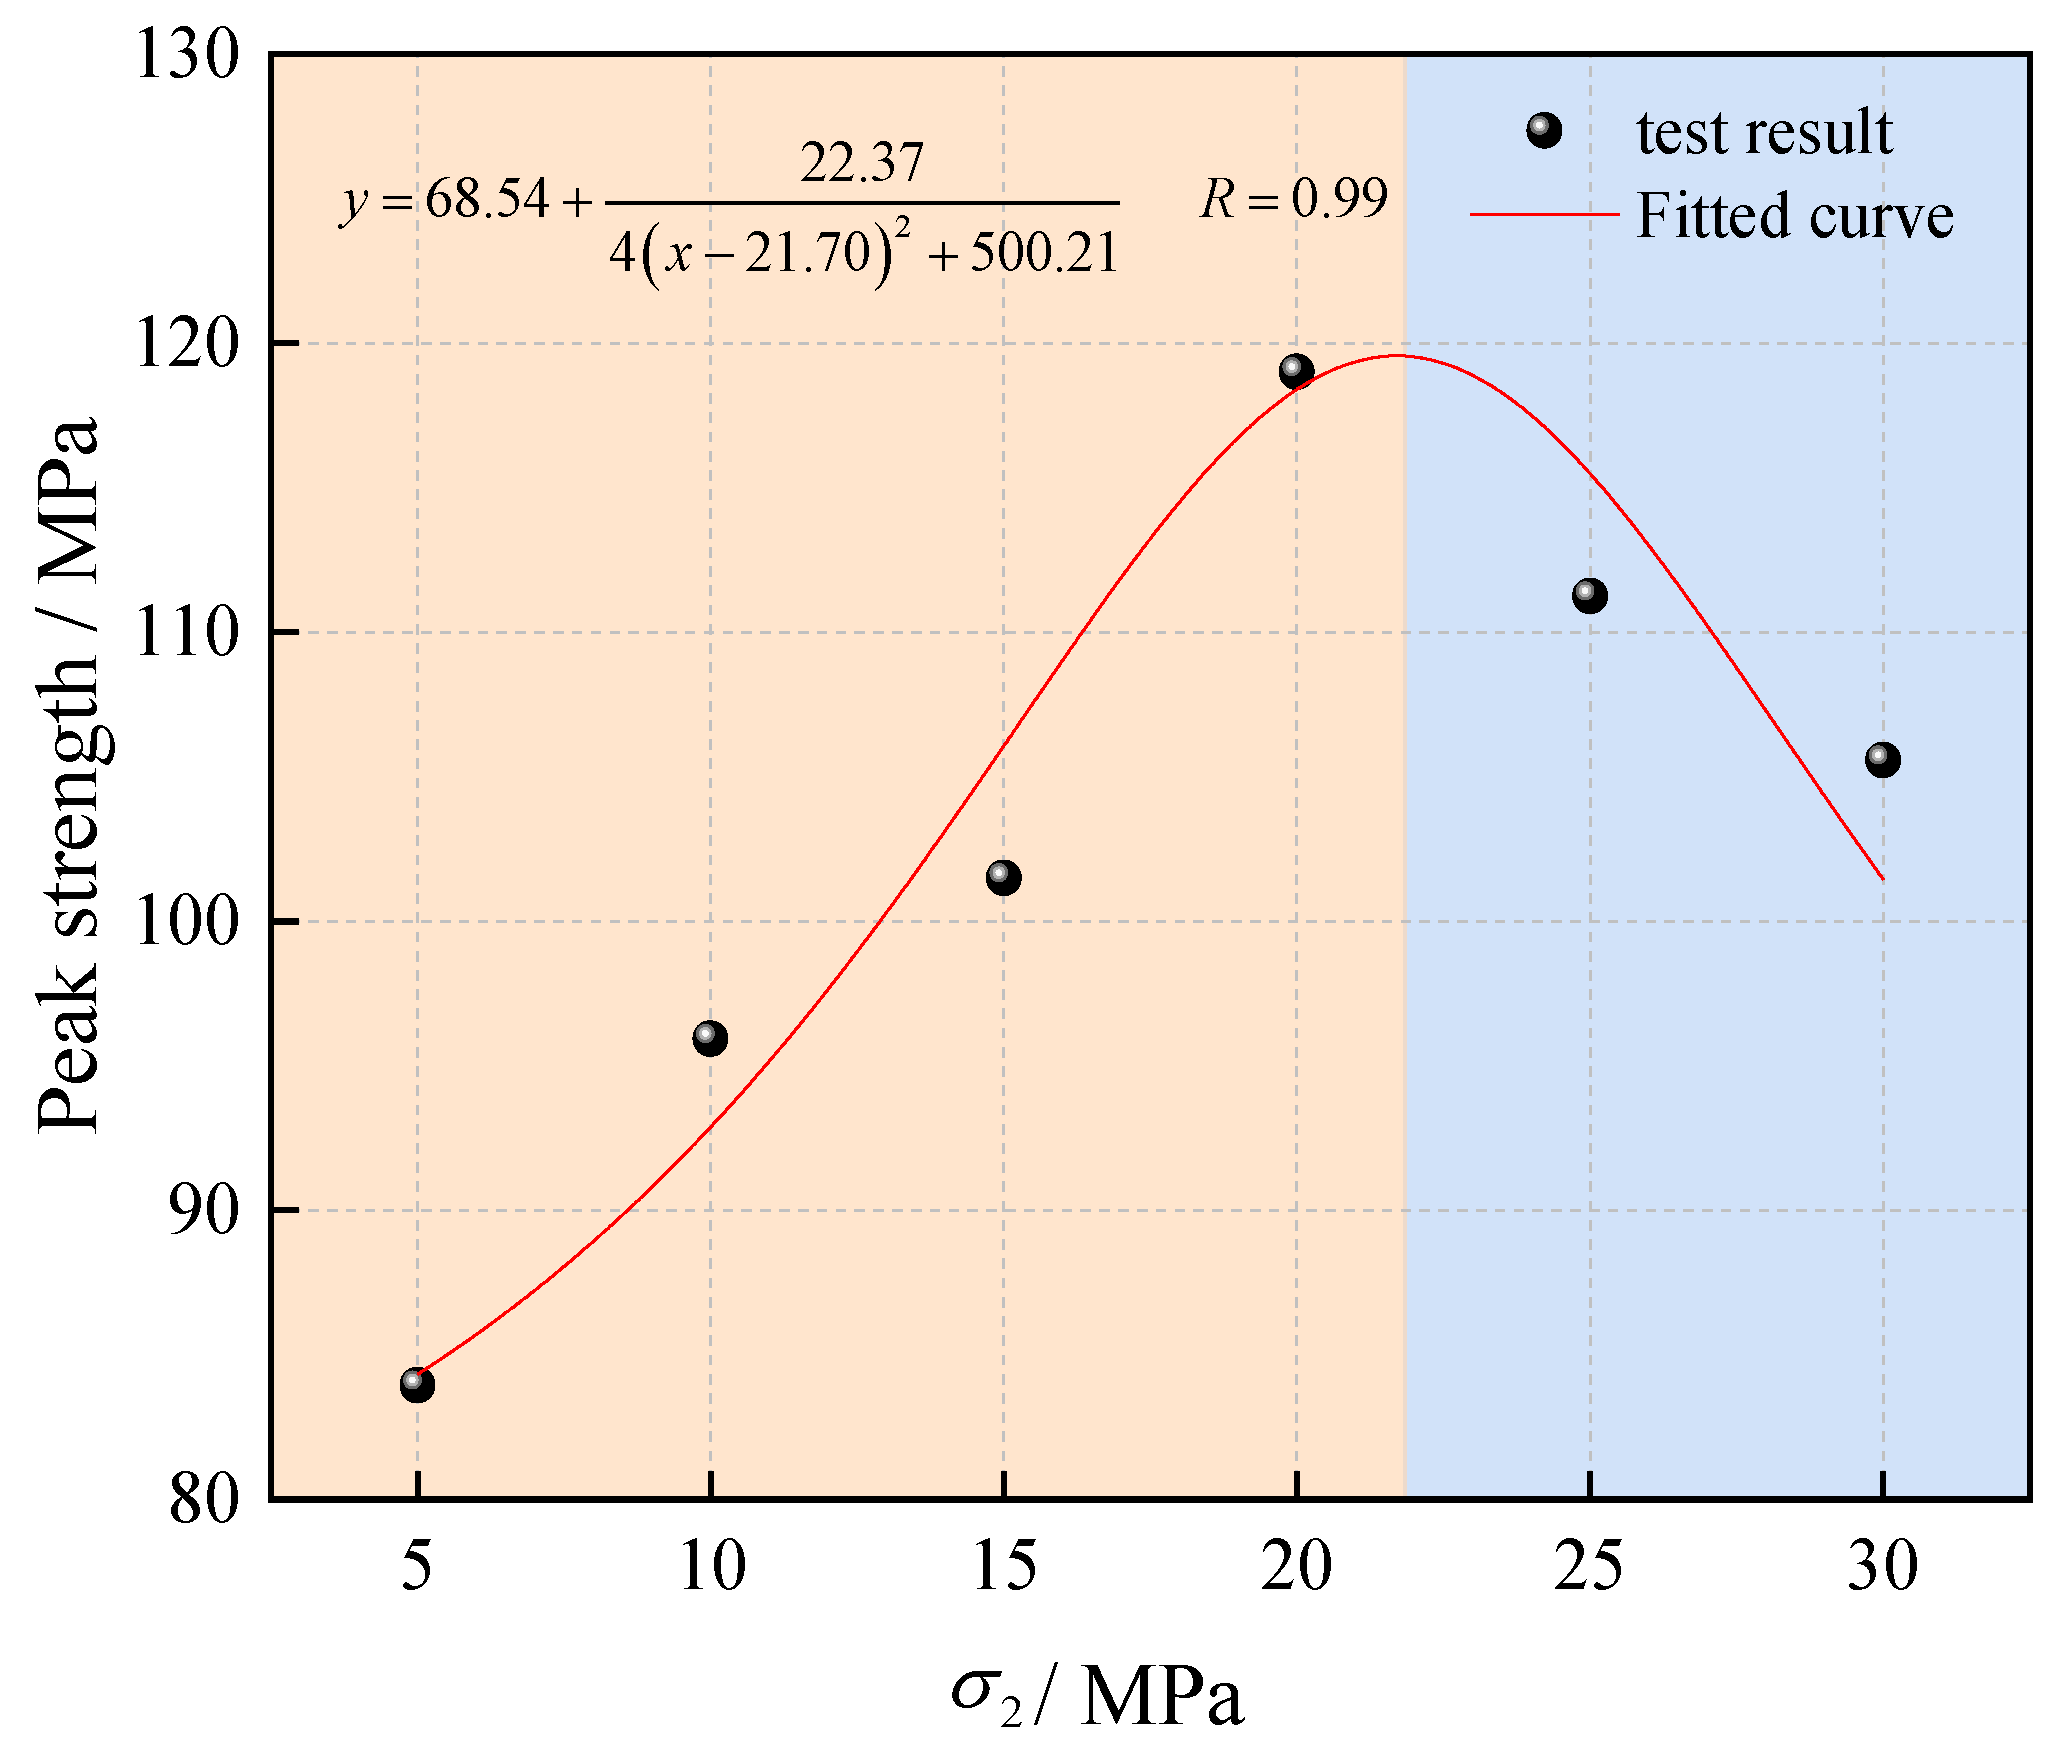
- An increasing first had an enhancing effect and then a weakening effect on the bearing capacity of the surrounding rocks to some degree. However, its continuous increase strengthened the ability of the rocks to resist deformation under unloading.
- (2)
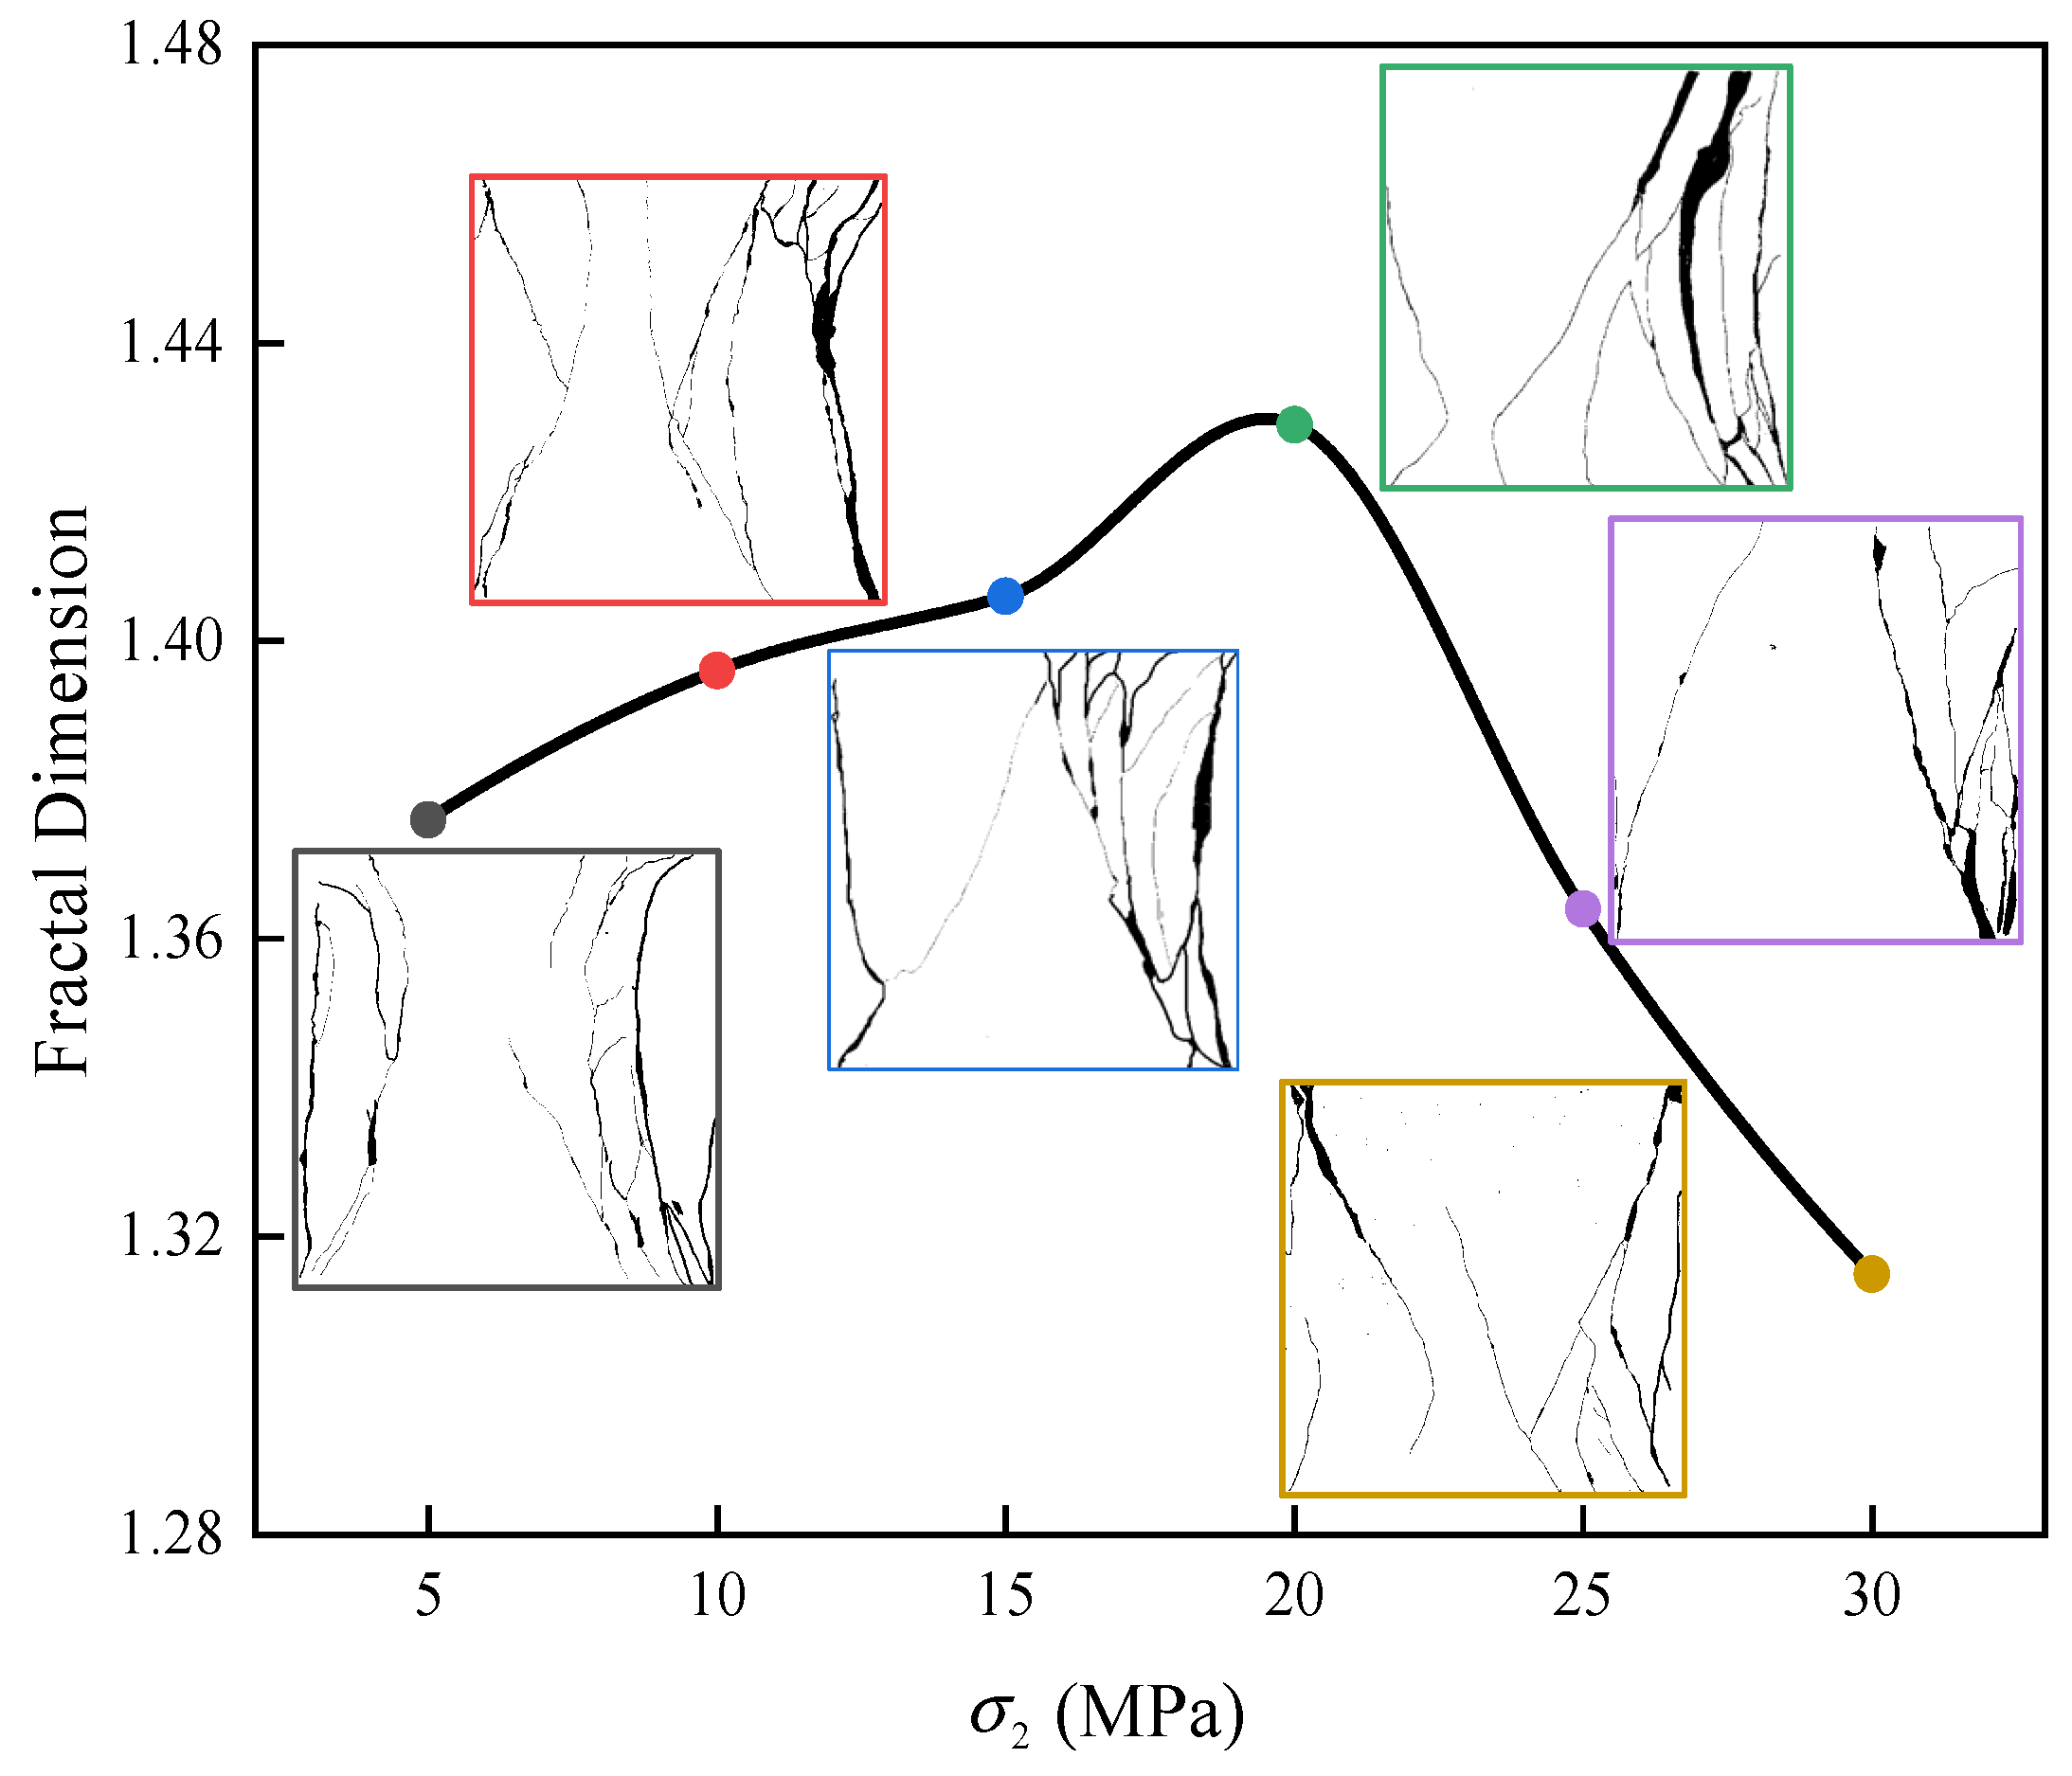
- As increased, the principal failure mode of the rock samples under unloading changed, macroscopically, from tension failure to compound tension–shear failure and finally to shear failure. Microscopically, the predominant failure mode changed from shear failure to tension failure and finally to shear failure. The fractal dimension of the cracks first increased and then decreased.
- (3)
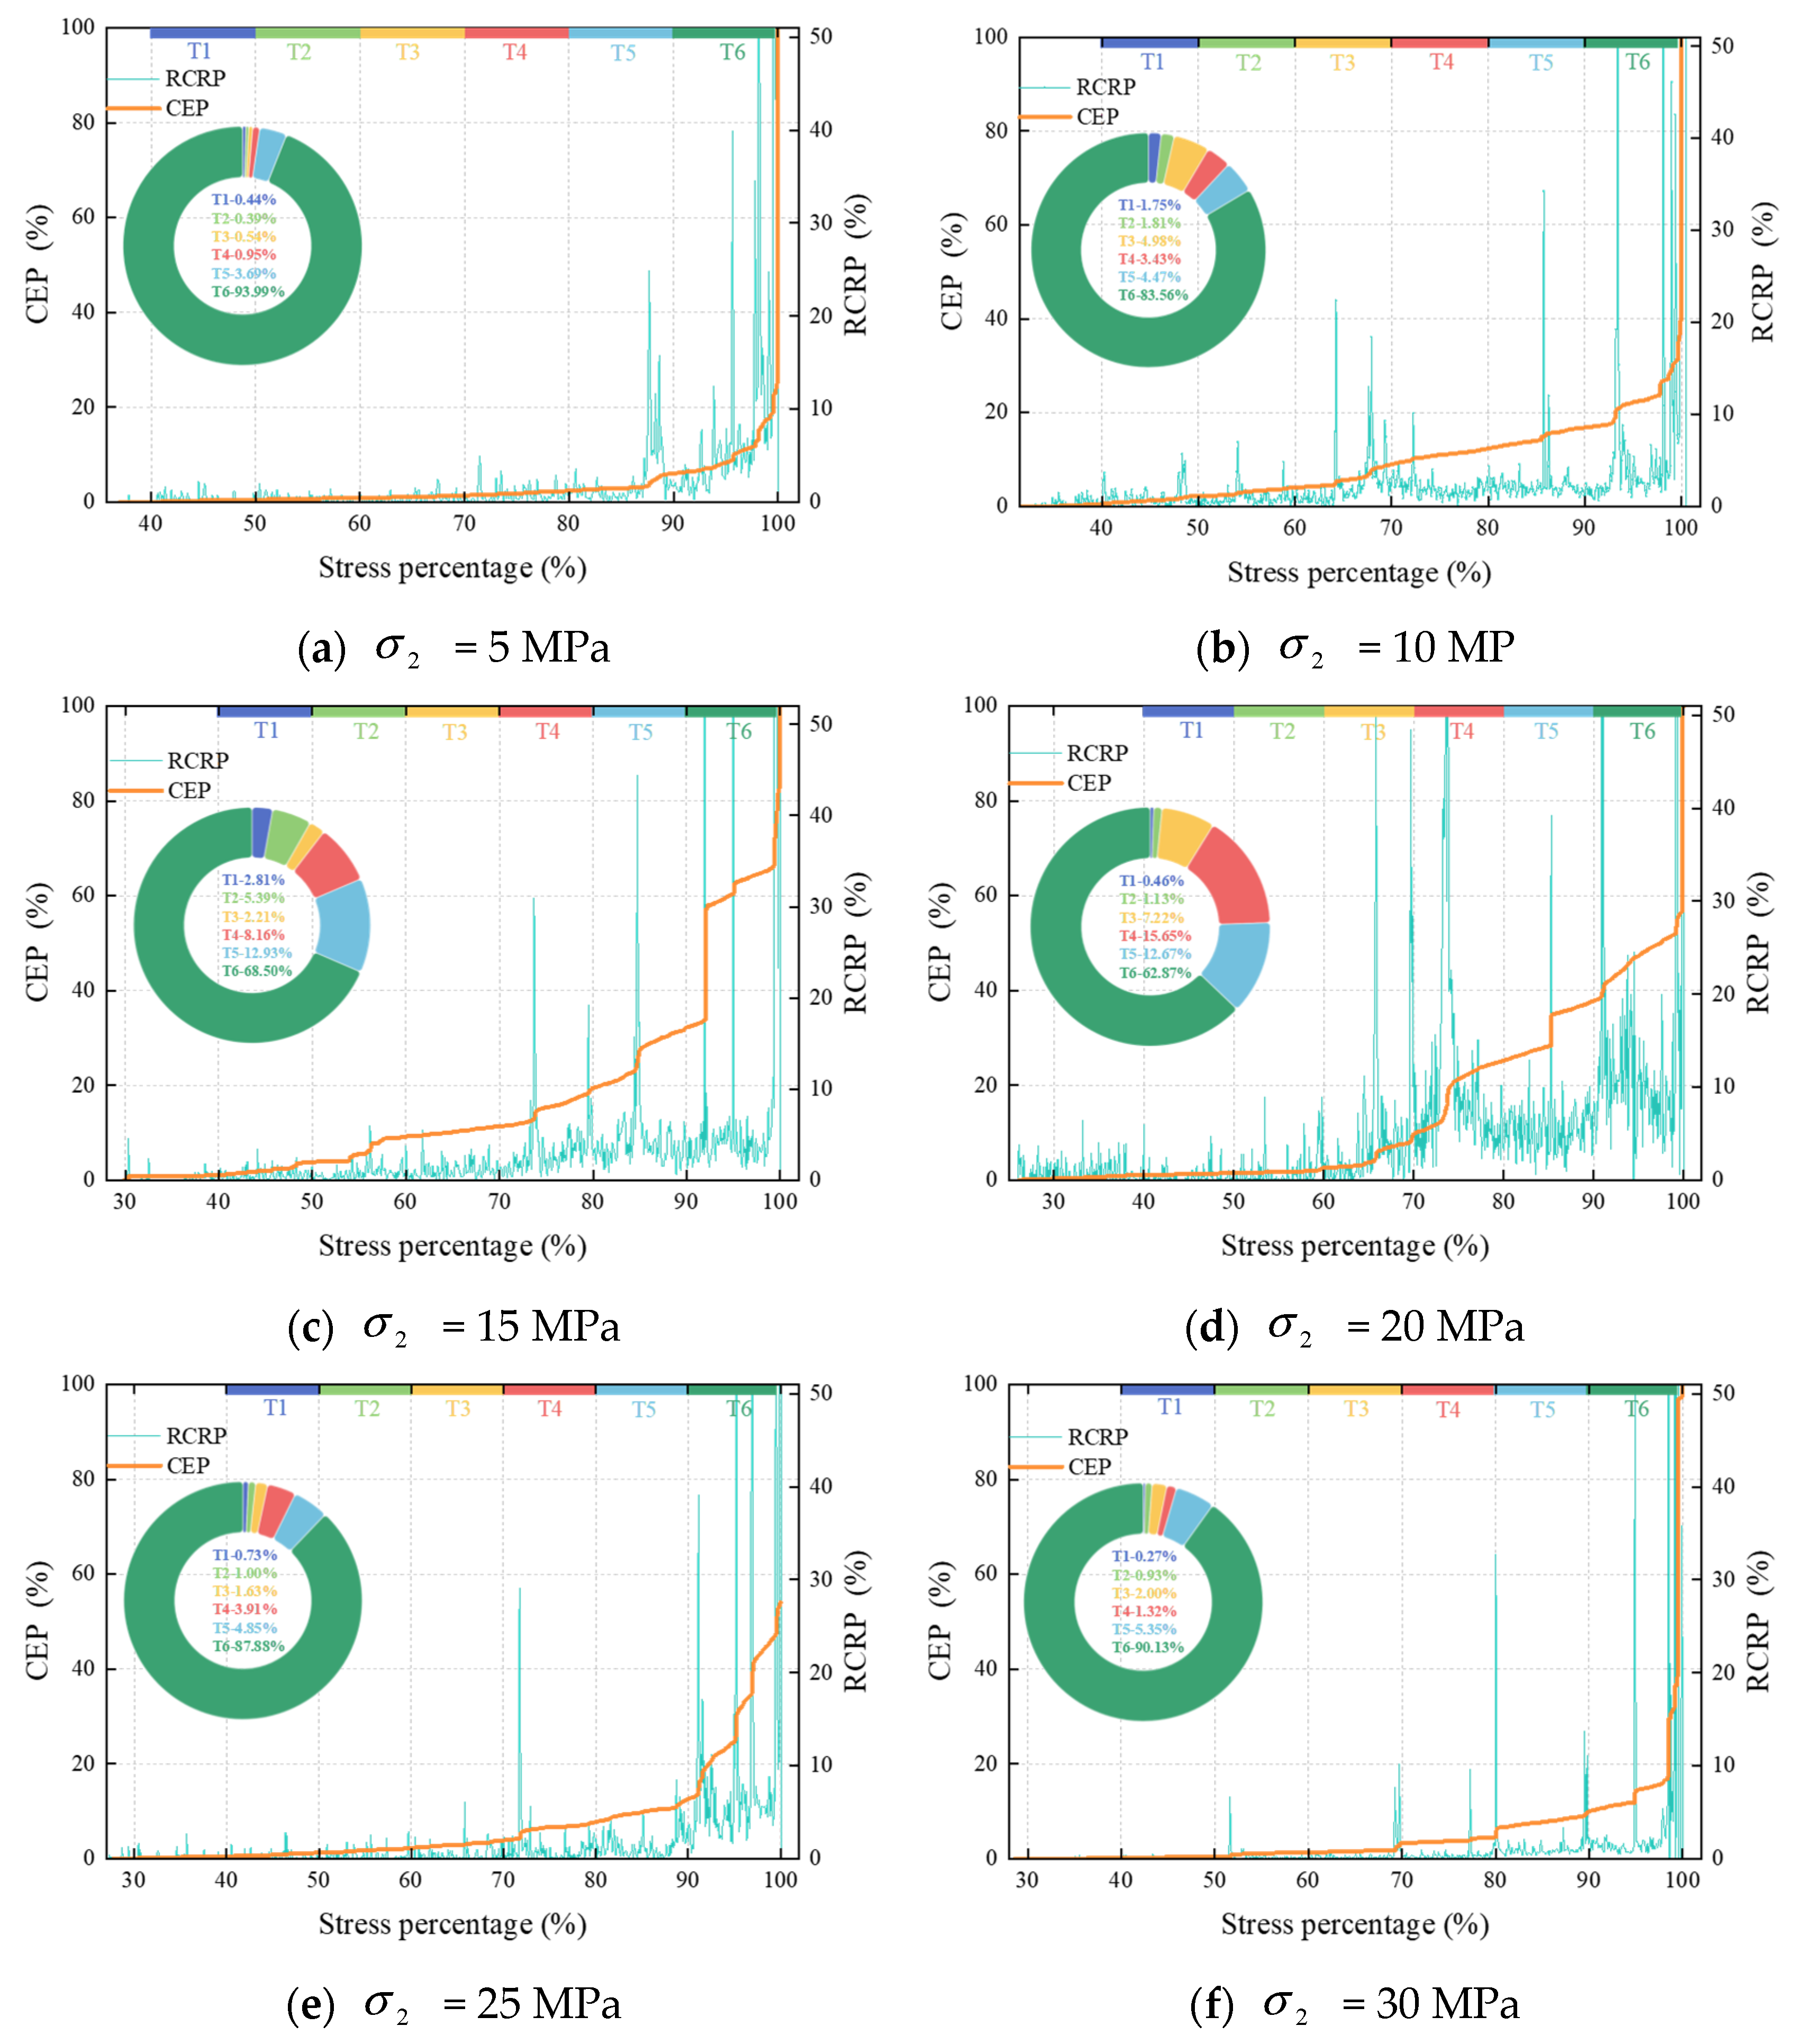
- Major damage caused to the rocks under unloading primarily occurred at T6. The number of rock failure events within the specified area first increased and then decreased, as increased. The failure distribution was initially concentrated, then dispersed, and became concentrated again at the end.
- (4)
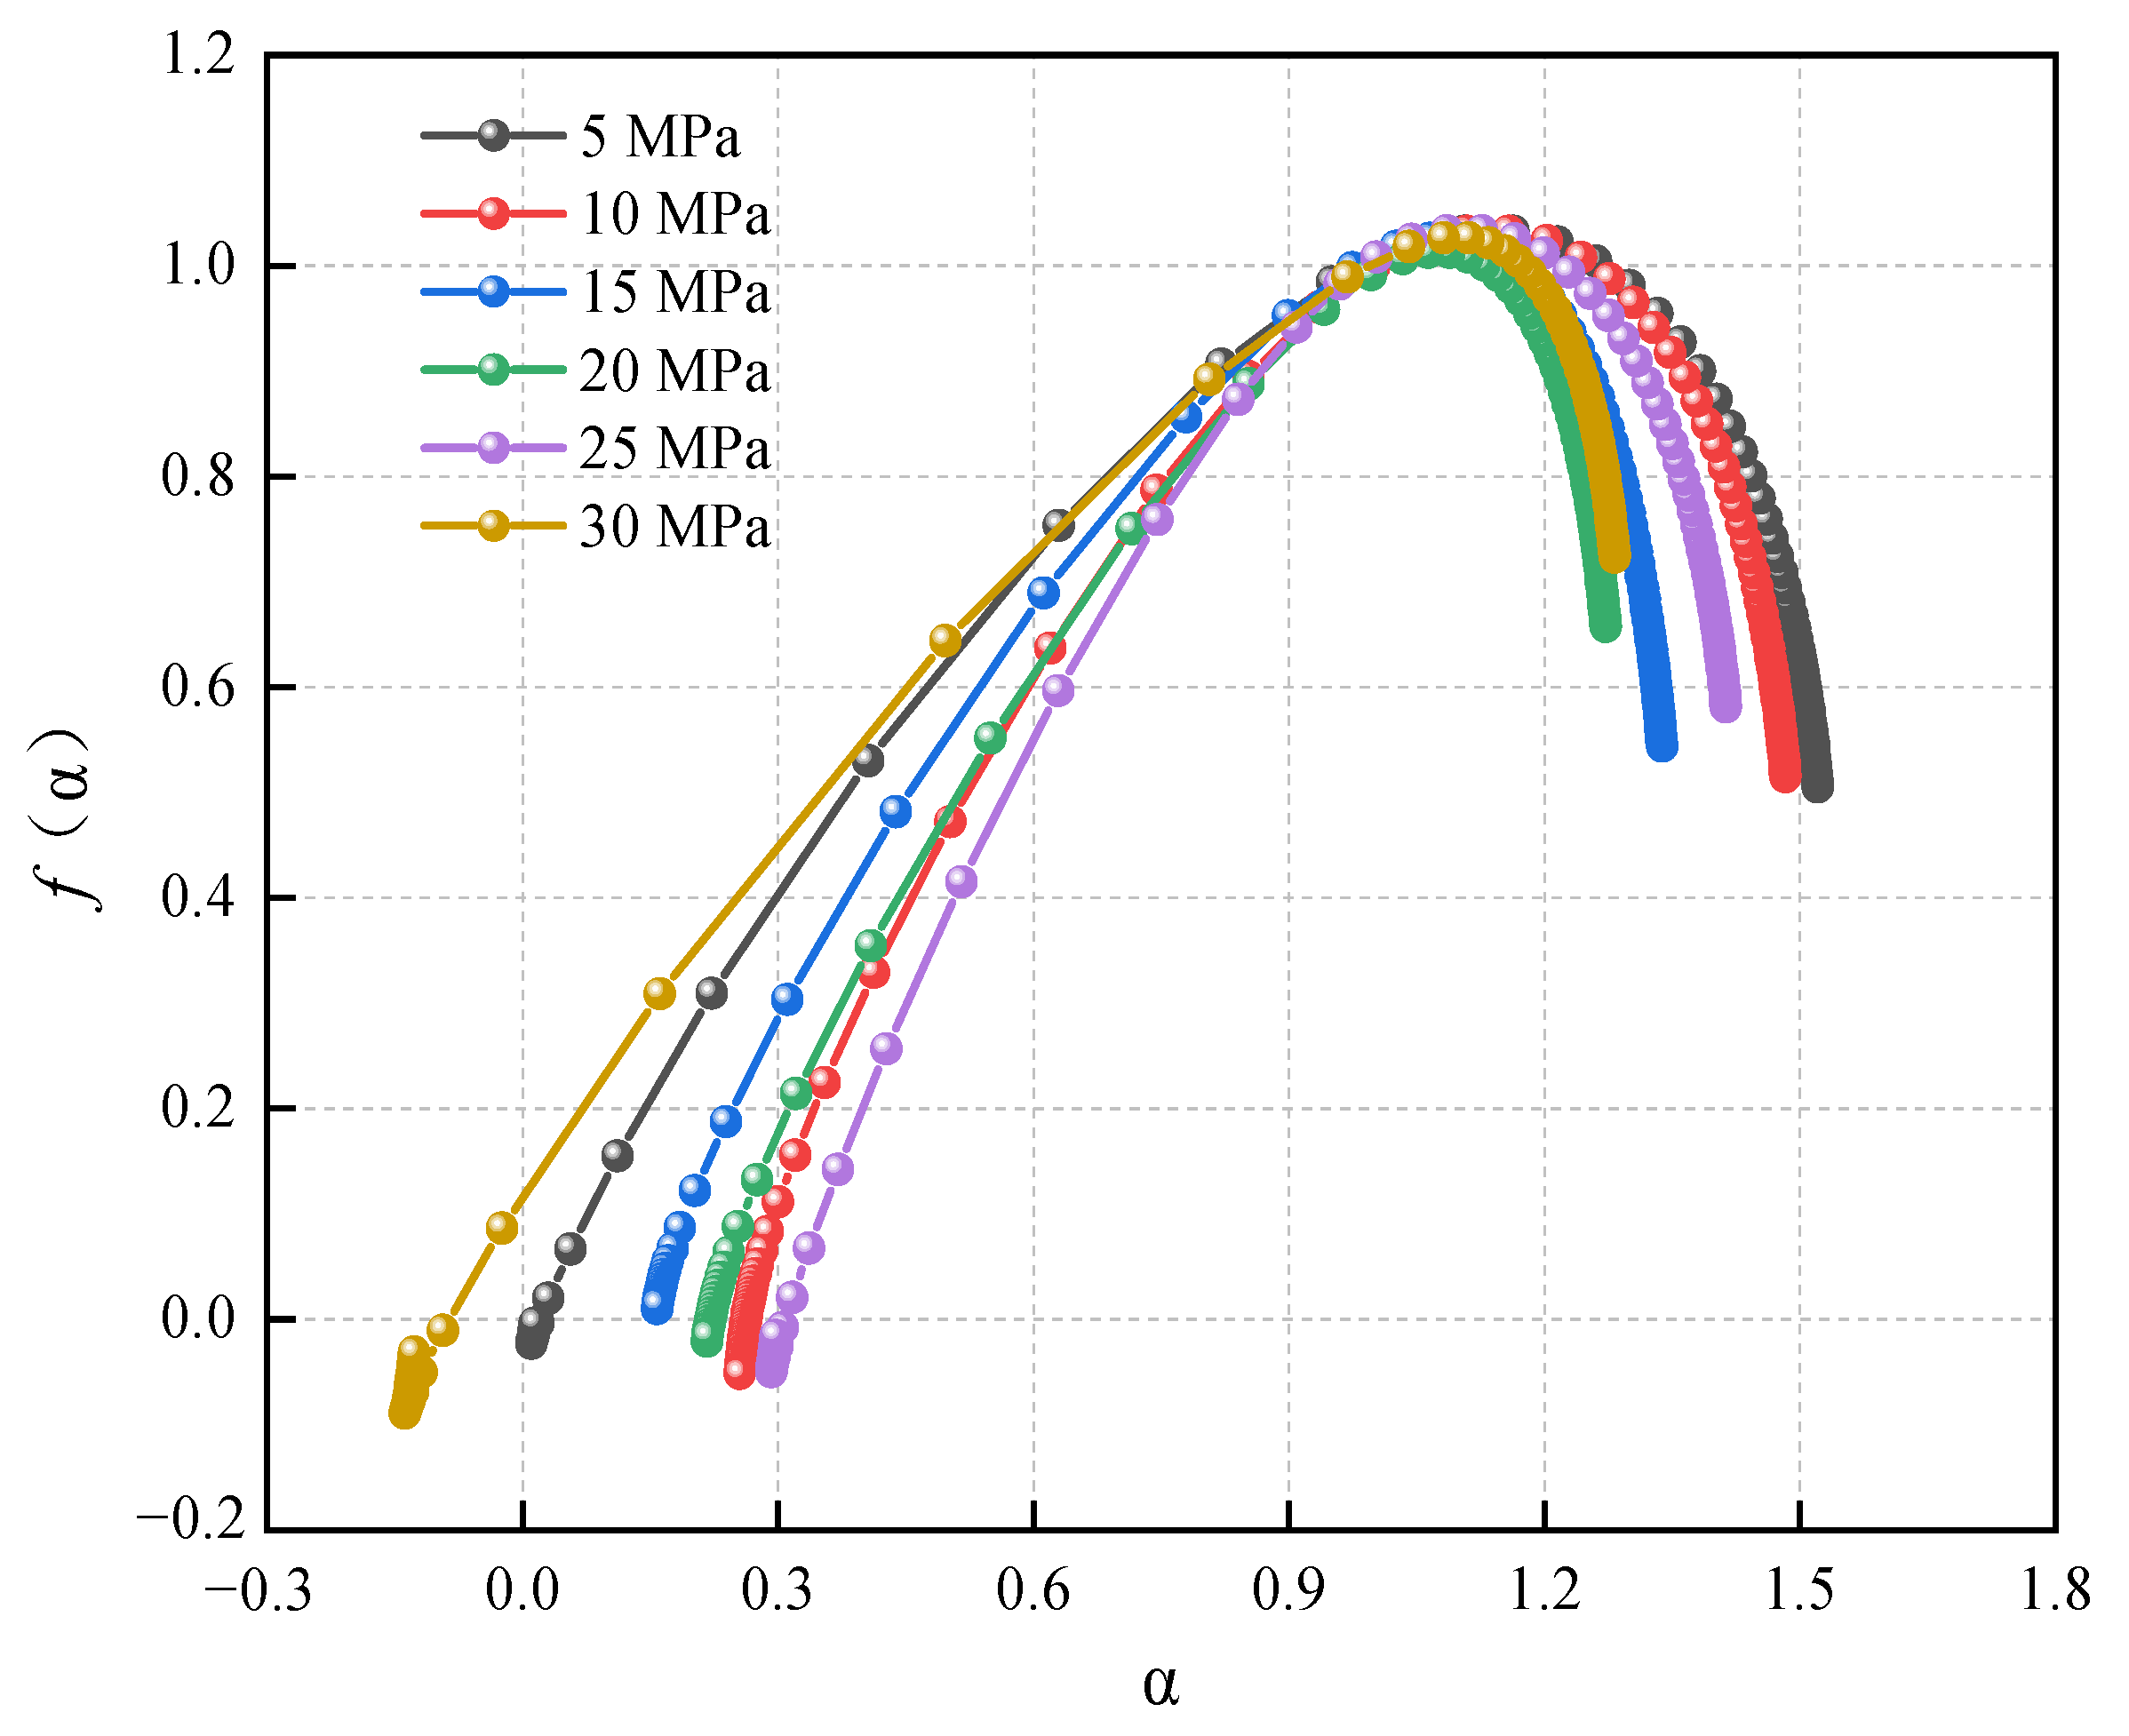
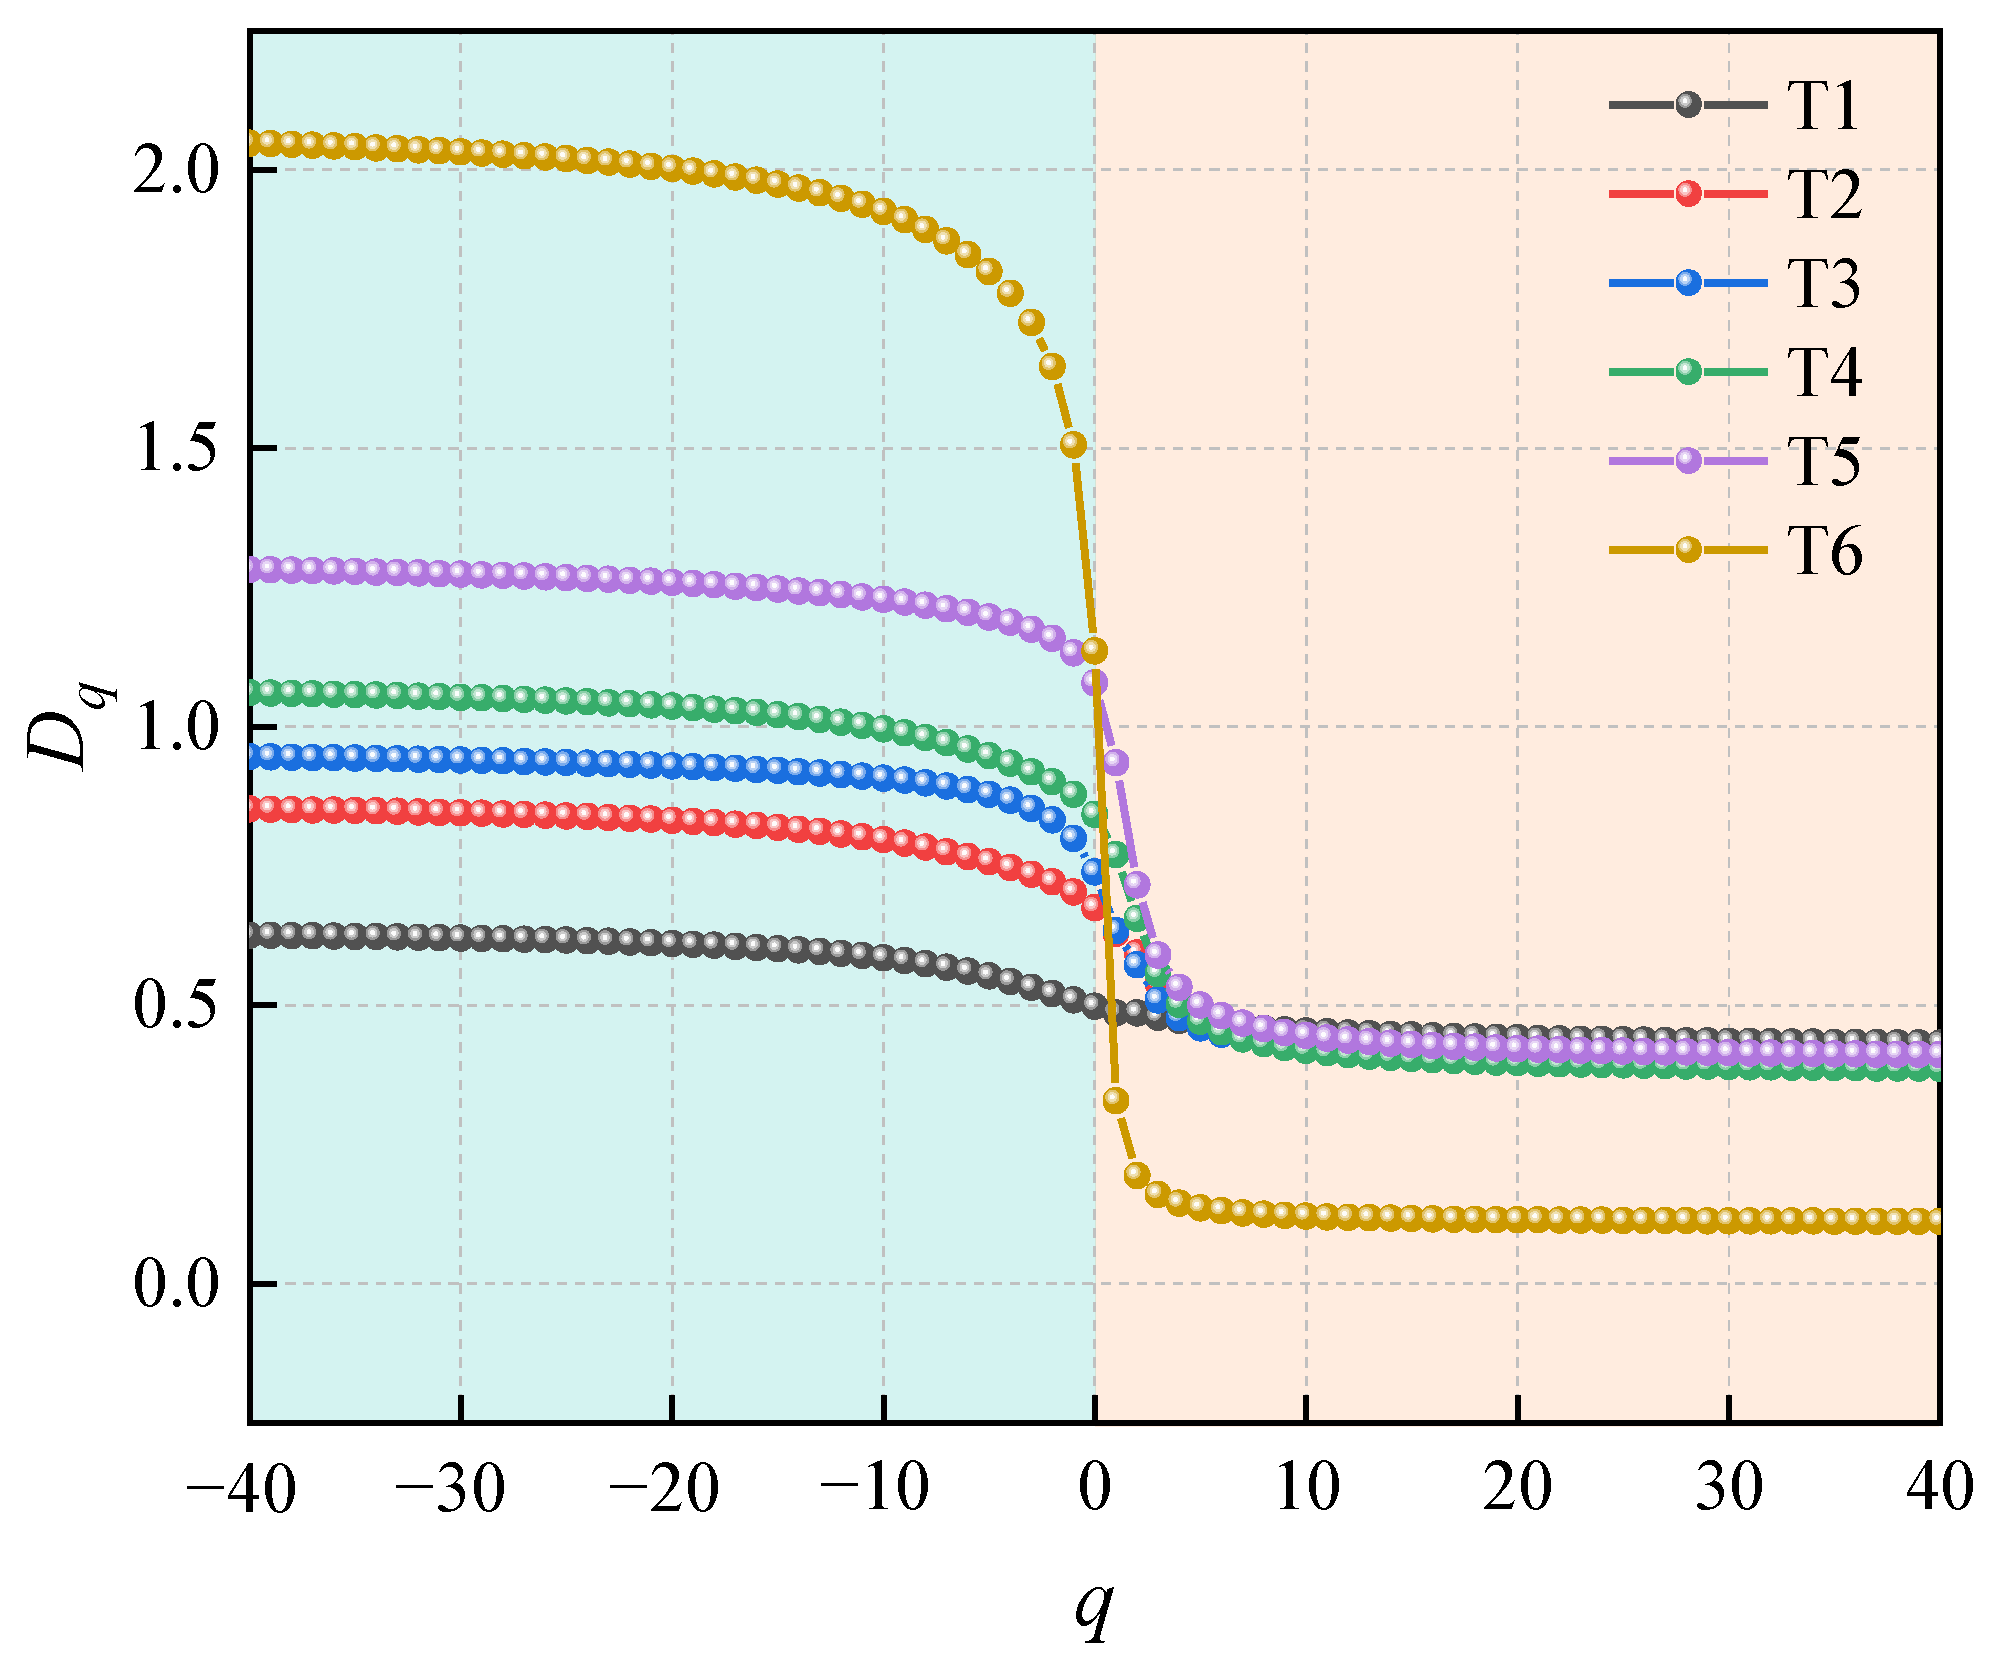
- The multifractal spectra of the ring-down count initially showed an increasing trend and then a decrease over time. The spectra curved rightwards and downwards after hitting the highest point. As increased, the fractal dimension ∆α of the cracks in the rocks first increased and then decreased. The failure distribution of the rocks under unloading was initially concentrated, became more uniform, and was concentrated again at the end. first decreased and then increased. The non-uniformity of the ring-down count distribution in the time domain first decreased and then increased.
Author Contributions
Funding
Data Availability Statement
Conflicts of Interest
References
- Cai, M.; Brown, T. Challenges in the mining and utilization of deep mineral resources. Engineering 2017, 3, 432–433. [Google Scholar] [CrossRef]
- Liu, C.; Zhao, G.; Pan, C.; Meng, X.; Xu, W.; Liu, W. Damage analysis and grading control technology of surrounding rock in high geo-stress roadway. Sci. Rep. 2025, 15, 1188. [Google Scholar]
- Si, X.; Luo, Y.; Gong, F.; Huang, J.; Han, K. Temperature effect of rockburst in granite caverns: Insights from reduced-scale model true-triaxial test. Geomech. Geophys. Geo-Energy Geo-Resour. 2024, 10, 26. [Google Scholar]
- Mogi, K. Fracture and flow of rocks under high triaxial compression. Geophys. Res. 1971, 76, 1255–1269. [Google Scholar] [CrossRef]
- Si, X.; Luo, Y.; Luo, S. Influence of lithology and bedding orientation on failure behavior of “D” shaped tunnel. Theor. Appl. Fract. Mech. 2024, 129, 104219. [Google Scholar]
- Liu, C.; Zhao, G.; Xu, W.; Meng, X.; Huang, S.; Zhou, J.; Wang, Y. Experimental investigation on failure process and spatio-temporal evolution of rockburst in granite with a prefabricated circular hole. J. Cent. South Univ. 2020, 27, 2930–2944. [Google Scholar]
- Haismon, B.; Chang, C. A new true triaxial cell for testing mechanical properties of rock, and its use to determine rock strength and deformability of Westerly granite. Int. J. Rock Mech. Min. Sci. 2000, 37, 285–296. [Google Scholar]
- Li, Z.; Wang, L.; Wang, L.; Fan, H.; Ren, B.; Ding, K. Study on the evolution of rock fracture under true triaxial intermediate principal stress. Int. J. Geomech. 2024, 24, 04023254. [Google Scholar]
- You, W.; Dai, F.; Liu, Y.; Du, H.; Jiang, R. Investigation of the influence of intermediate principal stress on thedynamic responses of rocks subjected to true triaxial stress state. Int. J. Min. Sci. Technol. 2021, 31, 913–926. [Google Scholar] [CrossRef]
- Takahashi, M.; Park, H.; Takahashi, N.; Fujii, Y. True triaxial tests–using permeability and extensional stress parameters to simulate geological history in rocks. Geosyst. Eng. 2013, 16, 75–82. [Google Scholar] [CrossRef]
- Feng, X.; Kong, R.; Zhang, X.; Yang, C. Experimental Study of Failure Differences in hard rock under true triaxial compression. Rock Mech. Rock Eng. 2019, 52, 2109–2122. [Google Scholar] [CrossRef]
- Chang, X.; Zhang, X.; Dang, F.; Zhang, B.; Chang, F. Failure behavior of sandstone specimens containing a single flaw under true triaxial compression. Rock Mech. Rock Eng. 2022, 55, 2111–2127. [Google Scholar]
- Li, X.; Feng, F.; Li, D.; Ranjith, P.; Roatami, J. Failure characteristics of granite influenced by sample height-to-width ratios and intermediate principal stress under true-triaxial unloading conditions. Rock Mech. Rock Eng. 2018, 51, 1321–1345. [Google Scholar]
- Liu, C.; Zhao, G.; Xu, W.; Meng, X.; Liu, Z.; Cheng, X.; Lin, G. Experimental study on failure characteristics of single-sided unloading rock under different intermediate principal stress conditions. Int. J. Min. Sci. Technol. 2023, 33, 275–287. [Google Scholar]
- Li, W.; Wang, Z.; Zhang, H.; Du, J.; Li, H.; Duan, M. Dilation and energy evolution mechanisms of sandstone under true-triaxial mining unloading conditions. Geomech. Geophys. Geo-Energ. Geo-Resour. 2024, 10, 58. [Google Scholar]
- Dong, C.; Fan, C.; Lu, X.; Zhao, G.; Qi, M.; Qin, R. Mechanical and energy evolution characteristics of sandstone under true triaxial cyclic loading. Appl. Sci. 2023, 13, 7230. [Google Scholar] [CrossRef]
- Jiang, B.; Gu, S.; Wang, L.; Zhang, G.; Li, W. Strainburst process of marble in tunnel-excavation-induced stresspath considering intermediate principal stress. J. Cent. South Univ. 2019, 26, 984–999. [Google Scholar] [CrossRef]
- Pan, C.; Liu, C.; Zhang, G.; Yuan, W.; Wang, X.; Meng, X. Fractal Characteristics and energy evolution analysis of rocks under true triaxial unloading conditions. Fractal Fract. 2024, 8, 387. [Google Scholar] [CrossRef]
- Luo, Y.; Huang, J.; Si, X.; Wu, W.; Li, S. Failure characteristics and energy properties of red sandstone under uniaxial compression: Water content effect and its application. Bull. Eng. Geol. Environ. 2025, 84, 57. [Google Scholar]
- Zhang, Z.; Zhang, R.; Xie, H.; Liu, J.; Were, P. Differences in the acoustic emission characteristics of rock salt compared with granite and marble during the damage evolution process. Environ. Earth Sci. 2015, 73, 6987–6999. [Google Scholar]
- Zhang, Q.; Meng, X.; Zhao, G. Energy evolution and fractal characteristics of sandstones under true triaxial cyclic loading and unloading. Fractal Fract. 2024, 8, 714. [Google Scholar] [CrossRef]
- Zhang, H.; Wang, Z.; Song, Z.; Zhang, Y.; Wang, T.; Zhao, W. Acoustic emission characteristics of different brittle rocks and its application in brittleness evaluation. Geomech. Geophys. Geo-Energ. Geo-Resour. 2021, 7, 48. [Google Scholar] [CrossRef]
- Li, D.; Wang, E.; Kong, X.; Wang, X.; Zhang, C. Fractal characteristics of acoustic emissions from coal under multi-stage true-triaxial compression. J. Geophys. Eng. 2018, 15, 2021–2032. [Google Scholar]
- Zhao, K.; Song, Y.; Yan, Y.; Gu, S.; Wang, J.; Guo, X.; Luo, C.; Suo, T. Mechanics and acoustic emission fractal characteristics of surrounding rock of tantalum-niobium mine under splitting condition. Nat. Resour. Res. 2022, 31, 149–162. [Google Scholar] [CrossRef]
- Zhang, Y.; Liu, Y.; Tao, Z.; Zhou, H.; Yang, Q. Fractal Characteristics and failure analysis of geomechanical model for arch dam based on acoustic emission technique. Int. J. Geomech. 2019, 19, 11. [Google Scholar] [CrossRef]
- Kantelhardt, J.W.; Zschiegner, S.A.; Koscielny-Bunde, E.; Havlin, S.; Bunde, A.; Stanley, H.E. Multifractal detrended fluctuation analysis of nonstationary time series. Phys. A 2002, 316, 87–114. [Google Scholar] [CrossRef]
- Xie, X.; Li, S.; Guo, J. Study on multiple fractal analysis and response characteristics of acoustic emission signals from goaf rock bodies. Sensors 2022, 22, 2746. [Google Scholar] [CrossRef]
- Cai, J.; Chen, Y.; Zhang, D. Study on the feature of acoustic emission of rock under compression experiment based on multi-fractal theory. Chin. J. Undergr. Space Eng. 2012, 8, 963–968. [Google Scholar]
- Lu, Y.; Kang, P.; Yang, L.; Hu, X.; Chen, H. Multi-scale characteristics and gas-solid interaction among multiple beds in a dual circulating fluidized bed reactor system. Chem. Eng. J. 2020, 385, 123715. [Google Scholar] [CrossRef]
- Feng, X.; Haimson, B.; Li, X.; Chang, C.; Ma, X.; Zhang, X.; Ingra-ham, M.; Suzuki, K. ISRM suggested method: Determining deformation and failure characteristics of rocks subjected to true triaxial compression. Rock Mech. Rock Eng. 2019, 52, 2011–2020. [Google Scholar] [CrossRef]
- Ohno, K.; Ohtsu, M. Crack classification in concrete based on acoustic emission. Constr. Build. Mater. 2010, 24, 2339–2346. [Google Scholar]
- Ohtsu, M. Recommendations of RILEM Technical Committee 212-ACD: Acoustic emission and related NDE techniques for crack detection and damage evaluation in concrete: Test method for classification of active cracks in concrete structures by acoustic emission. Mater. Struct. 2010, 43, 1187–1189. [Google Scholar]
- Liu, C.; Pan, C.; Zhao, G.; Xu, W.; Meng, X. Experimental study on the failure mechanism of roadway surrounding rock under true triaxial loading: Insights from acoustic emission (AE) characteristics. Measurement 2025, 31, 116727. [Google Scholar] [CrossRef]
- Grassberger, P. Generalized dimensions of strange attractors. Phys. Lett. A 1983, 97, 227–230. [Google Scholar]
- Lu, J.; Xie, H.; Li, M.; Li, C.; Gao, M.; Shang, D.; Li, J. Effect of microwave radiation on mechanical behaviors of tight fine sandstone subjected to true triaxial stress. Int. J. Rock Mech. Min. Sci. 2022, 152, 105063. [Google Scholar]
- Song, Z.; Ying, G. Influence of the intermediate principal stress on sandstone failure. Rock Mech. Rock Eng. 2019, 52, 3033–3046. [Google Scholar]


| Density (g/cm3) | Longitudinal Wave Velocity (m/s) | Porosity | Poisson Ratio | Tensile Strength (MPa) | Uniaxial Compressive Strength (MPa) | Elastic Modulus (GPa) |
|---|---|---|---|---|---|---|
| 2.39 | 2495.52 | 0.45% | 0.27 | 2.84 | 35.02 | 26.8 |
Disclaimer/Publisher’s Note: The statements, opinions and data contained in all publications are solely those of the individual author(s) and contributor(s) and not of MDPI and/or the editor(s). MDPI and/or the editor(s) disclaim responsibility for any injury to people or property resulting from any ideas, methods, instructions or products referred to in the content. |
© 2025 by the authors. Licensee MDPI, Basel, Switzerland. This article is an open access article distributed under the terms and conditions of the Creative Commons Attribution (CC BY) license (https://creativecommons.org/licenses/by/4.0/).
Share and Cite
Liu, C.; Zhao, G.; Pan, C.; Meng, X.; Xu, W. Experimental Study of Rock Failure and Fractal Characteristics Under True Triaxial Unloading. Fractal Fract. 2025, 9, 182. https://doi.org/10.3390/fractalfract9030182
Liu C, Zhao G, Pan C, Meng X, Xu W. Experimental Study of Rock Failure and Fractal Characteristics Under True Triaxial Unloading. Fractal and Fractional. 2025; 9(3):182. https://doi.org/10.3390/fractalfract9030182
Chicago/Turabian StyleLiu, Chongyan, Guangming Zhao, Cheng Pan, Xiangrui Meng, and Wensong Xu. 2025. "Experimental Study of Rock Failure and Fractal Characteristics Under True Triaxial Unloading" Fractal and Fractional 9, no. 3: 182. https://doi.org/10.3390/fractalfract9030182
APA StyleLiu, C., Zhao, G., Pan, C., Meng, X., & Xu, W. (2025). Experimental Study of Rock Failure and Fractal Characteristics Under True Triaxial Unloading. Fractal and Fractional, 9(3), 182. https://doi.org/10.3390/fractalfract9030182