

Multi-Focus Image Fusion Based on Dual-Channel Rybak Neural Network and Consistency Verification in NSCT Domain


Abstract
1. Introduction
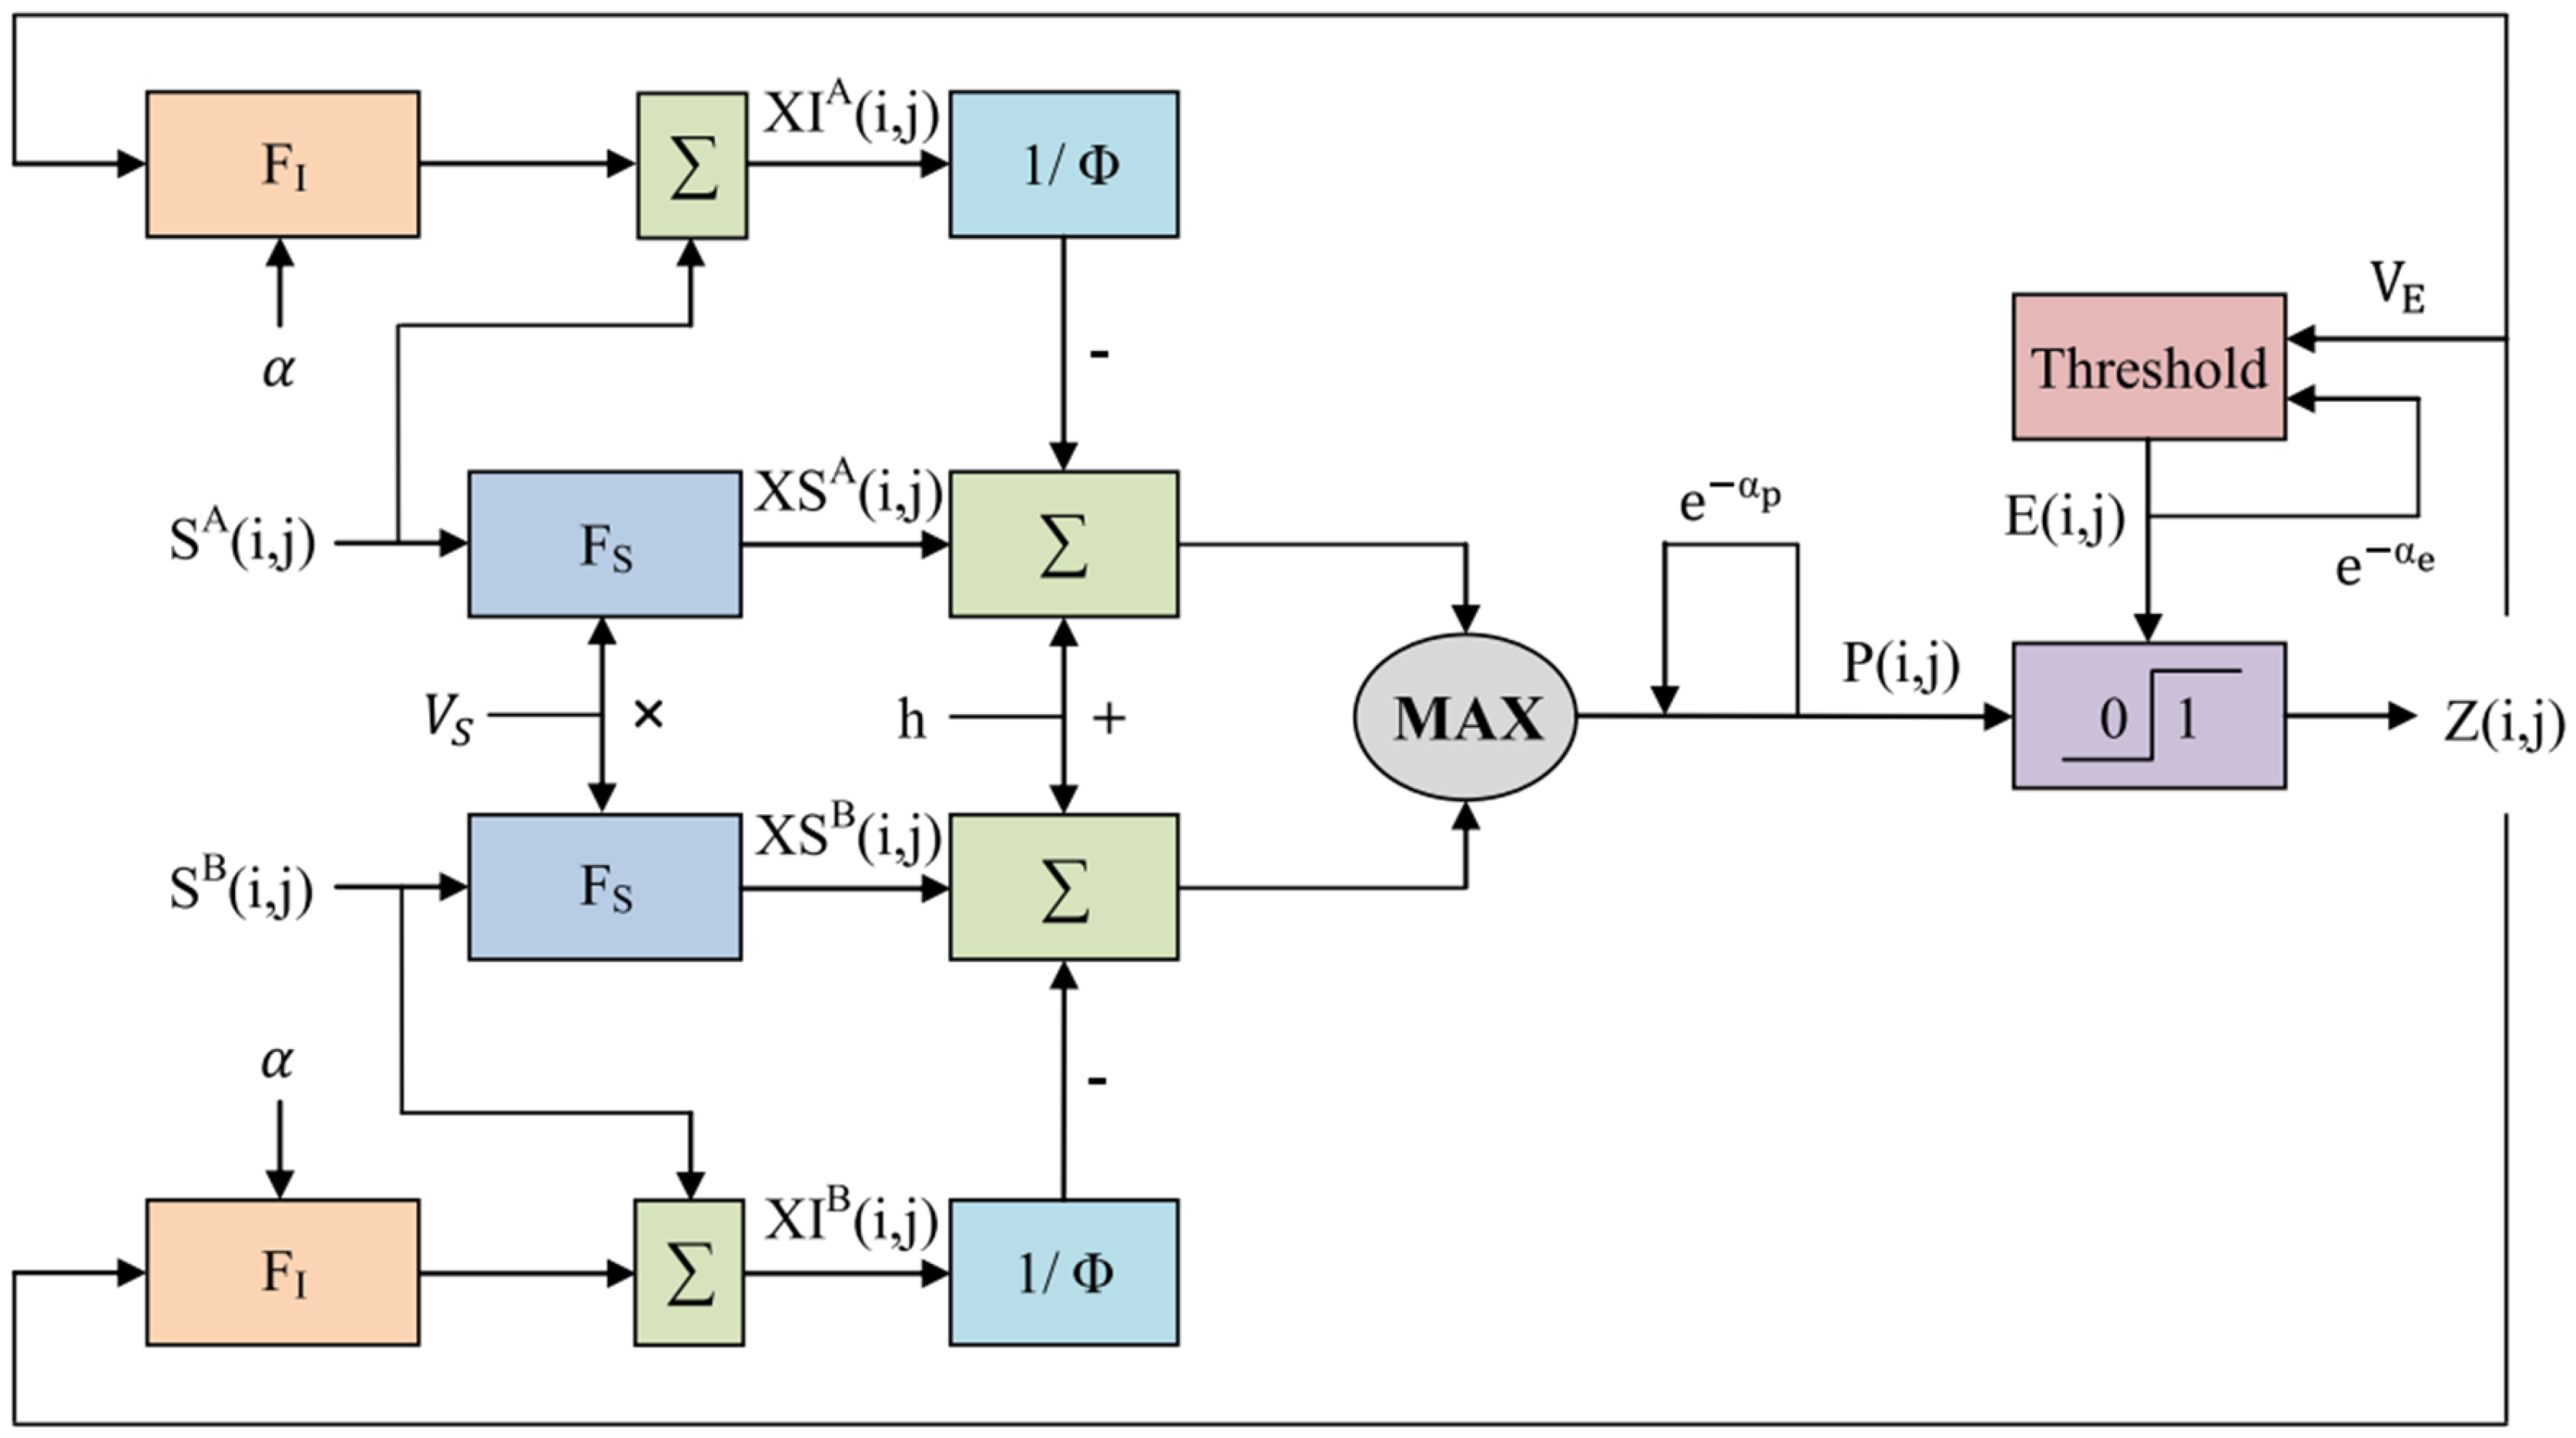
2. Dual-Channel Rybak Neural Network
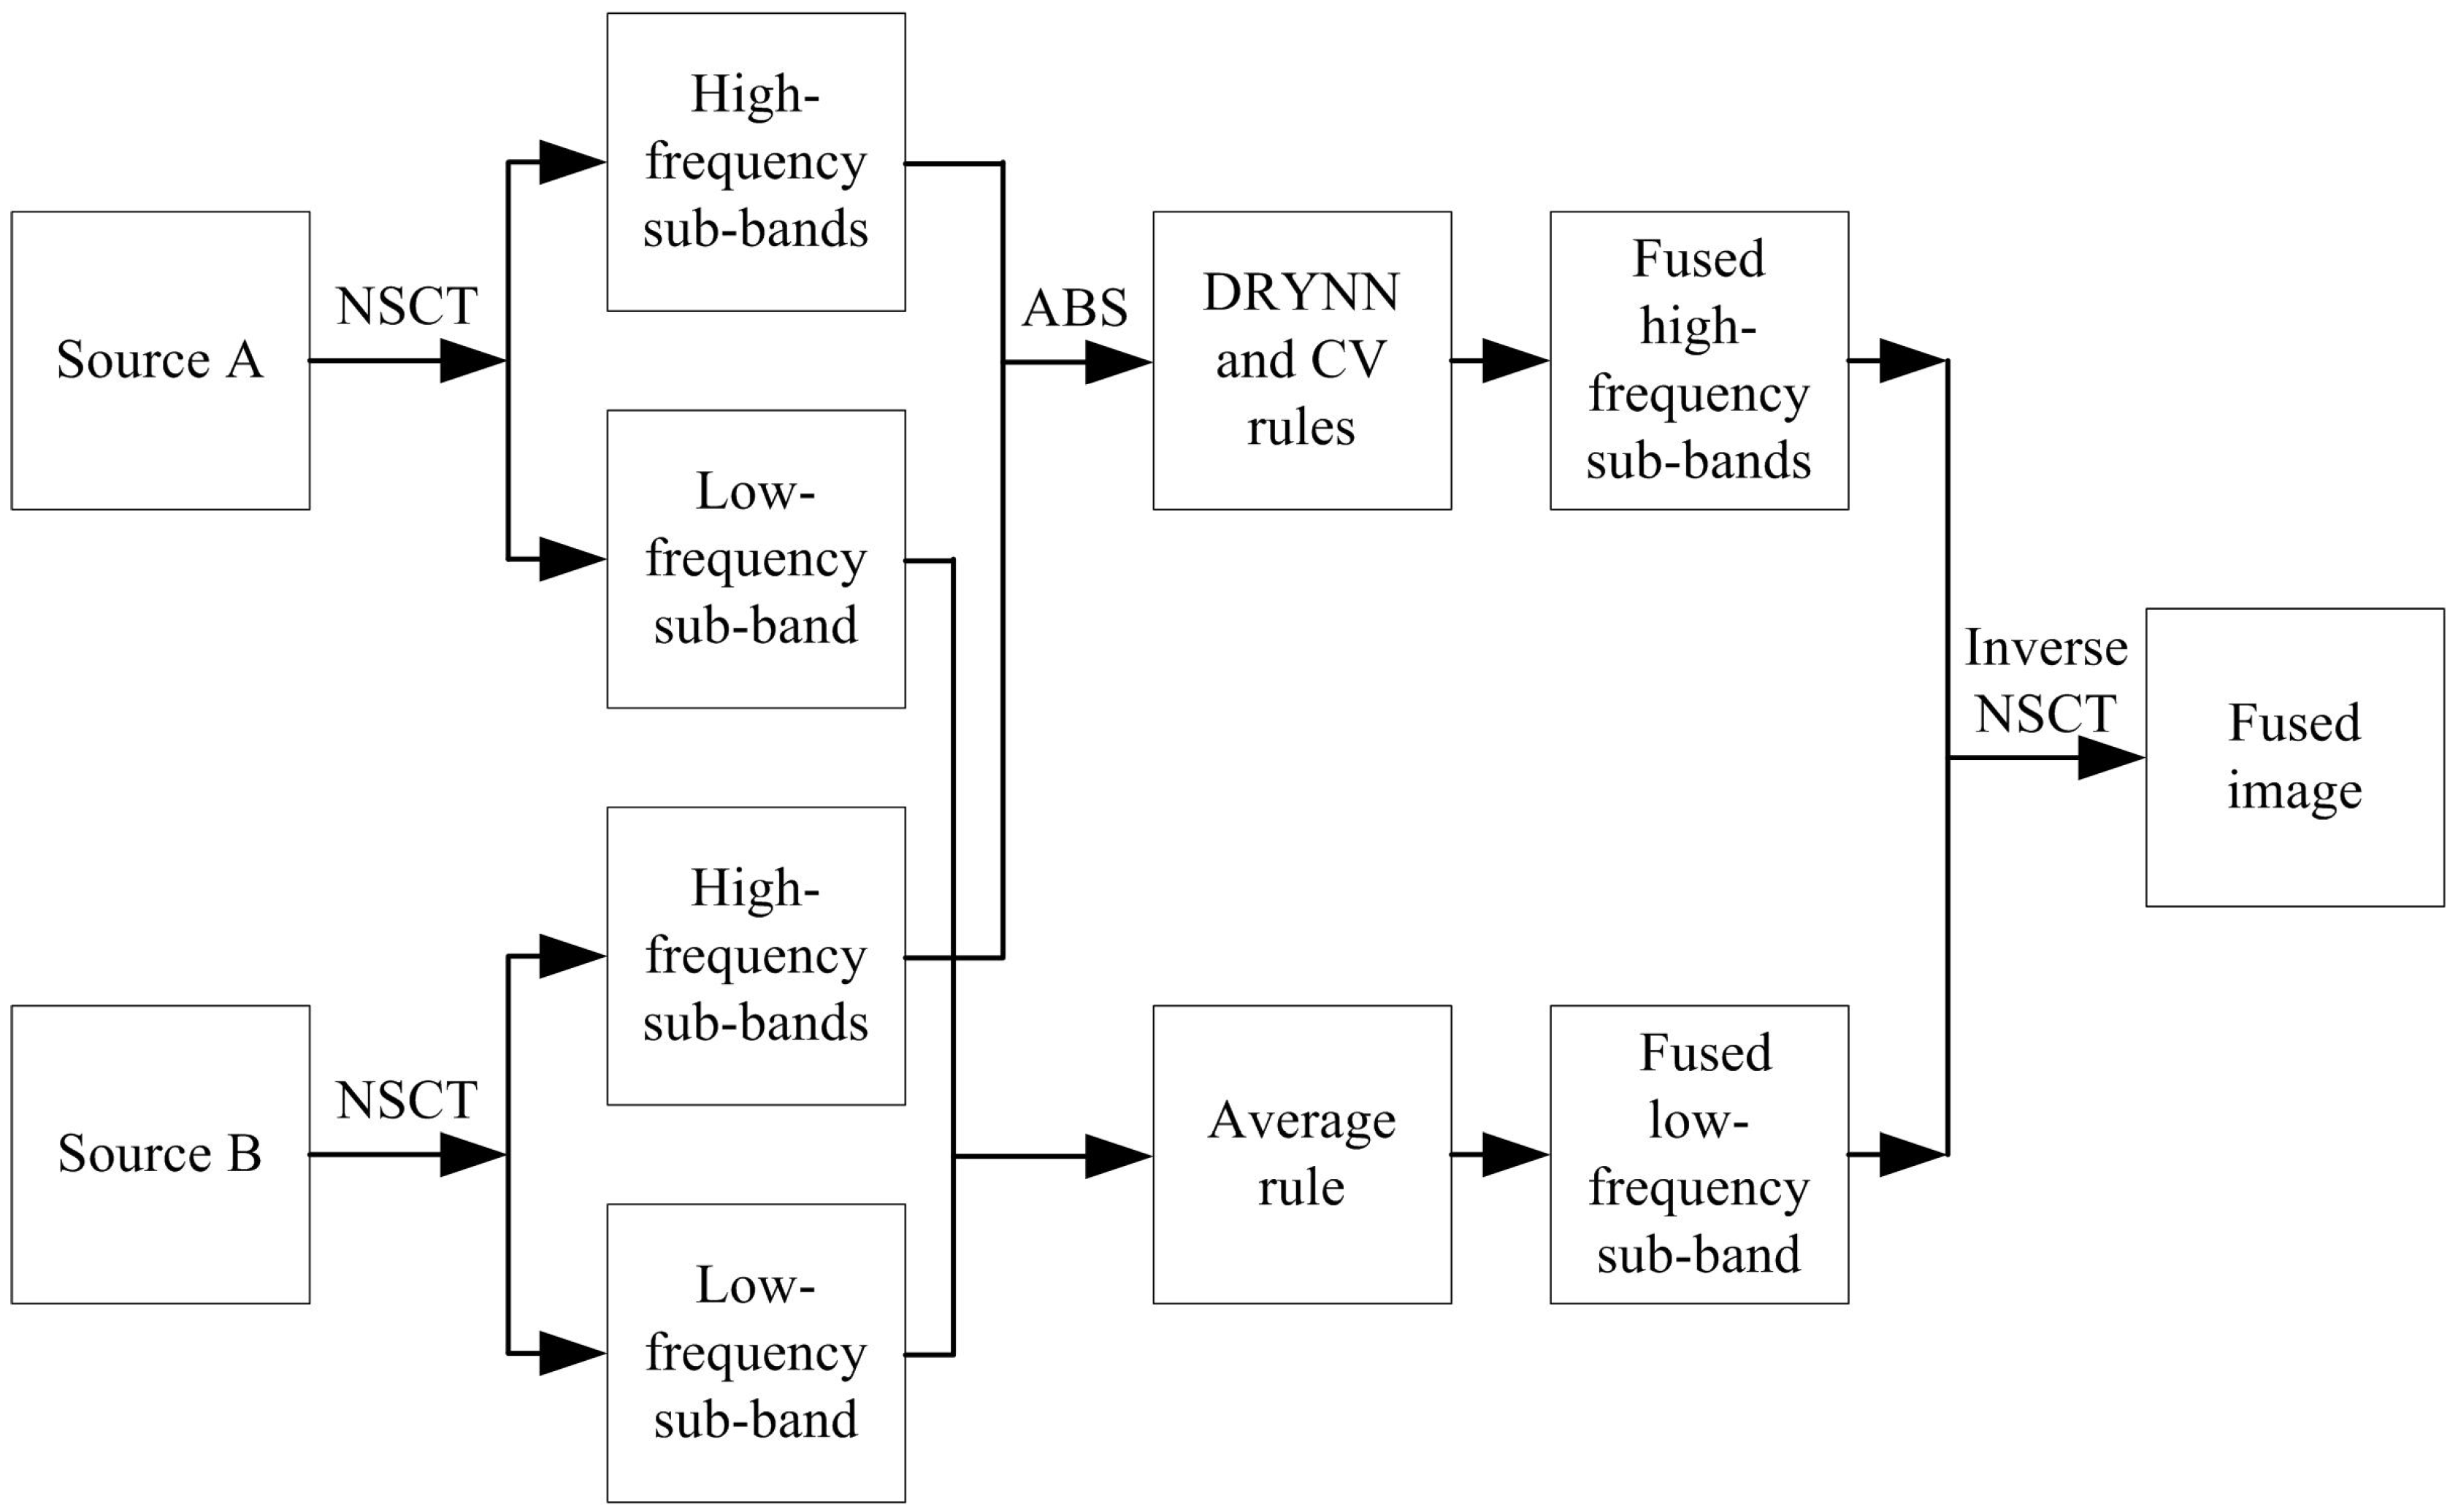
3. Proposed Fusion Method
3.1. NSCT Decomposition
3.2. High-Frequency Sub-Band Fusion
3.3. Low-Frequency Sub-Band Fusion
3.4. Inverse NSCT
4. Experimental Results and Analysis
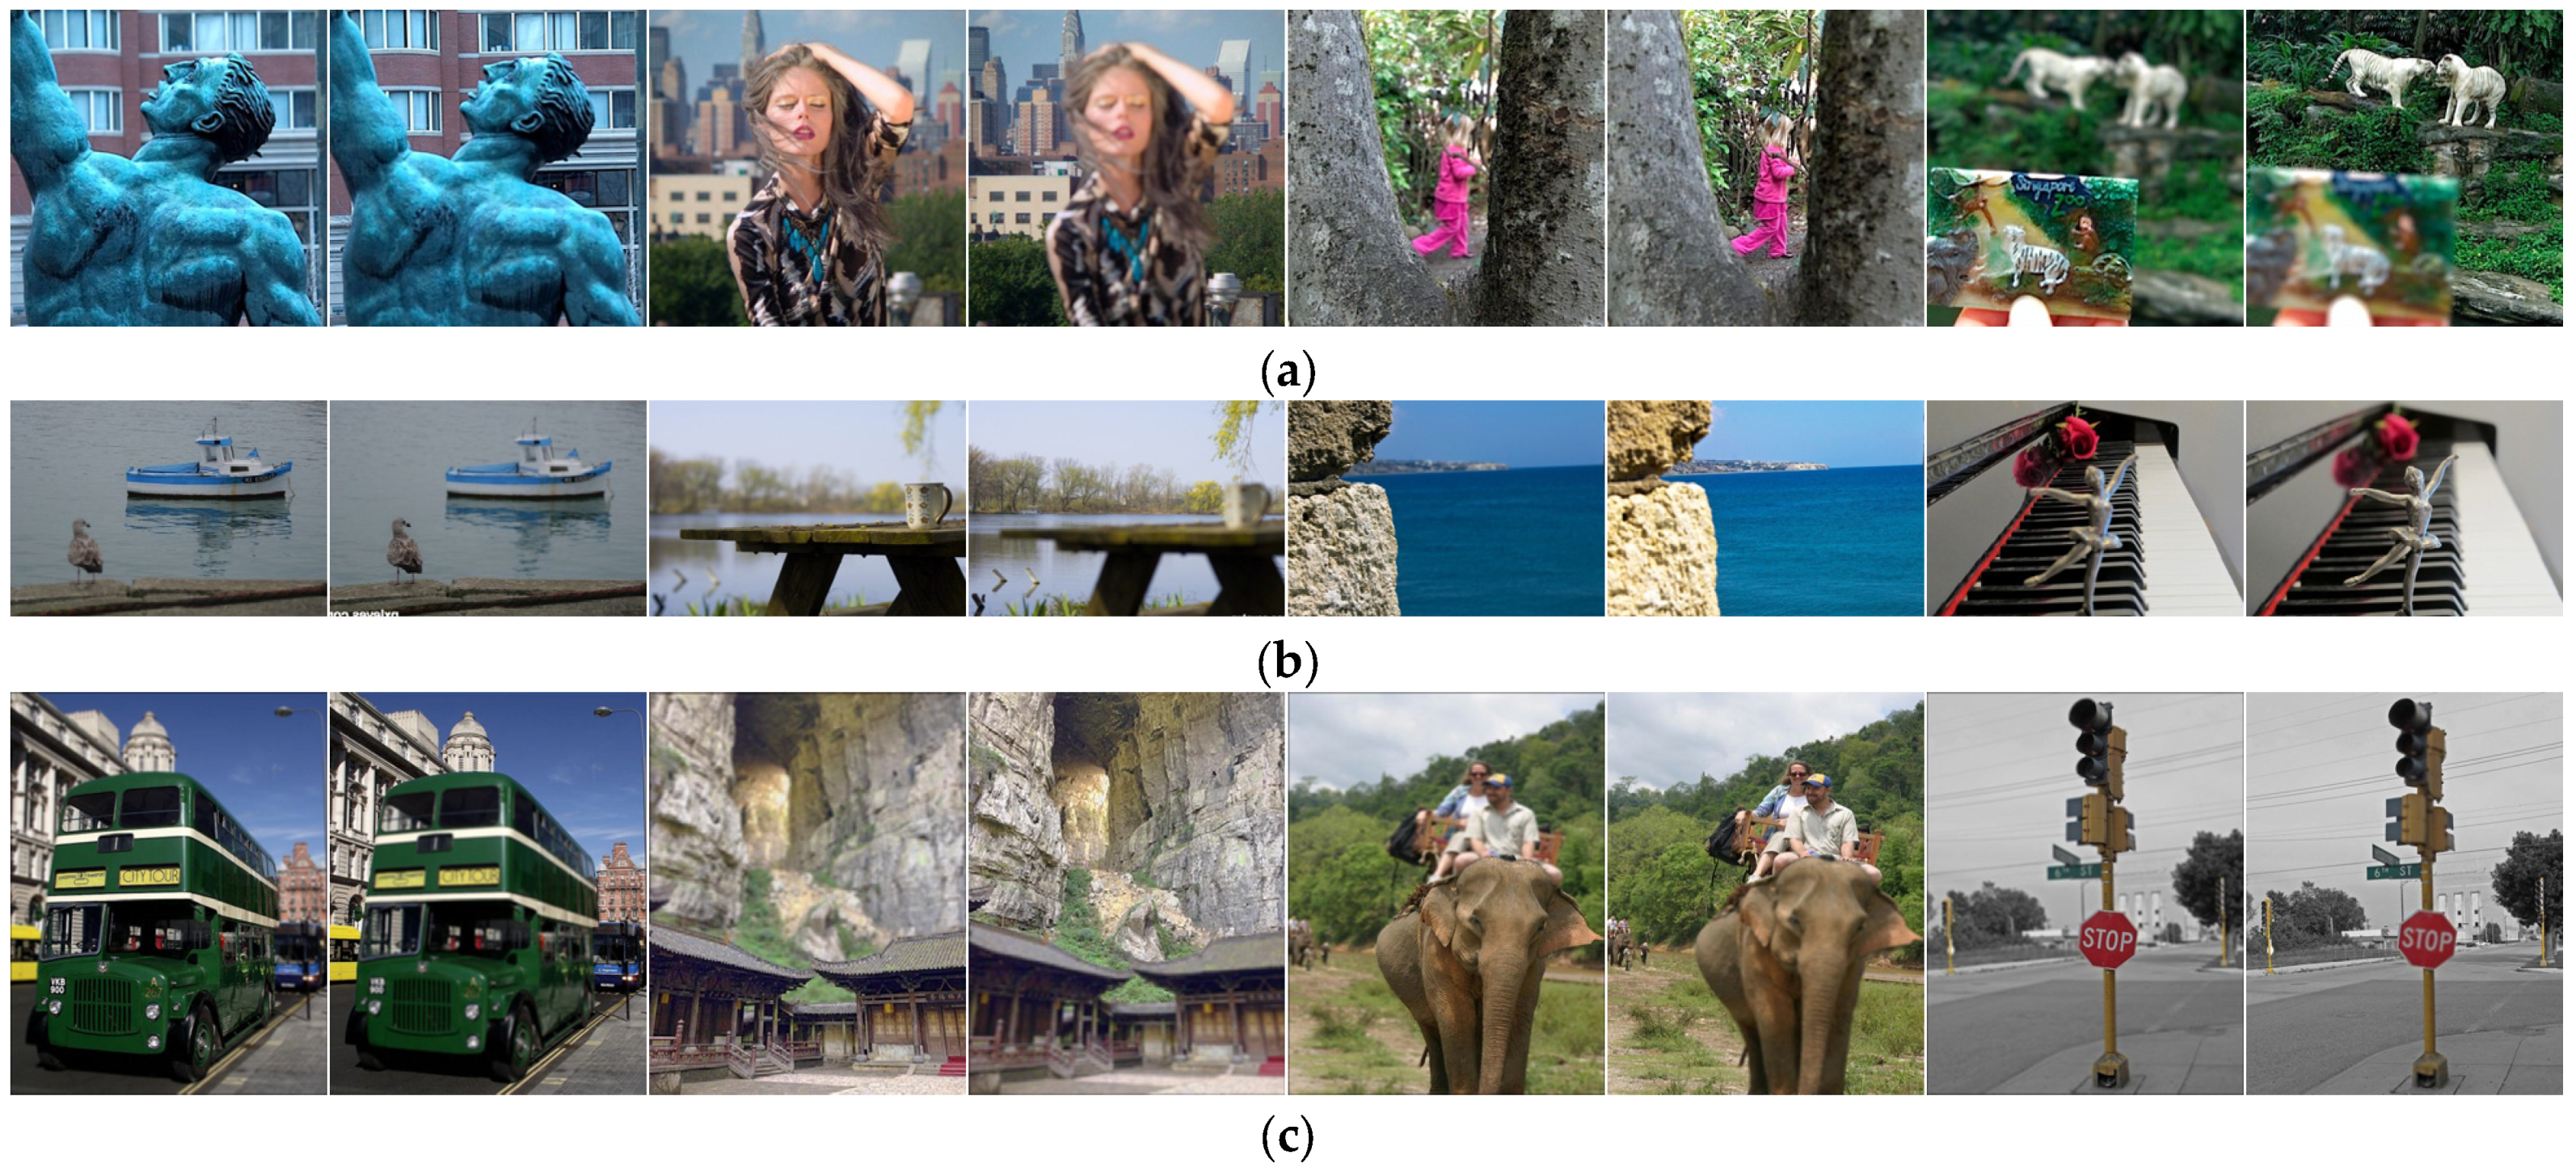
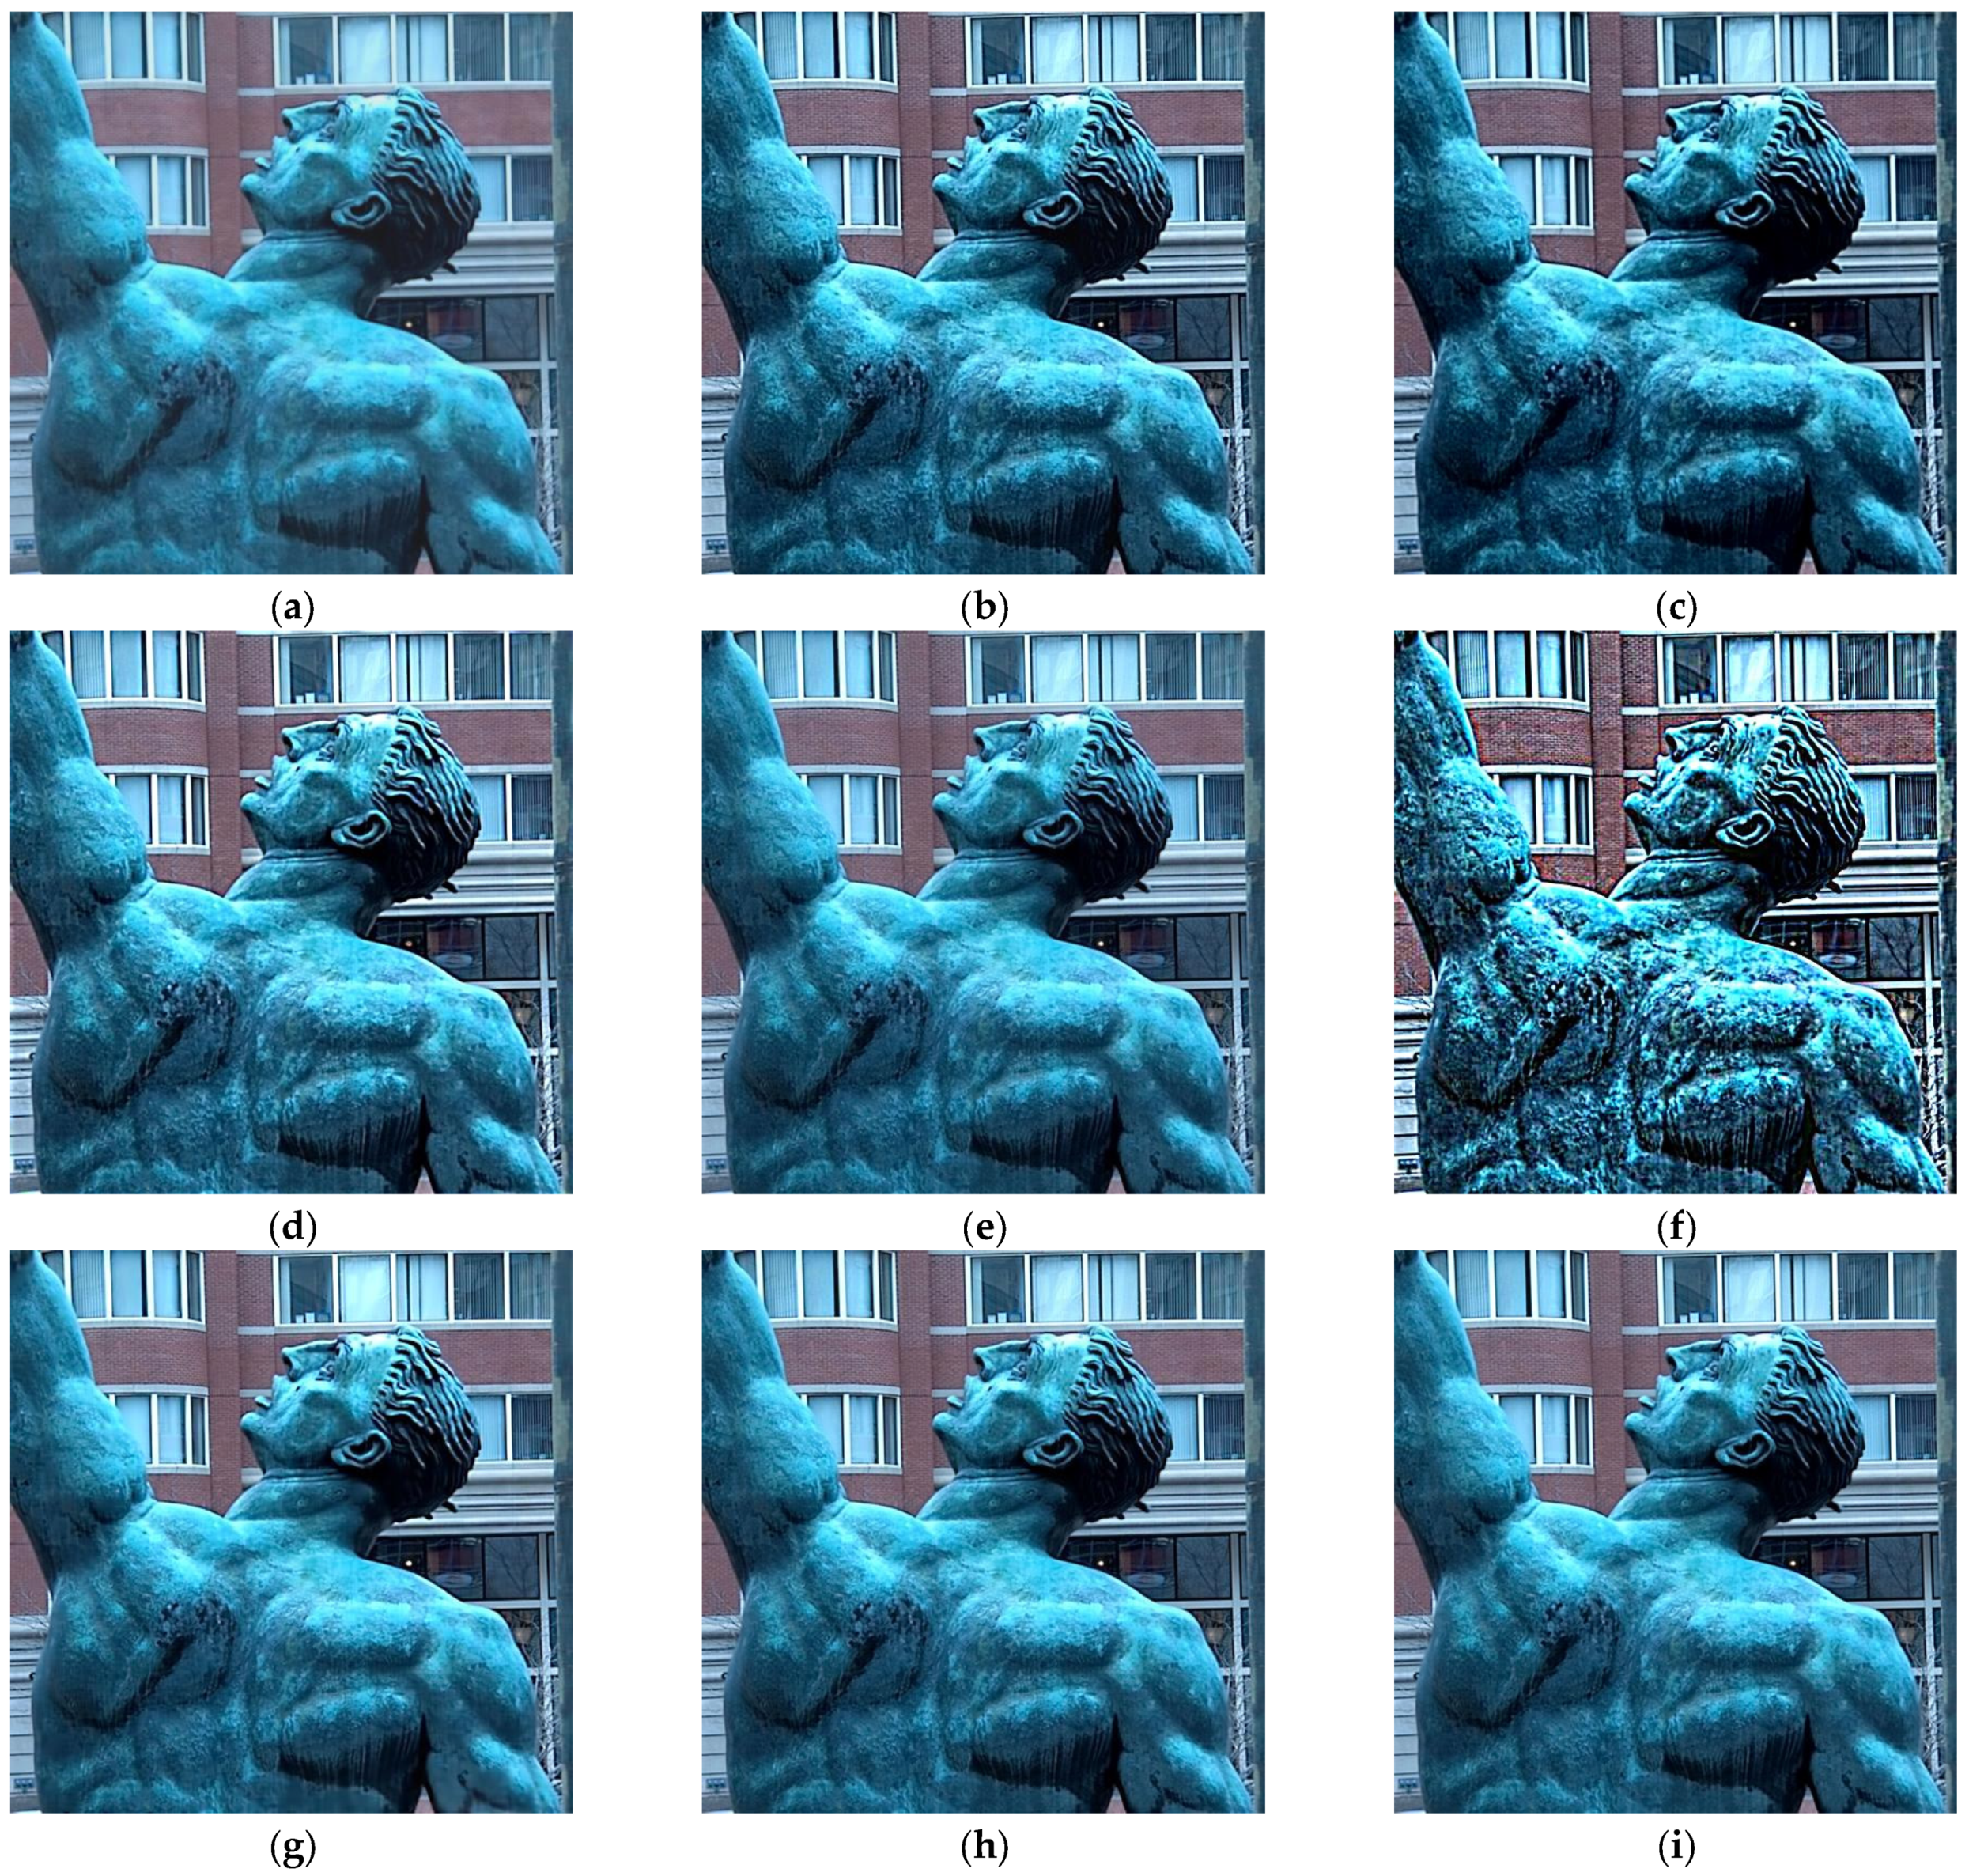
4.1. Results on Lytro Dataset
4.2. Results on MFFW Dataset
4.3. Results on MFI-WHU Dataset
4.4. Ablation Experiment
4.5. Extended Experiments
5. Conclusions
Author Contributions
Funding
Data Availability Statement
Conflicts of Interest
References
- Wang, W.; Deng, L.; Vivone, G. A general image fusion framework using multi-task semi-supervised learning. Inf. Fusion 2024, 108, 102414. [Google Scholar] [CrossRef]
- Wu, X.; Cao, Z.; Huang, T.; Deng, L.; Chanussot, J.; Vivone, G. Fully-connected transformer for multi-source image fusion. IEEE Trans. Pattern Anal. Mach. Intell. 2025, 47, 2071–2088. [Google Scholar] [CrossRef] [PubMed]
- Vivone, G.; Deng, L. Deep learning in remote sensing image fusion: Methods, protocols, data, and future perspectives. IEEE Geosci. Remote Sens. Mag. 2025, 13, 269–310. [Google Scholar] [CrossRef]
- Matteo, C.; Giuseppe, G.; Gemine, V. Hyperspectral pansharpening: Critical review, tools, and future perspectives. IEEE Geosci. Remote Sens. Mag. 2025, 13, 311–338. [Google Scholar]
- Jie, Y.; Xu, Y.; Li, X.; Zhou, F.; Lv, J.; Li, H. FS-Diff: Semantic guidance and clarity-aware simultaneous multimodal image fusion and super-resolution. Inf. Fusion 2025, 121, 103146. [Google Scholar] [CrossRef]
- Zhang, X.; Yan, H. Medical image fusion and noise suppression with fractional-order total variation and multi-scale decomposition. IET Image Process. 2021, 15, 1688–1701. [Google Scholar] [CrossRef]
- Jie, Y.; Li, X.; Wang, M.; Zhou, F.; Tan, H. Medical image fusion based on extended difference-of-Gaussians and edge-preserving. Expert Syst. Appl. 2023, 227, 120301. [Google Scholar] [CrossRef]
- Zheng, K.; Cheng, J.; Liu, Y. Unfolding coupled convolutional sparse representation for multi-focus image fusion. Inf. Fusion 2025, 118, 102974. [Google Scholar] [CrossRef]
- Li, B.; Zhang, L.; Liu, J.; Peng, H. Multi-focus image fusion with parameter adaptive dual channel dynamic threshold neural P systems. Neural Netw. 2024, 179, 106603. [Google Scholar] [CrossRef]
- Zhang, X.; He, H.; Zhang, J. Multi-focus image fusion based on fractional order differentiation and closed image matting. ISA Trans. 2022, 129, 703–714. [Google Scholar] [CrossRef]
- Liu, J.; Wu, G.; Liu, Z.; Wang, D.; Jiang, Z.; Ma, L.; Zhong, W.; Fan, X.; Liu, R. Infrared and visible image fusion: From data compatibility to task adaption. IEEE Trans. Pattern Anal. Mach. Intell. 2025, 47, 2349–2369. [Google Scholar] [CrossRef] [PubMed]
- Yan, H.; Zhang, J.; Zhang, X. Injected infrared and visible image fusion via L1 decomposition model and guided filtering. IEEE Trans. Comput. Imaging 2022, 8, 162–173. [Google Scholar] [CrossRef]
- Yan, H.; Zhang, X. Adaptive fractional multi-scale edge-preserving decomposition and saliency detection fusion algorithm. ISA Trans. 2020, 107, 160–172. [Google Scholar] [CrossRef] [PubMed]
- Zhang, X.; Yan, H.; He, H. Multi-focus image fusion based on fractional-order derivative and intuitionistic fuzzy sets. Front. Inf. Technol. Electron. Eng. 2020, 21, 834–843. [Google Scholar] [CrossRef]
- Li, L.; Zhao, X.; Hou, H.; Zhang, X.; Lv, M.; Jia, Z.; Ma, H. Fractal dimension-based multi-focus image fusion via coupled neural P systems in NSCT domain. Fractal Fract. 2024, 8, 554. [Google Scholar] [CrossRef]
- Zhang, X. Deep learning-based multi-focus image fusion: A survey and a comparative study. IEEE Trans. Pattern Anal. Mach. Intell. 2022, 44, 4819–4838. [Google Scholar] [CrossRef]
- Luo, F.; Zhao, B. A review on multi-focus image fusion using deep learning. Neurocomputing 2025, 618, 129125. [Google Scholar] [CrossRef]
- Zhai, H.; Zhang, G.; Zeng, Z.; Xu, Z.; Fang, A. LSKN-MFIF: Large selective kernel network for multi-focus image fusion. Neurocomputing 2025, 635, 129984. [Google Scholar] [CrossRef]
- Quan, Y.; Wan, X.; Tang, Z.; Liang, J.; Ji, H. Multi-focus image fusion via explicit defocus blur modelling. Proc. AAAI Conf. Artif. Intell. 2025, 39, 6657–6665. [Google Scholar] [CrossRef]
- Tang, L.; Zhang, H.; Xu, H.; Ma, J. Deep learning-based image fusion: A survey. J. Image Graph. 2023, 28, 3–36. [Google Scholar] [CrossRef]
- Li, L.; Ma, H.; Jia, Z.; Si, Y. A novel multiscale transform decomposition based multi-focus image fusion framework. Multimed. Tools Appl. 2021, 80, 12389–12409. [Google Scholar] [CrossRef]
- Li, L.; Si, Y.; Wang, L.; Jia, Z.; Ma, H. A novel approach for multi-focus image fusion based on SF-PAPCNN and ISML in NSST domain. Multimed. Tools Appl. 2020, 79, 24303–24328. [Google Scholar] [CrossRef]
- Li, L.; Shi, Y.; Lv, M.; Jia, Z.; Liu, M.; Zhao, X.; Zhang, X.; Ma, H. Infrared and visible image fusion via sparse representation and guided filtering in Laplacian pyramid domain. Remote Sens. 2024, 16, 3804. [Google Scholar] [CrossRef]
- Li, L.; Song, S.; Lv, M.; Jia, Z.; Ma, H. Multi-focus image fusion based on fractal dimension and parameter adaptive unit-linking dual-channel PCNN in curvelet transform domain. Fractal Fract. 2025, 9, 157. [Google Scholar] [CrossRef]
- Lv, M.; Li, L.; Jin, Q.; Jia, Z.; Chen, L.; Ma, H. Multi-focus image fusion via distance-weighted regional energy and structure tensor in NSCT domain. Sensors 2023, 23, 6135. [Google Scholar] [CrossRef]
- Li, L.; Lv, M.; Jia, Z.; Ma, H. Sparse representation-based multi-focus image fusion method via local energy in shearlet domain. Sensors 2023, 23, 2888. [Google Scholar] [CrossRef]
- Zhang, Z.; Li, H.; Xu, T.; Wu, X.; Kittler, J. DDBFusion: An unified image decomposition and fusion framework based ondual decomposition and Bézier curves. Inf. Fusion 2025, 114, 102655. [Google Scholar] [CrossRef]
- Quan, Y.; Wan, X.; Zheng, T.; Huang, Y.; Ji, H. Dual-path deep unsupervised learning for multi-focus image fusion. IEEE Trans. Multimed. 2025, 27, 1165–1176. [Google Scholar] [CrossRef]
- Xie, X.; Jiang, Q.; Chen, D.; Guo, B.; Li, P.; Zhou, S. StackMFF: End-to-end multi-focus image stack fusion network. Appl. Intell. 2025, 55, 503. [Google Scholar] [CrossRef]
- Panigrahy, C.; Seal, A.; Mahato, N.K. Fractal dimension based parameter adaptive dual channel PCNN for multi-focus image fusion. Opt. Lasers Eng. 2020, 133, 106141. [Google Scholar] [CrossRef]
- Joshua, A.; Balasubramaniam, P. An adaptive low-light image enhancement method via fusion of a new intuitionistic fuzzy generator and fractal-fractional derivative. Signal Image Video Process. 2025, 19, 233. [Google Scholar] [CrossRef]
- Xian, Y.; Zhao, G. Multi-focus image fusion based on visual depth and fractional-order differentiation operators embedding convolution norm. Signal Process. 2025, 233, 109955. [Google Scholar] [CrossRef]
- Lu, J.; Tan, K. Multi-focus image fusion using residual removal and fractional order differentiation focus measure. Signal Image Video Process. 2024, 18, 3395–3410. [Google Scholar] [CrossRef]
- Li, X.; Chen, H. Multi-focus image fusion via adaptive fractional differential and guided filtering. Multimed. Tools Appl. 2024, 83, 32923–32943. [Google Scholar] [CrossRef]
- Yu, L.; Zeng, Z. Fractional-order differentiation based sparse representation for multi-focus image fusion. Multimed. Tools Appl. 2022, 81, 4387–4411. [Google Scholar] [CrossRef]
- Ouyang, Y.; Zhai, H.; Hu, H. FusionGCN: Multi-focus image fusion using superpixel features generation GCN and pixel-level feature reconstruction CNN. Expert Syst. Appl. 2025, 262, 125665. [Google Scholar] [CrossRef]
- Li, S.; Huang, S. AFA–Mamba: Adaptive feature alignment with global–local Mamba for hyperspectral and LiDAR data classification. Remote Sens. 2024, 16, 4050. [Google Scholar] [CrossRef]
- Li, H.; Shen, T.; Zhang, Z.; Zhu, X.; Song, X. EDMF: A new benchmark for multi-focus images with the challenge of exposure difference. Sensors 2024, 24, 7287. [Google Scholar] [CrossRef]
- Zhang, H.; Le, Z. MFF-GAN: An unsupervised generative adversarial network with adaptive and gradient joint constraints for multi-focus image fusion. Inf. Fusion 2021, 66, 40–53. [Google Scholar] [CrossRef]
- Avci, D.; Sert, E.; Özyurt, F.; Avci, E. MFIF-DWT-CNN: Multi-focus image fusion based on discrete wavelet transform with deep convolutional neural network. Multimed. Tools Appl. 2024, 83, 10951–10968. [Google Scholar] [CrossRef]
- Goyal, N.; Goyal, N. Dual-channel Rybak neural network based medical image fusion. Opt. Laser Technol. 2025, 181, 112018. [Google Scholar] [CrossRef]
- Qi, Y.; Yang, Z.; Lian, J.; Guo, Y.; Sun, W.; Liu, J.; Wang, R.; Ma, Y. A new heterogeneous neural network model and its application in image enhancement. Neurocomputing 2021, 440, 336–350. [Google Scholar] [CrossRef]
- Sinha, A.; Agarwal, R.; Kumar, V.; Garg, N.; Pundir, D.S.; Singh, H.; Rani, R.; Panigrahy, C. Multi-modal medical image fusion using improved dual-channel PCNN. Med. Biol. Eng. Comput. 2024, 62, 2629–2651. [Google Scholar] [CrossRef] [PubMed]
- Li, X.; Zhou, F.; Tan, H. Multi-focus image fusion based on nonsubsampled contourlet transform and residual removal. Signal Process. 2021, 184, 108062. [Google Scholar] [CrossRef]
- Zafar, R.; Farid, M.S.; Khan, M.H. Multi-focus image fusion: Algorithms, evaluation, and a library. J. Imaging 2020, 6, 60. [Google Scholar] [CrossRef]
- Nejati, M.; Samavi, S.; Shirani, S. Multi-focus image fusion using dictionary-based sparse representation. Inf. Fusion 2015, 25, 72–84. [Google Scholar] [CrossRef]
- Xu, S.; Wei, X.; Zhang, C. MFFW: A newdataset for multi-focus image fusion. arXiv 2020, arXiv:2002.04780. [Google Scholar]
- Zhang, H.; Xu, H.; Xiao, Y. Rethinking the image fusion: A fast unified image fusion network based on proportional maintenance of gradient and intensity. In Proceedings of the Thirty-Fourth AAAI Conference on Artificial Intelligence (AAAI), New York, NY, USA, 7–12 February 2020; Volume 34, pp. 12797–12804. [Google Scholar]
- Xu, H.; Ma, J.; Jiang, J. U2Fusion: A unified unsupervised image fusion network. IEEE Trans. Pattern Anal. Mach. Intell. 2022, 44, 502–518. [Google Scholar] [CrossRef]
- Tang, H.; Liu, G.; Qian, Y. EgeFusion: Towards edge gradient enhancement in infrared and visible image fusion with multi-scale transform. IEEE Trans. Comput. Imaging 2024, 10, 385–398. [Google Scholar] [CrossRef]
- Jie, Y.; Li, X.; Tan, T.; Yang, L.; Wang, M. Multi-modality image fusion using fuzzy set theory and compensation dictionary learning. Opt. Laser Technol. 2025, 181, 112001. [Google Scholar] [CrossRef]
- Qu, X.; Yan, J.; Xiao, H. Image fusion algorithm based on spatial frequency-motivated pulse coupled neural networks in nonsubsampled contourlet transform domain. Acta Autom. Sin. 2008, 34, 1508–1514. [Google Scholar] [CrossRef]
- Liu, Z.; Blasch, E.; Xue, Z. Objective assessment of multiresolution image fusion algorithms for context enhancement in night vision: A comparative study. IEEE Trans. Pattern Anal. Mach. Intell. 2012, 34, 94–109. [Google Scholar] [CrossRef]
- Haghighat, M.; Razian, M. Fast-FMI: Non-reference image fusion metric. In Proceedings of the IEEE 8th International Conference on Application of Information and Communication Technologies, Astana, Kazakhstan, 15–17 October 2014; pp. 424–426. [Google Scholar]
- Chen, F.; Sha, Y.; Ji, H.; Peng, K.; Liang, X. Integrating multifractal features into machine learning for improved prediction. Fractal Fract. 2025, 9, 205. [Google Scholar] [CrossRef]
- Li, J.; Wang, C.; Su, W.; Ye, D.; Wang, Z. Uncertainty-aware self-attention model for time series prediction with missing values. Fractal Fract. 2025, 9, 181. [Google Scholar] [CrossRef]
- Bi, X.; Qie, R.; Tao, C.; Zhang, Z.; Xu, Y. Unsupervised multimodal UAV image registration via style transfer and cascade network. Remote Sens. 2025, 17, 2160. [Google Scholar] [CrossRef]
- Wadood, A.; Albalawi, H.; Alatwi, A.M.; Anwar, H.; Ali, T. Design of a novel fractional whale optimization-enhanced support vector regression (FWOA-SVR) model for accurate solar energy forecasting. Fractal Fract. 2025, 9, 35. [Google Scholar] [CrossRef]
- Zhang, X.; Dai, L. Image enhancement based on rough set and fractional order differentiator. Fractal Fract. 2022, 6, 214. [Google Scholar] [CrossRef]
- Zhang, X.; Liu, R.; Ren, J.; Gui, Q. Adaptive fractional image enhancement algorithm based on rough set and particle swarm optimization. Fractal Fract. 2022, 6, 100. [Google Scholar] [CrossRef]
- Zhang, X.; Boutat, D.; Liu, D. Applications of fractional operator in image processing and stability of control systems. Fractal Fract. 2023, 7, 359. [Google Scholar] [CrossRef]
- Tabirca, A.I.; Dumitrescu, C.; Radu, V. Enhancing banking transaction security with fractal-based image steganography using fibonacci sequences and discrete wavelet transform. Fractal Fract. 2025, 9, 95. [Google Scholar] [CrossRef]
- Li, L.; Lv, M.; Jia, Z.; Jin, Q.; Liu, M.; Chen, L.; Ma, H. An effective infrared and visible image fusion approach via rolling guidance filtering and gradient saliency map. Remote Sens. 2023, 15, 2486. [Google Scholar] [CrossRef]
- Heredia-Aguado, E.; Cabrera, J.J.; Jiménez, L.M.; Valiente, D.; Gil, A. Static early fusion techniques for visible and thermal images to enhance convolutional neural network detection: A performance analysis. Remote Sens. 2025, 17, 1060. [Google Scholar] [CrossRef]
- Li, L.; Ma, H. Saliency-guided nonsubsampled shearlet transform for multisource remote sensing image fusion. Sensors 2021, 21, 1756. [Google Scholar] [CrossRef] [PubMed]
- Zhang, X. Benchmarking and comparing multi-exposure image fusion algorithms. Inf. Fusion 2021, 74, 111–131. [Google Scholar] [CrossRef]
- Zhang, W.; Wang, C.; Zhu, J. MEF-CAAN: Multi-exposure image fusion based on a low-resolution context aggregation attention network. Sensors 2025, 25, 2500. [Google Scholar] [CrossRef]
- Yin, M.; Liu, X.; Liu, Y.; Chen, X. Medical image fusion with parameter-adaptive pulse coupled neural network in nonsubsampled shearlet transform domain. IEEE Trans. Instrum. Meas. 2019, 68, 49–64. [Google Scholar] [CrossRef]
- Zhu, Z.; Wang, Z.; Qi, G.; Mazur, N.; Yang, P.; Liu, Y. Brain tumor segmentation in MRI with multi-modality spatial information enhancement and boundary shape correction. Pattern Recognit. 2024, 153, 110553. [Google Scholar] [CrossRef]
- Zhu, Z.; He, X.; Qi, G.; Li, Y.; Cong, B.; Liu, Y. Brain tumor segmentation based on the fusion of deep semantics and edge information in multimodal MRI. Inf. Fusion 2023, 91, 376–387. [Google Scholar] [CrossRef]
- Liu, Y.; Wang, Z. A practical pan-sharpening method with wavelet transform and sparse representation. In Proceedings of the 2013 IEEE International Conference on Imaging Systems and Techniques (IST), Beijing, China, 22–23 October 2013; pp. 288–293. [Google Scholar]
- Vivone, G.; Dalla Mura, M.; Garzelli, A.; Restaino, R.; Scarpa, G. A new benchmark based on recent advances in multispectral pansharpening: Revisiting pansharpening with classical and emerging pansharpening methods. IEEE Geosci. Remote Sens. Mag. 2021, 9, 53–81. [Google Scholar] [CrossRef]
- Vivone, G. Robust band-dependent spatial-detail approaches for panchromatic sharpening. IEEE Trans. Geosci. Remote Sens. 2019, 57, 6421–6433. [Google Scholar] [CrossRef]
- Wen, X.; Ma, H.; Li, L. A three-branch pansharpening network based on spatial and frequency domain interaction. Remote Sens. 2025, 17, 13. [Google Scholar] [CrossRef]
- Wen, X.; Ma, H.; Li, L. A multi-stage progressive pansharpening network based on detail injection with redundancy reduction. Sensors 2024, 24, 6039. [Google Scholar] [CrossRef] [PubMed]
- Li, J.; Zhang, J.; Yang, C.; Liu, H.; Zhao, Y.; Ye, Y. Comparative analysis of pixel-level fusion algorithms and a new high-resolution dataset for SAR and optical image fusion. Remote Sens. 2023, 15, 5514. [Google Scholar] [CrossRef]
- Li, L.; Ma, H.; Jia, Z. Multiscale geometric analysis fusion-based unsupervised change detection in remote sensing images via FLICM model. Entropy 2022, 24, 291. [Google Scholar] [CrossRef]
- Chen, Z.; Chen, H.; Leng, J.; Zhang, X.; Gao, Q.; Dong, W. VMMCD: VMamba-based multi-scale feature guiding fusion network for remote sensing change detection. Remote Sens. 2025, 17, 1840. [Google Scholar] [CrossRef]
- Li, L.; Ma, H.; Jia, Z. Change detection from SAR images based on convolutional neural networks guided by saliency enhancement. Remote Sens. 2021, 13, 3697. [Google Scholar] [CrossRef]
- Zhong, H.; Wu, C.; Xiao, Z. LRNet: Change detection in high-resolution remote sensing imagery via a localization-then-refinement strategy. Remote Sens. 2025, 17, 1849. [Google Scholar] [CrossRef]
- Li, L.; Ma, H.; Zhang, X.; Zhao, X.; Lv, M.; Jia, Z. Synthetic aperture radar image change detection based on principal component analysis and two-level clustering. Remote Sens. 2024, 16, 1861. [Google Scholar] [CrossRef]
- He, Y.; Li, H.; Zhang, M.; Liu, S.; Zhu, C.; Xin, B.; Wang, J.; Wu, Q. Hyperspectral and multispectral remote sensing image fusion based on a retractable spatial–spectral transformer network. Remote Sens. 2025, 17, 1973. [Google Scholar] [CrossRef]
- Li, J.; Zheng, K.; Gao, L.; Han, Z.; Li, Z.; Chanussot, J. Enhanced deep image prior for unsupervised hyperspectral image super-resolution. IEEE Trans. Geosci. Remote Sens. 2025, 63, 5504218. [Google Scholar] [CrossRef]
- Vivone, G. Multispectral and hyperspectral image fusion in remote sensing: A survey. Inf. Fusion 2023, 89, 405–417. [Google Scholar] [CrossRef]
- Vivone, G.; Garzelli, A.; Xu, Y.; Liao, W.; Chanussot, J. Panchromatic and hyperspectral image fusion: Outcome of the 2022 WHISPERS hyperspectral pansharpening challenge. IEEE J. Sel. Top. Appl. Earth Obs. Remote Sens. 2023, 16, 166–179. [Google Scholar] [CrossRef]
- Shen, X.; Chen, L.; Liu, H.; Zhou, X.; Vivione, G.; Chanussot, J. Iteratively regularizing hyperspectral and multispectral image fusion with framelets. IEEE J. Sel. Top. Appl. Earth Obs. Remote Sens. 2025, 18, 5331–5346. [Google Scholar] [CrossRef]

| Year | |||||||||||
|---|---|---|---|---|---|---|---|---|---|---|---|
| PMGI | 2020 | 0.5711 | 0.6649 | 0.6497 | 0.9142 | 6.0308 | 133.2364 | 0.8231 | 0.8011 | 0.6796 | 26.8846 |
| MFFGAN | 2021 | 0.6815 | 0.6900 | 0.8314 | 0.9171 | 5.6035 | 30.4630 | 0.8209 | 0.7276 | 0.8118 | 33.2931 |
| U2Fusion | 2022 | 0.6314 | 0.5478 | 0.7841 | 0.9080 | 5.4628 | 19.5930 | 0.8202 | 0.7097 | 0.7443 | 35.2098 |
| XDoG | 2023 | 0.6829 | 0.7004 | 0.8064 | 0.9147 | 5.3467 | 60.4093 | 0.8197 | 0.6935 | 0.8205 | 30.3198 |
| NSCTST | 2023 | 0.7691 | 0.8113 | 0.8783 | 0.9220 | 7.1417 | 26.0130 | 0.8301 | 0.9302 | 0.8994 | 33.9789 |
| EgeFusion | 2024 | 0.3043 | 0.3744 | 0.4831 | 0.8674 | 2.4199 | 93.0763 | 0.8100 | 0.3124 | 0.5134 | 28.4424 |
| FDFusion | 2025 | 0.7168 | 0.7686 | 0.8546 | 0.9179 | 6.1315 | 33.0450 | 0.8236 | 0.7983 | 0.8240 | 32.9397 |
| CVTFD | 2025 | 0.7597 | 0.8054 | 0.8793 | 0.9219 | 7.0831 | 19.6925 | 0.8296 | 0.9231 | 0.8902 | 35.1878 |
| Proposed | 0.7721 | 0.8268 | 0.8799 | 0.9229 | 7.4256 | 18.9023 | 0.8320 | 0.9675 | 0.9044 | 35.3657 |
| Year | |||||||||||
|---|---|---|---|---|---|---|---|---|---|---|---|
| PMGI | 2020 | 0.3901 | 0.5656 | 0.4736 | 0.8815 | 5.8641 | 75.3956 | 0.8225 | 0.8004 | 0.4620 | 32.4782 |
| MFFGAN | 2021 | 0.6642 | 0.6457 | 0.8409 | 0.8915 | 6.0604 | 34.3748 | 0.8237 | 0.8047 | 0.7125 | 33.5508 |
| U2Fusion | 2022 | 0.6143 | 0.5682 | 0.7835 | 0.8844 | 5.7765 | 59.4424 | 0.8221 | 0.7725 | 0.6657 | 31.2098 |
| XDoG | 2023 | 0.6885 | 0.6467 | 0.8349 | 0.8926 | 5.6685 | 61.2410 | 0.8216 | 0.7538 | 0.7444 | 30.5692 |
| NSCTST | 2023 | 0.7388 | 0.7288 | 0.8745 | 0.8986 | 6.7128 | 31.3985 | 0.8279 | 0.8946 | 0.8100 | 33.6375 |
| EgeFusion | 2024 | 0.3576 | 0.4034 | 0.5032 | 0.8472 | 3.2191 | 77.8597 | 0.8120 | 0.4248 | 0.5405 | 29.2757 |
| FDFusion | 2025 | 0.6586 | 0.6127 | 0.8075 | 0.8898 | 6.1834 | 35.9713 | 0.8244 | 0.8252 | 0.6179 | 32.9763 |
| CVTFD | 2025 | 0.7285 | 0.7213 | 0.8773 | 0.8988 | 6.7296 | 22.2336 | 0.8279 | 0.8964 | 0.7984 | 35.0684 |
| Proposed | 0.7479 | 0.7515 | 0.8820 | 0.9004 | 7.0950 | 21.4427 | 0.8304 | 0.9455 | 0.8338 | 35.2352 |
| Year | |||||||||||
|---|---|---|---|---|---|---|---|---|---|---|---|
| PMGI | 2020 | 0.5632 | 0.5018 | 0.6143 | 0.8917 | 4.0362 | 94.2825 | 0.8121 | 0.6143 | 0.2748 | 28.3865 |
| MFFGAN | 2021 | 0.5832 | 0.5732 | 0.7064 | 0.9005 | 4.4393 | 204.2317 | 0.8136 | 0.6631 | 0.3664 | 25.0296 |
| U2Fusion | 2022 | 0.5112 | 0.5385 | 0.5840 | 0.8936 | 4.6178 | 201.6128 | 0.8143 | 0.6769 | 0.3784 | 25.0856 |
| XDoG | 2023 | 0.6186 | 0.5703 | 0.7572 | 0.9044 | 4.1792 | 47.7266 | 0.8127 | 0.6293 | 0.4087 | 31.3432 |
| NSCTST | 2023 | 0.6558 | 0.6336 | 0.8227 | 0.9045 | 4.6722 | 25.0239 | 0.8147 | 0.7088 | 0.4141 | 34.1473 |
| EgeFusion | 2024 | 0.2732 | 0.3643 | 0.3210 | 0.8493 | 2.4442 | 78.3106 | 0.8077 | 0.3565 | 0.3259 | 29.1926 |
| FDFusion | 2025 | 0.6066 | 0.5264 | 0.7936 | 0.9033 | 4.6779 | 27.4425 | 0.8146 | 0.7136 | 0.3514 | 33.7466 |
| CVTFD | 2025 | 0.6363 | 0.6007 | 0.7992 | 0.9019 | 4.6218 | 17.0483 | 0.8144 | 0.6994 | 0.3871 | 35.8140 |
| Proposed | 0.7272 | 0.6549 | 0.8422 | 0.9092 | 5.4123 | 12.1897 | 0.8183 | 0.8201 | 0.5472 | 37.2709 |
| Year | |||||||||||
|---|---|---|---|---|---|---|---|---|---|---|---|
| PMGI | 2020 | 0.3807 | 0.5057 | 0.4245 | 0.8675 | 5.0472 | 80.9829 | 0.8178 | 0.7244 | 0.3554 | 36.3612 |
| MFFGAN | 2021 | 0.5905 | 0.5851 | 0.7557 | 0.8742 | 5.0498 | 82.9576 | 0.8179 | 0.7094 | 0.4887 | 29.8959 |
| U2Fusion | 2022 | 0.5537 | 0.5499 | 0.7076 | 0.8690 | 4.8894 | 94.3035 | 0.8171 | 0.6992 | 0.4784 | 29.1532 |
| XDoG | 2023 | 0.6090 | 0.5886 | 0.7512 | 0.8745 | 5.0119 | 86.1245 | 0.8178 | 0.7038 | 0.5146 | 29.2046 |
| NSCTST | 2023 | 0.6408 | 0.6357 | 0.7976 | 0.8787 | 5.2548 | 65.3151 | 0.8189 | 0.7410 | 0.5402 | 30.6343 |
| EgeFusion | 2024 | 0.3517 | 0.4213 | 0.4581 | 0.8380 | 3.3785 | 77.3397 | 0.8115 | 0.4685 | 0.4378 | 29.3955 |
| FDFusion | 2025 | 0.5895 | 0.5710 | 0.7053 | 0.8735 | 5.3144 | 65.4062 | 0.8194 | 0.7504 | 0.4445 | 30.6006 |
| CVTFD | 2025 | 0.6290 | 0.6276 | 0.8021 | 0.8796 | 5.1029 | 43.0355 | 0.8181 | 0.7199 | 0.5263 | 32.5370 |
| Proposed | 0.7153 | 0.6771 | 0.8327 | 0.8874 | 5.8296 | 40.0503 | 0.8221 | 0.8230 | 0.7029 | 33.0138 |
| Year | |||||||||||
|---|---|---|---|---|---|---|---|---|---|---|---|
| PMGI | 2020 | 0.3835 | 0.5448 | 0.4590 | 0.8658 | 5.6370 | 212.2160 | 0.8209 | 0.7638 | 0.5434 | 24.8630 |
| MFFGAN | 2021 | 0.6371 | 0.6336 | 0.8117 | 0.8748 | 5.7101 | 34.0467 | 0.8212 | 0.7556 | 0.7964 | 32.8101 |
| U2Fusion | 2022 | 0.5167 | 0.4904 | 0.7057 | 0.8616 | 5.1104 | 26.7106 | 0.8184 | 0.6936 | 0.5767 | 33.8640 |
| XDoG | 2023 | 0.6421 | 0.6913 | 0.8033 | 0.8728 | 5.7376 | 61.5020 | 0.8214 | 0.7563 | 0.8165 | 30.2419 |
| NSCTST | 2023 | 0.7124 | 0.7945 | 0.8451 | 0.8814 | 7.6676 | 21.9073 | 0.8332 | 1.0137 | 0.8783 | 34.7249 |
| EgeFusion | 2024 | 0.4040 | 0.4246 | 0.5646 | 0.8372 | 3.2958 | 68.7750 | 0.8119 | 0.4416 | 0.5266 | 29.7565 |
| FDFusion | 2025 | 0.6715 | 0.7075 | 0.8344 | 0.8770 | 6.3362 | 36.5794 | 0.8246 | 0.8360 | 0.8186 | 32.4984 |
| CVTFD | 2025 | 0.7040 | 0.7841 | 0.8442 | 0.8810 | 7.4901 | 20.8554 | 0.8319 | 0.9900 | 0.8708 | 34.9386 |
| Proposed | 0.7143 | 0.8005 | 0.8452 | 0.8815 | 8.0176 | 20.3441 | 0.8358 | 1.0607 | 0.8817 | 35.0464 |
| Year | |||||||||||
|---|---|---|---|---|---|---|---|---|---|---|---|
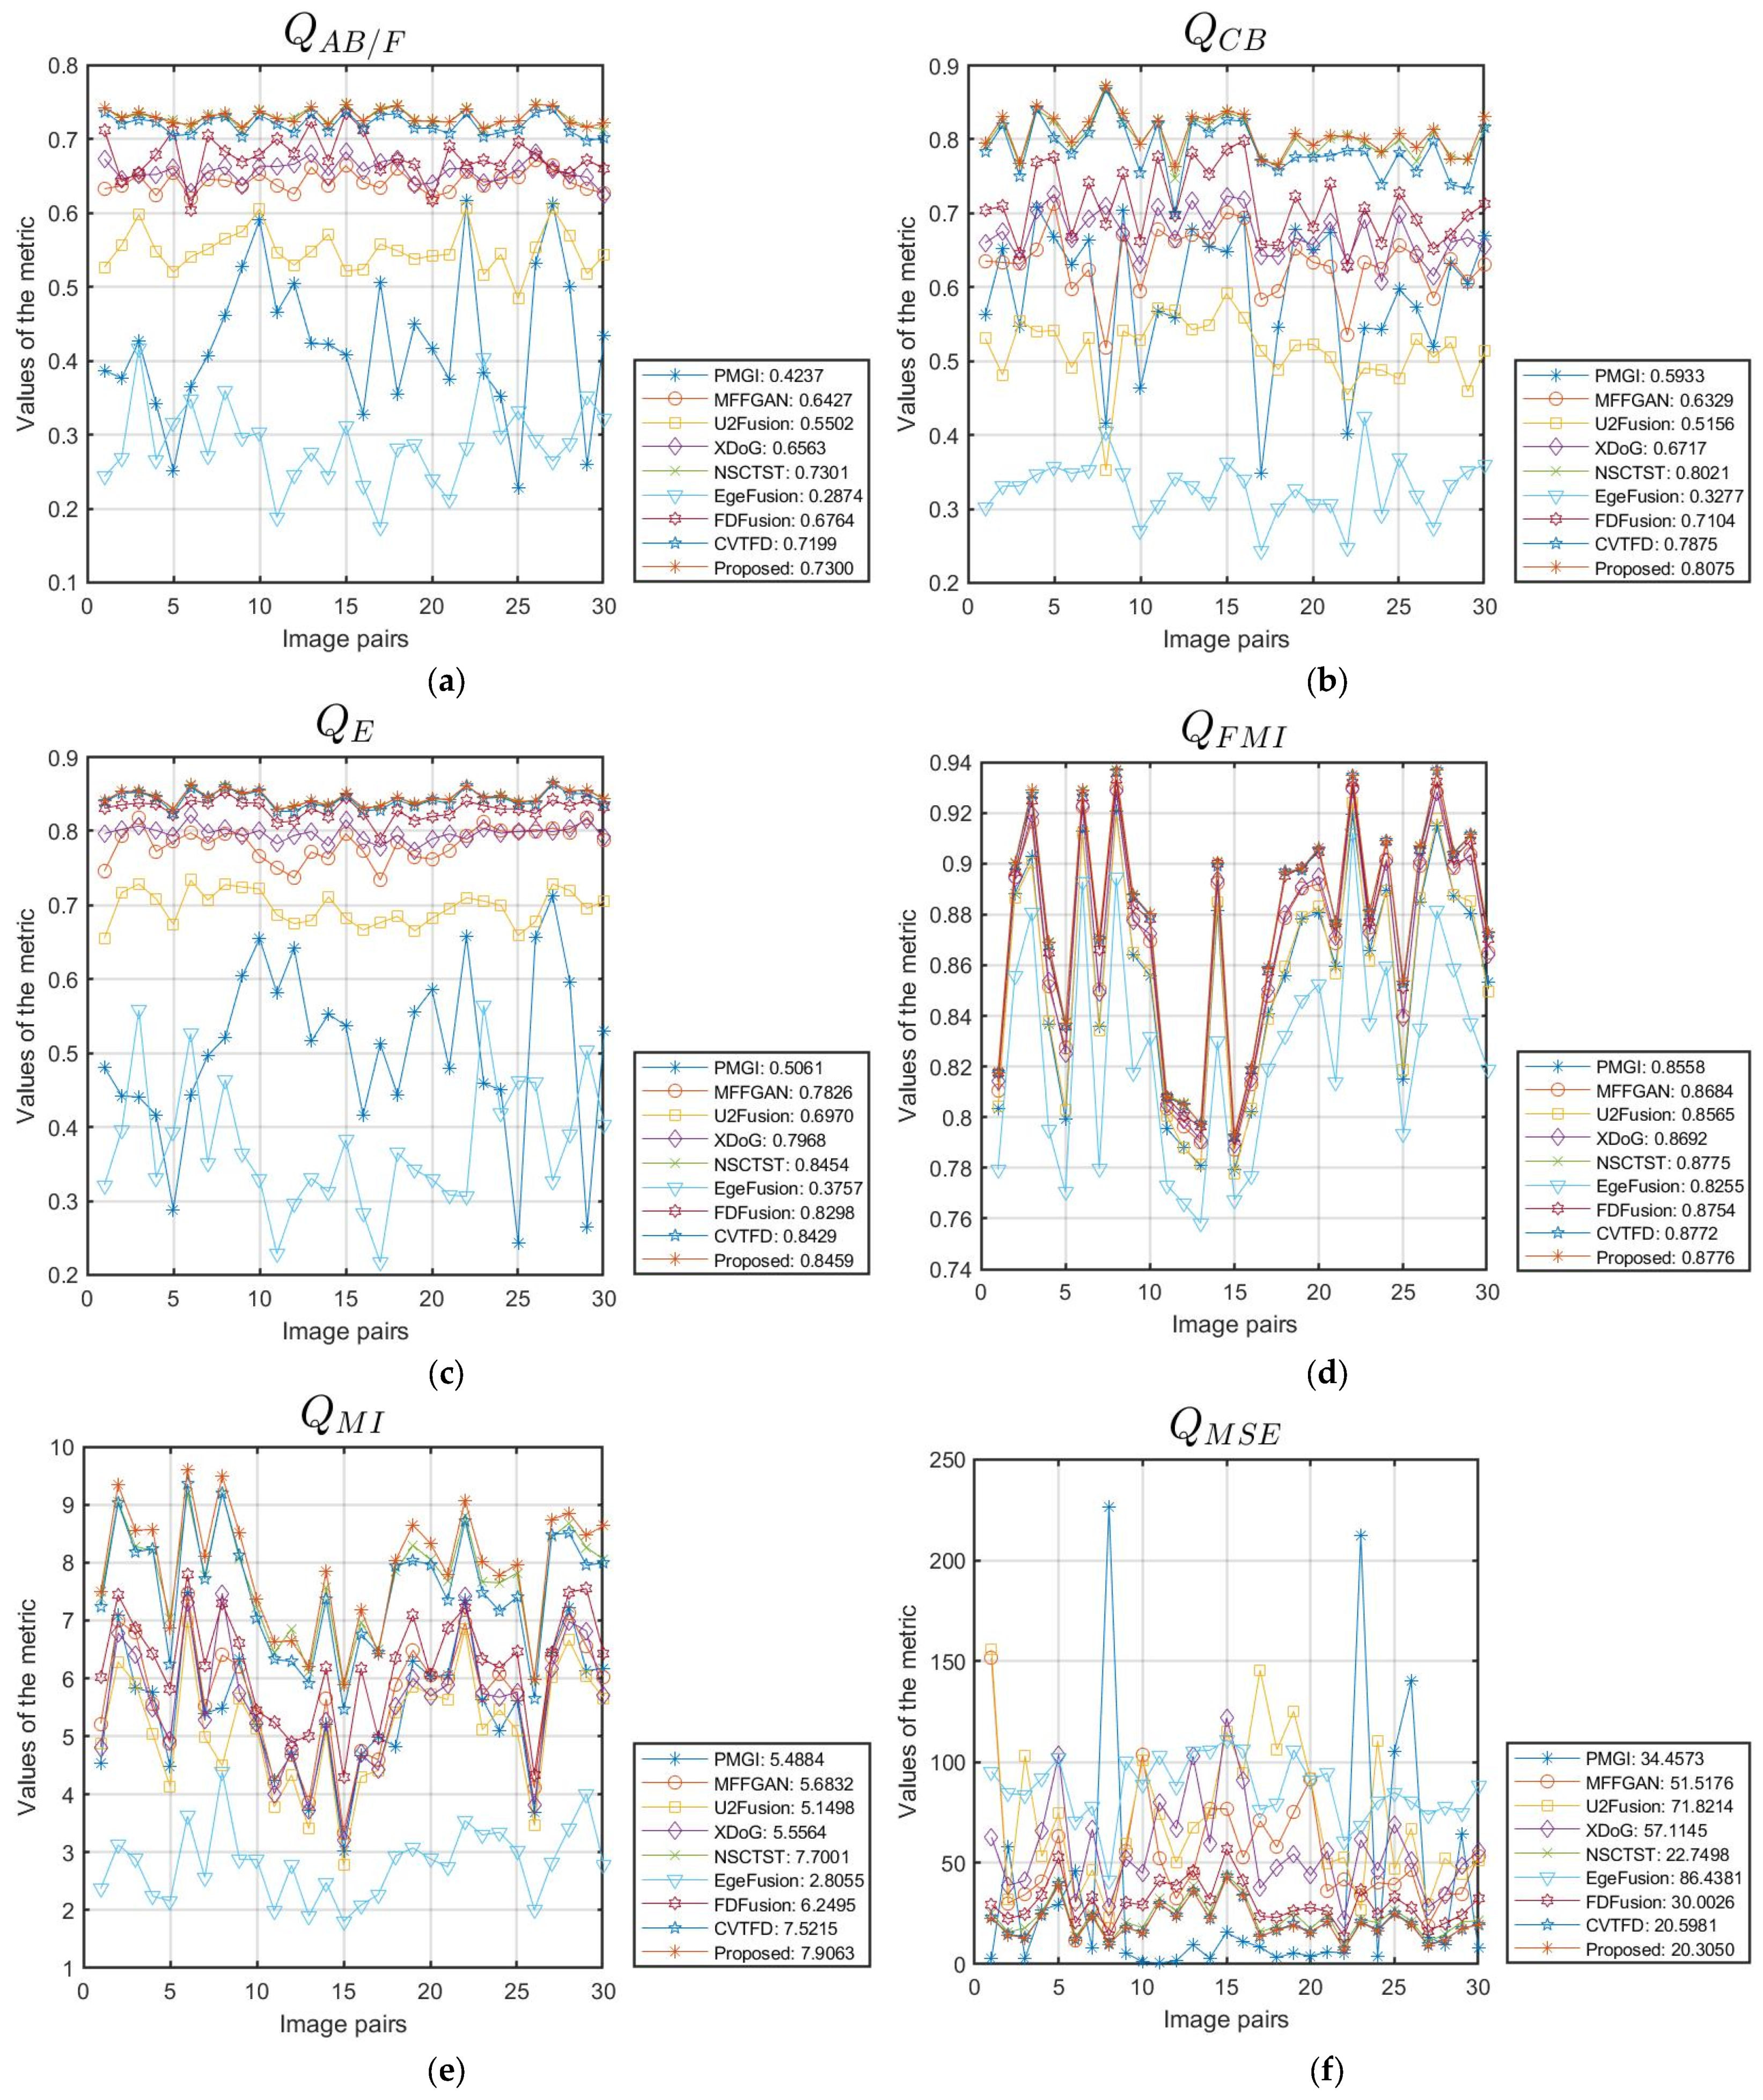
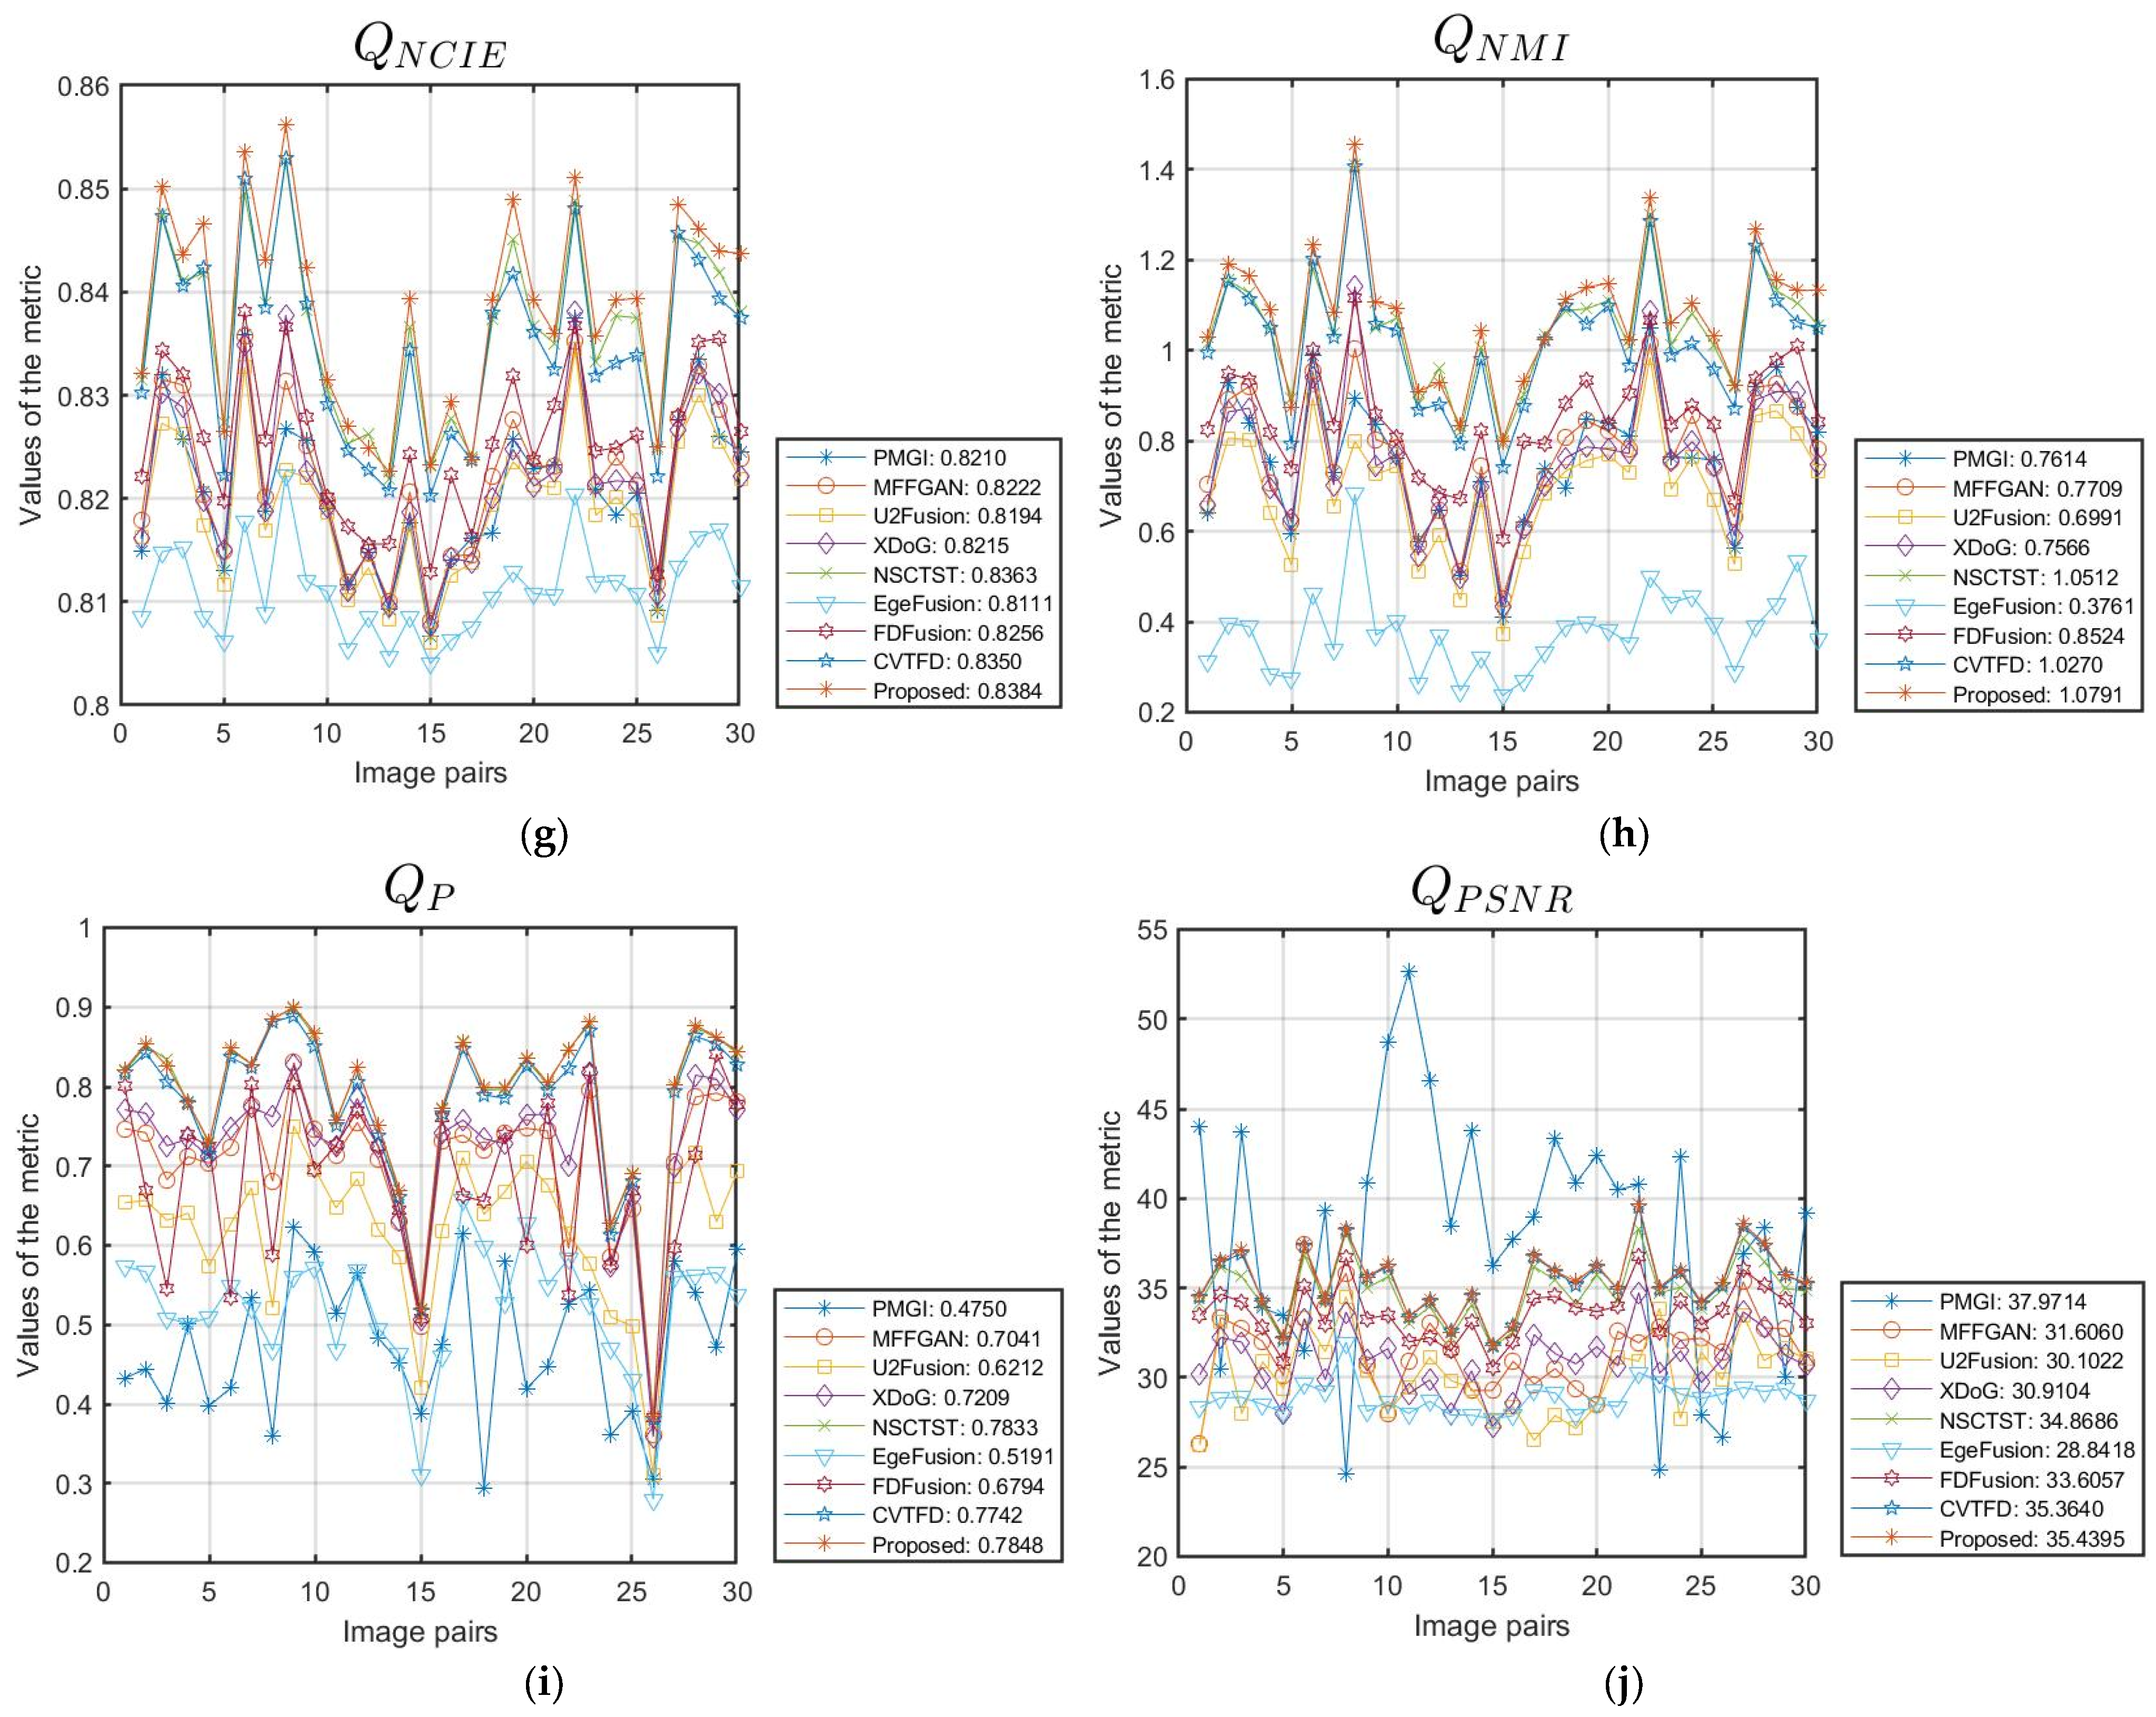
| PMGI | 2020 | 0.4237 | 0.5933 | 0.5061 | 0.8558 | 5.4884 | 34.4573 | 0.8210 | 0.7614 | 0.4750 | 37.9714 |
| MFFGAN | 2021 | 0.6427 | 0.6329 | 0.7826 | 0.8684 | 5.6832 | 51.5176 | 0.8222 | 0.7709 | 0.7041 | 31.6060 |
| U2Fusion | 2022 | 0.5502 | 0.5156 | 0.6970 | 0.8565 | 5.1498 | 71.8214 | 0.8194 | 0.6991 | 0.6212 | 30.1022 |
| XDoG | 2023 | 0.6563 | 0.6717 | 0.7968 | 0.8692 | 5.5564 | 57.1145 | 0.8215 | 0.7566 | 0.7209 | 30.9104 |
| NSCTST | 2023 | 0.7301 | 0.8021 | 0.8454 | 0.8775 | 7.7001 | 22.7498 | 0.8363 | 1.0512 | 0.7833 | 34.8686 |
| EgeFusion | 2024 | 0.2874 | 0.3277 | 0.3757 | 0.8255 | 2.8055 | 86.4381 | 0.8111 | 0.3761 | 0.5191 | 28.8418 |
| FDFusion | 2025 | 0.6764 | 0.7104 | 0.8298 | 0.8754 | 6.2495 | 30.0026 | 0.8256 | 0.8524 | 0.6794 | 33.6057 |
| CVTFD | 2025 | 0.7199 | 0.7875 | 0.8429 | 0.8772 | 7.5215 | 20.5981 | 0.8350 | 1.0270 | 0.7742 | 35.3640 |
| Proposed | 0.7300 | 0.8075 | 0.8459 | 0.8776 | 7.9063 | 20.3050 | 0.8384 | 1.0791 | 0.7848 | 35.4395 |
| Lytro | W/o CV | 0.7390 | 0.7447 | 0.8815 | 0.8989 | 6.9743 | 21.7820 | 0.8296 | 0.9291 | 0.8173 | 35.1463 |
| W/CV | 0.7479 | 0.7515 | 0.8820 | 0.9004 | 7.0950 | 21.4427 | 0.8304 | 0.9455 | 0.8338 | 35.2352 | |
| MFFW | W/o CV | 0.6423 | 0.6541 | 0.8141 | 0.8796 | 5.2687 | 42.4645 | 0.8189 | 0.7436 | 0.5467 | 32.6365 |
| W/CV | 0.7153 | 0.6771 | 0.8327 | 0.8874 | 5.8296 | 40.0503 | 0.8221 | 0.8230 | 0.7029 | 33.0138 | |
| MFI-WHU | W/o CV | 0.7275 | 0.8046 | 0.8459 | 0.8771 | 7.7314 | 20.4173 | 0.8366 | 1.0555 | 0.7834 | 35.4132 |
| W/CV | 0.7300 | 0.8075 | 0.8459 | 0.8776 | 7.9063 | 20.3050 | 0.8384 | 1.0791 | 0.7848 | 35.4395 |
Disclaimer/Publisher’s Note: The statements, opinions and data contained in all publications are solely those of the individual author(s) and contributor(s) and not of MDPI and/or the editor(s). MDPI and/or the editor(s) disclaim responsibility for any injury to people or property resulting from any ideas, methods, instructions or products referred to in the content. |
© 2025 by the authors. Licensee MDPI, Basel, Switzerland. This article is an open access article distributed under the terms and conditions of the Creative Commons Attribution (CC BY) license (https://creativecommons.org/licenses/by/4.0/).
Share and Cite
Lv, M.; Song, S.; Jia, Z.; Li, L.; Ma, H. Multi-Focus Image Fusion Based on Dual-Channel Rybak Neural Network and Consistency Verification in NSCT Domain. Fractal Fract. 2025, 9, 432. https://doi.org/10.3390/fractalfract9070432
Lv M, Song S, Jia Z, Li L, Ma H. Multi-Focus Image Fusion Based on Dual-Channel Rybak Neural Network and Consistency Verification in NSCT Domain. Fractal and Fractional. 2025; 9(7):432. https://doi.org/10.3390/fractalfract9070432
Chicago/Turabian StyleLv, Ming, Sensen Song, Zhenhong Jia, Liangliang Li, and Hongbing Ma. 2025. "Multi-Focus Image Fusion Based on Dual-Channel Rybak Neural Network and Consistency Verification in NSCT Domain" Fractal and Fractional 9, no. 7: 432. https://doi.org/10.3390/fractalfract9070432
APA StyleLv, M., Song, S., Jia, Z., Li, L., & Ma, H. (2025). Multi-Focus Image Fusion Based on Dual-Channel Rybak Neural Network and Consistency Verification in NSCT Domain. Fractal and Fractional, 9(7), 432. https://doi.org/10.3390/fractalfract9070432