1. Introduction
Wheat and barley, the predominant cereal crops in the Mediterranean region, are paramount for regional food security [
1]. In the context of the Mediterranean region, optimized cultivation of wheat has far-reaching implications not only for food security but also for sustainable agricultural practices [
2,
3].
In Morocco, wheat accounts for 65% of the country’s total cereal area, covering approximately 2.9 million hectares and making it the most significant crop [
4,
5]. Durum wheat (Triticum turgidum var. durum Desf), an ancient wheat species, forms a substantial part of human and animal diets [
6]. However, despite the crop’s economic importance, durum wheat grain yields in Morocco remain low and unpredictable in dry areas due to limitations such as low and poorly distributed rainfall [
7,
8,
9,
10].
Research in the field has highlighted challenges in wheat yield improvement, notably the inverse relationship between cereal protein content and grain yields, which complicates genotypic selection strategies for breeders [
11]. This negative correlation implies that selecting higher yields often results in lower protein levels in the grains, presenting a complex balance in genotypic selection strategies [
12]. Yield at harvest is a genetically controlled trait [
13,
14]. However, environmental factors and farming practices often lead to variations in yield [
15,
16,
17]. Yield variability in wheat is influenced by several agronomic factors, with nitrogen management being crucial among them. Proper nitrogen fertilization can significantly enhance yield and biomass production by optimizing the plant’s nutritional status, especially in regions challenged by environmental constraints and resource limitations [
10]. This approach aligns with our study’s focus on assessing the impacts of nitrogen fertilization and genotype selection on wheat productivity.
To ensure optimal yield, it is crucial to identify farming practices, which cater to this objective. One such practice is the strategic management of nitrogen fertilization, tailored to the crop’s needs at various developmental stages [
18,
19,
20]. By understanding the relationship between nitrogen absorption and grain yield [
21], farmers can better manage nitrogen inputs according to the specific requirements of the chosen variety [
22].
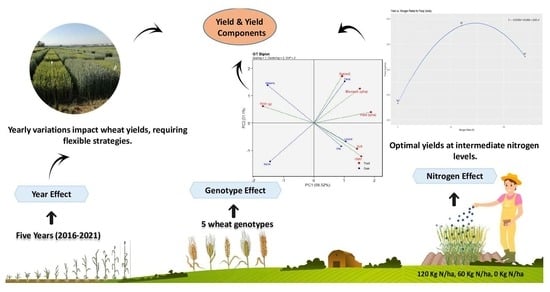
With the increasing global demand for wheat, developing varieties with improved productivity and resource utilization is vital. Therefore, this study aims to assess the effects of nitrogen fertilization and genotype selection on wheat yield, biomass production and yield components. It seeks a comprehensive understanding of the intricate interdependencies among these variables. Through a five-year study (2016–2021), we specifically focused on comparing the performance across three categories of wheat varieties: new (‘Itri’ and ‘Luiza’), medium-aged (‘Faraj’ and ‘Nassira’) and ancient (‘Karim’). This comparison aimed to examine the influence of nitrogen application rates on each category to identify optimal strategies for maximizing wheat productivity.
3. Results
3.1. Genotypic Influence on Yield and Yield Components
Initial analysis of the ANOVA results for yield and biomass demonstrated significant variation among the durum wheat varieties studied. Both factors displayed a significance level of p < 0.05. This finding emphasizes that the observed differences in yield and biomass among the varieties are not due to chance alone but likely reflect distinct characteristics inherent to their genotypes.
During the five-year research span (2016–2021), a trend was observed where newer varieties tended to achieve higher yields than the oldest variety. Among the evaluated varieties, ‘Faraj’ exhibited superior productivity in yield (3430 kg/ha) and biomass production (12,196 kg/ha). Meanwhile, ‘Luiza’ and ‘Itri’ also exhibited notable yield and biomass production performance. ‘Luiza’ demonstrated a yield of 3422 kg/ha and a biomass of 11,949 kg/ha, while ‘Itri’ produced a yield of 3347 kg/ha and a biomass of 11,889 kg/ha. These results indicate the potential of both new and moderately new varieties in agricultural production. The older varieties, such as ‘Karim’ (yield: 3239 kg/ha, biomass: 11,267 kg/ha) and ‘Nassira’ (yield: 3261 kg/ha, biomass: 10,543 kg/ha), demonstrated lower but competitive productivity. The average yield and biomass values calculated across all varieties stood at 3340 kg/ha and 11,569 kg/ha. However, it is important to note that while the ANOVA results indicated significant yield differences among the varieties, the effect of variety on biomass was not statistically significant (ns).
The study also explored grain size using the metric of TKW. The ANOVA analysis for TKW revealed a highly significant difference among the varieties, denoted as p < 0.001. Regarding TKW, ‘Karim’ emerged as the leader with the greatest value of 42.46 g. ‘Itri’, however, recorded the lowest TKW of 39.21 g.
A similar trend was observed with Spk/m2 (plant number per square meter). The ANOVA analysis indicated significant differences among the varieties at p ≤ 0.01. Here, ‘Faraj’ once again asserted its superiority, recording the greatest number of spikes per square meter (332 Spk/m2). In contrast, ‘Karim’ had the lowest Spk/m2, registering 294 Spk/m2. The average plant density across all the varieties was 311 spikes per square meter.
Regarding G/m2 (grain number per square meter), the ‘Luiza’ variety proved to be the most prolific, producing the highest number of grains per square meter at 7784. ‘Nassira’, on the other hand, had the lowest grain count at 7152 grains per square meter. Across all varieties and treatments, the overall mean G/m2 was determined to be 7460 grains per square meter.
The research also evaluated the characteristics of grains per spike (G/S), showing significant differences among the varieties at p < 0.05. ‘Faraj’, ‘Luiza’ and ‘Itri’ were the top performers, each producing 27 grains per spike. Conversely, ‘Karim’ and ‘Nassira’ registered the smallest G/S values, with 26 and 24 grains per spike, respectively. These findings highlight the distinct variation in G/S across the different durum wheat varieties. The variations observed in this study can be attributed to the distinct genotypes of the varieties tested, suggesting that genetic factors play a pivotal role in determining these agronomic traits.
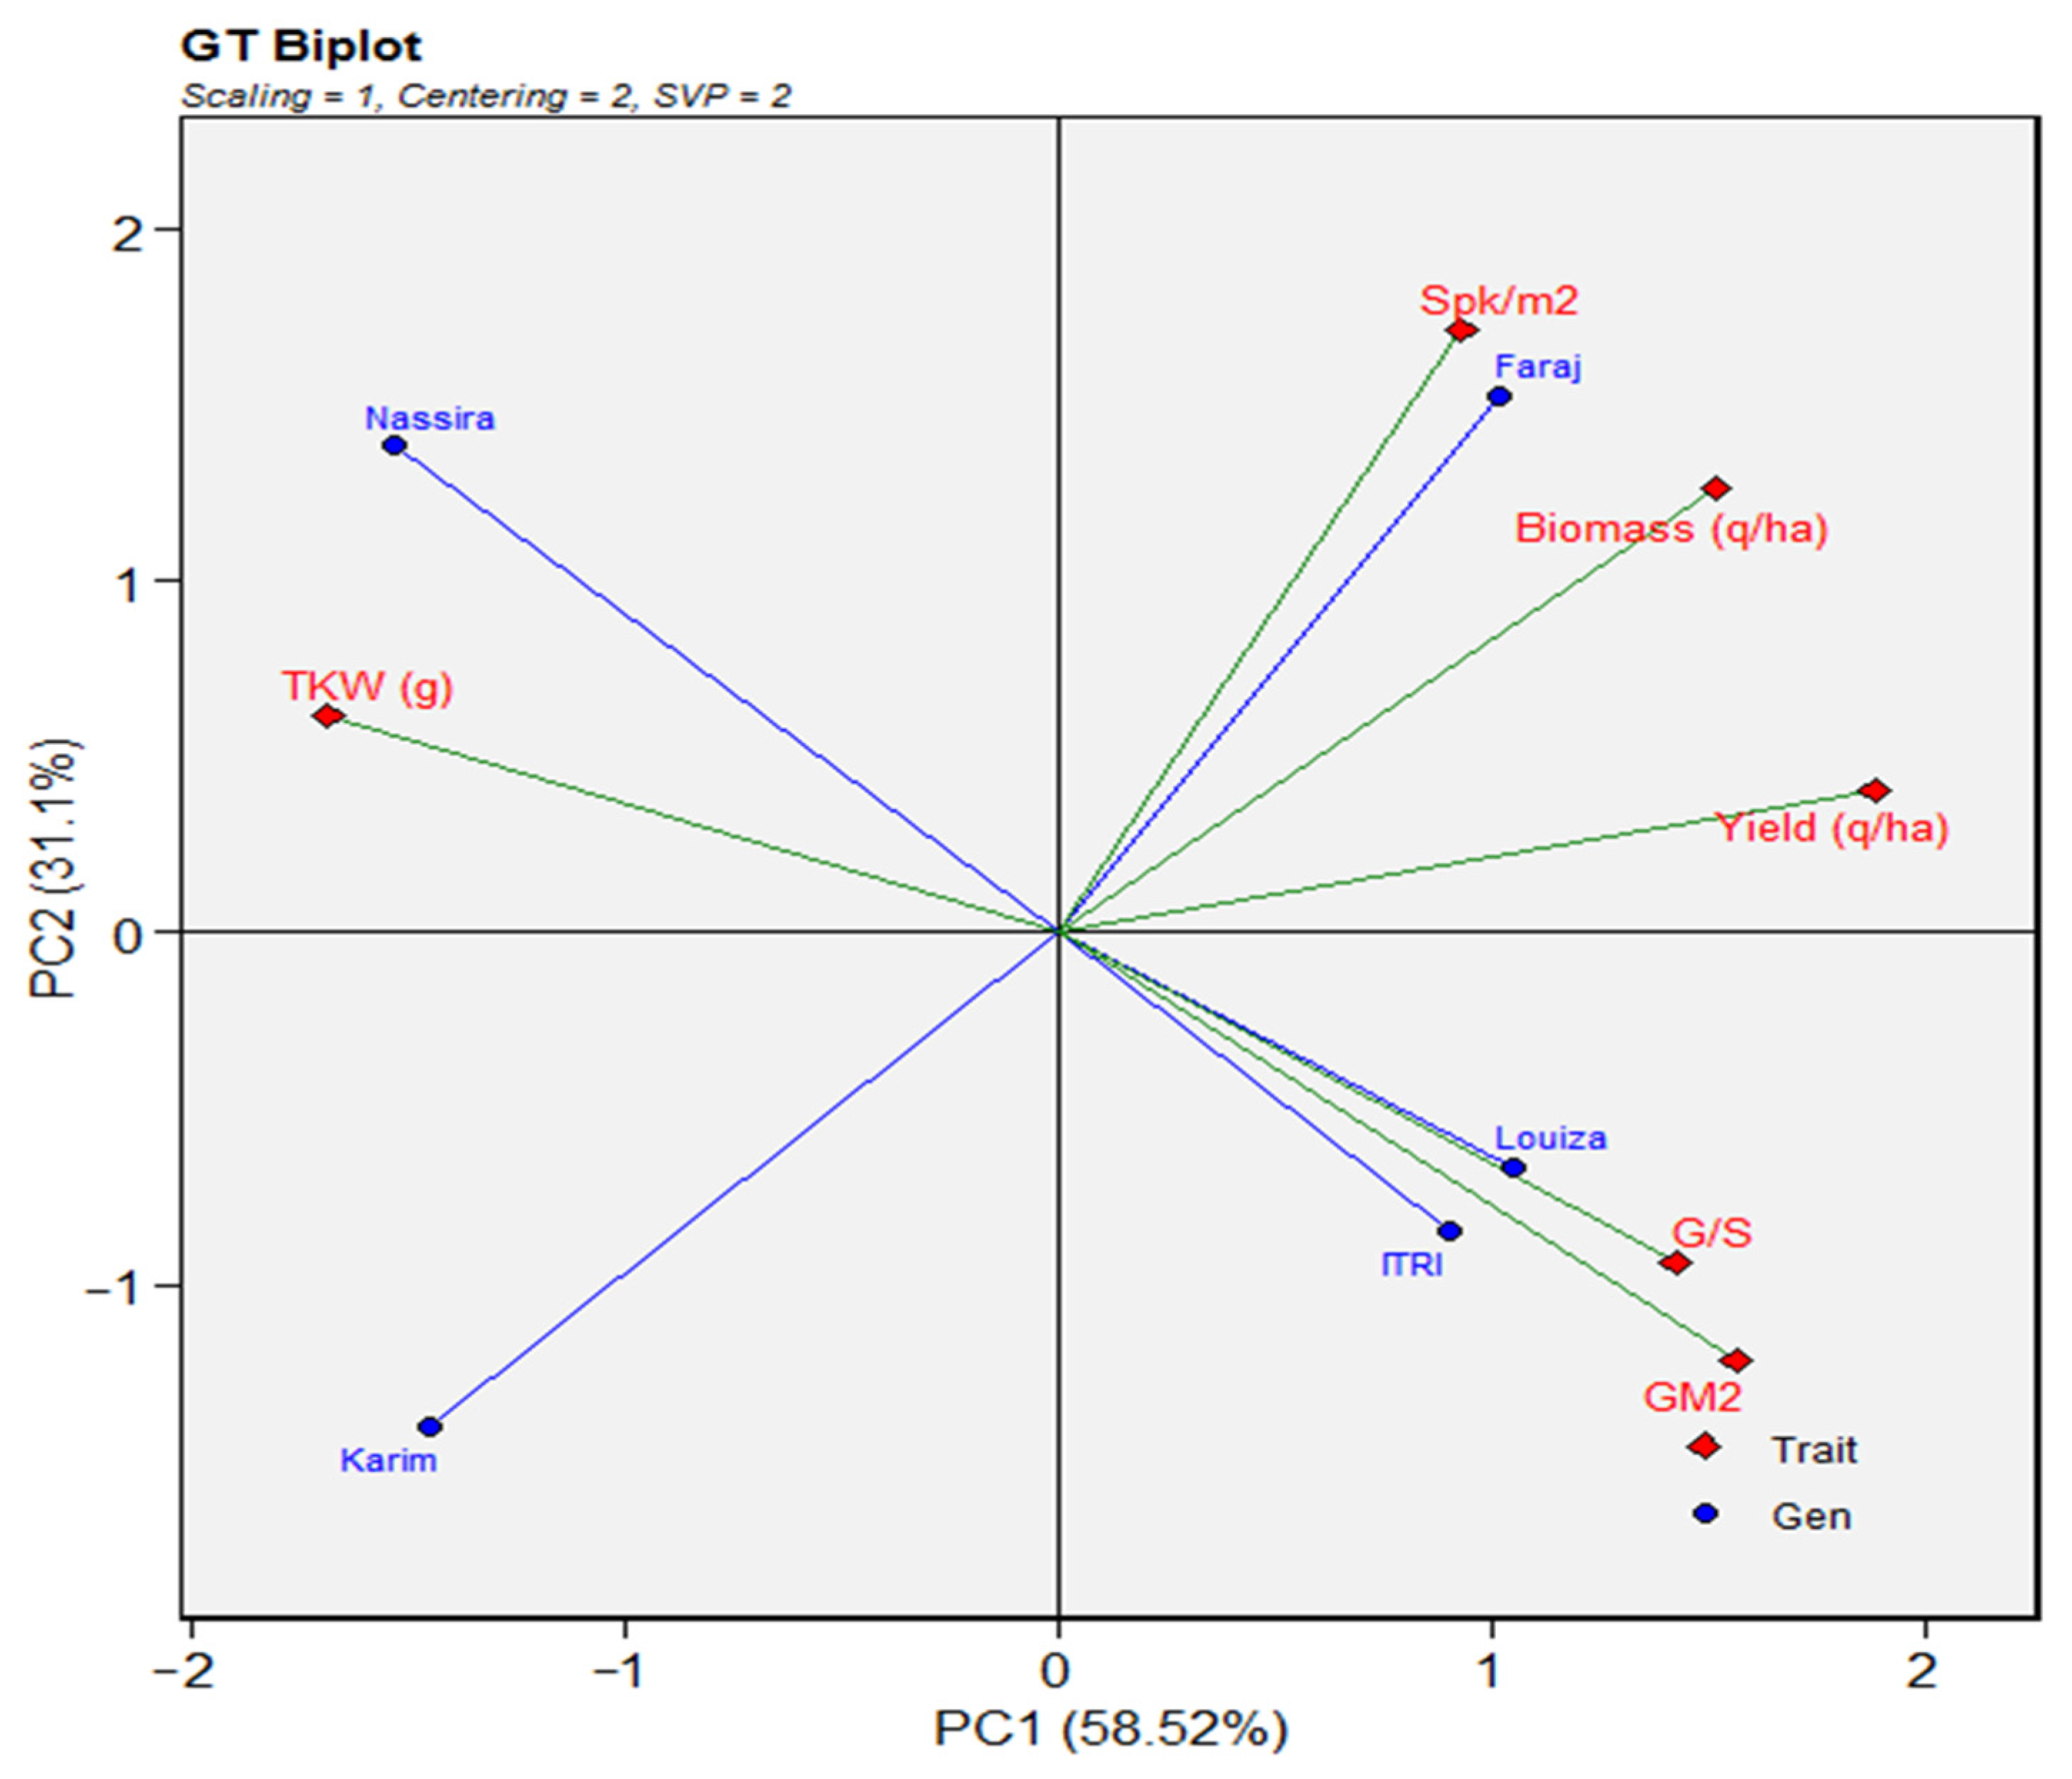
A visual representation in the bi-plot analysis (
Figure 2) clearly presents the relationship between the wheat varieties and agronomic traits. The positioning of each variety on the bi-plot provides insights into their respective agronomic characteristics. The new varieties, ‘Luiza’ (2011) and ‘Itri’ (2017), showed a close association with grains per square meter (G/m
2) and the number of grains per spike (G/S). Conversely, the ‘Nassira’ (2003) variety was associated more closely with the thousand-kernel weight (TKW). The ‘Faraj’ (2007) variety was more closely aligned with spikes per square meter (Spk/m
2) than with biomass or yield. Meanwhile, the older variety ‘Karim’ (1985) found itself on the opposite side of the bi-plot, indicating differing agronomic characteristics.
3.2. Influence of Nitrogen on Biomass, Yields and Yield Components
Turning to the role of nitrogen, the ANOVA results showed a significant effect on crop yield (
p < 0.05), biomass (
p < 0.001) and thousand-kernel weight (TKW) (
p < 0.001), as outlined in
Table 3, demonstrating nitrogen’s significant influence on these metrics. The maximum yield was obtained following an application of 120 kg/ha of nitrogen, reaching 3404 kg/ha, while the minimum yield was observed with no nitrogen application, at 3234 kg/ha.
Regarding biomass, the ANOVA analysis also revealed a significant impact of nitrogen (p < 0.001). Consistent with the yield results, the greatest biomass was achieved with 120 kg of nitrogen, reaching 12,277 kg/ha. In contrast, the smallest biomass was noted for 0 kg/ha of nitrogen, standing at 10,917 kg/ha.
Additionally, the ANOVA analysis detected a significant effect of nitrogen on the TKW of the crop (p < 0.001). In alignment with this, the application of 120 kg/ha of nitrogen yielded the greatest TKW, at 41.68 g. The smallest TKW, however, was noted with 60 kg/ha of nitrogen, registering 40.56 g.
The analysis of variance (ANOVA) findings indicated a significant difference in the impact of nitrogen on the quantity of spikes per square meter (Spk/m2) with a p = 0.003. Notably, utilization of 60 units of nitrogen had the most pronounced effect on the spike count per square meter, resulting in a total of 319 Spk/m2. On the other hand, the absence of nitrogen application, marked as 0 units, yielded the lowest spike count, totaling 302 spikes per square meter.
Furthermore, the application of nitrogen showed no significant impact on the quantity of grains per square meter (p = 0.095) or the number of grains per spike (p = 0.193). The experimental results indicated that the maximum grain yield per unit area resulted from the precise application of 60 units of nitrogen, which resulted in a grain count of 7730 per square meter. Conversely, the minimum grains per square meter were observed with the application of 120 kg/ha of nitrogen, amounting to 7352 grains per square meter. The mean grains per square meter stood at 7544. Similarly, the highest number of grains per spike occurred with 0 kg/ha and 60 kg/ha of nitrogen, both delivering 27 grains per spike. The lowest number of grains per spike was obtained with 120 kg/ha of nitrogen, registering 25 grains per spike.
The selection of nitrogen doses of 120 kg/ha and 60 kg/ha was informed by a comprehensive review of preliminary trials and relevant literature, aiming to identify optimal rates, which balance environmental sustainability with yield improvements.
A closer examination of nitrogen use efficiency (NUE) reveals a more nuanced picture of nitrogen’s role in wheat production. Specifically, the NUE for the 60 kg/ha dose stood at 2.37 kg grain/kg N, surpassing the 1.42 kg grain/kg N efficiency observed for the 120 kg/ha dose. This differential efficiency highlights the diminishing returns on yield with increased nitrogen application and underscores the importance of optimizing nitrogen management to achieve sustainable wheat production.
The findings from this study illuminate the critical balance between nitrogen application and wheat yield optimization. While higher nitrogen doses can enhance yield and biomass, the efficiency of nitrogen use, as evidenced by the NUE calculations, suggests that lower application rates may offer a more sustainable pathway for maximizing wheat productivity. This balance is crucial for agronomic practices, especially in regions where environmental sustainability and resource optimization are paramount.
As illustrated in
Figure 3, nitrogen application rates and variety significantly influence crop yield. Recent varieties (‘Faraj’, ‘Itri’ and ‘Luiza’) exhibit greater yields compared to older varieties (‘Karim’ and ‘Nassira’) at a given nitrogen application, which can be attributed to advancements in plant breeding. Furthermore, nitrogen application is pivotal in yield enhancement, with N1 (120 kg of nitrogen) and N2 (60 kg of nitrogen) consistently leading to superior yields over N3 (0 kg of nitrogen) across each variety. The variability in response to nitrogen levels among the varieties underscores the differences in nitrogen use efficiency and yield potential inherent to each genotype.
3.3. Insights on Interaction Effects of Agronomic Traits
Expanding the scope of the analysis, the study explored the interaction effects among variety and nitrogen, variety and year, and nitrogen and year, as detailed in
Table 3.
Notably, the relationship between variety and nitrogen showed no significant differences in several agronomic traits—yield (
p = 0.909), biomass (
p = 0.475) and Spk/m
2 (
p = 0.954)—according to
Table 3. These data imply that the influence of nitrogen remains stable across various varieties. This means that the outcome of nitrogen application is likely to be uniform irrespective of the wheat variety chosen, streamlining nitrogen management decisions.
When examining the interaction between variety and year, significant effects were observed for yield (p < 0.001), biomass (p < 0.001), TKW (p < 0.001), Spk/m2 (p < 0.001) and G/m2 (p < 0.001), but not for G/S (ns), indicating that the performance of different wheat varieties can vary significantly from year to year, depending on environmental conditions and other factors. Similarly, the interaction between nitrogen and year showed significant differences for yield (p < 0.001), biomass (p = 0.002), TKW (p = 0.003) and Spk/m2 (p < 0.001), with a noticeable effect on G/m2 (p < 0.05), highlighting how optimal nitrogen application rates may vary across different years, influenced by annual weather patterns and other environmental factors. Such variations are pivotal to consider in agronomic planning. The three-way interaction between variety, nitrogen and year was predominantly found to be non-significant, pointing toward a stable combined effect of these parameters on the agronomic traits.
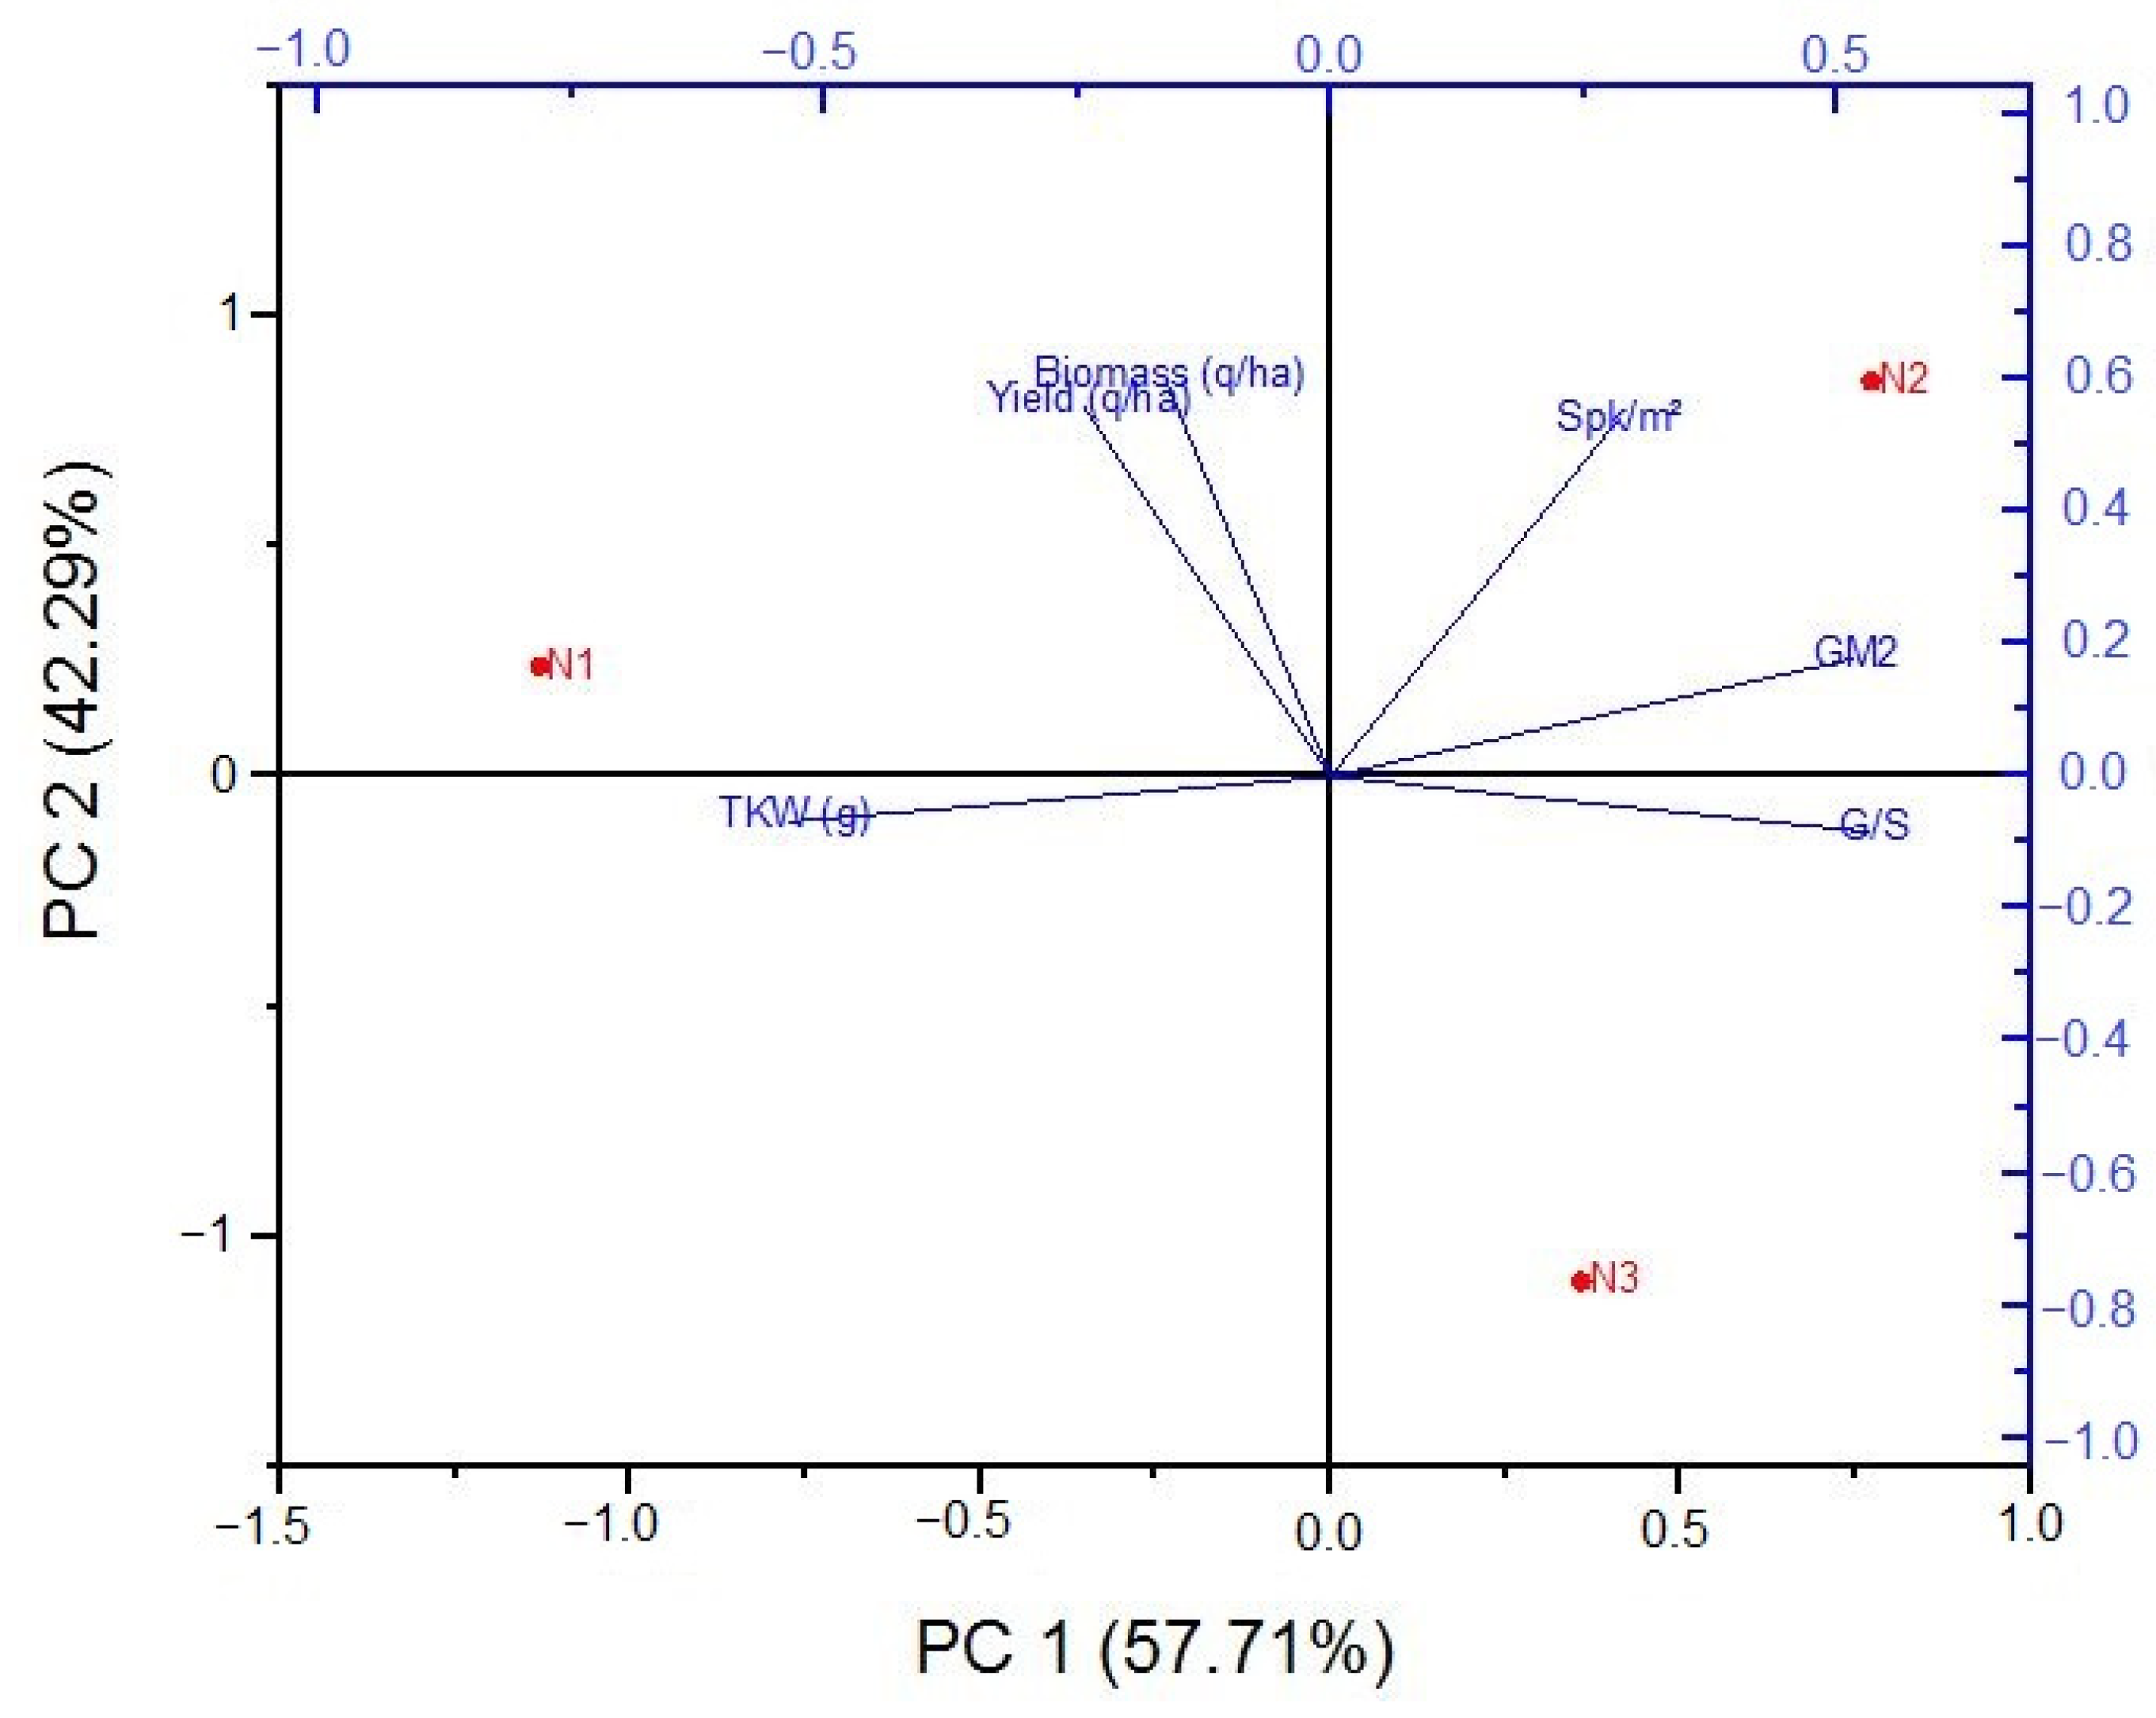
Venturing into a deeper data analysis, the principal component analysis (PCA) (
Figure 4) unravels the associations between traits and nitrogen application rates. The principal component analysis (PCA) of the data reveals two principal components, PC1 and PC2, which account for 57.71% and 42.29% of total variance, respectively. The TKW is closely associated with the greatest nitrogen application rate (N1, 120 kg/ha), indicating a positive correlation between these two variables. Similarly, the number of spikes per square meter and grains per square meter (G/m
2) are closely associated with the N2 (60 kg/ha) nitrogen application rate. In contrast, yield and biomass are situated on the opposite side of the PCA plot, indicating a negative correlation with the N3 0 kg/ha application rate. Interestingly, the yield and biomass are situated between the N1 and N2 nitrogen application rates on the PCA plot. This suggests that an intermediate nitrogen application rate, between N1 and N2, could potentially result in optimal yield and biomass.
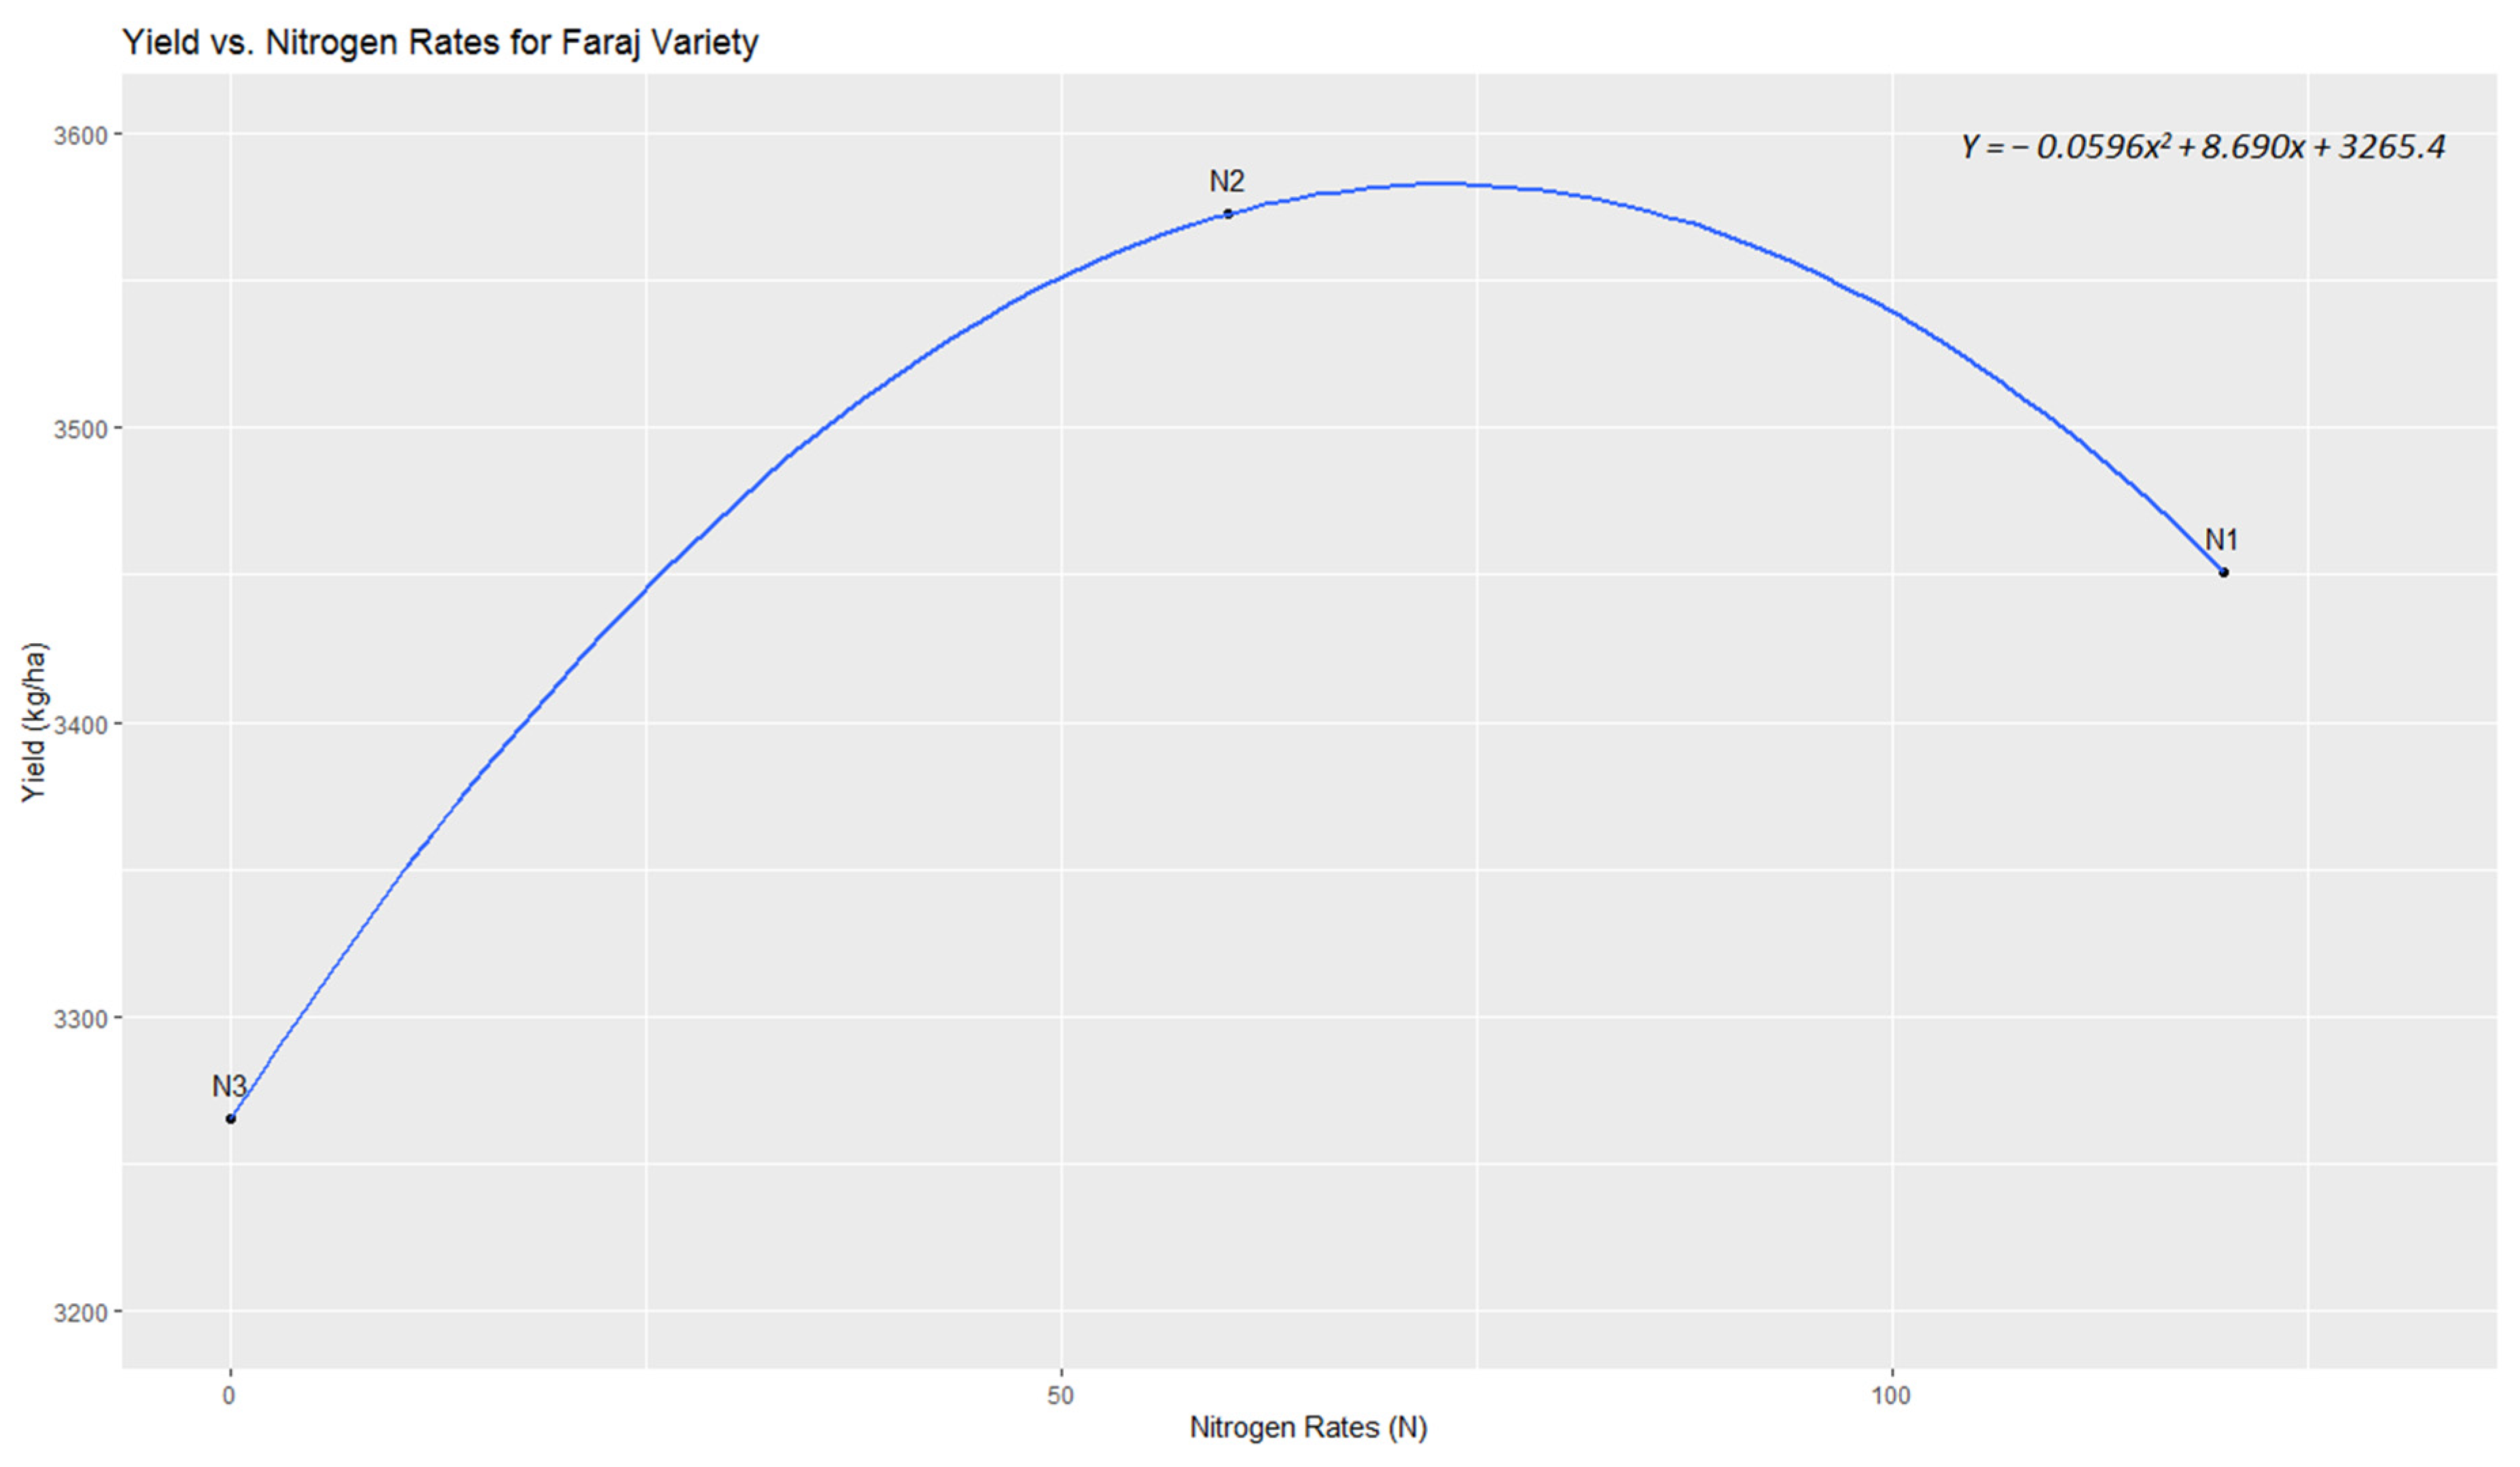
To further explore the relationship between nitrogen application rates and yield, we employed quadratic models for two distinct crop varieties, ‘Faraj’ and ‘Karim’. These models were derived from extensive field trials and were validated to ensure an accurate fit with empirical data. The equations are as follows:
For the ‘Faraj’ variety (
Figure 5): Y
Faraj(x) = −0.0596x
2 + 8.690x + 3265.4.
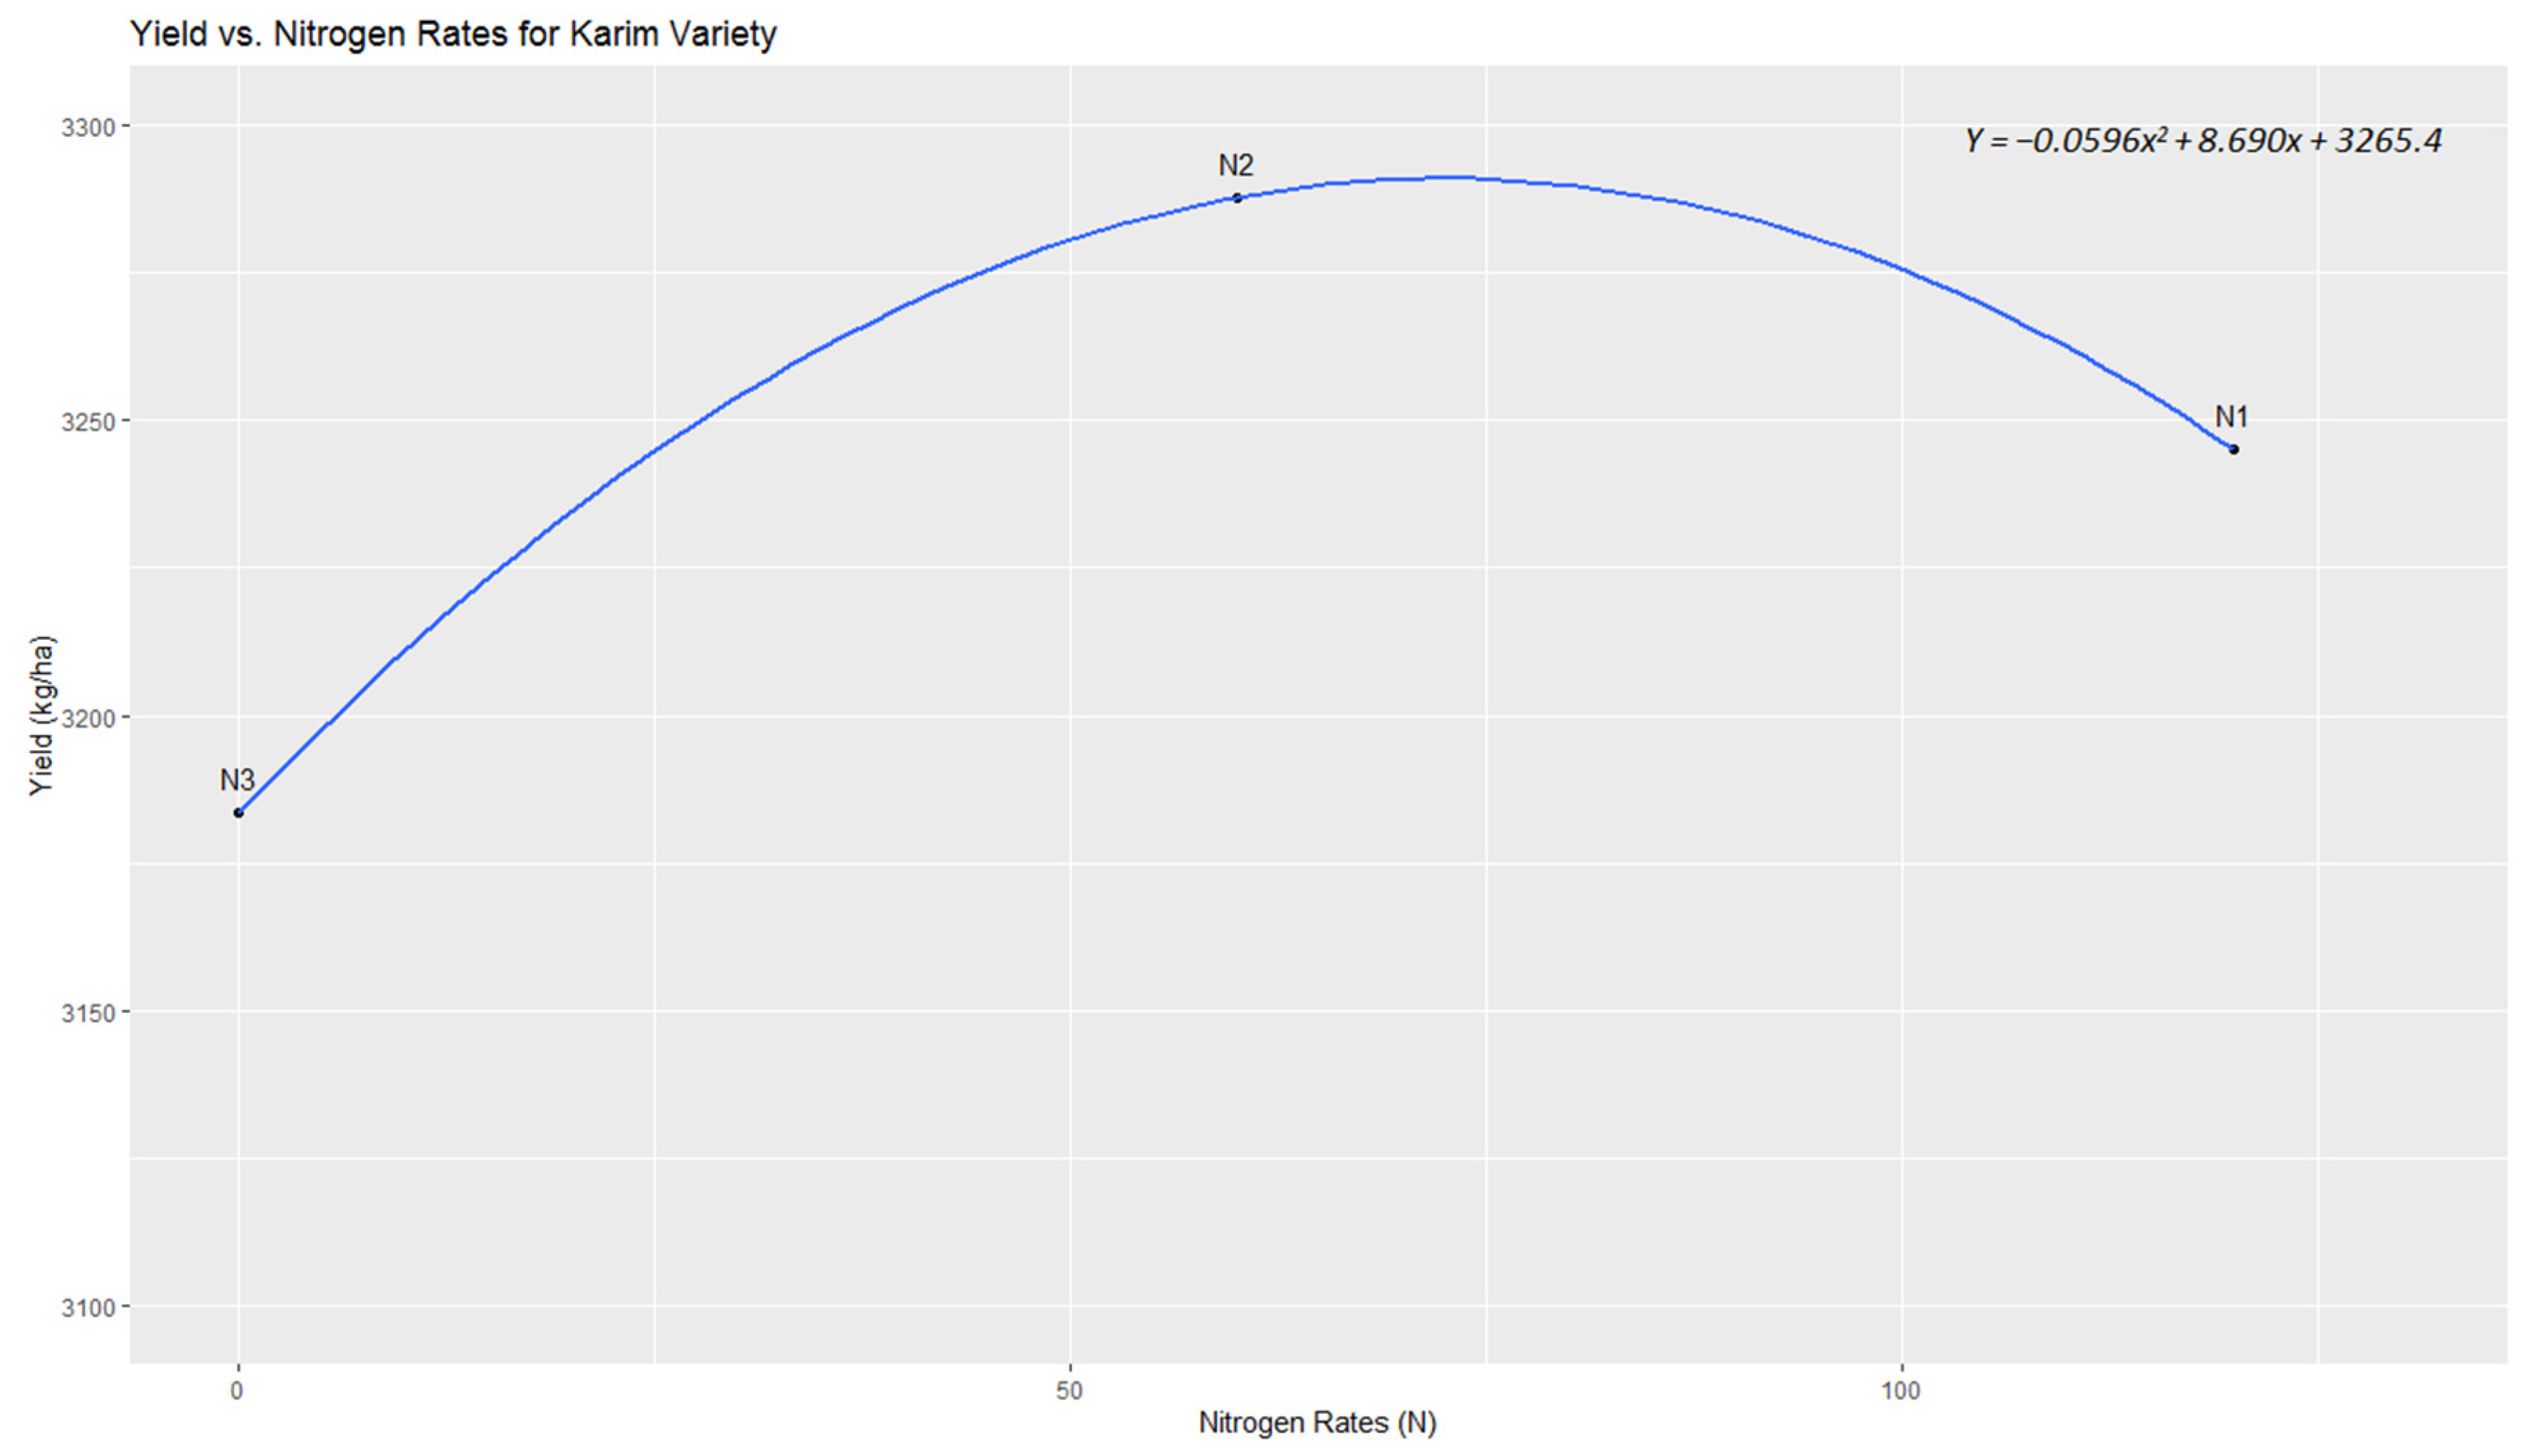
For the ‘Karim’ variety (
Figure 6): Y
Karim(x) = −0.0204x
2 + 2.97x + 3183.4.
Where Y represents the yield in kg/ha, and x represents the nitrogen application rates in kg/ha.
Upon optimization, for the ‘Faraj’ variety, the nitrogen application rate corresponding to maximum yield was found to be x ≈ 72.42 kg/ha. This nitrogen application rate predicts a maximum yield of approximately YFaraj ≈ 3580 kg/ha. The second derivative confirmed this as a local maximum.
Similarly, for the ‘Karim’ variety, the nitrogen dose for optimal yield was determined to be x ≈ 74.25 kg/ha, with a corresponding yield of YKarim ≈ 3294 kg/ha. Again, the second derivative confirmed this as a local maximum. Although the optimal nitrogen doses for ‘Faraj’ and ‘Karim’ are nearly identical, indicating a similar nitrogen use efficiency, ‘Faraj’ can achieve a higher yield than ‘Karim’ at this nearly equivalent nitrogen application rate, highlighting the potential for genetic factors to influence yield optimization even under similar nutrient management practices.
3.4. Comparative Analysis of Wheat Varieties under Different Nitrogen Application Rates: A Five-Year Study on Yield, Biomass and Grain Characteristics
In the inaugural year of our investigation (2017), we focused on assessing the impact of varying nitrogen application rates (N1, N2, N3) on a selection of wheat varieties (‘Faraj’, ‘Itri’, ‘Karim’, ‘Luiza’, ‘Nassira’), examining key parameters, including yield, biomass, TKW, number of spikes per square meter (Spk/m
2), grains per square meter (G/m
2) and the number of grains per spike (G/S). In this comprehensive study, a number of pivotal trends were identified. Across all nitrogen application rates, the ‘Itri’ variety demonstrated superior performance by achieving the greatest average yield of 3993 kg/ha, which corresponded to a notable 6.2% increase compared to the overall mean yield of 3760 kg/ha, as illustrated in
Table 4. In contrast, the ‘Karim’ variety exhibited the smallest average yield of 3502 kg per ha (kg/ha), representing a reduction of approximately 6.9% compared to the mean yield across all varieties. In terms of biomass, ‘Faraj’ notably excelled at the N2 level, accumulating 14,900 kg/ha—a 11.6% increase over the general mean biomass of 13,347 kg/ha. ‘Karim’, on the other hand, recorded the smallest biomass of 11,863 kg/ha at the N2 level—a 11.1% decline from the overall mean. Interestingly, although ‘Karim’ lagged in yield and biomass, it exhibited the greatest TKW of 49.06 g at the N1 level—a 14.8% increase over the general mean TKW of 42.74 g. Conversely, ‘Luiza’ registered the lowest TKW of 39.08 g at the N2 level, which was approximately 8.6% below the mean, according to
Table 4.
In the 2018 continuation of our study, we observed marked differences in wheat variety responses to nitrogen levels (N1, N2 and N3). ‘Luiza’ consistently outshone its counterparts in yield, averaging 4794 kg/ha, indicating an 8% rise from the revised mean yield of 4437 kg/ha for that year. However, at N3, ‘Luiza’ yielded slightly less than ‘Karim’, as highlighted in
Table 5. Contrarily, ‘Faraj’ and ‘Nassira’ displayed suboptimal results, with yields of 4199 kg/ha and 4133 kg/ha, which were 5.4% and 6.9% below the mean, respectively. When it came to biomass, both ‘Itri’ and ‘Luiza’ were prominent, especially at the N1 level, amassing an average biomass of 14,001 kg/ha, marking a 20.4% increase over the average biomass of 11,624 kg/ha. However, notably, ‘Faraj’ yielded less at the N3 level, posting a biomass figure of 10,128 kg/ha—12.9% less than the mean. Interestingly, while ‘Faraj’ achieved the highest TKW of 48.35 g at the N3 level, surpassing the mean TKW of 45.80 g by 5.6%, ‘Itri’ fell short in this measure, with the smallest TKW of 43.46 g at the N2 level—5.1% below the mean—as reported in
Table 5.
In 2019, the ‘Faraj’ variety consistently produced the largest yields across all nitrogen levels, with an average yield of 3425 kg/ha, representing a significant 16.5% increase over the overall mean yield of 2939 kg/ha, as illustrated in
Table 6. In contrast, ‘Nassira’ and ‘Itri’ generally underperformed in yield, registering average yields of 2628 kg/ha and 2733 kg/ha, falling 10.6% and 7.0% below the mean, respectively. Regarding biomass, ‘Itri’ produced the highest average at the N2 level, with 13,406 kg/ha, which was a notable 28% increase over the overall mean biomass of 10,474 kg/ha. In contrast, ‘Nassira’ reported the smallest biomass of 7820 kg/ha at the N3 level, trailing the mean by 25.3%. Interestingly, despite its smaller yield, ‘Nassira’ led in TKW at the N1 level, with 39.7 g, exceeding the overall mean TKW of 37.8 g by a modest 5%. ‘Itri’, however, produced a small TKW at both the N2 and N3 levels, recording the lowest average of 34.59 g—a decline of 8.5% from the mean—as reported in
Table 6.
The 2020 dataset provides critical insights into crop behavior under varying nitrogen conditions. Significantly, the ‘Faraj’ variety produced the largest yield, exceeding the overall mean yield of 1720 kg/ha. Its performance was particularly remarkable at the N2 level, where it registered a yield of 2178 kg/ha, surging ahead by 26.6% relative to the mean, as highlighted in
Table 7. In stark contrast, ‘Karim’ and ‘Itri’ largely underperformed, with their yields languishing at approximately 22.0% and 14.7% below the mean, respectively. With respect to biomass accumulation, ‘Faraj’ produced the greatest biomass at the N1 and N2 levels, producing values, which were a substantial 33.5% and 27.2% higher than the average of 6305 kg/ha. ‘Karim’ was the least productive, with its biomass at the N3 level falling a concerning 25.6% below the mean. Intriguingly, while ‘Itri’ exhibited subpar yield and biomass figures, it was ‘Nassira’, which recorded the highest TKW of 42.41 g at the N3 level—an increase of 8.5% above the mean TKW of 39.08 g. Concurrently, ‘Itri’ yielded less at the N2 level, with a TKW of 36.98 g—5.4% below the mean.
In the 2021 assessment—the year completing our longitudinal examination—the ‘Itri’ variety displayed a complex but instructive performance profile. With a yield of 4319 kg/ha at the N1 nitrogen level, ‘Itri’ outperformed the overall mean yield of 3789 kg/ha by approximately 14.0%. However, it manifested a marked decline at the N3 nitrogen level, falling short of the mean by 11%. This dual behavior was also reflected in biomass accumulation; ‘Itri’ recorded values 12.2% above the mean of 17,127 kg/ha at the N1 level but plummeted to 21.3% below the mean at the N3 level. Intriguingly, ‘Karim’ led in TKW at the N1 level, registering a TKW of 42.76 g, which was 6.5% above the overall mean of 40.14 g. In contrast, ‘Itri’ marked the lowest TKW at both the N2 and N3 nitrogen levels, with values 7.4% and 8.4% below the mean, respectively, as shown in
Table 8.
The ANOVA results from the five-year period highlight the significant influence of wheat variety on the yield, biomass, TKW, Spk/m2 and G/m2. The study also underscores the significant influence of nitrogen level on the yield, biomass, TKW and Spk/m2 during the 2020/2021 growing season. This suggests that nitrogen level can significantly affect these traits, especially during growing seasons with greater rainfall, such as 2020/2021 (429.8 mm).
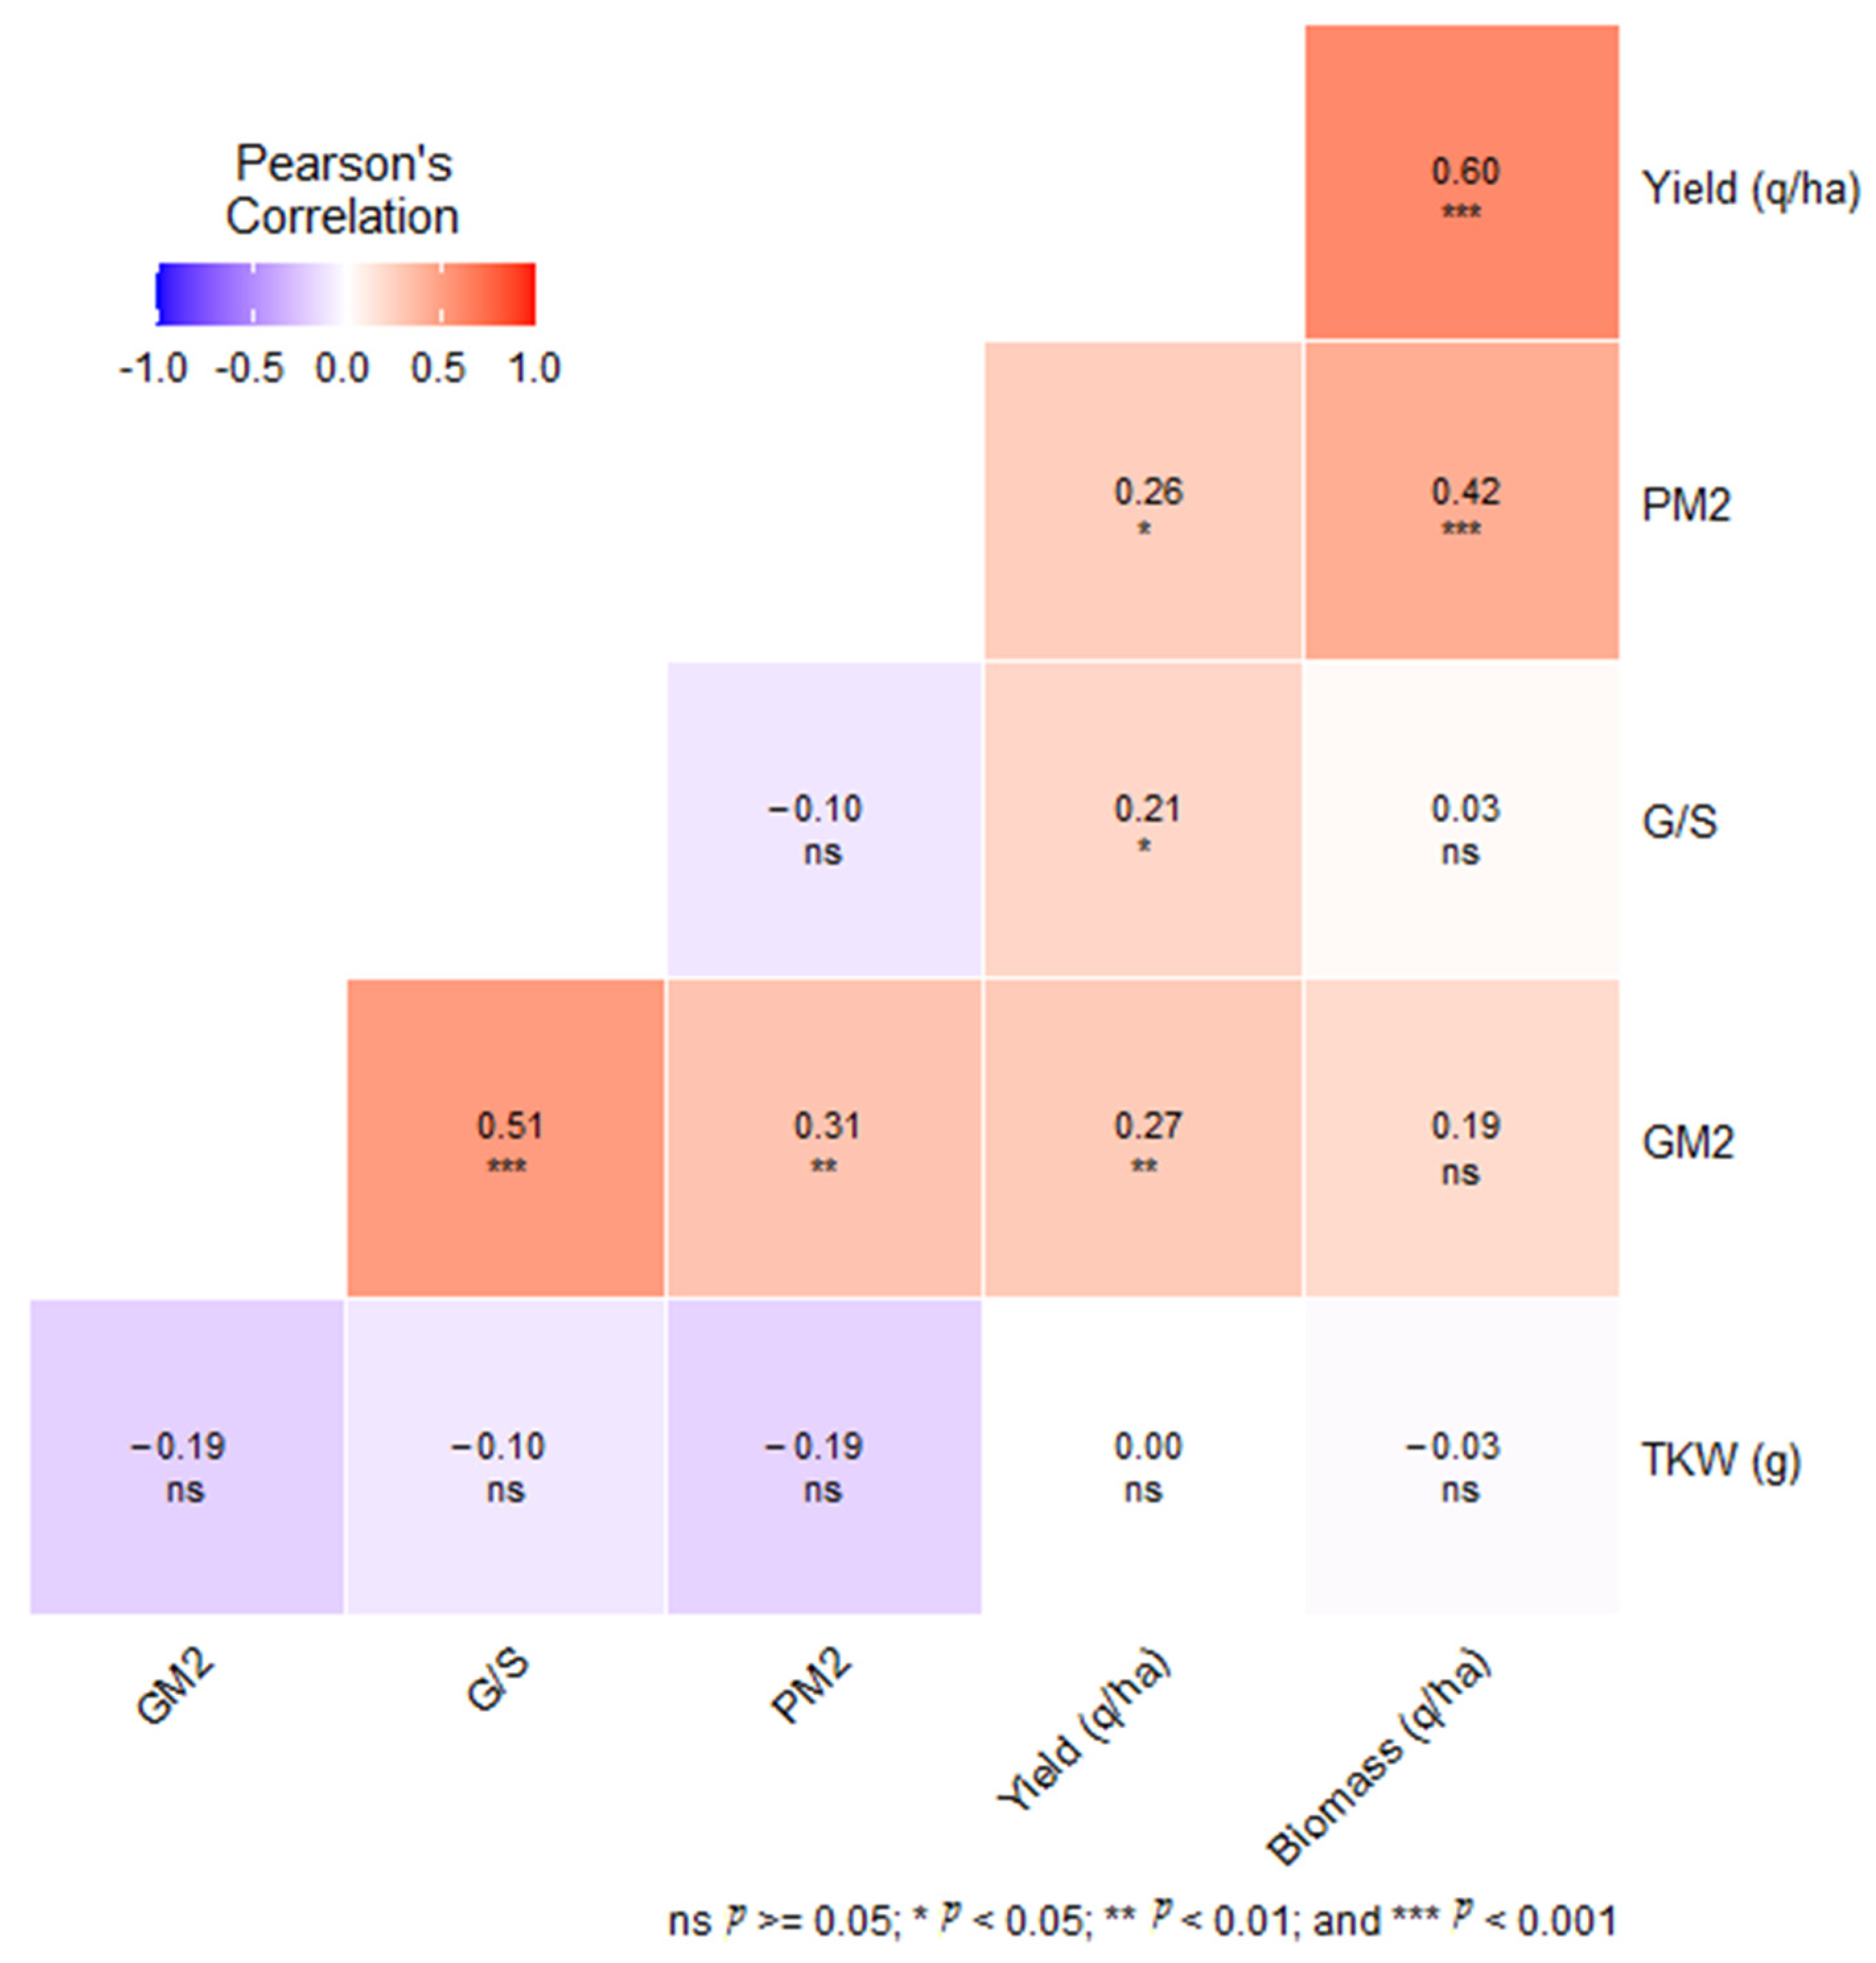
3.5. Correlation Analysis: Yield, Yield Components and the Interaction between Nitrogen and Variety
In this scientific investigation, we explored the intricate interconnections between crop yield and a multitude of agronomic variables, encompassing biomass, TKW, spikes per square meter (Spk/m
2) and grams per square meter (G/m
2). The interrelationships among these variables are depicted in
Figure 7, where the correlation coefficients, magnitude and orientation of each association are exhibited.
In our comprehensive five-year study, we observed a strong correlation between crop yield and biomass (r = 0.60, p < 0.001), particularly in recently released wheat varieties, such as ‘Faraj’, ‘Luiza’ and ‘Itri’, which consistently outperformed older varieties in these aspects. Interestingly, while nitrogen application significantly enhanced yield and biomass, its impact on TKW and spikes per square meter (Spk/m2) was less pronounced, suggesting a nuanced influence on different yield components. Furthermore, the uniform response of various genotypes to nitrogen fertilization indicates a stable interaction across varieties, underscoring the importance of genotype selection in tandem with tailored nitrogen management for optimal wheat production. These findings highlight the complex interplay of genetic factors and agronomic practices in determining crop productivity, offering valuable insights for future agricultural strategies.
4. Discussion
The findings of this investigation complement existing research, underscoring the pivotal role of both genotype selection and nitrogen application in influencing crop productivity. The marked superiority of recently released varieties, such as ‘Faraj’, ‘Luiza’ and ‘Itri’, in terms of yield, biomass and yield components highlights the potential benefits of adopting these improved genotypes to boost crop productivity [
25,
26].
It was also observed that nitrogen application significantly influences the yield, biomass and TKW—a result, which aligns with prior studies reporting enhanced wheat productivity linked with optimal nitrogen fertilization [
27,
28,
29,
30]. Nevertheless, Spk/m
2, G/m
2 and G/S largely demonstrated a non-response to nitrogen application; it is important to consider that the ANOVA analysis did reveal a near significant effect of nitrogen on Spk/m
2 (
p = 0.071). This might hint at a developing trend not yet reaching conventional significance, suggesting that factors such as environmental conditions, soil fertility and specific management practices may exert a more substantial influence on these parameters [
31].
One of the critical discoveries in this study was the lack of a significant interaction between nitrogen application and variety across all the investigated parameters. This outcome implies that the response of different genotypes to nitrogen fertilization is consistent across varieties. This finding is corroborated by previous research, such as that conducted by Peake et al. [
32]. Their study revealed a noteworthy correlation among the genotype, environment and agronomic management with grain yield and lodging. This indicates that specific agronomic techniques, including particular nitrogen fertilization practices, could be broadly applicable across different varieties. Our study further emphasizes the importance of understanding the interplay of these variables in order to optimize grain yield. Moreover, an extensive examination by Kartseva et al. [
33] revealed that diverse approaches to mitigating osmotic stress can be ascribed to variations in genetic make-up. This emphasizes that while the response to nitrogen fertilization may be generally uniform, the reaction to stress mitigation techniques can significantly vary across different genotypes due to their unique genetic characteristics [
34].
Through a meticulous analysis of the association between crop yield and biomass, a robust and affirmative correlation was unearthed, thereby fortifying the prevailing understanding that the production of biomass plays a pivotal role in determining the ultimate grain yield. This aligns with the study by Balcha and Ayana [
35], which found a positive correlation between grain yield and biomass yield in wheat genotypes. The importance of biomass in realizing high yield potential in wheat is a commonly echoed sentiment in earlier studies [
36,
37]. The observed positive correlations between yield and Spk/m
2, G/m
2 and G/S indicate that enhancing plant density, grain production and the number of grains per spike could potentially lead to increased wheat yields [
38,
39,
40,
41].
An intriguing finding in this study is the negative correlation between TKW and Spk/m
2, suggesting a potential trade-off between kernel weight and plant density. This observation is corroborated by previous research [
42,
43]. The evidence of a trade-off between kernel weight and plant density further complicates the picture. Increasing plant density could potentially lead to smaller kernels, which could limit the potential yield increase from greater plant densities [
44]. Hence, the development of varieties, which can maintain kernel weight while increasing plant density, may represent a fruitful area for future research and breeding efforts. The positive correlation between Spk/m
2 and G/m
2 indicates that an increase in plant density could potentially stimulate greater grain production. In contrast, the negative correlation between Spk/m
2 and G/S implies a potential reduction in the number of grains per spike as plant density increases.
Despite the study revealing no significant effect of the interaction between nitrogen and variety on several parameters, it offers crucial insights. The consistent reaction of various wheat varieties to nitrogen fertilization among the genotypes is consistent with prior studies, which have shown comparable responses in wheat genotypes [
45,
46]. This consistency suggests that the nitrogen effect is independent of variety type.
However, the significant influence of nitrogen and variety as separate factors underscores the necessity for informed selection of the appropriate variety and nitrogen fertilization strategy to achieve large crop yields. Hence, this investigation underscores the significance of comprehensively comprehending the interplay between genetic and environmental factors in relation to wheat productivity, as this is crucial for augmenting crop productivity.
Within the expansive framework of sustainable agriculture, the discoveries put forth in this study provide a persuasive argument in favor of adopting an integrated methodology for crop management. The successful cultivation of wheat requires a meticulous approach, which encompasses not only a careful choice of ideal wheat genotypes but also a profound comprehension of the intricate dynamics between various factors, including nitrogen fertilization, environmental conditions and management practices. With ever-increasing pressures on global food security due to population growth and climate change, such informed and targeted crop management strategies will be indispensable in achieving sustainable increases in crop productivity.
Consequently, the results support the notion that breeders should strive to develop new varieties with improved nitrogen efficiency. A variety possessing enhanced nitrogen utilization capabilities has the potential to yield higher crop production while concurrently minimizing the requirement for fertilization, thus serving as a means to alleviate the ecological consequences associated with excessive nitrogen fertilizer application [
47]. In light of the potential consequences associated with excessive application of nitrogen in agricultural systems, the aforementioned discoveries underscore the significance of conducting scientific investigations in order to foster the establishment of sustainable and ecologically sound farming methodologies.
Another crucial aspect in this discussion is the relationship between plant density (Spk/m
2), grain production (G/m
2) and the number of grains per spike (G/S). The study’s findings suggest that a more thorough understanding of these relationships could offer the pathways for enhancing wheat yield. By identifying and implementing optimal plant densities, we may be able to boost grain production and, in turn, overall yield. However, caution should be exercised in pursuing this strategy, as there appears to be a negative trade-off between plant density and the number of grains per spike [
48]. This observation is corroborated by previous research [
49]. The evidence of a trade-off between kernel weight and plant density further complicates the picture. Increasing plant density could potentially lead to smaller kernels, which could limit the potential yield increase from greater plant densities. Hence, the development of varieties, which can maintain kernel weight while increasing plant density, may represent a fruitful area for future research and breeding efforts.
In addition to the aforementioned observations, our comprehensive five-year investigation (2017–2021) consistently demonstrated that diverse wheat varieties responded differently to varying nitrogen levels. Our study made the crucial observation that the annual climatic conditions were the main factor influencing these divergent responses. Temperature, rainfall, sunlight and other factors significantly affected the different varieties’ responses to nitrogen fertilization, suggesting a significant interaction between climatic conditions and nitrogen utilization efficiency. This underscores the need for adaptive management strategies, which account not only for the genetic attributes associated with diverse wheat varieties but also for the changing characteristics of the ecosystem in which they are grown, particularly in the newer varieties ‘Faraj’, ‘Luiza’ and ‘Itri’. Yield, biomass, TKW, the number of spikes per square meter (Spk/m
2), grains per square meter (G/m
2) and the number of grains per spike (G/S) varied across the different wheat varieties and nitrogen rates, supporting the findings of Yadav et al. [
50], who reported significant genetic variability in these traits among different wheat varieties.
The ANOVA results over the five years indicate that both the variety and nitrogen rate significantly influence yield and other agronomic traits. This aligns with the findings of Sedri et al. [
51], who reported that different physiological traits, including yield, were significantly affected by various water conditions—an environmental factor comparable to nitrogen rate in our study. The precipitation data for each year also enrich the context of the results. For instance, 2018 saw the greatest precipitation and showed significant effects of nitrogen rate on biomass and TKW, possibly due to the increased water availability enhancing nitrogen’s impact on these traits. This is supported by Shibeshi and Kassa [
52], who found that environmental conditions, including water availability, can significantly influence wheat yield and other agronomic traits.
Additionally, the results suggest that the new varieties, ‘Luiza’ and ‘Itri’, have been optimized for high grain yield—a finding, which resonates with the complex trait interplay reported by Zhang et al. (2020) [
53]. The ‘Faraj’ variety seems to have been bred with a focus on spike density—a trait highlighted for its importance in wheat yield by Joudi et al. (2017) [
54]. The association of the ‘Nassira’ variety with high TKW suggests an emphasis on breeding for grain weight—a trait positively correlated with grain yield, as reported by Alonso et al. (2018) [
55] and Racz et al. (2019) [
56]. The positioning of the older variety, ‘Karim’, on the opposite side of the bi-plot suggests that it might possess different agronomic characteristics, likely due to different selection pressures during its development. These findings underscore the importance of targeted breeding strategies to optimize key agronomic traits, thereby enhancing wheat yield under various environmental conditions.
The observed positive correlation between TKW and application of the greatest nitrogen application rate (N1 120 U) is in line with the research conducted by Derkx et al. [
57]. Their study on wheat demonstrated that increased nitrogen application rates resulted in increased nitrogen uptake, leading to the formation of larger—albeit fewer—grains. This phenomenon could be attributed to the presence of nitrogen, a vital element for plant physiological processes, which plays a significant role in increasing grain size and weight. The observations put forward by Wójtowicz et al. [
58] provide additional evidence that the number of spikes per square meter significantly influences grain yield, especially when nitrogen doses are varied. The correlation between the density of spikes per unit area and G/m
2, in conjunction with application of the N2 60 kg nitrogen application rate, suggests that a moderate level of nitrogen fertilization could potentially enhance these specific yield attributes. The findings by Guo et al. [
59] support our current understanding of agronomic principles. They reported a noteworthy association between grain yield and two key factors: kernel number and thousand-kernel weight. This implies that specific clusters of wheat varieties have the potential to optimize yield traits, such as the number of grains per square meter. Moreover, the positioning of yield and biomass between the N1 and N2 nitrogen doses on the PCA plot is a significant finding. It suggests that an intermediate nitrogen dose, between N1 and N2, could potentially result in optimal yield and biomass. The findings of this study hold significant implications for the field of agronomy, particularly in relation to agricultural practices. The results indicate that a meticulous regulation of nitrogen application has the potential to enhance crop productivity to a considerable extent. This assertion is corroborated by the research conducted by Farkas et al. [
60], wherein they discovered that wheat genotypes exhibiting favorable adaptability to diverse nitrogen levels exhibited the highest water use efficiency. Nevertheless, it is imperative to acknowledge that the aforementioned discoveries are predicated upon a single investigation, thereby necessitating additional scientific inquiry to validate and ascertain the precise nitrogen dosage, which optimizes both crop productivity and biomass accumulation. Future investigations should additionally take into account other variables, which have the potential to exert an influence on both crop yield and biomass production. These variables encompass, but are not limited to, soil composition, meteorological conditions and the specific genetic make-up of the cultivated crop. Huang et al. [
61] suggested that good quality, high yield and high efficiency could be achieved through selection of high-quality wheat varieties and nitrogen accumulation and translocation.
In conclusion, this comprehensive study underscores the importance of both the selection of an appropriate variety and optimal nitrogen fertilization strategy for wheat cultivation. However, the results also suggest that other variables, including plant population density and grain output, exert a substantial impact on crop yield and must be considered within a holistic agricultural management approach. Furthermore, the observed trade-offs among certain variables indicate that achieving optimal yield may necessitate a careful balance between these conflicting requirements. The collaboration between breeders and agronomists is crucial to optimizing the utilization of genetic advancements in conjunction with optimal agricultural techniques, thereby enhancing wheat productivity in a sustainable manner. In light of an escalating global food demand and the urgent need for environmentally friendly agricultural methods, the importance of adopting an integrated approach cannot be overstated.
Production largely depends on the variety, year and their interaction, as indicated by Kolarić et al., Popović et al. and Stevanović et al. [
62,
63,
64]. Profitable production based on high yields is impossible without the application of high doses of mineral or organic fertilizers, according to Stevanović et al. [
64]. Fertilization is also important for grain quality. These insights reinforce the complexity of agricultural systems and the multi-faceted approach needed for yield optimization. Studies of this nature yield invaluable insights, which can guide this undertaking, presenting pragmatic approaches to augmenting efficiency and resilience in the face of constantly mounting challenges. By cultivating a deeper understanding of the intricate dynamics between genetic predispositions and environmental influences, we can enhance our preparedness to guarantee the sustenance of our food supply and advance the principles of sustainable agriculture in the forthcoming era. It is imperative to pursue further investigations in this domain, as augmenting our knowledge repository will enhance our capacity to effectively meet the escalating demands of our global population. Research endeavors such as this study serve as fundamental pillars in elucidating optimal methodologies and guiding subsequent investigations, thereby transcending the confines of wheat cultivation to encompass broader implications. The discoveries made by researchers significantly contribute to advancing our shared knowledge in the field of agronomy, with the ultimate goal of ensuring the long-term viability and improvement of global food security.


