Article

Empirical Correlation between Electrical Conductivity and Nitrogen Content in Biochar as Influenced by Pyrolysis Temperature

by
Everton Geraldo de Morais
1,*,
Carlos Alberto Silva
1,*,
Suduan Gao
2,
Leônidas Carrijo Azevedo Melo
1,
Bruno Cocco Lago
1,
Jéssica Cristina Teodoro
1 and
Luiz Roberto Guimarães Guilherme
1,*
1
Department of Soil Science, Federal University of Lavras, University Campus, P.O. Box 3037, Lavras 37203-202, MG, Brazil
2
USDA—Agricultural Research Service, San Joaquin Valley Agricultural Sciences Center, 9611 South Riverbend Avenue, Parlier, CA 93648-9757, USA
*
Authors to whom correspondence should be addressed.
Nitrogen 2024, 5(2), 288-300; https://doi.org/10.3390/nitrogen5020019
Submission received: 7 March 2024 / Revised: 31 March 2024 / Accepted: 7 April 2024 / Published: 9 April 2024

Abstract

:
Much progress has been made in understanding the conditions of biochar production related to biochar properties and carbon (C). Still, very little knowledge has been gained regarding the effects on nitrogen (N), one of the most critical nutrients affected by pyrolysis temperature (PT). Analysis of N in biochar is costly, and alternative methods should be developed to estimate the N content in biochar quickly under different pyrolysis conditions. We hypothesized that there was a correlation between biochar N content and its electrical conductivity (EC). We aimed to evaluate total N and the effect of PT through the correlation with EC, a parameter that can be easily measured. Biochar products derived from coffee husk (CH) and chicken manure (CM) produced at increasing PT (300 to 750 °C) were used for the study and measured for total N and EC. The increase in PT caused significant N loss, consequently reducing total N content in biochars, with the highest loss (82%) and lowest total N content (1.2 g kg−1) found in CM biochar pyrolyzed at 750 °C. The lowest N loss (21% for CH biochar and 36% for CM biochar) was observed at a PT of 300 °C. A negative correlation between EC and total N and a positive correlation with N loss were found in both biochar products across the wide range of PT investigated. To preserve the N content in biochars, the PT should not exceed 400 °C. Our results indicate that EC is a fast and accurate biochar proxy attribute capable of predicting the N content and its loss in coffee husk and chicken manure-derived biochars as the pyrolysis temperature increased from 300 °C to 750 °C and could be used as an alternative to predict the N in biochar easily. A more extensive set of biochar samples and pyrolysis conditions should be tested to validate this approach.

1. Introduction

Biochar is a carbon-rich material produced from the thermal decomposition of agricultural, animal, and industrial organic wastes in the absence or low levels of oxygen [1,2,3,4]. The application of biochar has become an environmentally friendly management practice for sustainable agriculture due to its properties and soil stability [5,6]. The type of feedstocks used in pyrolysis processes depends on their local availability, elemental composition, and physical characteristics, and these factors determine biochar production and widespread use [6,7,8]. The conversion of organic waste into biochar and its use in agricultural fields promotes nutrient recycling, and the magnitude of positive effects on soil relies on biochar properties, application rate and frequency, and interaction with the soil constituents and plants [2,3,9,10]. Much progress has been made in biochar production and characterization. Still, to this date, there is a lack of a better understanding of how to maximize biochar benefits regarding N preservation, as this element is subject to significant loss and transformation during pyrolysis [11].
The pyrolysis temperature (PT) is a crucial factor influencing the N content in biochar, which interacts with the feedstock elemental composition [3,7,8,11,12,13,14]. For instance, manures are rich in N and phosphorus, which can result in a nutrient-rich biochar, while plant-based materials mostly yield biochars that are poor in N and have a greater persistence [7,11,15,16,17]. In Brazil, chicken manure (CM) and coffee husk (CH) are available in large amounts [18]. In 2020, it was estimated that around 33.7 million tons of CM and 3.0 million tons of CH were produced, making them promising feedstocks for biochar production [4,10,19]. These materials contain approximately 30 and 17 g kg−1 of total N, 28 and 42 g kg−1 of total potassium (K), and 34 and 1.2 g kg−1 of total P for CM and CH, respectively [18]. Thus, they represent an important source of C and nutrients that could be applied to soils and partially replace chemical fertilizers with properties that allow their inclusion and use according to Brazilian legislation [7,20].
Nitrogen is among the elements that are sensitive to temperature, and it sharply volatilizes as the charring conditions intensify [10,12,13,15,16,21,22,23,24], resulting in N losses or being converted into more stable N compounds [12,25]. At elevated PT (>500 °C), chemical bonds of nitrogenous compounds are broken, promoting the volatilization of N as ammonia (NH3) and nitrogen oxides (NOx) [12,23,24,25,26]. It has been shown that protein N and inorganic N prevailed in soybean straw and Chlorella feedstocks under lower PT (300 °C) and were converted to pyridinic N, pyrrolic N, graphitic N (or quaternary N), and pyridinic N–O as PT was increased to 800 °C [24]. High PT is typically used to stabilize C, increase surface area, and increase porosity [3,5,14]. Research on the possibility of preserving high N content in biochar production is extremely limited.
The increase in PT promotes the decomposition of acidic groups in the feedstock and increases the biochar EC [27,28,29,30]. However, this effect is better observed in the same feedstock, considering the influence of ash, salts, and ions on the EC of the biochars derived from different feedstocks [7,27,28,30]. Thus, a relationship is expected between the increase in EC of biochars and a decrease in N contents, as well as greater N losses as the pyrolysis conditions are intensified. For the same PT, a feedstock with higher N content is expected to generate a biochar with higher N content. Conversely, the magnitude of N loss at increasing PT is modulated by the elemental composition, ash content, and the presence in the feedstock of components that ensure a lower conversion of N into volatile N chemical species. Due to the complexity of N in biochar, the most suitable method for determining N is through the Elemental Analyzer by combustion, which is costly, generates waste, and is time-consuming. Thus, it would be a valid alternative if the N content in biochar could be estimated by the low-cost and easy method used to measure EC in biochar [31,32].
We hypothesized that (i) as PT increases, biochar EC and N losses also increase, while the total N content is reduced; (ii) biochar EC can be used to effectively estimate N content as PT is intensified. Thus, the aims of this study were as follows: (i) to determine N losses and N contents in CM (high N source) and CH (low N source) feedstocks derived biochar subjected to increasing PT (300–750 °C); (ii) to determine how N evolution during pyrolysis is correlated with easily determined biochar properties; and (iii) to model with regression equations and the capacity of EC to estimate N retention or loss as the pyrolysis conditions are intensified.

2. Materials and Methods

Coffee husk (CH) and chicken manure (CM) were collected from farms near Lavras, State of Minas Gerais, Brazil, due to their high availability in Brazil, especially in the region from which they were collected. The materials were dried in a forced-air circulation oven at 60 °C until a constant weight was achieved. The main properties of the feedstocks are shown in Table 1. After drying, both feedstocks were pyrolyzed at various PTs as follows: 300; 400; 450; 500; 550; 600; and 750 °C using a muffle furnace with a stainless-steel chamber built to avoid the entry of oxygen. The heating rate was 10 °C min−1, and when the desired PT was achieved, it was maintained for 60 min, followed by slow cooling down to room temperature before opening the chamber.
After the pyrolysis process, the biochar mass was weighed, and the biochar yield was calculated based on the initial mass used in the pyrolysis, following Equation (1).
Biochar yield (%) = (Final mass of biochar/Initial mass of feedstock) × 100
The total C content of all biochars was determined using a dry combustion C analyzer (Elementar, model Vario TOC Cube, Langenselbold, Germany). The pH of the biochar was measured in water at a ratio of 1 g of biochar to 10 mL of deionized water, and the readings were performed in a bench-top pH meter (Hanna Instruments, HI2221, Smithfield, USA) [33]. Biochar ash content was assessed by heating the biochar samples at 750 °C for 6 h; the mass of the residual material after incineration was the ash content, following Equation (2) [7].
Ash (%) = (Mass of biochar at 750 °C/Initial mass of biochar) × 100
The EC of the biochar samples was measured at a ratio of 1 g of biochar to 10 mL of deionized water using a conductivity meter (Mettler 175 Toledo, FE30, Columbus, OH, USA) [33]. The total N content in the biochar samples was determined using an automatic Nitrogen Analyzer (LECO Series 828, Mönchengladbach, Germany). Based on the initial total N content in the feedstock, the initial mass of feedstock used in pyrolysis, the final total N content in biochar, and the final mass of biochar after pyrolysis, the N loss was calculated using Equation (3):
N   loss   ( % ) = Total   N   content   in   biochar   ×   Mass   of   the   biochar   after   pyrolysis Total   N   content   in   feedstock × Mass   of   the   feedstock   before   pyrolysis × 100
All statistical analyses were performed using the R software version 4.3.1 with the following packages: stats; base; tidyverse; agricolae; factoextra; FactoMineR; and corrplot [34,35,36,37,38]. The dataset of the total N content, N loss, and EC value was adjusted to different nonlinear mathematical models to show the relationship between these variables and increasing PT [9,39,40]. The following mathematical models were adjusted to the biochar attributes and N content and loss as a function of pyrolysis temperature: Linear model (Equation (4)); Quadratic model (Equation (5)); Elovich model (Equation (6)); power function (Equation (7)); and hyperbolic model (Equation (8)).
V = a + b   × PT
V = a + b × PT − b × PT2
V = a + b ln PT
V = a × PTb
V = V 0   ×   PT V 0   ×   b   ×   PT
where V is the variable used (Total N content or N loss or EC) from each feedstock in the temperature of pyrolysis evaluated; a is the initial value of variable used from each biomass at PT of 300 °C; b is the variable rate constant for each feedstock; PT is the temperature of pyrolysis (°C); V0 is the maximum value of the variable used from biomass across the temperature range investigated. The best model was selected based on the highest value of the coefficient of determination (R2), the lowest value of root-mean-square error (RMSE) (Equation (9)), and the lowest value of the Akaike information criterion (AIC) (Equation (10)) [41]. Mathematical models fitted to each variable used over PT were compared using a 95% confidence interval and 1000 bootstrap interactions.
RMSE = i = 1 n ( Predicted   values   -   Observed   values ) 2 Number   of   observations  
AIC = Number   of   observations ×   ln Sum   square   of   erros Number   of   observations   + ( 2 × number   of   parameters )
Additionally, a Pearson correlation analysis was performed to determine the correlation between biochar properties and N content and loss determined for the biochars produced from CH and CM feedstocks [37]. Correlations between EC and total N content, as well as N loss, resulted in the development of linear models that used EC to estimate the total N content in biochar or N loss from pyrolysis for each biochar product. The linear models were created and validated individually for each feedstock used.

3. Results

3.1. Basic Properties of the Biochars

The biochar yield, total C content, pH, and ash content are shown in Table 2. The two types of biochar studied exhibited contrasting properties in terms of yield, C content, and ash content. Both CH- and CM-derived biochars reduced yield as the PT increased. Still, the CM-derived biochar exhibited a higher yield, attributed to its significantly higher ash content than the CH-derived biochar. Regarding C content, the CH-derived biochar increased with rising PT, while the CM-derived biochar showed the opposite trend. Regarding pH, both biochar materials were alkaline and demonstrated a similar trend of increasing pH with higher PT.

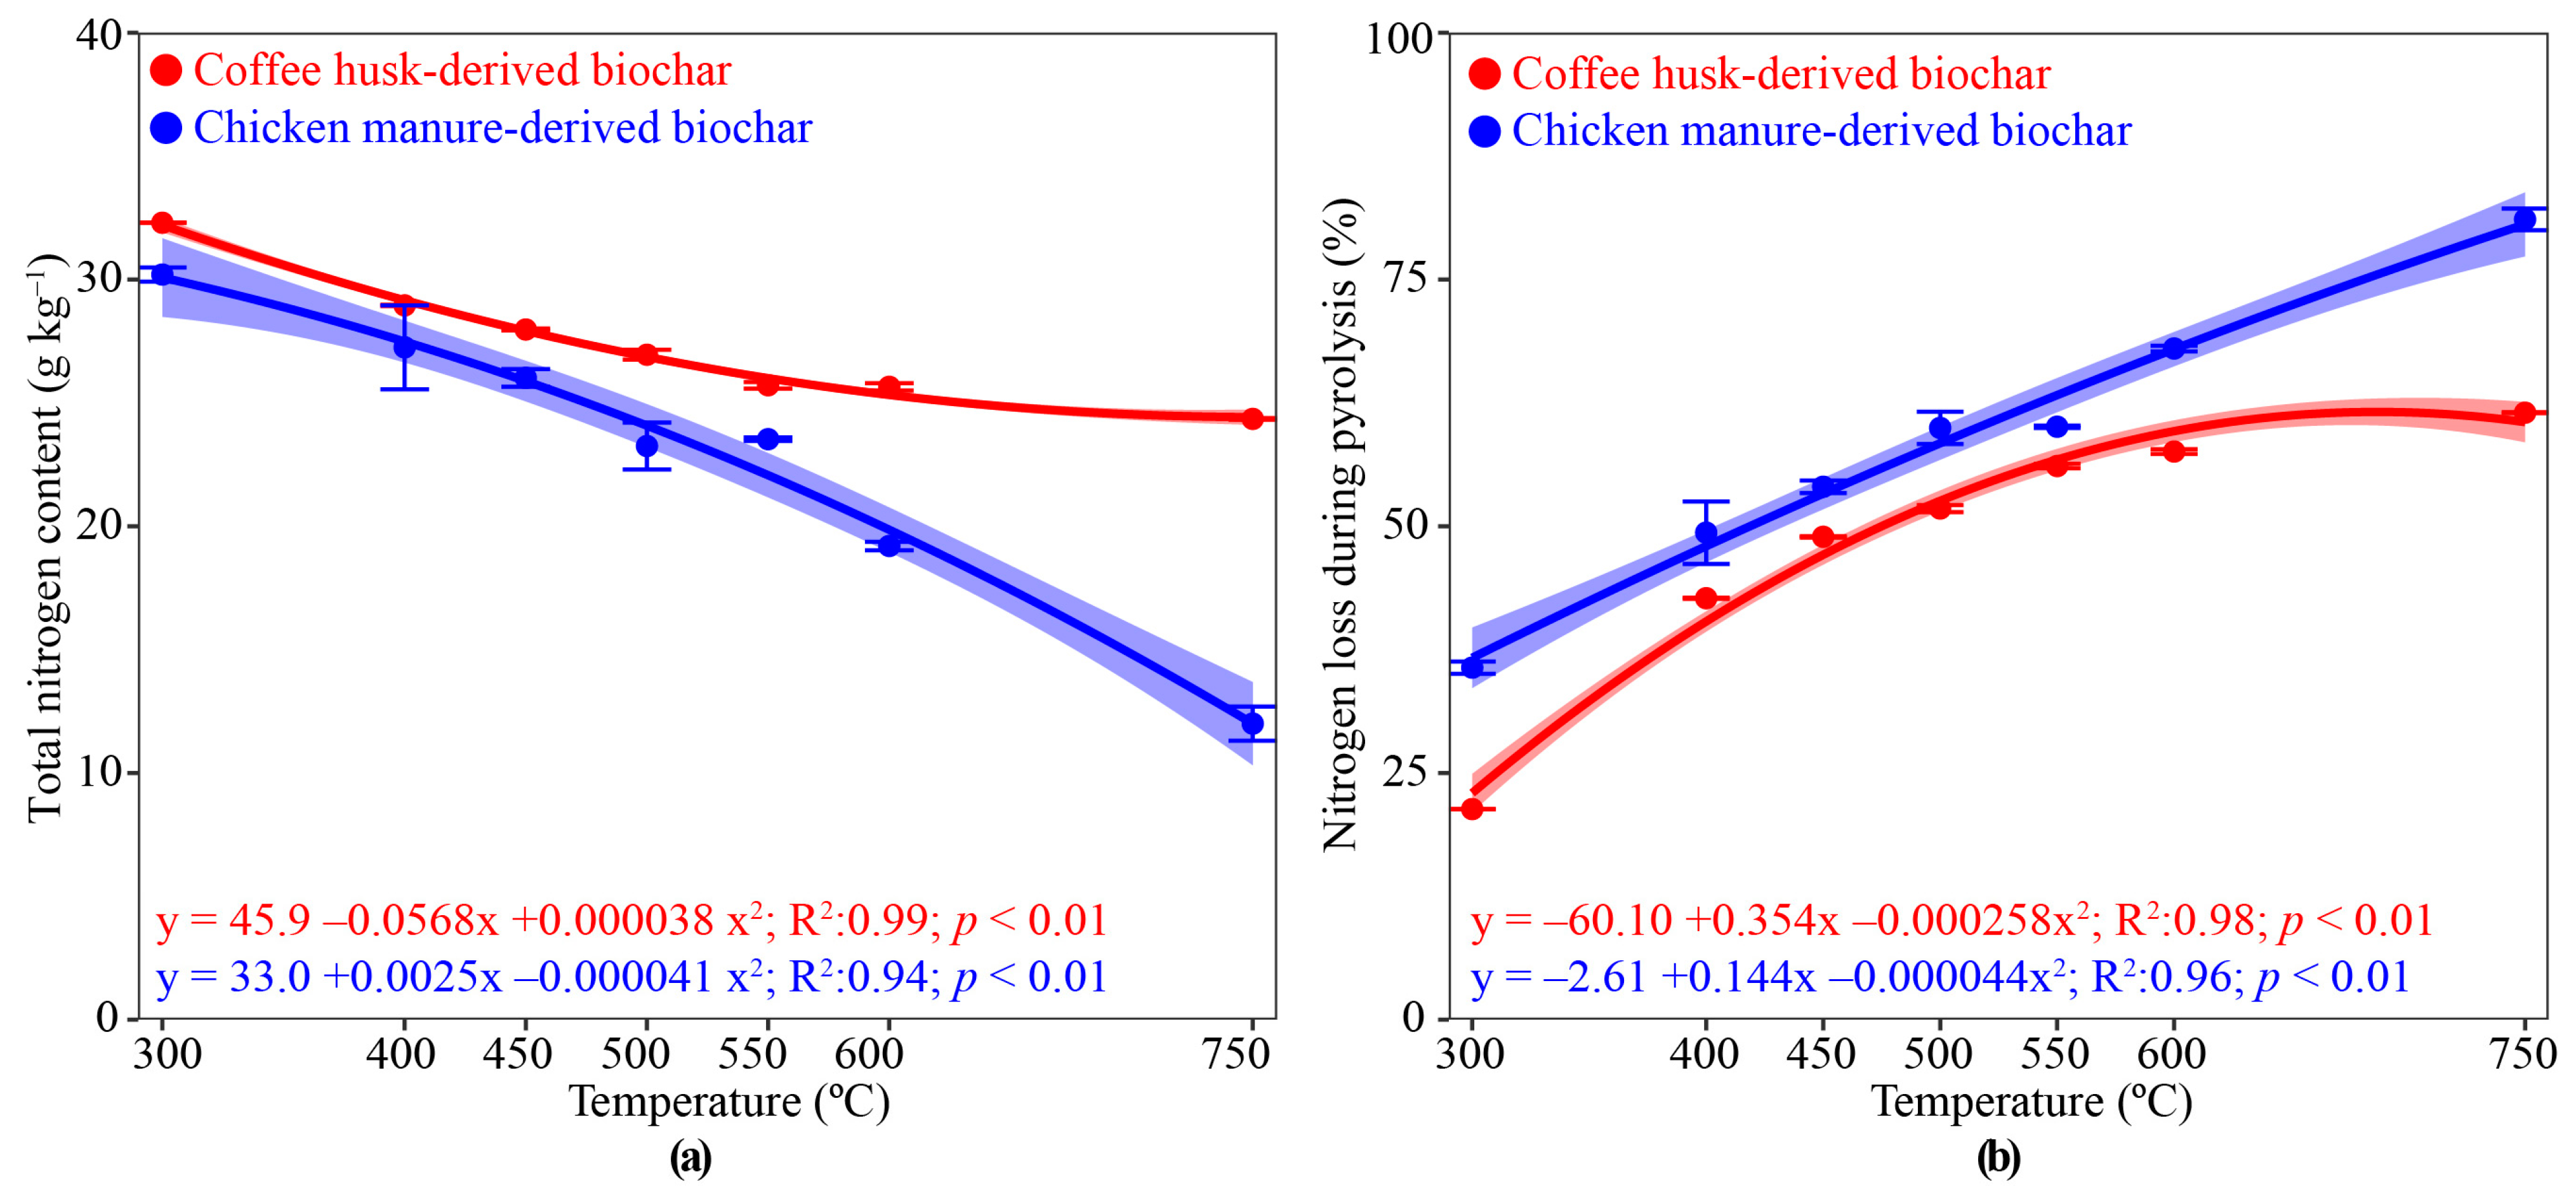
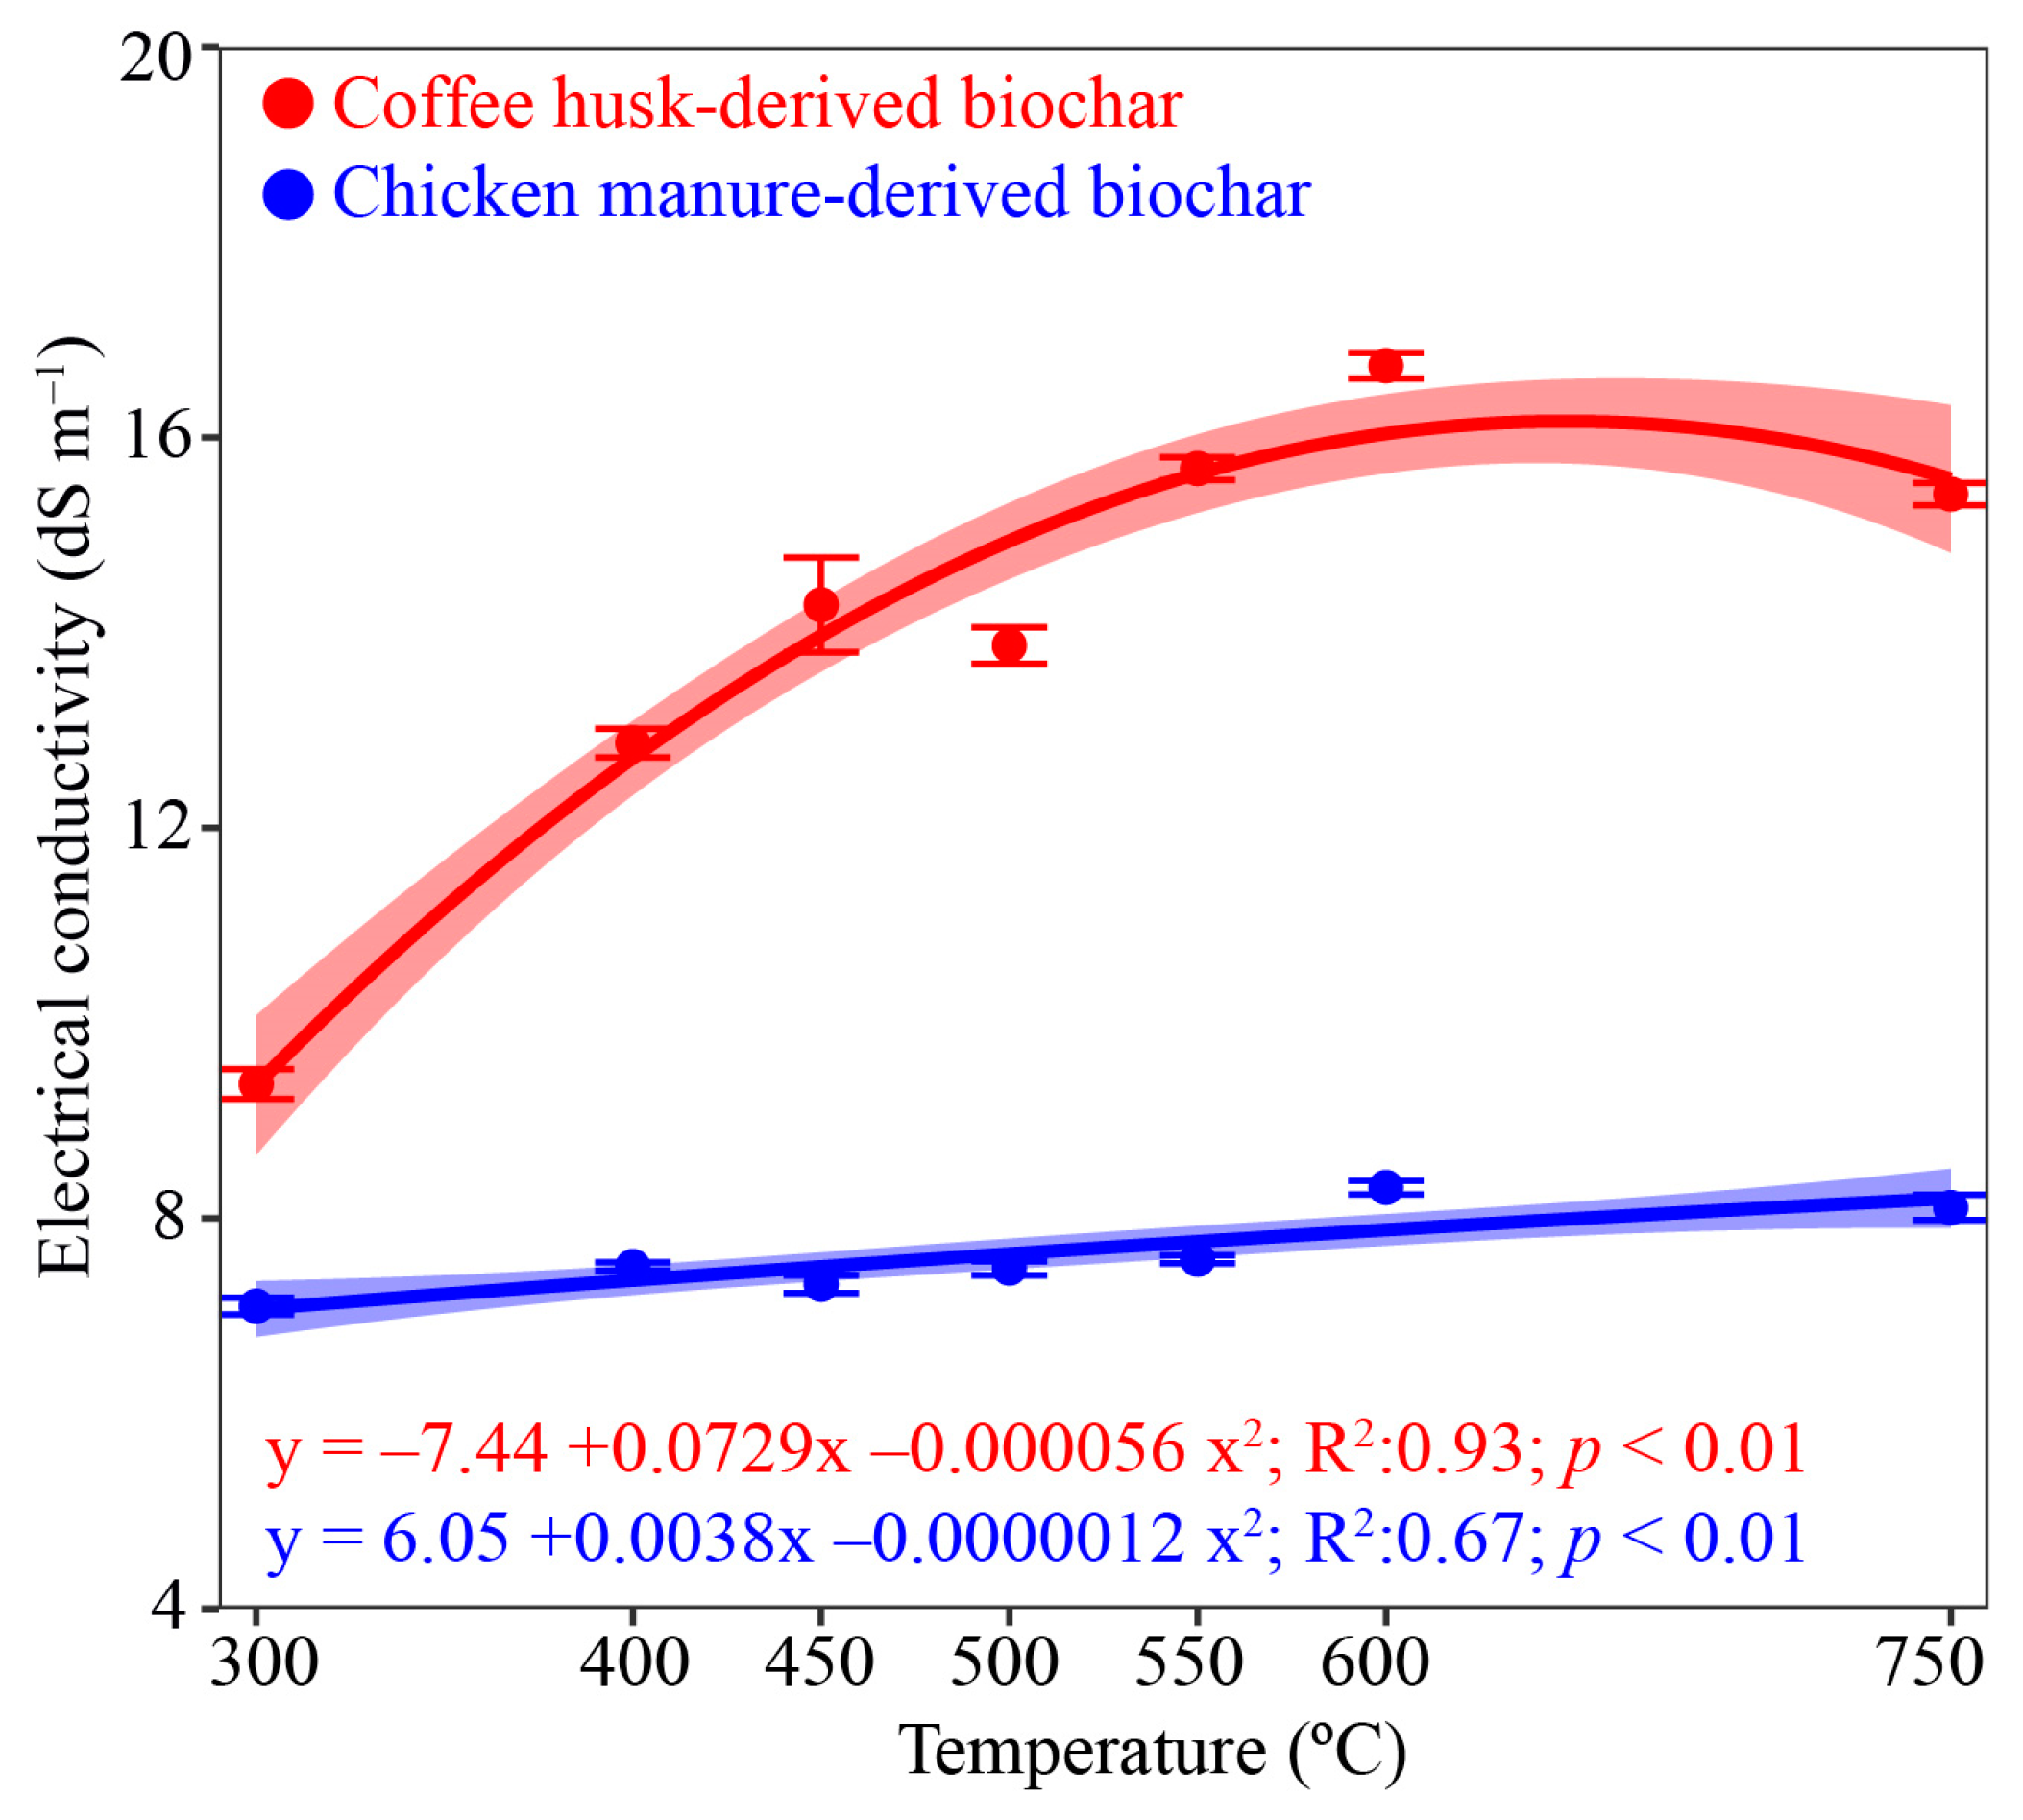
3.2. Biochar Nitrogen and Electrical Conductivity as PT Increased

Evaluating all tested models, the quadratic model best fit the data on total N content, N loss, and EC in CH- and CM-derived biochars as PT increased. Compared with the other models, the quadratic model had the highest R2 values, lowest RMSE values, and lower Akaike information criterion (Table 3).
The highest total N content was found at the lowest PT evaluated (300 °C), regardless of the feedstock used, with contents of 32.3 and 30.2 g kg−1, respectively, for CH- and CM-derived biochars (Figure 1a). These values are equivalent to losses of 21.3% and 35.7%, respectively, from the feedstocks (Figure 1b). For both CH- and CM-derived biochars, the increase in PT reduced total N content and increased N loss. At the highest PT (750 °C), the total N contents were reduced to 24.4 and 12.0 g kg−1 for CH- and CM-derived biochars, respectively, which was equivalent to 61.5% and 81.1% of the CH- and CM-derived biochars, respectively, when compared with the feedstocks.
Despite the total N content being similar in both feedstocks pyrolyzed at 300 °C, the same increase in temperature resulted in a greater N loss in the CM-derived biochar compared with the CH-derived biochar (Figure 1b). The data suggest that N tends to be more preserved in the CH-derived biochar, and after 600 °C, the N loss (57.6%) and total N content (25.7 g kg−1) tended to stabilize up to 750 °C when these values were 61.5% and 24.4 g kg−1, while for the CM-derived biochar, N loss followed a linear increase across the entire range of PT evaluated (Figure 1a,b).
The EC of CH-derived biochar was higher than that of the biochar derived from CM-derived biochars at all PTs evaluated, with the highest value (EC: 16.7 dS m−1) at 600 °C (Figure 2). For CH-derived biochar, the increase in EC due to the rise in PT followed a quadratic model, while for CM-derived biochar, there was a linear increase in EC as PT increased from 300 °C (EC: 7.1 dS m−1) to 750 °C (EC: 8.1 dS m−1).

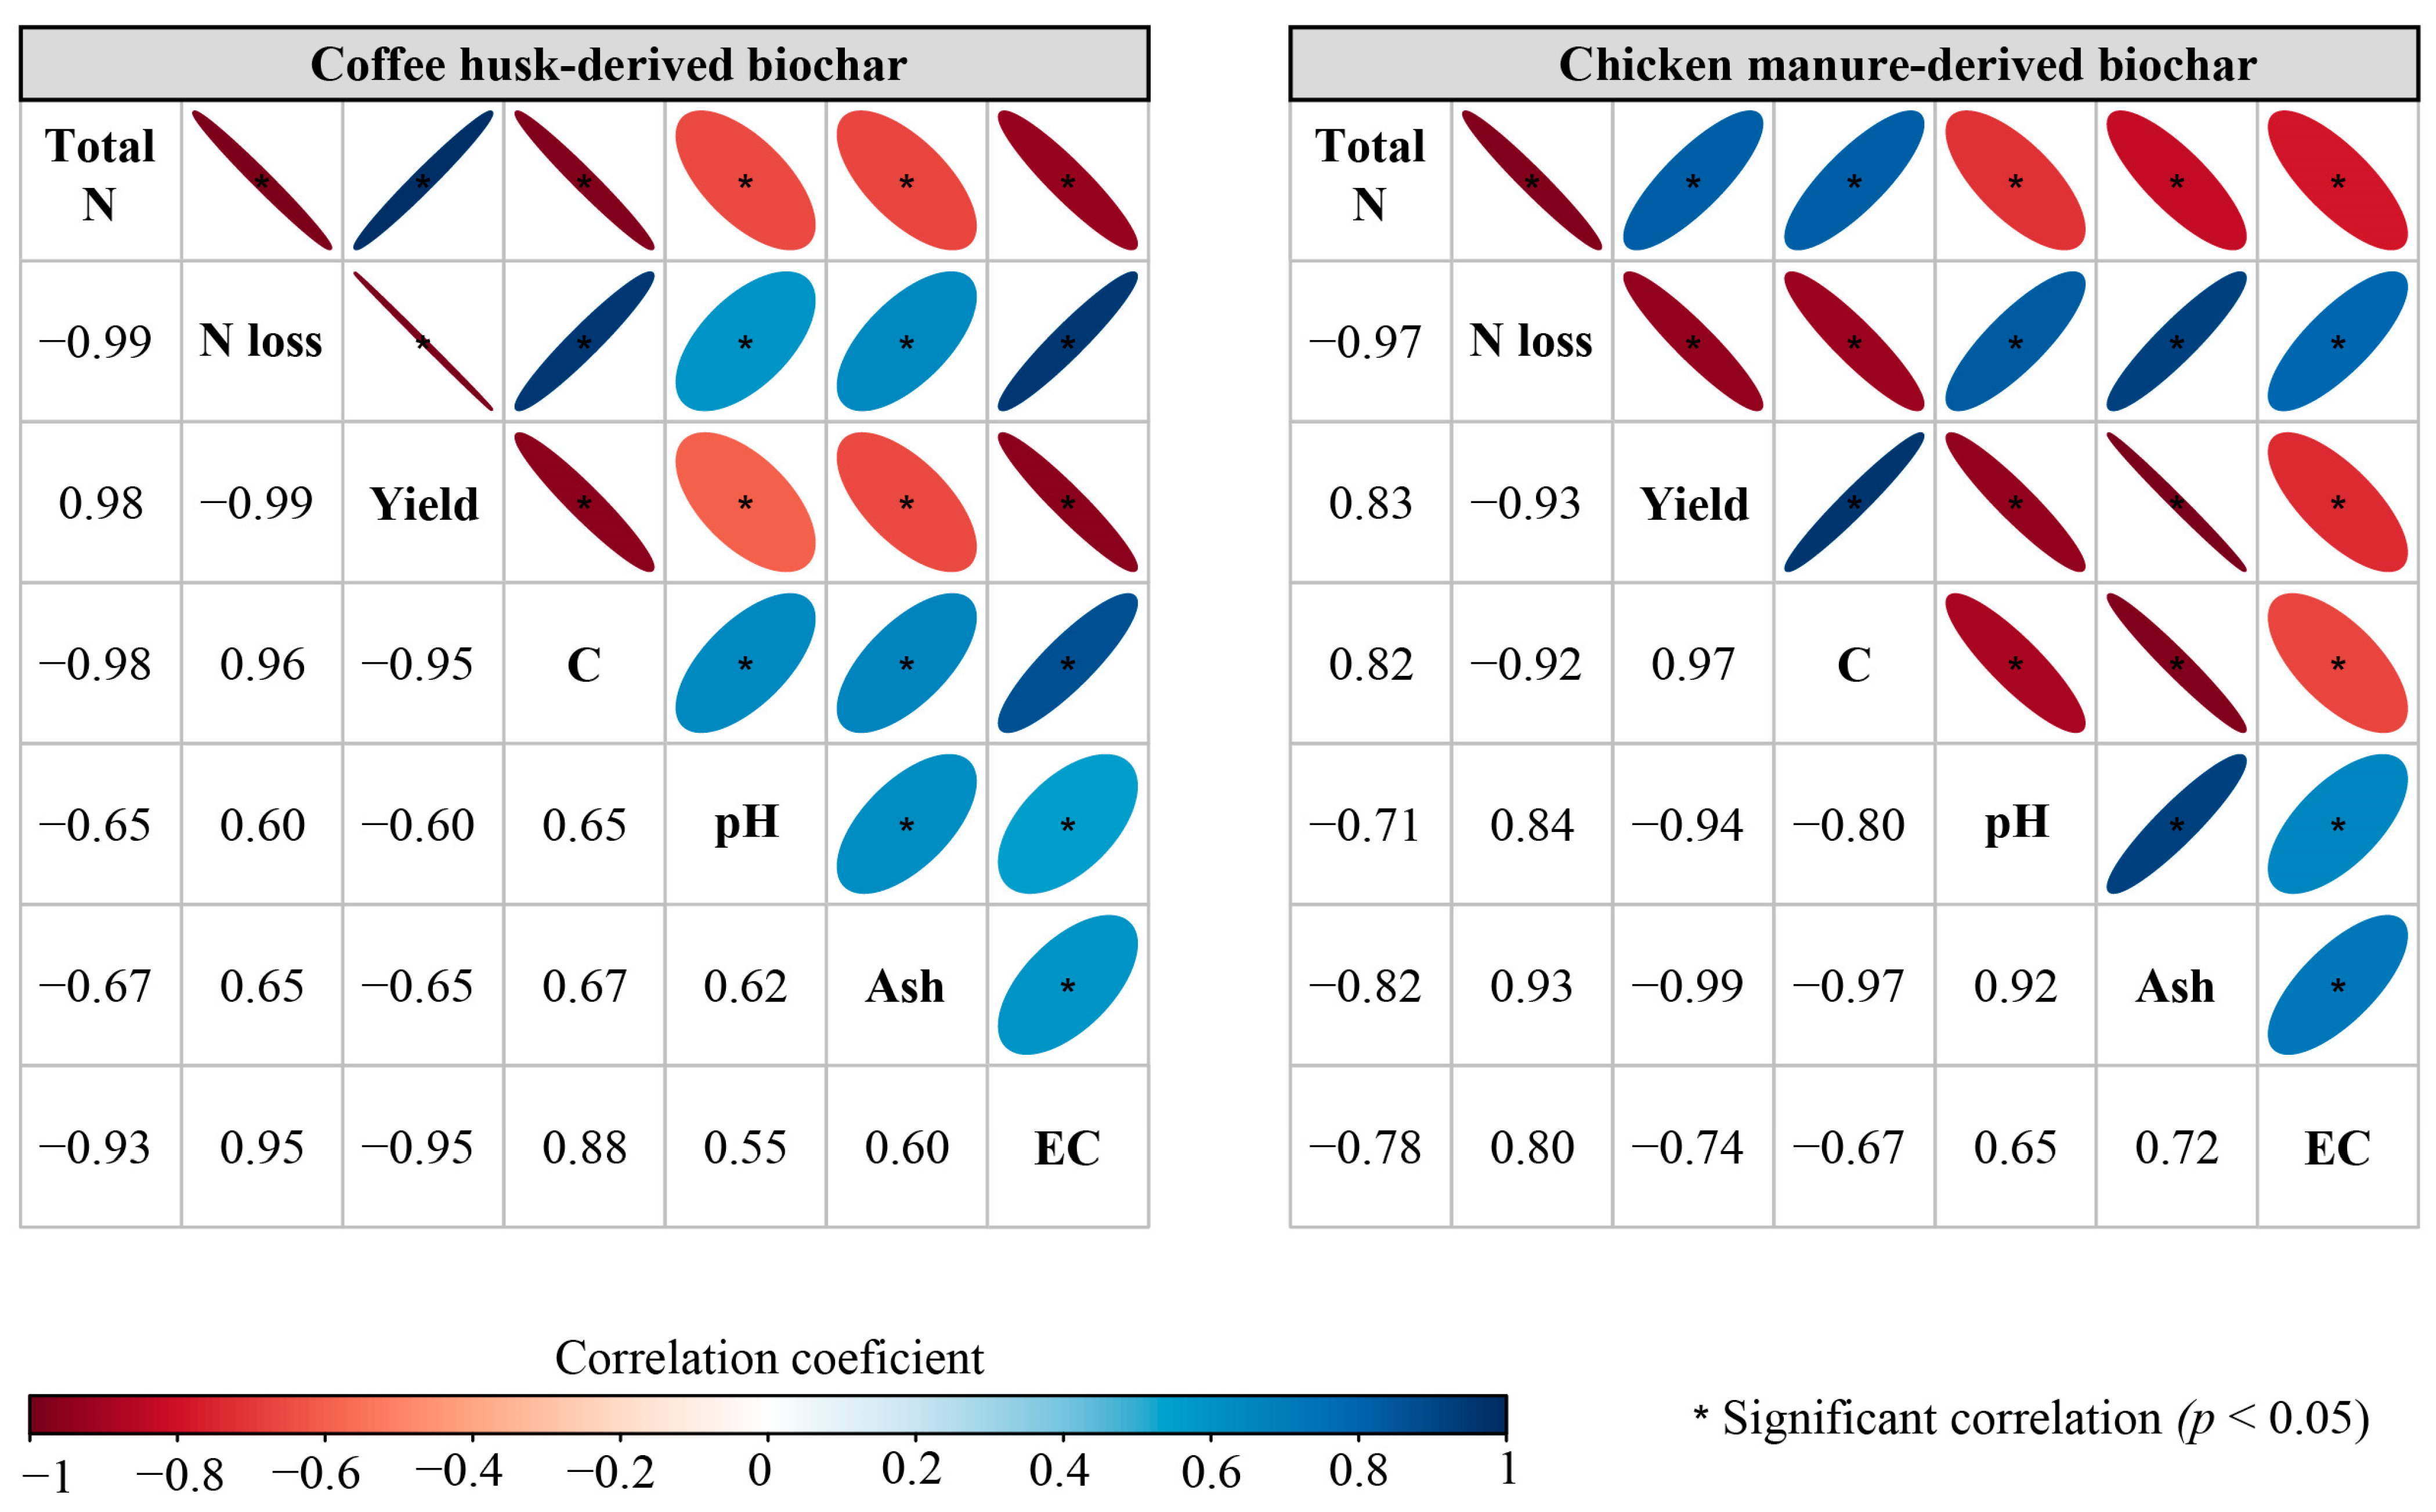
3.3. Correlation Analysis of Biochar Measurements

The total N content in biochars from both biomass-derived biochars (CH and CM) had a positive correlation (p < 0.05) with biochar yield (r: 0.98 and 0.93, respectively, for CH- and CM-derived biochars) (Figure 3). However, there was a negative correlation (p < 0.05) between total N content and the N loss (r: −0.99 and −0.97), biochar pH (r: −0.65 and −0.71), Ash content (r: −0.67 and −0.82), and EC (r: −0.93 and −0.78); the values within parentheses represent CH- and CM-derived biochars, respectively. The N loss in biochars from both biomass-derived biochars (CH and CM) had a negative correlation (p < 0.05) with biochar yield (r: −0.99 and −0.93, respectively, for CH- and CM-derived biochars). However, in both biomass-derived biochars, N loss had a positive correlation (p < 0.05), with pH (r: 0.60 and 0.84), Ash (r: 0.65 and 0.93), and EC (r: 0.95 and 0.80); the values within parentheses represented CH- and CM-derived biochars, respectively.
The total C content was the only variable that correlated with the total N content and N loss depending on the feedstock type (Figure 3). In CH-derived biochar, the total C content had a negative correlation with total N content (p < 0.05; r: −0.98) and a positive correlation with N loss (p < 0.05; r: 0.96). A contrasting trend was observed in CM-derived biochar, where the total C content had a positive correlation with total N content (p < 0.05; r: 0.82) and a negative correlation with N loss (p < 0.05; r: −0.92).

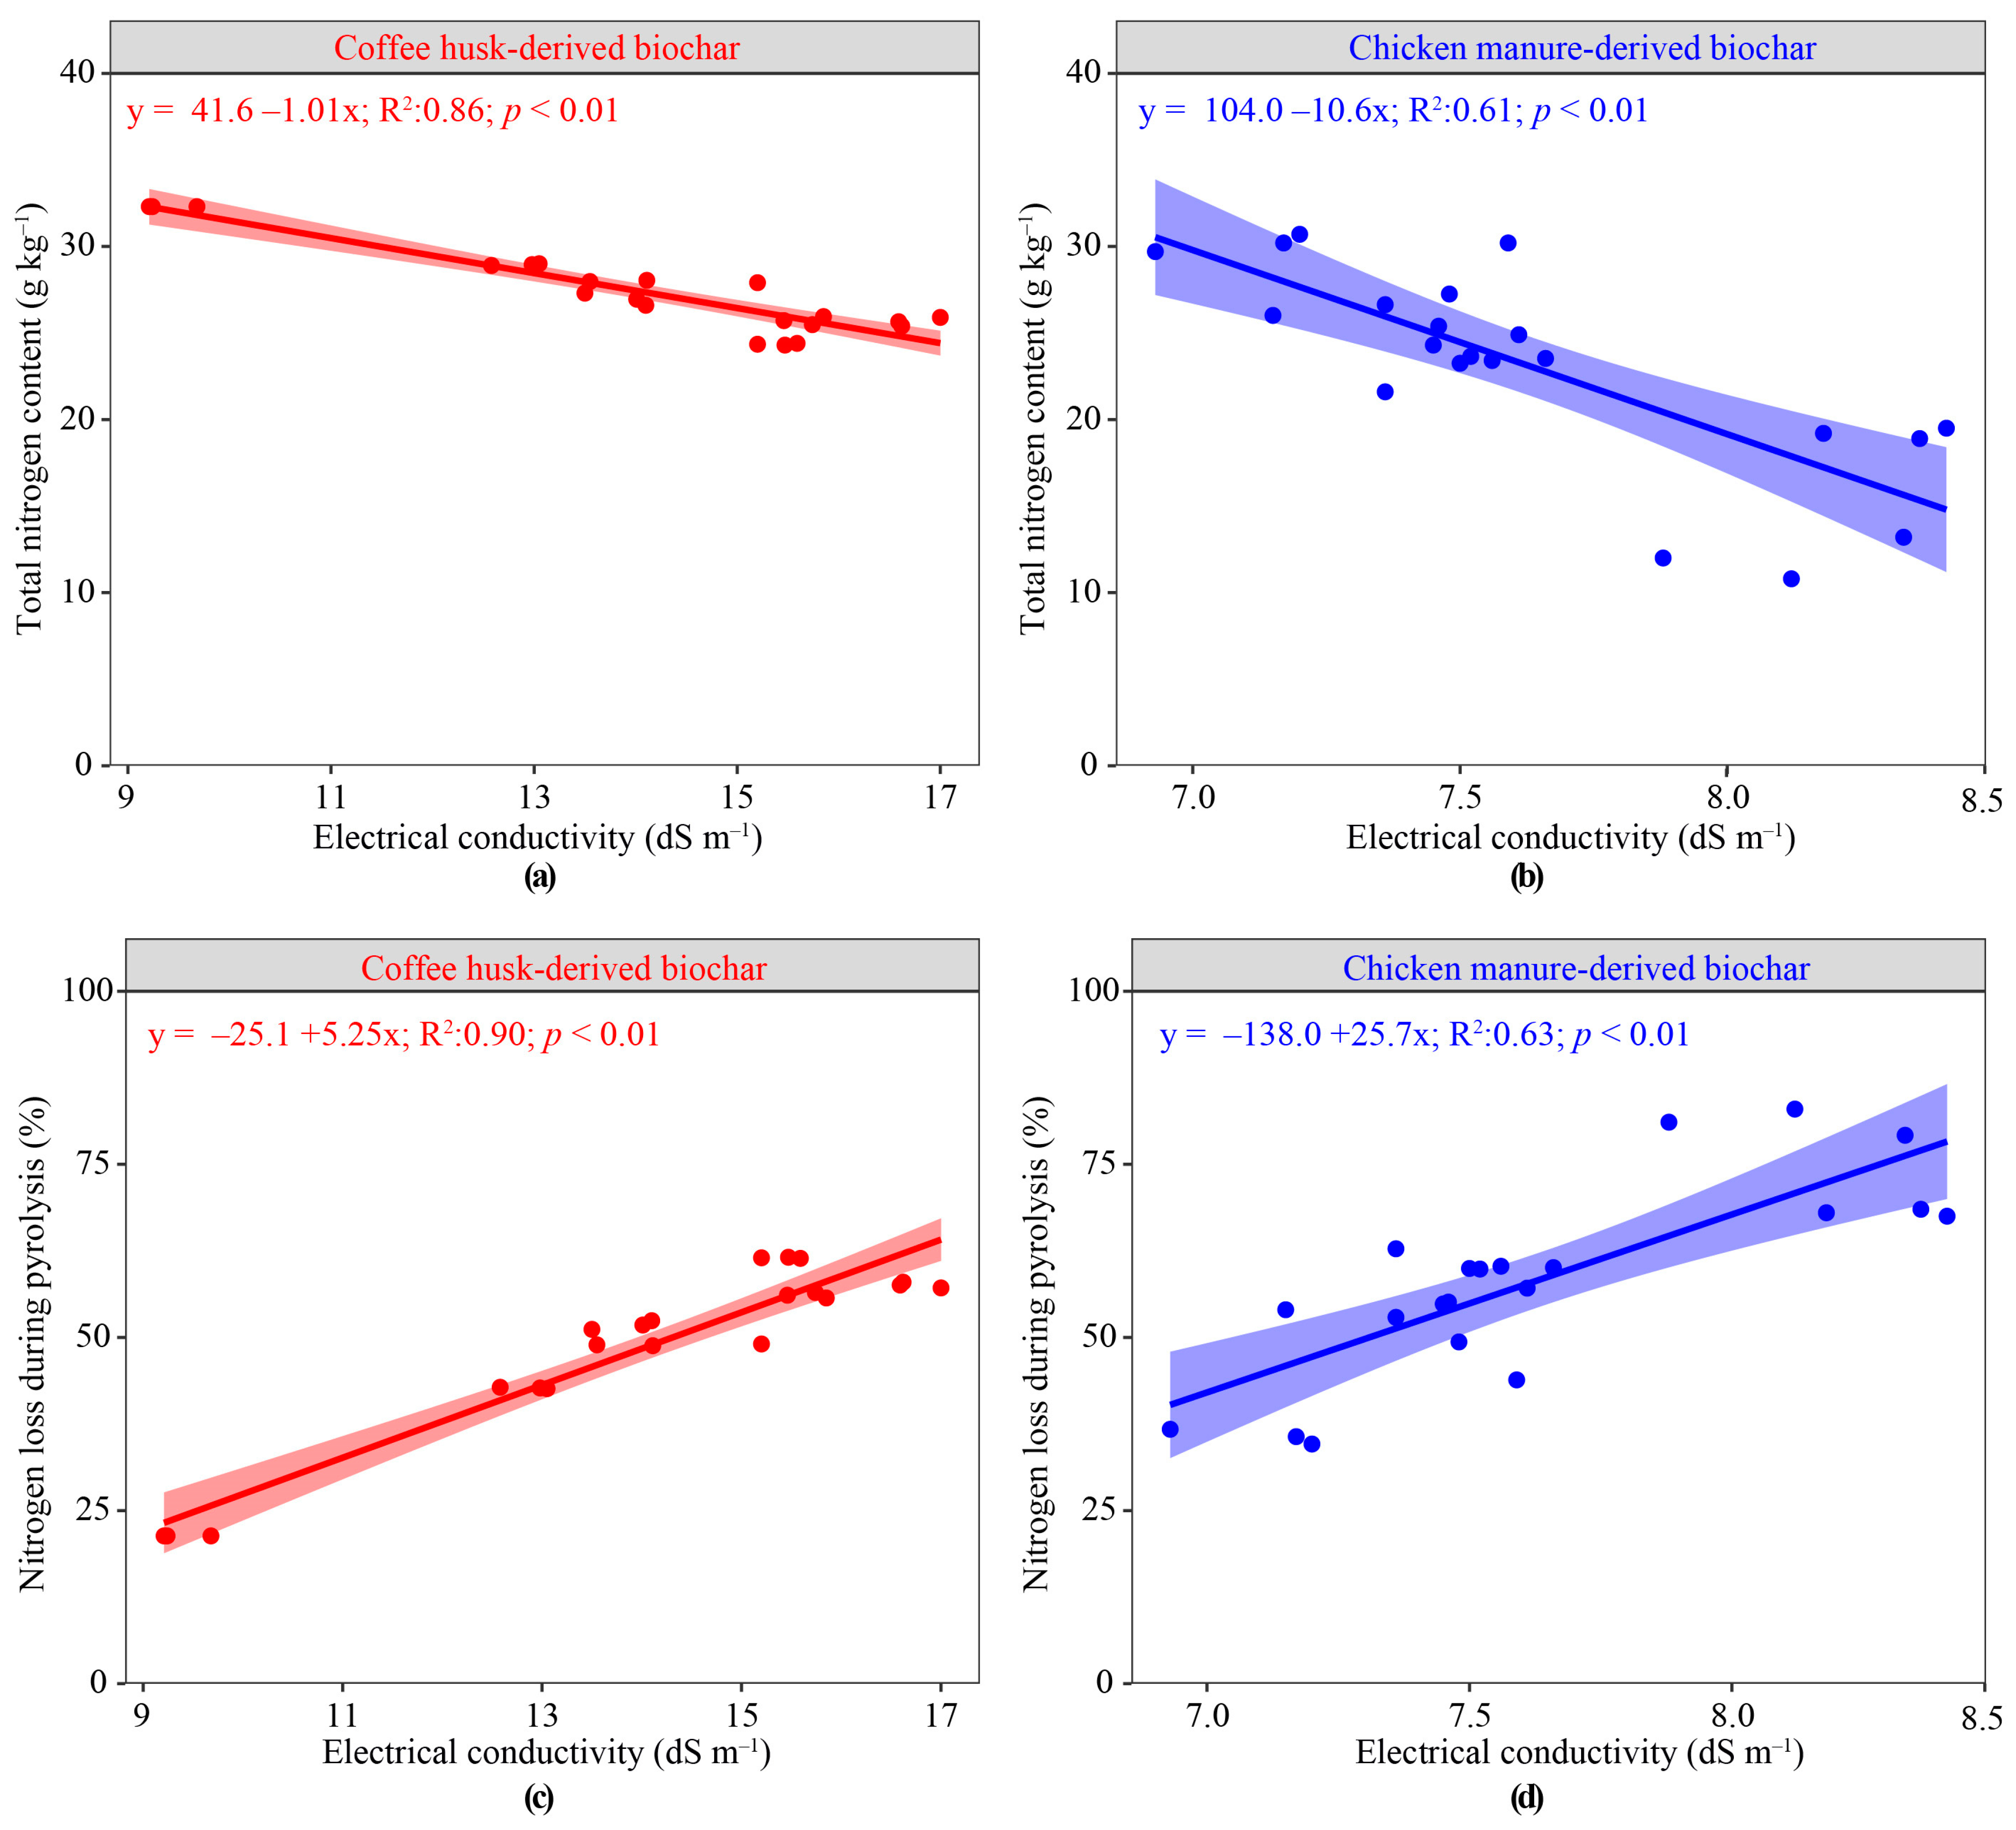
3.4. Total N Content and N Loss Predicted by Electrical Conductivity

Linear models were established and validated for both CH- and CM-derived biochars based on the significant correlations observed between EC and total N content, as well as EC and N loss (Figure 4). It was observed that models created based on EC were more effective in predicting total N content (R2: 0.86) and N loss (R2: 0.90) for CH-derived biochar when compared with the models for predicting total N content (R2: 0.61) and N loss in CM-derived biochar (R2: 0.63). In CH-derived biochar, an increase of 1 unit (dS m−1) in EC corresponds to a reduction of 1.01 g kg−1 of N or a rise of 5.25% in N loss. In CM-derived biochars, an increase of 1 unit in dS m−1 in EC corresponds to a reduction of 10.6 g kg−1 in N or a rise of 25.7% in N loss, considering the evaluated PT range (300–750 °C).

4. Discussion

Increasing the PT decreased the total N content in CH- and CM-derived biochars due to increased N loss during pyrolysis (Figure 1). In a similar study evaluating PT effects on biochars produced from rice straw, the lower PT (400 °C) was the best condition for preparing high-quality N biochar compared with a PT of 800 °C [13]. The increase in PT and the reduction in total N content were observed in a study using 11 different raw materials, where increasing PT from 300 °C to 750 °C reduced the N content in all produced biochars [11]. Still, compared to the aforementioned studies, we demonstrated that the PT effect on reducing total N content and increasing N loss depends on the feedstock. For biochars derived from CH at 450 °C, we observed that N loss and the total N content tend to stabilize. The PT effect was expected because elevated PT induced N loss by supplying energy in the form of heat, thereby altering the bonding patterns between C–N in the biomass [11,12,13,15,16,24].
The high temperature during pyrolysis can promote the breakage of the C–N bonds present in the organic matrix either through the cleavage of an amine bond, thermal decomposition of amino acids, or breaking bonds in structures containing N in the heterocyclic form, resulting consequently in the formation of ammonia (NH3) [12,16,24]. Additionally, high temperature promotes the decomposition of complex N groups due to the cleavage of the C–N bond, consequently releasing molecular N2 [12,16,24]. All of the processes mentioned above that occur during pyrolysis promote the transformation of N in the pyrolyzed matrix into gaseous forms [12,13,22]. In a study conducted on the pyrolysis of switchgrass from 650 °C to 850 °C, an increase in PT resulted in N loss in the form of NH₃, N₂, and hydrogen cyanide (HCN) [42]. However, the amount and form of N loss, according to PT, depend on the pyrolyzed feedstock [11,16,22,24].
Additionally, under high PT, thermal decomposition of acidic groups present in the organic material occurs, and consequently, the produced biochar exhibits basic properties [3,7]. Acidification of feedstock before pyrolysis may help reduce N loss during pyrolysis, as NH3 can be converted into NH4+ and subsequently retained in the negative charges of the biochar [43]. There was also a positive correlation between pH and N loss and a negative correlation between pH and total N content, indicating that a significant N fraction may be lost through volatilization.
When comparing the two feedstocks used in biochar production, it was found that N loss was higher for CM-derived biochars compared with CH-derived biochars. The effect of feedstock on controlling N loss was evaluated using 11 different feedstocks (CM, CH, pine bark, eucalyptus sawdust, bamboo, sugarcane bagasse, olive cake, sunflower cake, shrimp carcass, chitosan, and castor cake) pyrolyzed at 300 °C and 750 °C. It was observed that N loss was highly related to the properties and chemical composition of the pyrolyzed feedstock [11]. In our matrices pyrolyzed, the only discernible trend among the measured variables that differentiated between the two feedstocks was the positive correlation between total C content and total N content and the negative correlation between total C content and N loss in CH-derived biochars compared with CM-derived biochars (Figure 3). The higher total C content observed in the CH-biochar helped to preserve N during pyrolysis.
The positive relationship between total N and C contents is explained by the presence of pyrolytic carbon, which has a porous structure capable of adsorbing molecules, including nitrogenous compounds produced during pyrolysis [3,16,21,39,40,43,44]. Furthermore, when N is adsorbed onto pyrolytic C, additional polymerization or condensation reactions occur between N and C atoms, creating favorable conditions for the formation of nitrogenous compounds with closed chains, thus preserving N during pyrolysis [3,16,21,39,40,43,44]. Among these N compounds are the formation of pyrazine and pyridine and the formation of other heterocyclic compounds, such as pyrazole (Figure 5) [39,40,44]. Despite the C and N correlation, obtaining reliable measures of these elements in biochar is expensive and time-consuming. Thus, a correlation of N content with a simple measure, such as EC, could be helpful in rapidly and reliably estimating N content in biochar.
The increased PT is closely associated with increased biochar pH and ash content, which releases OH– and other ions that directly affect the increase in EC [45,46,47]. This was observed in our study, where the increase in temperature favored the rise in both EC and pH, and both variables were positively correlated with each other. The proportion of the rise in EC due to increased PT is highly dependent on the pyrolyzed feedstock [7,11]. This effect was demonstrated by Paiva et al. [11], where for similar initial EC values (6.6 dS m−1) for biochars derived from CM and chitosan pyrolyzed at 300 °C, the EC values reached 9.2 dS m−1 and 22.7 dS m−1, respectively, with similar increases in pH units (2.7). Thus, PT conditions the proportion of EC increase according to the feedstock.
Besides pH, EC also depends on other ions and compounds present in the organic matrix, and its relationship can vary depending on PT [3,4,7,29,45]. This effect of different compounds can be observed through the presence of preserved and formed nitrogenous functional groups during pyrolysis, which can conduct electricity due to their electron donation or acceptance capacity in reaction centers. Examples of these groups present in biochar include amines (NH2), imines (NH), nitro groups (NO2), pyridinic, and pyrazinic groups [16,21,27,39,40,44]. The effect of N-rich groups with high EC was evident in our study, especially in CH-derived biochar, which showed lower N loss, i.e., preserved higher N content in the biochar. This highlights the contribution of N compounds to increasing EC values that were more evident in CH- than in CM-biochar.
Due to the relationship in the formation of N-containing compounds that conduct electricity, increased ash content, and the formation of hydroxyl groups, EC can be used as a predictor for total N content or N loss during pyrolysis. This was clearly shown in our study, where a strong relationship between EC and the N in the produced biochars was evident (Figure 4). The use of EC as a predictor for some nutrients has been proposed, such as its use to predict available phosphorus levels in organomineral fertilizers [48].
Our study shows that although the correlation between EC and biochar N may vary depending on feedstock type, once established, it can be used for multiple purposes, such as guiding biochar production to maximize N reservation or predicting the fate of N from varying pyrolysis conditions. This effect occurs because, during pyrolysis, a continuous carbon network may form, which leads to N transformations, concentration of mineral elements, and changes in the physical structure of the produced biochars. These properties depend highly on the feedstock and PT [27,28,29,30,49]. Similar to our study, an effect on EC depending on the parent material and PT was observed when comparing sewage sludge with walnut shells-derived biochars, when an increase in the number of six-fold condensed aromatic rings, oxygen in polar oxygenated functional groups, and higher content of inorganic salts showed a positive correlation with EC [30].
As observed in other matrices, the negative relationship between total N content and EC may vary. For example, in sunflower cake, the increase in PT from 300 °C to 750 °C reduced both EC and total N content, indicating a positive relationship between the variables [11]. The causal relationship between lower total N content and the increase in EC due to a rise in PT must be considered carefully. Several mechanisms, such as biochar’s structure, chemical composition, or the release of volatile compounds during pyrolysis, might indirectly influence total N content [11,13,15,16,22]. Hence, this research is innovative in proposing that EC can be utilized to calibrate models for predicting total nitrogen (N) content in biochars, offering a rapid and cost-effective analysis compared to a total N analyzer. However, we emphasize that this calibration must be performed for each feedstock.

5. Conclusions

The lowest PT of 300 °C resulted in the smallest N loss in CH- and CM-derived biochars, producing biochars with higher total N contents. Nitrogen losses increased with higher PT but were lower for CH-derived biochars than CM-derived biochars. This can be attributed to the protection of N against thermal degradation ensured by a higher total carbon content in some charred matrices. Moreover, increased PT promoted higher values of EC and ash, with a negative correlation with total N contents in both derived biochars. However, the correlation between EC and biochar N can be used to guide or initially predict N output from biochar production. Thus, our results demonstrate how a low-cost, fast, and accessible tool can efficiently predict N dynamics in biochars and can be used at biochar production sites as an effective tool to evaluate the efficiency of pyrolysis once the relation between N and EC for a specific feedstock is established. Furthermore, EC as an accessible tool can eventually be explored to evaluate the content of other elements that have dynamics highly dependent on the PT.

Author Contributions

Conceptualization, E.G.d.M., C.A.S., S.G., L.C.A.M. and L.R.G.G.; methodology, E.G.d.M., C.A.S., S.G., B.C.L. and J.C.T.; software, E.G.d.M.; validation, E.G.d.M., C.A.S. and S.G.; formal analysis, E.G.d.M., C.A.S. and S.G.; investigation, E.G.d.M., C.A.S. and S.G.; resources, C.A.S., L.C.A.M. and L.R.G.G.; data curation, E.G.d.M.; writing—original draft preparation, E.G.d.M.; writing—review and editing, E.G.d.M., C.A.S., S.G., L.C.A.M. and L.R.G.G.; visualization, E.G.d.M.; supervision, C.A.S., S.G., L.C.A.M. and L.R.G.G.; project administration, C.A.S., S.G., L.C.A.M. and L.R.G.G.; funding acquisition, C.A.S., S.G., L.C.A.M. and L.R.G.G. All authors have read and agreed to the published version of the manuscript.

Funding

This research was funded by the Coordination for the Improvement of Higher Education Personnel (CAPES) (Grant Code-001) and the National Council for Scientific and Technological Development (CNPq), grant numbers 151485/2022-4, 7, 311212/2023-9, and 307447/2019-7, as well as the National Institute of Science and Technology (INCT) on Soil and Food Security, CNPq grant #406577/2022-6. Dr. S. G. also thanks Fulbright Brasil for her Fulbright Award.

Data Availability Statement

The data that support the findings of this study are available on request from the corresponding author.

Acknowledgments

The authors acknowledge the Coordination for the Improvement of Higher Education Personnel (CAPES), the National Council for Scientific and Technological Development (CNPq—grant numbers 406577/2022-6, 151485/2022-4, 7, 311212/2023-9, and 307447/2019-7), and the Minas Gerais State Research Foundation (FAPEMIG) for financial support and scholarships provided to the authors. Special thanks to CNPq for the fellowship for the first author (E.G.d.M.) (grants #151485/2022-4 and #153474/2024-6). Many thanks to Flavio Vieira Martins de Almeida and Stefania Priscilla de Souza for helping us determine the biochar N contents using a LECO automatic analyzer at the Department of Animal Science.

Conflicts of Interest

The authors declare no conflicts of interest. The funders had no role in this study’s design, in the collection, analyses, or interpretation of data, in the writing of the manuscript, or in the decision to publish the results.

References

  1. Lehmann, J.; Joseph, S. Biochar for Environmental Management: An Introduction. In Biochar for Environmental Management; Routledge: New York, USA, 2009; pp. 1–12. [Google Scholar]
  2. Joseph, S.; Cowie, A.L.; Van Zwieten, L.; Bolan, N.; Budai, A.; Buss, W.; Cayuela, M.L.; Graber, E.R.; Ippolito, J.A.; Kuzyakov, Y.; et al. How Biochar Works, and When It Doesn’t: A Review of Mechanisms Controlling Soil and Plant Responses to Biochar. GCB Bioenergy 2021, 13, 1731–1764. [Google Scholar] [CrossRef]
  3. Ippolito, J.A.; Cui, L.; Kammann, C.; Wrage-Mönnig, N.; Estavillo, J.M.; Fuertes-Mendizabal, T.; Cayuela, M.L.; Sigua, G.; Novak, J.; Spokas, K.; et al. Feedstock Choice, Pyrolysis Temperature and Type Influence Biochar Characteristics: A Comprehensive Meta-Data Analysis Review. Biochar 2020, 2, 421–438. [Google Scholar] [CrossRef]
  4. Lago, B.C.; Silva, C.A.; Melo, L.C.A.; de Morais, E.G. Predicting Biochar Cation Exchange Capacity Using Fourier Transform Infrared Spectroscopy Combined with Partial Least Square Regression. Sci. Total Environ. 2021, 794, 148762. [Google Scholar] [CrossRef] [PubMed]
  5. Kamali, M.; Sweygers, N.; Al-Salem, S.; Appels, L.; Aminabhavi, T.M.; Dewil, R. Biochar for Soil Applications-Sustainability Aspects, Challenges and Future Prospects. Chem. Eng. J. 2022, 428, 131189. [Google Scholar] [CrossRef]
  6. Kavitha, B.; Reddy, P.V.L.; Kim, B.; Lee, S.S.; Pandey, S.K.; Kim, K.-H. Benefits and Limitations of Biochar Amendment in Agricultural Soils: A Review. J. Environ. Manag. 2018, 227, 146–154. [Google Scholar] [CrossRef] [PubMed]
  7. Domingues, R.R.; Trugilho, P.F.; Silva, C.A.; De Melo, I.C.N.A.; Melo, L.C.A.; Magriotis, Z.M.; Sánchez-Monedero, M.A. Properties of Biochar Derived from Wood and High-Nutrient Biomasses with the Aim of Agronomic and Environmental Benefits. PLoS ONE 2017, 12, e0176884. [Google Scholar] [CrossRef] [PubMed]
  8. Yaashikaa, P.R.; Kumar, P.S.; Varjani, S.; Saravanan, A. A Critical Review on the Biochar Production Techniques, Characterization, Stability and Applications for Circular Bioeconomy. Biotechnol. Rep. 2020, 28, e00570. [Google Scholar] [CrossRef] [PubMed]
  9. Zhang, S.; Li, Y.; Singh, B.P.; Wang, H.; Cai, X.; Chen, J.; Qin, H.; Li, Y.; Chang, S.X. Contrasting Short-Term Responses of Soil Heterotrophic and Autotrophic Respiration to Biochar-Based and Chemical Fertilizers in a Subtropical Moso Bamboo Plantation. Appl. Soil Ecol. 2021, 157, 103758. [Google Scholar] [CrossRef]
  10. De Morais, E.G.; Silva, C.A.; Jindo, K. Biochar-Based Phosphate Fertilizers: Synthesis, Properties, Kinetics of P Release and Recommendation for Crops Grown in Oxisols. Agronomy 2023, 13, 326. [Google Scholar] [CrossRef]
  11. de oliveira Paiva, I.; de Morais, E.G.; Jindo, K.; Silva, C.A. Biochar N Content, Pools and Aromaticity as Affected by Feedstock and Pyrolysis Temperature. J. Soil Sci. Plant Nutr. 2024, 1, 1–21. [Google Scholar] [CrossRef]
  12. Liu, W.J.; Li, W.W.; Jiang, H.; Yu, H.Q. Fates of Chemical Elements in Biomass during Its Pyrolysis. Chem. Rev. 2017, 117, 6367–6398. [Google Scholar] [CrossRef] [PubMed]
  13. Liu, L.; Tan, Z.; Zhang, L.; Huang, Q. Influence of Pyrolysis Conditions on Nitrogen Speciation in a Biochar ‘Preparation-Application’ Process. J. Energy Inst. 2018, 91, 916–926. [Google Scholar] [CrossRef]
  14. Tomczyk, A.; Sokołowska, Z.; Boguta, P. Biochar Physicochemical Properties: Pyrolysis Temperature and Feedstock Kind Effects. Rev. Environ. Sci. Bio/Technol. 2020, 19, 191–215. [Google Scholar] [CrossRef]
  15. Wang, T.; Camps Arbestain, M.; Hedley, M.; Bishop, P. Chemical and Bioassay Characterisation of Nitrogen Availability in Biochar Produced from Dairy Manure and Biosolids. Org. Geochem. 2012, 51, 45–54. [Google Scholar] [CrossRef]
  16. Leng, L.; Xu, S.; Liu, R.; Yu, T.; Zhuo, X.; Leng, S.; Xiong, Q.; Huang, H. Nitrogen Containing Functional Groups of Biochar: An Overview. Bioresour. Technol. 2020, 298, 122286. [Google Scholar] [CrossRef] [PubMed]
  17. Mukherjee, A.; Patra, B.R.; Podder, J.; Dalai, A.K. Synthesis of Biochar From Lignocellulosic Biomass for Diverse Industrial Applications and Energy Harvesting: Effects of Pyrolysis Conditions on the Physicochemical Properties of Biochar. Front. Mater. 2022, 9, 870184. [Google Scholar] [CrossRef]
  18. Morais, E.G.; Silva, C.A.; Maluf, H.J.G.M.; de oliveira Paiva, I.; de Paula, L.H.D. Effects of Compost-Based Organomineral Fertilizers on the Kinetics of NPK Release and Maize Growth in Contrasting Oxisols. Waste Biomass Valoriz. 2022, 14, 2299–2321. [Google Scholar] [CrossRef]
  19. Cantrell, K.B.; Hunt, P.G.; Uchimiya, M.; Novak, J.M.; Ro, K.S. Impact of Pyrolysis Temperature and Manure Source on Physicochemical Characteristics of Biochar. Bioresour. Technol. 2012, 107, 419–428. [Google Scholar] [CrossRef] [PubMed]
  20. Carnier, R.; Coscione, A.R.; Delaqua, D.; Abreu, C.A.D. Coffee Industry Waste-Derived Biochar: Characterization and Agricultural Use Evaluation According to Brazilian Legislation. Bragantia 2021, 80, e5721. [Google Scholar] [CrossRef]
  21. Başer, B.; Yousaf, B.; Yetis, U.; Abbas, Q.; Kwon, E.E.; Wang, S.; Bolan, N.S.; Rinklebe, J. Formation of Nitrogen Functionalities in Biochar Materials and Their Role in the Mitigation of Hazardous Emerging Organic Pollutants from Wastewater. J. Hazard. Mater. 2021, 416, 126131. [Google Scholar] [CrossRef]
  22. Gao, Y.; Fang, Z.; Van Zwieten, L.; Bolan, N.; Dong, D.; Quin, B.F.; Meng, J.; Li, F.; Wu, F.; Wang, H.; et al. A Critical Review of Biochar-Based Nitrogen Fertilizers and Their Effects on Crop Production and the Environment. Biochar 2022, 4, 36. [Google Scholar] [CrossRef]
  23. Mainali, K.; Garcia-Perez, M. Understanding Organic N Interactions with Cellulose during Pyrolysis to Produce N-Doped Carbonaceous Materials. J. Anal. Appl. Pyrolysis 2023, 169, 105791. [Google Scholar] [CrossRef]
  24. Xu, S.; Chen, J.; Peng, H.; Leng, S.; Li, H.; Qu, W.; Hu, Y.; Li, H.; Jiang, S.; Zhou, W.; et al. Effect of Biomass Type and Pyrolysis Temperature on Nitrogen in Biochar, and the Comparison with Hydrochar. Fuel 2021, 291, 120128. [Google Scholar] [CrossRef]
  25. Zhan, H.; Zhuang, X.; Song, Y.; Chang, G.; Wang, Z.; Yin, X.; Wang, X.; Wu, C. Formation and Regulatory Mechanisms of N-Containing Gaseous Pollutants during Stage-Pyrolysis of Agricultural Biowastes. J. Clean. Prod. 2019, 236, 117706. [Google Scholar] [CrossRef]
  26. Zhan, H.; Zhuang, X.; Song, Y.; Huang, Y.; Liu, H.; Yin, X.; Wu, C. Evolution of Nitrogen Functionalities in Relation to NO Precursors during Low-Temperature Pyrolysis of Biowastes. Fuel 2018, 218, 325–334. [Google Scholar] [CrossRef]
  27. Chacón, F.J.; Cayuela, M.L.; Roig, A.; Sánchez-Monedero, M.A. Understanding, Measuring and Tuning the Electrochemical Properties of Biochar for Environmental Applications. Rev. Environ. Sci. Bio/Technol. 2017, 16, 695–715. [Google Scholar] [CrossRef]
  28. Zhang, Y.; Xu, X.; Cao, L.; Ok, Y.S.; Cao, X. Characterization and Quantification of Electron Donating Capacity and Its Structure Dependence in Biochar Derived from Three Waste Biomasses. Chemosphere 2018, 211, 1073–1081. [Google Scholar] [CrossRef] [PubMed]
  29. Gabhi, R.S.; Kirk, D.W.; Jia, C.Q. Preliminary Investigation of Electrical Conductivity of Monolithic Biochar. Carbon N. Y. 2017, 116, 435–442. [Google Scholar] [CrossRef]
  30. Bartoli, M.; Troiano, M.; Giudicianni, P.; Amato, D.; Giorcelli, M.; Solimene, R.; Tagliaferro, A. Effect of Heating Rate and Feedstock Nature on Electrical Conductivity of Biochar and Biochar-Based Composites. Appl. Energy Combust. Sci. 2022, 12, 100089. [Google Scholar] [CrossRef]
  31. Chintala, R.; Clay, D.E.; Schumacher, T.E.; Malo, D.D.; Julson, J.L. Optimization of Oxygen Parameters for Determination of Carbon and Nitrogen in Biochar Materials. Anal. Lett. 2013, 46, 532–538. [Google Scholar] [CrossRef]
  32. Igalavithana, A.D.; Mandal, S.; Niazi, N.K.; Vithanage, M.; Parikh, S.J.; Mukome, F.N.D.; Rizwan, M.; Oleszczuk, P.; Al-Wabel, M.; Bolan, N.; et al. Advances and Future Directions of Biochar Characterization Methods and Applications. Crit. Rev. Environ. Sci. Technol. 2017, 47, 2275–2330. [Google Scholar] [CrossRef]
  33. Singh, B.; Camps-Arbestain, M.; Lehmann, J.; CSIRO (Australia). Biochar: A Guide to Analytical Methods; CRC Press: Boca Raton, FL, USA, 2017; ISBN 1486305105. [Google Scholar]
  34. Kassambara, A.; Mundt, F. Factoextra: Extract and Visualize the Results of Multivariate Data Analyses 2020. Available online: https://rpkgs.datanovia.com/factoextra/index.html (accessed on 11 December 2023).
  35. Lê, S.; Josse, J.; Husson, F. FactoMineR: An R Package for Multivariate Analysis. J. Stat. Softw. 2008, 25, 1–18. [Google Scholar] [CrossRef]
  36. R Core Team. R: A Language and Environment for Statistical Computing; 2023; Available online: https://www.r-project.org/ (accessed on 11 December 2023).
  37. Wei, T.; Simko, V. R Package “Corrplot”: Visualization of a Correlation Matrix; 2017; Available online: https://cran.r-project.org/web/packages/corrplot/ (accessed on 11 December 2023).
  38. Wickham, H.; Averick, M.; Bryan, J.; Chang, W.; McGowan, L.; François, R.; Grolemund, G.; Hayes, A.; Henry, L.; Hester, J.; et al. Welcome to the Tidyverse. J. Open Source Softw. 2019, 4, 1686. [Google Scholar] [CrossRef]
  39. Zhao, W.; Liu, S.; Yin, M.; He, Z.; Bi, D. Co-Pyrolysis of Cellulose with Urea and Chitosan to Produce Nitrogen-Containing Compounds and Nitrogen-Doped Biochar: Product Distribution Characteristics and Reaction Path Analysis. J. Anal. Appl. Pyrolysis 2023, 169, 105795. [Google Scholar] [CrossRef]
  40. Raclavská, H.; Růžičková, J.; Raclavský, K.; Juchelková, D.; Kucbel, M.; Švédová, B.; Slamová, K.; Kacprzak, M. Effect of Biochar Addition on the Improvement of the Quality Parameters of Compost Used for Land Reclamation. Environ. Sci. Pollut. Res. 2021, 30, 8563–8581. [Google Scholar] [CrossRef] [PubMed]
  41. Akaike, H. A Bayesian Extension of the Minimum AIC Procedure of Autoregressive Model Fitting. Biometrika 1979, 66, 237. [Google Scholar] [CrossRef]
  42. Broer, K.M.; Brown, R.C. The Role of Char and Tar in Determining the Gas-Phase Partitioning of Nitrogen during Biomass Gasification. Appl. Energy 2015, 158, 474–483. [Google Scholar] [CrossRef]
  43. Wang, B.; Lehmann, J.; Hanley, K.; Hestrin, R.; Enders, A. Ammonium Retention by Oxidized Biochars Produced at Different Pyrolysis Temperatures and Residence Times. RSC Adv. 2016, 6, 41907–41913. [Google Scholar] [CrossRef]
  44. Liu, S.; He, Z.; Dong, Q.; Zhao, A.; Huang, F.; Bi, D. Comparative Assessment of Water and Organic Acid Washing Pretreatment for Nitrogen-Rich Pyrolysis: Characteristics and Distribution of Bio-Oil and Biochar. Biomass Bioenergy 2022, 161, 106480. [Google Scholar] [CrossRef]
  45. Gabhi, R.; Basile, L.; Kirk, D.W.; Giorcelli, M.; Tagliaferro, A.; Jia, C.Q. Electrical Conductivity of Wood Biochar Monoliths and Its Dependence on Pyrolysis Temperature. Biochar 2020, 2, 369–378. [Google Scholar] [CrossRef]
  46. Suliman, W.; Harsh, J.B.; Abu-Lail, N.I.; Fortuna, A.-M.; Dallmeyer, I.; Garcia-Perez, M. Modification of Biochar Surface by Air Oxidation: Role of Pyrolysis Temperature. Biomass Bioenergy 2016, 85, 1–11. [Google Scholar] [CrossRef]
  47. Shi, J.; Fan, X.; Tsang, D.C.W.; Wang, F.; Shen, Z.; Hou, D.; Alessi, D.S. Removal of Lead by Rice Husk Biochars Produced at Different Temperatures and Implications for Their Environmental Utilizations. Chemosphere 2019, 235, 825–831. [Google Scholar] [CrossRef] [PubMed]
  48. Maluf, H.J.G.M.; Silva, C.A.; de Morais, E.G.; Paula, L.H.D.D. Is Composting a Route to Solubilize Low-Grade Phosphate Rocks and Improve MAP-Based Composts? Rev. Bras. Ciência do Solo 2018, 42, e0170079. [Google Scholar] [CrossRef]
  49. Kane, S.; Ulrich, R.; Harrington, A.; Stadie, N.P.; Ryan, C. Physical and Chemical Mechanisms That Influence the Electrical Conductivity of Lignin-Derived Biochar. Carbon Trends 2021, 5, 100088. [Google Scholar] [CrossRef]
Figure 1. Total nitrogen content (a) and N loss during pyrolysis (b) according to different temperatures of pyrolysis to coffee-husk and chicken manure-derived biochars.
Nitrogen 05 00019 g001
Figure 2. Electrical conductivity of coffee-husk and chicken manure-derived biochars as affected by increasing pyrolysis temperatures.
Nitrogen 05 00019 g002
Figure 3. Pearson correlation analysis of N content and loss with the attributes of coffee husk and chicken manure-derived biochars. Total N: Total nitrogen content. N loss: N loss during pyrolysis. Yield: Biochar yield. C: Total carbon content. EC: Electrical conductivity.
Nitrogen 05 00019 g003
Figure 4. The total N content (a,c), and N loss during pyrolysis (b,d) predicted by electrical conductivity according to coffee husk and chicken manure-derived biochars.
Nitrogen 05 00019 g004
Figure 5. Examples of nitrogenous compounds with closed chains of bonds.
Nitrogen 05 00019 g005
Table 1. Main properties of coffee husk and chicken manure used in biochar’s production.
Raw BiomassCarbon Content
(g kg−1) *
Nitrogen Content
(g kg−1) *
pH *Electrical
Conductivity (dS m−1) *
Ash *
%, w/w
Coffee husk40.718.8 ± 0.44.7 ± 0.036.93 ± 0.046.93 ± 0.73
Chicken manure24.733.1 ± 0.17.7± 0.128.00 ± 0.0434.2 ± 0.75
* The methodologies employed were similar to those described for the characterization of the biochars.
Table 2. Main properties of biochars produced at increasing pyrolysis temperatures.
BiocharTemperature (°C)Yield (%) *Carbon Content (g kg−1) *pH **Ash (%) **
Coffee husk30045.85629.8 ± 2.0213.1 ± 0.09
40037.258710.2 ± 1.3715.1 ± 0.08
450 34.36019.9 ± 1.1316.2 ± 0.02
500 33.66069.7 ± 1.3315.7± 0.05
550 32.162410.2 ± 1.3316.9 ± 0.07
600 31.161110.4 ± 1.3018.0 ± 0.10
750 29.763410.9 ± 0.6820.0 ± 0.03
Chicken manure300 70.52748.7 ± 0.0344.8 ± 0.03
400 61.525810.53 ± 0.0650.9 ± 0.06
450 58.523910.43 ± 0.0853.9 ± 0.02
500 57.023910.51 ± 0.3954.3 ± 0.05
550 56.224310.52 ± 0.3155.5 ± 0.05
600 55.223810.59 ± 0.3155.7 ± 0.01
750 52.222711.14 ± 0.4258.4 ± 0.07
*: values of one sample; **: mean value followed by the standard error of 3 samples.
Table 3. Coefficients of the mathematical regression models were adjusted for biochar total N content, N loss, and electrical conductivity (EC) as a function of increasing pyrolysis temperature.
VariableBiocharLinearQuadraticElovichPowerHyperbolic
R2RMSEAICR2RMSEAICR2RMSEAICR2RMSEAICR2RMSEAIC
Total N
Content
CH0.890.8570.990.290.960.5350.980.4250.980.318
CM0.921.6850.941.3800.862.1970.792.61060.633.5118
N lossCH0.805.61380.981.6880.913.81220.825.41360.855.1134
CM0.962.71080.962.61070.962.71070.962.61060.962.6105
Electrical
conductivity
CH0.661.3770.930.6460.781.1680.721.2730.781.168
CM0.670.260.670.270.660.260.660.260.630.38
R2: regression coefficient; RMSE: root mean squared error; AIC: Akaike Information Criterion; CH: Coffee husk-derived biochar; CM: Chicken manure-derived biochar.
Disclaimer/Publisher’s Note: The statements, opinions and data contained in all publications are solely those of the individual author(s) and contributor(s) and not of MDPI and/or the editor(s). MDPI and/or the editor(s) disclaim responsibility for any injury to people or property resulting from any ideas, methods, instructions or products referred to in the content.

