Abstract
Nitrogen (N) fertilization promotes morphofunctional attributes that enhance plant performance under stress conditions, but the amount and form supplied modify the magnitude of plant responses. We assessed several morpho-physiological and biochemical responses of Prosopis laevigata seedlings to a high supply of N, provided as either inorganic (NH4NO3) or organic (amino acids). Such N treatments were applied on four-month-old seedlings as a supplement of 90 mg N to a regular supply of 274 mg N plant−1. Nitrogen supply modified biomass allocation patterns between leaves and roots regardless of N form. Increased N input decreased photosynthetic capacity, even when plants had high internal N reserves. Organic N fertilization reduced the N use efficiency, but increased leaf and root amino acid concentrations. Proteins accumulated in stems in plants receiving inorganic N, while the organic N increased leaf proteins. High N supply promoted root starch accumulation irrespective of N form. Nitrogen supply did not directly influence plants’ regrowth capacity. Still, resprouting was correlated to initial root-to-shoot ratios and root starch, confirming the importance of roots as storage reserves of starch for recovering biomass after browsing. These findings have practical implications for designing nutritional management strategies in nurseries to improve seedling performance in afforestation efforts.
1. Introduction
Nitrogen (N) is a vital macronutrient for plants, playing a critical role in numerous metabolic processes essential for plant growth and development. For instance, C3 plants invest about 75% of their N in photosynthesis [1], mainly to Rubisco, where N accounts for 20–30% of the total leaf N [2]. N is a central structural compound of vital macromolecules, such as amino acids, proteins, nucleic acids, purines, pyrimidines, and some coenzymes [3]. Thus, N fertilization has become a key focus in crop production, emphasizing the need to supply the optimal amount of N to achieve maximum plant growth yield [3,4].
Nitrogen fertilization in forest nurseries is fundamental for cultivating tree species, similar to crop production systems [5]. The need for nitrogen fertilization primarily arises from the use of inert substrates with limited nutrient availability and containers that restrict root growth [6]. On the other hand, N fertilization is crucial in modulating plant responses under adverse environmental conditions. For instance, it can influence several morpho-functional attributes (MFA) that help to diminish abiotic or biotic stress [6,7]. At a morphological level, such MFAs include leaf, stem, or root characteristics in terms of absolute magnitudes or relative biomass allocation. Physiologically, traits such as photosynthetic capacity, nutrient reserves, and biochemical compounds (e.g., amino acids, proteins, and non-structural carbohydrates) are also affected. These biochemical compounds engage in plant growth, defense mechanisms, and recovery capacities [8].
The synthesis of the aforementioned chemical compounds is closely dependent on the efficient assimilation of N. This process, in turn, is regulated by external factors such as the availability and abundance of N in the soil solution, as well as its chemical form [3]. Regarding N form, while roots can absorb nitrogen in its ionic forms, i.e., nitrate (NO3−) or ammonium (NH4+), several studies also show that plants can uptake intact forms of organic N, such as amino acids, peptides, and proteins [9]. Thus, in addition to the availability [10], the acquisition of N forms by a particular species can also be influenced by the species’ preferences [11] and competition with other species for specific N forms [12]. Nitrogen forms imply differences in the energetic cost of the absorption and assimilation process for plants [3,13]. For instance, because of its high oxidized state, NO3− utilization requires larger energy expenditures than any other N form [14]. In contrast, due its toxic effects, NH4+ need to be rapidly metabolized into amino acids and amines [15], a process that also represents a significant energy spending for plants [3].
In plant nutrition, exploring alternatives to enhance mineral nutrition, improve assimilation, and boost the efficiency of nitrogenous continues to be a key area of interest [3]. In recent years, new fertilization alternatives have been developed that seem to reduce metabolic costs for plants and contribute to improve N use efficiency (NUE) [16]. One such alternative is amino acid fertilization, which involves a lower energetic cost for absorption and assimilation into organic molecules compared to inorganic N forms [3,17]. This suggests that the amino acid fertilization method, by conserving carbon reserves, may provide plants with photosynthates to boost growth and storage reserves during early development stages [17]. Therefore, this could be particularly advantageous in improving seedling performance in afforestation programs, especially under challenging environmental conditions.
In some tree species, experimental evidence supports the benefits of amino acid fertilization in promoting root growth [18], improving NUE [17], and enhancing some tolerance and acclimation mechanisms to drought and cold stress [19,20]. However, little is known about how other types of woody species, such as those from arid environments, respond to this kind of fertilization. This knowledge gap is particularly significant because the varied functional groups in arid ecosystems may display diverse patterns of N uptake and utilization compared to temperate tree species. Therefore, it is essential to thoroughly understand how each species responds to fertilization with different N forms to develop effective nutritional strategies that enhance plant responses to environmental stressors.
This study aimed to examine morpho-physiological and biochemical responses of mesquite seedlings (Prosopis laevigata (Humb. et Bonpl. Ex Willd.) M. C. Johnst.) to N supply in distinct N forms during nursery cultivation. Mesquite is a dominant woody, broadleaf tree species widespread in Mexico, with cultural and ecological importance and economic value to the inhabitants of arid and semi-arid regions [21]. Mesquite is a nitrogen-fixing leguminous tree recognized as a nurse tree, creating resource islands that support the growth of several desert plants [22]. However, natural stands have been reduced due to forest utilization, and poor natural regeneration rates have been present due to the degradation of ecosystems [23]. Two research questions drove our study: (1) How does the addition of N to a regular supply affect the morpho-physiological and biochemical attributes of mesquite seedlings? and (2) Is this effect influenced by the N form, whether inorganic or organic? We hypothesize that the N addition modifies the seedlings’ attributes, with these changes being dependent on the N form used. The practical implications of this study could contribute to improving the seedling cultivation process in nurseries, consequently increasing field seedling performance to recover natural populations of mesquite.
2. Materials and Methods
2.1. Plant Material, Growing Conditions, and Experimental Design
The experiment was conducted in the greenhouse facilities of the Campo Experimental Valle del Guadiana of the Instituto Nacional de Investigaciones Forestales, Agrícolas y Pecuarias (INIFAP) in Durango, Mexico. Collected seeds of native mesquite stands were sown in 380-cm3 polypropylene containers filled with a substrate comprising of 50% Sphagnum peat moss, 30% composted pine bark, and 20% perlite. This substrate had low inherent fertility given the inert components, which is a desirable attribute for growing media used in container nurseries [24]. In this case, the substrate had an initial content of 0.15, 0.25, and 0.78 mEq L−1 of N-NO3, P-PO4, and K, respectively, and a C:N ratio of 45.8. Once sowing was complete, containers were held in 25-cavity grids randomly placed on a bench under greenhouse cover with a 720-gauge white plastic film with a 55% opacity. At the time of substrate preparation, a controlled-release fertilizer (CRF; Multicote 6™ 18N-6P2O5-12K2O + ME, Haifa Chemical Ltd., Matam-Haifa, Israel) was added at a dose of 4 g L−1 of substrate. This addition of CRF was considered as standard fertilization, as it is a conventional practice in Mexican forest nurseries.
From the 6th to the 12th week after sowing, a fertilization trial was conducted that involved supplying additional N while varying the N form: (1) inorganic N, supplied as NH4NO3 (34% N, Fermont-PQM®, Productos Químicos Monterrey S.A. de C.V., Mexico), and (2) organic N, supplied as an amino acid mixture (12.8% N, Naturamin®-WSP, DAYMSA, Spain; 80% free amino acids including serine 14.5%, proline 12.5%, glutamic acid 11.5%, glycine 8.5%, aspartic acid 7.5%, leucine 7%, and other amino acids with amounts <6% such as arginine, valine, threonine, alanine, phenylalanine, isoleucine, histidine, lysine, cysteine, tyrosine, and methionine). The additional N supplementation was applied through fertigation twice a week to account for 90 mg N plant−1, in addition to the regular supply of CRF (i.e., 274 mg N, estimated according to the container volume, the dose, and the guaranteed analysis of the CRF). The amount of N supplied through fertigation was determined based on the N content on each fertilizer and the volume of nutrient solution used applied to each seedling by fertilization event. We observed no signs of nodulation in roots, implying a lack of establishment of a symbiotic relationship with N-fixing bacteria in the study period. Thus, a potential influence of this symbiosis on the plants’ responses to N fertilization levels was ruled out.
Each treatment was applied to a group of 60 plants split into three replications of 20 plants each and arranged in a completely randomized design. Additionally, a third group of 60 plants was left as the control, receiving only the regular supply of CRF. As supplementary measurements in the trial, substrate pH and electrical conductivity (EC) were monitored using the PourThru extraction method [25]. pH ranged from 5.2 to 6.1 and EC from 0.11 to 0.17 S m−1. After fertilization treatments concluded at the 12th week, plants received only standard irrigation practices for species hardening until they reached four months of age [26]. At this point, response variables were assessed.
2.2. Plant Harvest and Morphology Assessment
Plant harvest was carried out when plants were four months old. A set of 15 per treatment (5 per replication) were randomly chosen and extracted from the containers. The growing medium was carefully removed from the root plugs with tap water. Then, plants were divided into leaves, stems, and roots. The plant morphological variables were assessed as follow: stem length (SL; cm) and diameter (SD; mm) were measured using a plastic ruler and a caliper (Mitutoyo® Digimatic CD-4” AX, Kawasaki, Japan), respectively. Leaf area (LA; cm2) was assessed with a LI-3100C leaf area meter (LI-COR Inc., Lincoln, NE, USA). Subsequently, each sample was rinsed in deionized water, oven-dried for 72 h at 70 °C (until constant weight), and weighed for biomass determinations. The biomass (g) of leaves (LB), stem (SB), root (RB), and total (TB) was quantified using a precision balance 0.01 g (iBalance® i2001, HBI® International, Phoenix, AZ, USA). The biomass values were used to quantify mass allocation patterns in compartments as following: leaf mass fraction (LMF; leaf mass/total mass × 100), stem mass fraction (SMF; steam mass/total mass × 100), and root mass fraction (RMF; root mass/total mass × 100).
2.3. Physiological Traits Calculation
Physiological net assimilation rates (NAR; mg cm−2 day−1) were determined as an indirect measure of plant´s photosynthetic capacity. This physiological parameter is commonly associated with photosynthesis and respiration, according to Li et al. (2016) [27]. NAR was calculated using the following equation (Equation (1)):
where TB refers to total plant biomass, LA to leaf area of plants in absolute and logarithmic values (ln), and T to time. In all cases, 1 and 2 refer to an initial and final harvest, respectively, 90 days apart.
NAR = [(TB2−TB1) × (lnLA2 − lnLA1)]/[(LA2 − LA1) × (T2 − T1)]
Additionally, we measure growth (biomass increase in whole seedling) in terms of relative growth rate (TCR; mg g−1 day−1) according to the following formula (Equation (2)) [28]:
where TB refers to total plant biomass, in this case in logarithmic values, and T to time. In all cases, 1 and 2 refer to an initial and final harvest, respectively, 90 days apart. The initial assessment required for calculating both NAR and RGR was conducted on one-month-old plants.
RGR = (lnTB2 − lnTB1)/T2 − T1
The nutritional status of nitrogen (N), phosphorus (P), and potassium (K) was evaluated by determining the concentration (%) and content (mg plant−1) of each element. A chemical analysis of plant tissue was conducted using whole plants (leaves, stem and roots), with the analysis performed in triplicate. Concentration values of each element and biomass were used to calculate the content. N was determined by the micro-Kjeldahl method, P through photo-colorimetry by reduction with vanadate-molybdate, and K via direct reading of the digestate in an atomic absorption spectrometer. Furthermore, nitrogen use efficiency (NUE) was calculated as follows (Equation (3)) [29]:
2.4. Biochemical Determinations
At the biochemical level, the concentration of total soluble proteins, amino acids, starch, and total soluble sugars was quantified. This analysis was conducted on leaves, stems, and roots in composite samples per replication. For this purpose, samples were stored in an ultrafreezer (Revco Value Plus® ThermoScientific®, Waltham, MA, USA) at −70 °C for one week before undergoing lyophilization in a Labconco Freezone Triad® Freeze Dry Systems® for seven days at −40 °C. This process aimed to dehydrate the samples and prevent degradation due to enzymatic activity. Subsequently, the samples were ground into a fine powder using a blade mill (Fritsch® Pulverisette 15®, Pittsboro, NC, USA). For each working sample, 40 mg of dry matter was taken and placed in microtubes (MCT-200-C Clear Axygen Scientific®, Corning, NY, USA) using an analytical balance (PW 250 Adam®, Milton Keynes, UK).
The concentration of amino acids was determined using the ninhydrin method (Yemm and Cocking, 1955) [30]. A sample of 10 mg of dry matter was placed in 2 mL Eppendorf microtubes. To each microtube, 500 µL of an extraction solution composed of ethanol/water (70/30) was added. The samples were centrifuged at 10,000 rpm at 4 °C for 15 min using a centrifuge (Spectrafuge 16M®, Labnet International Inc., Edison, NJ, USA). The amino acid solution extraction was transferred to a clean 2 mL microtube, repeating this process twice. The amino acid extractions were combined into a single tube, and 800 µL of the mixture was withdrawn. These 800 µL samples were mixed with 200 µL of a 2% ninhydrin solution in ethanol. The microtubes were boiled for 5 min at 100 °C and then cooled to room temperature. The absorbance of the solution was measured using a UV-Visible spectrophotometer at a wavelength of 570 nm (Genesys 20® Thermo Scientific®, Waltham, MA, USA).
To determine the protein concentration, 10 mg of dry matter was also used, placed in 2 mL microtubes. A protein extraction solution of 0.1 M (KH2PO4, Na2HPO4, and 3% PVP) was prepared, adding 1 mL to each microtube and agitating on a Vortex® (Maxi Mix II® Thermo Scientific®, Waltham, MA, USA) for 10 min with a bearing ball to break cell walls. Subsequently, the samples were centrifuged at 10,000 rpm at 4 °C for 15 min. Then, 500 µL extracts from each microtube were taken, mixed with 500 µL of Quickstart® Bradford® solution (Bio-Rad, Hercules, CA, USA), and allowed to stand for 5 min. The absorbance was measured at 595 nm using a spectrophotometer.
For the starch concentration, 1 mL of distilled water was added to the microtubes containing the same amount of dry matter (10 mg), followed by vortexing for 1 min. Subsequently, the samples were boiled for 10 min to gelatinize the starch. They were then centrifuged at 2500 rpm for 2 min, and 300 μL of the supernatant was extracted and transferred to clean microtubes. To each microtube, 900 μL of absolute ethanol was added, and they were centrifuged at 10,000 rpm for five minutes to precipitate the starch. After discarding the alcohol and leaving only the precipitated starch at the bottom, 1 mL of distilled water was added. The microtubes were vortexed for three minutes, followed by the addition of 50 μL of iodine solution to each. Finally, the absorbance was measured in the spectrophotometer at 595 nm, using 1 mL of distilled water as a control and 50 μL of iodine with rice starch as a standard (Sigma-Aldrich®, St. Louis, MO, USA).
Finally, the concentration of soluble sugars was determined using the van Handel (1968) [31] methodology. The remaining 10 mg of dry matter was placed in 2 mL microtubes. To each microtube, a stainless-steel bearing ball and 500 μL of an extraction solution (methanol; 70:30) were added, followed by vortexing for 5 min. Subsequently, the samples were centrifuged at 10,000 rpm at 4 °C for 15 min. The soluble sugar extraction solution was transferred to clean 2 mL microtubes, repeating this process twice. The crude extracts were combined into a single microtube from which 100 μL (in triplicate) were extracted and mixed with 1 mL of a solution composed of 76 mL H2SO4, 30 mL H2O, and 150 mg anthrone. These mixtures were boiled for 10 min and then allowed to cool to room temperature. Once cooled, the absorbance reading at 625 nm was taken for each sample. A calibration curve was generated using sucrose as a standard, with known concentrations for reading at 530 nm on the spectrophotometer to determine the concentration of soluble sugars.
2.5. Resprouting Capacity Test
Following the fertilization trial, an experiment was set up to assess plant regrowth capacity post-severe defoliation. This aimed to indirectly evaluate plant response based on reserves from different fertilization treatments: regular supply (control) versus high supply with either inorganic N or organic N. This assay was conducted over 6 weeks from June to July 2022. Each treatment included n = 10 plants transplanted into 2 L polyethylene bags using, as growing medium, a soil locally known as ‘enlame’ (Phaeozems, alluvial sediments) [32]. Plants were pruned to a 5 cm stem segment, and regrowth was monitored weekly for dominant shoot length (cm). Biomass per shoot was assessed at trial end.
2.6. Statistical Analyses
All statistical analyses were conducted using R software version 4.2.1 [33]. The effect of N supply in both chemical forms on morphological, physiological, and biochemical variables was evaluated using one-way analysis of variance (ANOVA). For variables showing a significant effect, Dunnett’s post-hoc test (α = 0.05) was performed to compare means between treatments with additional N supply (high N supply) and the control treatment (regular N supply) using the ‘DescTools’ package of R [34]. Additionally, relative changes in biomass allocation among N supply treatments compared to the control were analyzed. These changes were calculated as: , where is the biomass proportion in plant i of treatment j and is the average biomass proportion of the control treatment. For all variables, homoscedasticity and normality of the data were assessed using Levene’s and Shapiro–Wilk tests, respectively, using the ‘car’ [35] and ‘stats’ [33] packages of R.
The effect of N supply on resprouting capacity (i.e., number of sprouts) was determined by fitting a Poisson generalized linear model with the log link function using the ‘stats’ package. On the other hand, the effect on the length of the main regrowth was analyzed through a repeated measures ANOVA by fitting a mixed-effects model using the ‘lme4’ package [36], which included time (days after pruning, DAP) and fertilization treatment as fixed factors and the plant as a random factor. If the homogeneity of variance or normality were significant, we applied a log transformation before performing the ANOVA. Differences between treatments were tested using post-hoc Tukey’s test (α = 0.05) with the ‘emmeans’ package [37]. Finally, correlations between morphological, physiological, biochemical, and resprout variables were examined using a Pearson correlation test with the ‘stats’ package. All graphical representations of results were performed with the ‘ggplot2’ package of R [38].
3. Results
3.1. Morphological Responses
At a morphological level, P. laevigata seedlings statistically differed due to the fertilization treatments only in leaf and root biomass proportion (Table A1). On the other hand, additional N input significantly modified biomass allocation patterns compared to the control. Regardless of N form, N supply decreased root biomass allocation but increased leaf biomass. Nevertheless, significant leaf biomass increase was observed only with inorganic N fertilization (Figure 1). Stem biomass allocation remained unchanged in fertilized plants vs. controls.
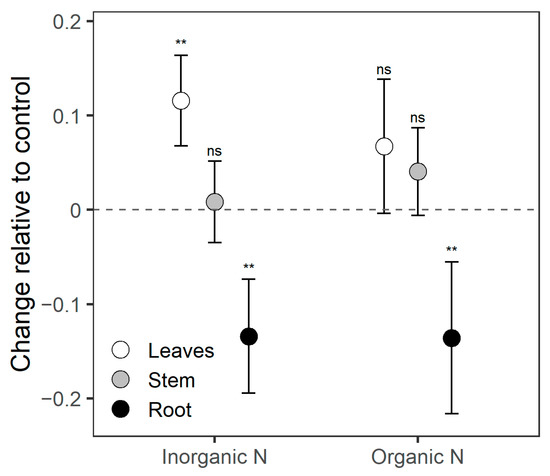
Figure 1.
Changes in biomass allocation patterns in Prosopis laevigata seedlings fertilized with additional N from two sources, inorganic N (NH4NO3) and organic N (amino acids), relative to control plants with regular N supply. Values presented are means with 95% confidence intervals. Symbols on each mean indicate the statistical comparison of fertilization treatments against the control (ns = not significant, ** p < 0.01).
3.2. Physiological Responses
The net assimilation rate (NAR) showed a significant effect from N addition. However, this effect was observed exclusively with the inorganic N fertilization, which resulted in a reduction in the NAR (Table A1). Additionally, the additional N input in this inorganic form significantly increased leaf N concentration, whereas the concentration in plants fertilized with organic N was similar to the control treatment (Figure 2A). Regardless of N source, total N content in plants with additional input was significantly higher than in control plants (Figure 2B). Finally, plants receiving additional N input showed decreased N use efficiency compared to control plants; however, this reduction was significant only in plants fertilized with organic N (Figure 2C).
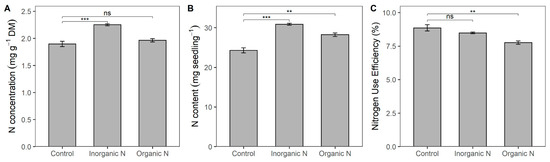
Figure 2.
Nitrogen concentration (A), N content (B), and N use efficiency (C) in Prosopis laevigata seedlings in response to inorganic (NH4NO3) and organic (amino acids) nitrogen fertilization. Data are means ± 1 SE. Horizontal square brackets indicate the statistical comparison of fertilization treatments against the control (ns = non-significant, ** p < 0.01, *** p < 0.001).
3.3. Biochemical Responses
The additional supply of organic N significantly increased the concentration of amino acids by 174% in leaves (p = 0.0014) and 73% in roots (p = 0.0026) compared to the control plants. In contrast, inorganic N fertilization did not alter the concentration of amino acid in any type of tissue (Figure 3A).
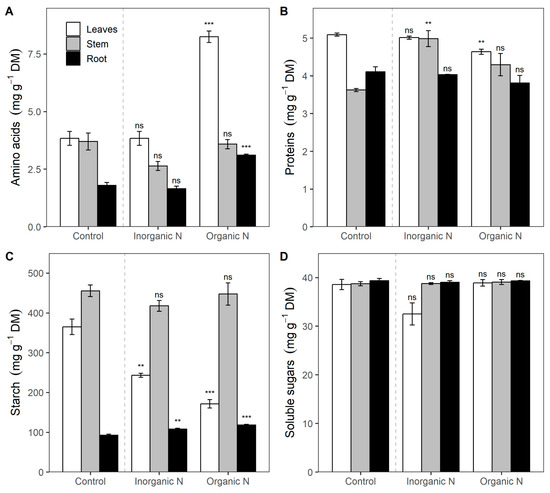
Figure 3.
Amino acid concentration (A), proteins (B), starch (C), and soluble total sugars (D) in leaf, stem, and root tissues in Prosopis laevigata seedlings in response to inorganic (NH4NO3) and organic (amino acids) nitrogen fertilization. Data are means ± 1 SE. Horizontal square brackets indicate a comparison between treatments and control. Statistical significance: ns = non-significant, ** p < 0.01, *** p < 0.001) fertilization treatments to control.
Protein concentrations in the leaves and stem showed marginal differences (p = 0.0292), with the highest levels in control plants and additional inorganic N in the leaves. In the stem, inorganic N supplementation also stimulated protein concentration. For instance, the protein concentration in plants with this treatment was 19% higher compared to the control (Figure 3B). Starch concentration in leaves was 50% and 113% higher (p = 0.0038) in control (base fertilization) than in additional inorganic and organic fertilization, respectively (Figure 3C). In contrast, starch concentration in roots increased significantly (p = 0.0163) in 17 and 28% in treatments of additional N, organic or inorganic, compared to control (Figure 3C). Finally, no differences in soluble sugars were detected in response to N fertilization (Figure 3D).
3.4. Resprouting Capacity
Nitrogen fertilization treatments promoted new shoot growth across time after pruning, but did not modify the number and mass of new shoots. In general, the length of the new shoot was higher in control plants than those with the additional N supply (Figure 4). However, statistical differences in new shoot length were observed only between the control and organic-N fertilization, and this effect was evident only up to 45 days after pruning (Interaction time×treatment, F = 3.62, p = 0.028).
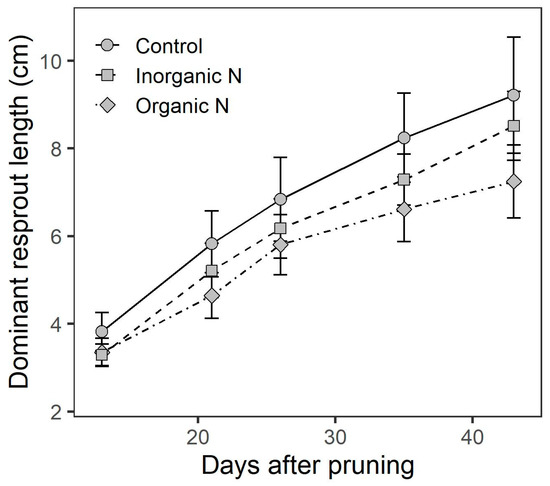
Figure 4.
Length of the dominant shoot after pruning in plants of Prosopis laevigata in response to inorganic (NH4NO3) and organic (amino acids) nitrogen fertilization. Data are means ± 1 SE.
Resprout biomass showed a negative correlation with the above-grown biomass prior to pruning (r = −0.84, p = 0.004; Figure 5A) but a positive correlation with the root:shoot ratio (r = 0.75, p = 0.020; Figure 5B). Similar relation patterns showed the number of new sprouts with shoot (r = −0.84, p = 0.005; Figure 5C) and root starch concentration (r = 0.67, p = 0.047; Figure 5D).
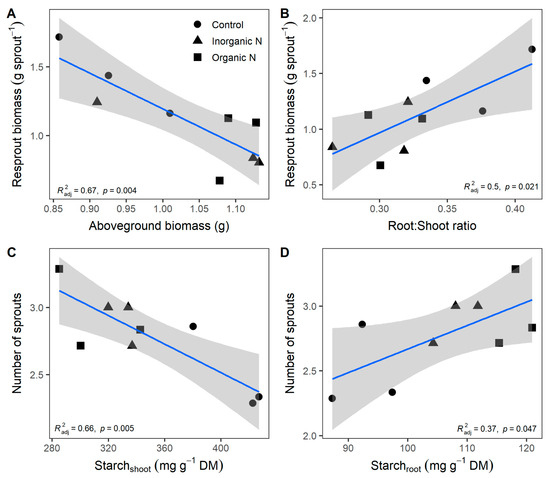
Figure 5.
Relationship of sprout mass with the above-grown mass prior to pruning (A) and root-to-shoot ratio (B), and relationship of the number of new sprouts with starch concentration in the shoot (C) and root (D) in plants of Prosopis laevigata fertilized with inorganic (NH4NO3) and organic (amino acids) nitrogen. Data are means. Lines and shades area represent predicted values and a confident Interval of 95%. Values of independent variables (x-axis) were measured before pruning.
4. Discussion
In this study, the responses of P. laevigata seedlings to varied N sources, whether inorganic or organic, were examined at the morphological, physiological, and biochemical levels. Our findings suggest that the N addition modifies the seedlings’ attributes, but some of these changes can be dependent on the N form used.
At the morphological level, we find that N supply modified the biomass allocation patterns in leaves and roots regardless of the chemical form. While control plants prioritized biomass allocation to roots, those with additional N inputs showed increased biomass allocation to leaves. This finding suggests that, for our study species, the amount of N supplied has a greater impact on carbon investment for tissue formation than a specific form of the nutrient. In this sense, it has been widely documented that plants allocate new biomass to organs that acquire the most limiting resources [1]. Thus, under this premise, greater biomass allocation to the roots is a mechanism plants typically employ under low nutrient availability [39]. Similar patterns of biomass allocation to primary and lateral roots were found by Kiba and Krapp (2016) [40] in response to NO3− deprivation.
Biomass allocation patterns are species-specific and depend on N supplied [41]. In our study, we found that additional inorganic N promotes greater leaf biomass allocation than control plants. This suggests that the additional inorganic N supply was invested to promote leaf tissue as a metabolic strategy to prioritize the development of photosynthetic tissue. In this context, Soares et al. (2017) [42] argue that plants prioritize the allocation of assimilates among their various compartments depending on environmental conditions and resource availability. Indeed, this is supported experimentally by the findings of Aliarab et al. (2020) [43] in Platycladus orientalis (L.) Franco plants.
Carbon assimilation demands substantial amounts of nutrients, particularly N, because of its fundamental role in plant photosynthesis [13]. Contrary to expectations, however, the additional N supply reduced the NAR in plants, especially when provided in inorganic-N form. In this sense, although a significant portion of assimilated N is needed for the photosynthetic complex, not all of it is used for this purpose, as plants also need N for other metabolic functions [1]. For instance, in a study with various native species of the Brazilian Atlantic Forest, Bardy et al. (2023) [44] reported varied carbon assimilation responses to N supply, with no significant changes in assimilation rates due to specific fertilization treatments. Likewise, in Guarea kunthiana A. Juss., photosynthetic capacity decreased with N supply despite high foliar N content. Terradas (2001) [45] remarks that photosynthesis increases with higher N concentration in the plant when no limiting factors exist. Indeed, in P. laevigata, the high inorganic N supply significantly increased N concentration and the total N content. In this latter case, differences were also observed with the additional N supply as amino acids.
Although the N addition to a regular supply enhanced nutritional status, this effect was observed only with the inorganic form. This finding contrasts with results from some conifer species, where fertilization with organic N induced similar or even higher N concentration than the inorganic N fertilization [18,19,46]. On the other hand, treatments with additional N input showed the lowest NUE. This behavior suggests that the increased N concentration and content reduced the efficiency of N utilization, negatively impacting productivity of this nutrient, as plant N status can also affects N assimilation. [47]. Overall, the NUE was low in all treatments, suggesting that most inorganic fertilizers have an efficiency that does not exceed 50% [16]. This response can be explained by considering that species adapted to poor soils, such as P. laevigata in its natural environment, usually have lower nutrient productivity than those adapted to fertile soils [1]. Moreover, the efficiency of N fertilizer use varies with time, application method, and chemical form [16]. In this context, the possibility of nutrient oversupply with the base fertilization rate (4 g L−1 of substrate) and the fertilizer formulation used (18-6-12) cannot be ruled out despite being a routine method in forest nurseries producing this species [26]. This emphasizes the need to improve fertilization practices in nurseries to find new approaches that enhance nitrogen use efficiency and reduce fertilizer use as suggested by Govindasamy et al. (2023) [16].
In our study, the organic N fertilization led the lowest NUE, contrary to expectations that it would improve this efficiency due to the lower metabolic cost of amino acid assimilation compared to inorganic forms [17]. This finding can be attributed to lower flux rates of organic N compounds in the soil due to their higher molecular weight and charge interactions with the soil solid phase [48]. It is also possible that NUE in plants fertilized with amino acids was affected by the availability of N in the growth medium due to the high C:N ratio. A high C:N ratio (>15) is known to increase the risk of N being immobilized by microorganisms, rendering it unavailable to plants [49]. Under these conditions, microorganisms often require readily available C sources, such as amino acids and peptides, that can be taken up as intact molecules [50]. Therefore, it is plausible that N immobilization is more probable when the N supplied is in the organic form.
Given the NUE results in this study, it is reasonable to assume that incorporating amino acids into a fertilization program has limited significance. However, biochemical analyses provide a distinct perspective on this matter. Interestingly, the addition of amino acids resulted in their increased concentration in leaves and roots compared to plants in the control treatment. Therefore, it could be inferred that amino acids were utilized for assimilation and synthesis of more amino acids rather than N reserves or other compounds. This make sense considering that amino acid taken up by plants, rather being used in synthesis of other compounds, are transaminated readily to other amino acids [9]. Moreover, it has been demonstrated that plants have selective mechanisms for amino acid absorption, meaning that absorption and utilization could differ depending on the type of amino acids [51]. Additionally, their mobility in the soil solution varies, affecting their availability; for example, essential amino acids (e.g., Lysine) tend to be less mobile than neutral ones (e.g., Glycine) [52]. Therefore, when using a mixture of different amino acids, as in this study, it could be speculated that some can be absorbed as efficiently as inorganic forms.
Protein concentration was promoted by the addition of inorganic N forms, especially in stem tissue. This response can be associated with an efficient assimilation of N in this form because proteins are one of the most energy-intensive nitrogenous chemical complexes, so their synthesis requires a significant investment of N by plants [53]. The presence of proteins in leaves is associated with growth characteristics, as this organ is the primary source of photosynthates [53,54]. Additionally, the accumulation of proteins in storage organs, such as the stem, results from excess production of photosynthesis products [55]. High protein availability in tissue provides competitive advantages to plants in resource-limited environments [8]. Therefore, fertilization practices in nursery plant production should promote this characteristic [44].
Differences in starch concentration in leaves and roots, more pronounced in the stem, confirm the overall importance of nitrogen fertilization for its synthesis [4]. Starch is a reserve carbohydrate linked to regrowth, recovery after disturbances, and initial growth potential [8]. Regular fertilization increased starch in leaves, while high N supply increased it in roots. In terms of plant economy, there are disparities in the costs associated with constructing organs due to the energy required for synthesizing their chemical components. For instance, starch is more energetically economical than proteins (Villar et al. 2008). In this context, it can be inferred that regular fertilization met the demands for synthesizing starch in the leaves, while additional N allowed for the generation and accumulation of reserves in the roots. As mentioned by Fujiwara et al. (2002) [55], this occurs when there is an overproduction of photosynthates needed to meet the metabolic demands of source organs, such as leaves.
Concerning the resprouting test, it was designed to examine plant responses based on reserves generated by fertilization treatments. No discernible pattern suggesting an immediate advantage in regrowth capacity due to any specific fertilization treatment was detected. During the evaluated period, differences in shoot length were observed only in plants from the control treatment 43 days after pruning. However, the correlation analysis provides an insightful perspective on this matter. Remarkable biomass increases in new sprouts were closely related to both a lower shoot biomass and a higher root:shoot ratio before pruning. The plant allocation patterns in roots prioritize the resource accumulation to form new tissue after disturbance [56]. Our findings confirm the importance of roots as storage reserves of starch to recover biomass after pruning [8]. Therefore, starch reserves can be considered an indicator of resprout capability because they are an essential source of sugars for new shoot elongation [57].
Finally, despite this study with P. laevigata highlighting the potential benefits of targeted nutritional management in plant production, it would be beneficial in future studies to investigate longer-term effects of nitrogen treatments, varying defoliation intensities, and additional stress factors to further elucidate their impacts on plant growth and resilience. The findings of this study could have practical implications for designing nutritional management strategies to optimize nitrogen application and potentially improve seedling performance in afforestation efforts to recover natural populations of mesquite.
5. Conclusions
Nitrogen supply modifies the distribution of biomass between leaves and roots in P. laevigata regardless of its chemical form. Increased N inputs decrease photosynthetic capacity, even in plants with high internal N status. Additional N inputs reduce N use efficiency, particularly when amino acids are supplied. However, fertilization with amino acids increases their concentration in leaves and roots. Protein accumulation in stems is sensitive to high N supply in the inorganic form, whereas organic N induces protein accumulation in leaves. High levels of N supply promote greater starch concentration in roots. Our findings indicate no immediate advantage in regrowth capacity attributable to specific fertilization treatments. Biomass increases in new sprouts are influenced by initial root ratios and the presence of starch reserves in roots, highlighting the critical role of root systems in post-browsing recovery, as observed in arid lands inhabited by natural or artificial populations of mesquite.
Author Contributions
Conceptualization, design and development of the experiment and writing original draft, E.B.-V.; Laboratory analyses and writing—reviewing, L.M.V.-N.; writing—reviewing and editing, J.L.G.-R., H.S.-L. and J.L.G.-P.; development of the experiment, data collection, and writing—reviewing, C.G.C.-V.; data analysis and interpretation, J.A.S. All authors have read and agreed to the published version of the manuscript.
Funding
This research was funded by Mexico’s National Institute for Forestry, Agriculture, and Livestock Research—INIFAP (Project No. 9261835730).
Data Availability Statement
The data that support the findings of this study are available from the corresponding author, upon reasonable request.
Acknowledgments
We would like to thank Maribel Díaz for the support during the experiment development and data collection.
Conflicts of Interest
The authors declare no conflicts of interest.
Appendix A

Table A1.
Average morphological and functional variables of Prosopis laevigata plants fertilized with additional nitrogen from two sources: inorganic nitrogen (NH4NO3) and organic nitrogen (amino acids) at nursery.
Table A1.
Average morphological and functional variables of Prosopis laevigata plants fertilized with additional nitrogen from two sources: inorganic nitrogen (NH4NO3) and organic nitrogen (amino acids) at nursery.
| Variable | Control | Additional Supply of N | ANOVA Results | ||
|---|---|---|---|---|---|
| N Inorganic | N Organic | F Value | Pr (>F) | ||
| Stem length (cm) | 27.2 ± 1.0 | 31.1 ± 1.5 ns | 29.1 ± 1.0 ns | 0.5875 | 0.5602 |
| Stem diameter (mm) | 2.7 ± 0.1 | 2.6 ± 0.1 ns | 2.8 ± 0.1 ns | 1.4216 | 0.2527 |
| Leaf area (cm2) | 59.6 ± 2.9 | 71.1 ± 5 ns | 71.1 ± 3.5 ns | 2.896 | 0.0663 |
| Leaf biomass (g) | 0.36 ± 0.02 | 0.43 ± 0.03 ns | 0.43 ± 0.02 ns | 2.8960 | 0.0663 |
| Stem biomass (g) | 0.57 ± 0.04 | 0.63 ± 0.06 ns | 0.67 ± 0.05 ns | 1.0077 | 0.3737 |
| Root biomass(g) | 0.35 ± 0.02 | 0.32 ± 0.02 ns | 0.34 ± 0.02 ns | 0.5875 | 0.5602 |
| Total biomass (g) | 1.28 ± 0.07 | 1.37 ± 0.10 ns | 1.44 ± 0.07 ns | 0.9587 | 0.4069 |
| LMF (%) | 28.3 ± 0.7 | 31.6 ± 0.8 * | 30.2 ± 1.1 ns | 3.4869 | 0.0397 |
| SMF (%) | 44.4 ± 0.9 | 44.8 ± 1.1 ns | 46.2 ± 1.2 ns | 0.8165 | 0.4489 |
| RMF (%) | 27.3 ± 0.7 | 23.6 ± 0.9 * | 23.6 ± 1.2 * | 4.5415 | 0.0164 |
| NAR (mg cm2 day−1) | 0.18 ± 0.01 | 0.16 ± 0.01 * | 0.17 ± 0.01 ns | 3.3527 | 0.0446 |
| RGR (mg g−1 day−1) | 30 ± 0.4 | 30.4 ± 0.6 ns | 31 ± 0.4 ns | 0.9557 | 0.3928 |
LMF, SMF, and RMF are the leaf, stem, and root mass fractions, respectively; NAR is the net assimilation rate, and RGR is the relative growth rate. Statistical significance: ns = non-significant, * p < 0.05) fertilization treatments to control.
References
- Berendse, F.; de Kroon, H.; Braakhekke, W.G. Acquisition, Use, and Loss of Nutrients. In Functional Plant Biology; Pugnaire, F., Valladares, F., Eds.; CRC Press: Boca Raton, FL, USA, 2007; pp. 259–284. [Google Scholar]
- Sage, R.F.; Pearcy, R.W.; Seemann, J.R. The Nitrogen Use Efficiency of C3 and C4 Plants: III. Leaf Nitrogen Effects on the Activity of Carboxylating Enzymes in Chenopodium album (L.) and Amaranthus retroflexus (L.). Plant Physiol. 1987, 85, 355–359. [Google Scholar] [CrossRef] [PubMed]
- Barker, A.V.; Pilbeam, D.J. Handbook of Plant Nutrition, 2nd ed.; CRC Press/Taylor & Francis Group: Boca Raton, FL, USA, 2015. [Google Scholar]
- Marschner, P. Marschner’s Mineral Nutrition of Higher Plants, 3rd ed.; Academic Press: London, UK, 2012; ISBN 978-0-12-384905-2. [Google Scholar]
- Acevedo, M.; Rubilar, R.; Dumroese, R.K.; Ovalle, J.F.; Sandoval, S.; Chassin-Trubert, R. Nitrogen Loading of Eucalyptus Globulus Seedlings: Nutritional Dynamics and Influence on Morphology and Root Growth Potential. New For. 2021, 52, 31–46. [Google Scholar] [CrossRef]
- Cortina, J.; Vilagrosa, A.; Trubat, R. The Role of Nutrients for Improving Seedling Quality in Drylands. New For. 2013, 44, 719–732. [Google Scholar] [CrossRef]
- Rocha, J.S.; Calzavara, A.K.; Bianchini, E.; Pimenta, J.A.; Stolf-Moreira, R.; Oliveira, H.C. Nitrogen Supplementation Improves the High-Light Acclimation of Guazuma Ulmifolia Lam. Seedlings. Trees 2019, 33, 421–431. [Google Scholar] [CrossRef]
- Villar-Montero, R.; Ruiz-Robleto, J.; Quero-Pérez, J.L.; Poorter, H.; Valladares, F.; Marañón, T. Tasas de Crecimiento En Especies Leñosas: Aspectos Funcionales e Implicaciones Ecológicas. In Ecología del Bosque Mediterráneo en un Mundo Cambiante; Valladares, F., Ed.; Ministerio de Medio Ambiente y Medio Rural y Marino (España): Madrid, Spain, 2008; pp. 193–230. [Google Scholar]
- Näsholm, T.; Kielland, K.; Ganeteg, U. Uptake of Organic Nitrogen by Plants. New Phytol. 2009, 182, 31–48. [Google Scholar] [CrossRef]
- Warren, C.R. Does Nitrogen Concentration Affect Relative Uptake Rates of Nitrate, Ammonium, and Glycine? J. Plant Nutr. Soil Sci. 2009, 172, 224–229. [Google Scholar] [CrossRef]
- Britto, D.T.; Kronzucker, H.J. Ecological Significance and Complexity of N-Source Preference in Plants. Ann. Bot. 2013, 112, 957–963. [Google Scholar] [CrossRef]
- Bueno, A.; Greenfield, L.; Pritsch, K.; Schmidt, S.; Simon, J. Responses to Competition for Nitrogen between Subtropical Native Tree Seedlings and Exotic Grasses Are Species-Specific and Mediated by Soil N Availability. Tree Physiol. 2018, 39, 404–416. [Google Scholar] [CrossRef] [PubMed]
- Taiz, L.; Møller, I.M.; Murphy, A.; Zeiger, E. Plant Physiology and Development, 7th ed.; Sinauer Associates Inc.: Sunderland, MA, USA, 2022; ISBN 9780197577240. [Google Scholar]
- Zerihun, A.; McJenzie, B.A.; Morton, J.D. Photosynthate Costs Associated with the Utilization of Different Nitrogen–Forms: Influence on the Carbon Balance of Plants and Shoot–Root Biomass Partitioning. New Phytol. 1998, 138, 1–11. [Google Scholar] [CrossRef]
- Esteban, R.; Ariz, I.; Cruz, C.; Moran, J.F. Review: Mechanisms of Ammonium Toxicity and the Quest for Tolerance. Plant Sci 2016, 248, 92–101. [Google Scholar] [CrossRef]
- Govindasamy, P.; Muthusamy, S.K.; Bagavathiannan, M.; Mowrer, J.; Jagannadham, P.T.K.; Maity, A.; Halli, H.M.; GK, S.; Vadivel, R.; TK, D.; et al. Nitrogen Use Efficiency—A Key to Enhance Crop Productivity under a Changing Climate. Front. Plant Sci. 2023, 14, 1121073. [Google Scholar] [CrossRef] [PubMed]
- Franklin, O.; Cambui, C.A.; Gruffman, L.; Palmroth, S.; Oren, R.; Näsholm, T. The Carbon Bonus of Organic Nitrogen Enhances Nitrogen Use Efficiency of Plants. Plant Cell Environ. 2017, 40, 25–35. [Google Scholar] [CrossRef] [PubMed]
- Gruffman, L.; Ishida, T.; Nordin, A.; Näsholm, T. Cultivation of Norway Spruce and Scots Pine on Organic Nitrogen Improves Seedling Morphology and Field Performance. For. Ecol. Manag. 2012, 276, 118–124. [Google Scholar] [CrossRef]
- Sigala, J.A.; Oliet, J.A.; Uscola, M. Assessing Growth, Frost Tolerance, and Acclimation of Pine Seedlings with Contrasted Dormancy Strategies as Influenced by Organic Nitrogen Supply. Physiol. Plant 2021, 173, 1105–1119. [Google Scholar] [CrossRef] [PubMed]
- Sigala, J.A.; Uscola, M.; Oliet, J.A.; Jacobs, D.F. Drought Tolerance and Acclimation in Pinus Ponderosa Seedlings: The Influence of Nitrogen Form. Tree Physiol. 2020, 40, 1165–1177. [Google Scholar] [CrossRef]
- Palacios Romero, A.; Rodríguez Laguna, R.; de la Hernández Flores, M.L.; Jiménez Muñoz, E.; Tirado Torres, D. Distribución Potencial de Prosopis Laevigata (Humb. et Bonpl. Ex Willd) MC Johnston Basada En Un Modelo de Nicho Ecológico. Rev. Mex. Cienc. For. 2016, 7, 35–46. [Google Scholar] [CrossRef]
- Lopez-Lozano, N.E.; Carcaño-Montiel, M.G.; Bashan, Y. Using Native Trees and Cacti to Improve Soil Potential Nitrogen Fixation during Long-Term Restoration of Arid Lands. Plant Soil 2016, 403, 317–329. [Google Scholar] [CrossRef]
- Trucios-Caciano, R.; Valenzuela-Nuñez, L.M.; Ríos-Saucedo, J.C.; Rivera-González, M.; Estrada-Ávalos, J. Cambio de Uso de Suelo En Coahuila y Durango. Rev. Chapingo Ser. Zonas 2012, 11, 68–74. [Google Scholar]
- Landis, T.D.; Tinus, R.W.; McDonald, S.E.; Bartlett, J.P. Containers and Growing Media. In The Container Tree Nursery Manual; Department of Agriculture, Forest Service: Washington, DC, USA, 1990; Volume 2, pp. 41–92. [Google Scholar]
- Wright, R.D.; Grueber, K.L.; Leda, C. Medium Nutrient Extraction with the Pour-through and Saturated Medium Procedures for Poinsettia. HortScience 1990, 25, 658–660. [Google Scholar] [CrossRef]
- Prieto-Ruíz, J.Á.; Ríos-Saucedo, J.C.; Monárrez-González, J.C.; García-Rodríguez, J.L.; Mejía-Bojorquez, J.; Bustamante-García, V. Recomendaciones Para La Producción de Mezquite En Condiciones de Vivero; INIFAP: Durango, México, 2012. [Google Scholar]
- Li, X.; Schmid, B.; Wang, F.; Paine, C.E.T. Net Assimilation Rate Determines the Growth Rates of 14 Species of Subtropical Forest Trees. PLoS ONE 2016, 11, e0150644. [Google Scholar] [CrossRef]
- Hunt, R.; Causton, D.R.; Shipley, B.; Askew, A.P. A Modern Tool for Classical Plant Growth Analysis. Ann. Bot. 2002, 90, 485–488. [Google Scholar] [CrossRef] [PubMed]
- Pinto, J.R.; Chandler, R.A.; Dumroese, R.K. Growth, Nitrogen Use Efficiency, and Leachate Comparison of Subirrigated and Overhead Irrigated Pale Purple Coneflower Seedlings. HortScience 2008, 43, 897–901. [Google Scholar] [CrossRef]
- Yemm, E.W.; Cocking, E.C.; Ricketts, R.E. The determination of amino-acids with ninhydrin. Analyst 1955, 80, 209–214. [Google Scholar] [CrossRef]
- van Handel, E. Direct Microdetermination of Sucrose. Anal. Biochem. 1968, 22, 280–283. [Google Scholar] [CrossRef]
- del Morales-Espinoza, I.C.; Ortiz-Solorio, C.A.; Gutiérrez-Castorena, M.D.C.; Gutiérrez-Castorena, E.V. Estudio Etnoedafológico Para El Reconocimiento de Tipos de Usos Asociados Con Cadenas Productivas En El Ejido de Santa Cruz, Durango. Terra Latinoam 2021, 39, e853. [Google Scholar] [CrossRef]
- R Core Team R. A Language and Environment for Statistical Computing; R Foundation for Statistical Computing: Vienna, Austria, 2020. [Google Scholar]
- Signorell, A. DescTools: Tools for Descriptive Statistics; R Foundation for Statistical Computing: Vienna, Austria, 2024. [Google Scholar]
- Fox, J.; Weisberg, S. An R Companion to Applied Regression, 2nd ed.; Sage Publications: Thousand Oaks, CA, USA, 2011. [Google Scholar]
- Bates, D.; Mächler, M.; Bolker, B.; Walker, S. Fitting Linear Mixed-Effects Models Using Lme4. J. Stat. Softw. 2015, 67, 48. [Google Scholar] [CrossRef]
- Lenth, R.; Singmann, H.; Love, J.; Buerkner, P.; Herve, M. Emmeans: Estimated Marginal Means, aka Least-Squares Means; The R Foundation: Vienna, Austria, 2019. [Google Scholar]
- Wickham, H. Ggplot2: Elegant Graphics for Data Analysis; Springer: New York, NY, USA, 2016; ISBN 978-3-319-24277-4. [Google Scholar]
- Cambui, C.A.; Svennerstam, H.; Gruffman, L.; Nordin, A.; Ganeteg, U.; Näsholm, T. Patterns of Plant Biomass Partitioning Depend on Nitrogen Source. PLoS ONE 2011, 6, e19211. [Google Scholar] [CrossRef]
- Kiba, T.; Krapp, A. Plant Nitrogen Acquisition under Low Availability: Regulation of Uptake and Root Architecture. Plant Cell Physiol. 2016, 57, 707–714. [Google Scholar] [CrossRef]
- Xie, T.; Shan, L.; Zhang, W. N Addition Alters Growth, Non-Structural Carbohydrates, and C:N:P Stoichiometry of Reaumuria Soongorica Seedlings in Northwest China. Sci. Rep. 2022, 12, 15390. [Google Scholar] [CrossRef]
- Soares, C.B.; de Freitas, E.C.S.; de Paiva, H.N.; Neves, J.C.L. Nitrogen Sources and Doses on Growth and Quality of Seedlings of Cassia Grandis and Peltophorum Dubium. Rev. Árvore 2017, 41, e410214. [Google Scholar] [CrossRef][Green Version]
- Aliarab, A.; Vazifekhah, O.E.; Sadati, S.-E. Effect of Soil Moisture Content and Nitrogen Fertilizer on Survival, Growth and Some Physiological Characteristics of Platycladus Orientalis Seedlings. J. For. Sci. 2020, 66, 511–523. [Google Scholar] [CrossRef]
- Bardy, L.R.; Debiasi, T.V.; Sanada, K.; Rondina, A.B.; Torezan, J.M.; Stolf-Moreira, R.; Bianchini, E.; Pimenta, J.A.; Oliveira, H.C. Effect of Nitrogen Addition to the Soil on Atlantic Forest Tree Seedlings. Forests 2023, 14, 1111. [Google Scholar] [CrossRef]
- Terradas, J. Ecología de La Vegetación: De La Ecofisiología de Las Plantas a La Dinámica de Comunidades y Paisajes, 1st ed.; Ediciones Omega: Barcelona, Spain, 2001. [Google Scholar]
- Lim, H.; Jämtgård, S.; Oren, R.; Gruffman, L.; Kunz, S.; Näsholm, T. Organic Nitrogen Enhances Nitrogen Nutrition and Early Growth of Pinus Sylvestris Seedlings. Tree Physiol. 2022, 42, 513–522. [Google Scholar] [CrossRef]
- Garnett, T.; Conn, V.; Kaiser, B.N. Root Based Approaches to Improving Nitrogen Use Efficiency in Plants. Plant Cell Environ. 2009, 32, 1272–1283. [Google Scholar] [CrossRef]
- Jones, D.L.; Healey, J.R.; Willett, V.B.; Farrar, J.F.; Hodge, A. Dissolved Organic Nitrogen Uptake by Plants—An Important N Uptake Pathway? Soil Biol. Biochem. 2005, 37, 413–423. [Google Scholar] [CrossRef]
- Pascual, J.A.; Ceglie, F.; Tuzel, Y.; Koller, M.; Koren, A.; Hitchings, R.; Tittarelli, F. Organic Substrate for Transplant Production in Organic Nurseries. A Review. Agron. Sustain. Dev. 2018, 38, 35. [Google Scholar] [CrossRef]
- Yang, L.; Zhang, L.; Geisseler, D.; Wu, Z.; Gong, P.; Xue, Y.; Yu, C.; Juan, Y.; Horwath, W.R. Available C and N Affect the Utilization of Glycine by Soil Microorganisms. Geoderma 2016, 283, 32–38. [Google Scholar] [CrossRef]
- Garcia, A.L.; Madrid, R.; Gimeno, V.; Rodriguez-Ortega, W.M.; Nicolas, N.; Garcia-Sanchez, F. The Effects of Amino Acids Fertilization Incorporated to the Nutrient Solution on Mineral Composition and Growth in Tomato Seedlings. Span. J. Agric. Res. 2011, 9, 852–861. [Google Scholar] [CrossRef]
- Owen, A.G.; Jones, D.L. Competition for Amino Acids between Wheat Roots and Rhizosphere Microorganisms and the Role of Amino Acids in Plant N Acquisition. Soil Biol. Biochem. 2001, 33, 651–657. [Google Scholar] [CrossRef]
- Rosado-Souza, L.; Yokoyama, R.; Sonnewald, U.; Fernie, A.R. Understanding Source–Sink Interactions: Progress in Model Plants and Translational Research to Crops. Mol. Plant 2023, 16, 96–121. [Google Scholar] [CrossRef]
- Bihmidine, S.; Hunter, C.T.; Johns, C.E.; Koch, K.E.; Braun, D.M. Regulation of Assimilate Import into Sink Organs: Update on Molecular Drivers of Sink Strength. Front. Plant Sci. 2013, 4, 177. [Google Scholar] [CrossRef] [PubMed]
- Fujiwara, T.; Nambara, E.; Yamagishi, K.; Goto, D.B.; Naito, S. Storage Proteins. In The Arabidopsis Book; American Society of Plant Biologists: Rockville, MD, USA, 2002; Volume 1, p. e0020. [Google Scholar]
- Clarke, P.J.; Lawes, M.J.; Midgley, J.J.; Lamont, B.B.; Ojeda, F.; Burrows, G.E.; Enright, N.J.; Knox, K.J.E. Resprouting as a Key Functional Trait: How Buds, Protection and Resources Drive Persistence after Fire. New Phytol. 2013, 197, 19–35. [Google Scholar] [CrossRef] [PubMed]
- Hartmann, H.; Trumbore, S. Understanding the Roles of Nonstructural Carbohydrates in Forest Trees—From What We Can Measure to What We Want to Know. New Phytol. 2016, 211, 386–403. [Google Scholar] [CrossRef] [PubMed]


Disclaimer/Publisher’s Note: The statements, opinions and data contained in all publications are solely those of the individual author(s) and contributor(s) and not of MDPI and/or the editor(s). MDPI and/or the editor(s) disclaim responsibility for any injury to people or property resulting from any ideas, methods, instructions or products referred to in the content. |
© 2024 by the authors. Licensee MDPI, Basel, Switzerland. This article is an open access article distributed under the terms and conditions of the Creative Commons Attribution (CC BY) license (https://creativecommons.org/licenses/by/4.0/).