Article

A Mixture of Summer Legume and Nonlegume Cover Crops Enhances Winter Wheat Yield, Nitrogen Uptake, and Nitrogen Balance

1
Shaanxi Key Laboratory of Earth Surface System and Environmental Carrying Capacity, College of Urban and Environmental Science, Northwest University, Xi’an 710127, China
2
United States Department of Agriculture, Agricultural Research Service, Northern Plains Agricultural Research Laboratory, 1500 North Central Avenue, Sidney, MT 59270, USA
3
College of Chemistry and Chemical Engineering, Dezhou University, Dezhou 253023, China
*
Author to whom correspondence should be addressed.
Nitrogen 2024, 5(4), 871-890; https://doi.org/10.3390/nitrogen5040056
Submission received: 14 August 2024 / Revised: 17 September 2024 / Accepted: 19 September 2024 / Published: 2 October 2024

Abstract

:
Cover crops protecting soil erosion during the summer fallow in the monsoon weather may enhance dryland winter wheat yield and N relations. We examined the effects of four summer cover crops (soybean (Glycine max L., SB), sudangrass (Sorghum sudanense {Piper} Stapf, SG), soybean and sudangrass mixture (SS), and no cover crop (CK)) and three N fertilization rates (0, 60, and 120 kg N ha−1) on winter wheat yield, quality, and N relations from 2017–2018 to 2020–2021 in the Loess Plateau of China. Cover crop biomass and N accumulation, soil mineral N, and winter wheat yield, protein concentration, and N uptake were greater for SB and SS than other cover crops at most N fertilization rates and years. The N fertilization rate had variable effects on these parameters. Winter wheat aboveground biomass and grain N productivities were greater for CK than other cover crops at all N fertilization rates and years. Nitrogen balance was greater for SS than other cover crops at 60 and 120 kg N ha−1 in all years. The SS with 120 kg N ha−1 can enhance soil mineral N, winter wheat yield and quality, and N balance compared to CK and SG with or without N fertilization rates.

1. Introduction

In the Loess Plateau of China, lands are usually kept under fallow after winter wheat harvest during the summer. This results in the vulnerability of soils to erode, as soils are exposed to monsoon rain during this period. Summer cover crops may protect soils from erosion by covering the soil surface [1], conserve soil N by extracting N [2,3,4], and enhance succeeding crop yields and N uptake by supplying N from cover crop residues [4,5] compared to no cover crop. Cover crops also indirectly favor succeeding crop yields by increasing soil aggregation and C sequestration [1] and by suppressing weeds and pests [5] compared to no cover crop. Cover crop residues incorporated into the soil after termination can enhance soil health and fertility [6].
Legume cover crops can enhance succeeding crop yields, quality, and N uptake by supplying N from their residues due to their higher-tissue N concentrations and enriching soil-available N compared to nonlegumes or no cover crop [7,8,9,10]. In contrast, nonlegume cover crops can reduce succeeding crop yields and N uptake by immobilizing soil N because of their greater residue C/N ratio compared to legume cover crops [11,12]. However, nonlegume cover crops can reduce N leaching compared to legumes or no cover crop by extracting N from the soil and reducing soil residual N due to their large biomass production [2,3,4]. A mixture of legume and nonlegume cover crops may enhance succeeding crop yields and quality by enhancing N supply compared to nonlegumes or no cover crop and reduce N leaching compared to legume cover crops [13,14].
Cover crops alone often do not supply enough N to sustain succeeding crop yields and quality [15]. Especially with nonlegume cover crops which immobilize soil N, additional N fertilization rates greater than recommended rates may be needed to sustain succeeding crop yields and quality [16]. In contrast, additional N fertilization rates with legume cover crops can degrade environmental quality by enhancing N leaching and emissions of N2O, a potent greenhouse gas that contributes to global warming [15,17]. Excessive N fertilization rates along with cover crops can also reduce N-use efficiency [18]. An optimum rate of N fertilization, that varies with cover crop species, is needed to sustain succeeding crop yields and quality while reducing environmental degradation [15,16,17].
Cover crops and N fertilization rates can affect N balance by supplying N, enhancing soil residual N, and increasing crop N uptake [19]. The magnitude of N balance with cover crops and N fertilization rates, however, varies with cover crop species and soil and climatic conditions [20,21,22]. The performance of legume cover crops to fix atmospheric N and supply it to succeeding crops or nonlegume cover crops to immobilize soil N depends on soil texture and climatic condition that vary from place to place and also from one year to next [20,21,22]. Therefore, N fertilization rates need to be adjusted to provide adequate available N for succeeding crops, which vary by cover crop species [20,21,22]. This affects N balance not only due to the nature of treatments, but also to variations in cover crop growth from year to year. The accounting of N balance due to N inputs and outputs is needed to know if cover crops and N fertilization rates can sustain soil available N for succeeding crop growth and production [13]. Information is also needed about the efficiency of cover crops and N fertilization rates for enhancing succeeding crop yields and N recovery, which are generally lacking in the literature.
We studied the effects of summer cover crops and N fertilization rates on soil mineral N, succeeding winter wheat yield, protein concentration, seed weight, N uptake, N productivities and recovery indices, and N balance from 2017–2018 to 2020–2021 in the Loess Plateau of China. We selected soybean as the summer legume cover crop and sudangrass as the nonlegume cover crop based on the continuous growth and high biomass production and N-supplying capacity compared to other cover crops. We hypothesized that a mixture of legume and nonlegume cover crops with reduced N fertilization rate would enhance soil-available N and dryland winter wheat yield, quality, N uptake, and N productivity, as well as N balance compared to legume, nonlegume, or no cover crop in the semiarid region. Our objectives were to: (1) determine the performance of cover crops and N fertilization rates applied to winter wheat on cover crop biomass yield and N accumulation, and (2) evaluate the effects of cover crops and N fertilization rates on succeeding winter wheat yields, quality, N uptake, N productivity and recovery indices, and N balance from 2017–2018 to 2020–2021 in the Loess Plateau of China.

2. Materials and Methods

2.1. Field Site, Treatments, and Crop Management

The experiment was conducted at the same plots in a dryland farm site from 2017 to 2021 at Changwu (107°88′ E, 35°28′ N, 1220 m altitude), Shaanxi Province, in the Loess Plateau of China. The site has a continental monsoon climate, with a mean annual air temperature of 9.7 °C and an average annual precipitation of 584 mm. The soil was a Heilutu silt loam (Calcarid Regosol, according to the FAO classification system), with 38 g kg−1 sand, 712 g kg−1 silt, 250 g kg−1 clay, 8.1 pH, 8.3 g kg−1 organic C, 0.93 g kg−1 total N, and 1.3 Mg m−3 bulk density at the 0–20 cm depth at the beginning of the experiment in June 2017.
Treatments included four summer cover crops (soybean (SB), sudangrass (SG), a mixture of soybean with sudangrass (SS), and no cover crop (CK)) and three N fertilization rates (0, 60, and 120 kg N ha−1 applied to winter wheat) arranged in a factorial design in randomized block with three replications. Soybean was inoculated with proper Rhizobium sp. to improve M fixation capacity, and the no cover crop treatment was fallow without plants where weeds were removed manually as needed. The plot size was 4.0 × 7.0 m. Each plot and block were separated by a strip of 1.0 m. Every year, cover crops were planted with a no-till drill in late June after the harvest of the previous crop, terminated in mid-September, and their residues (whole plants) were incorporated into the soil to 20 cm depth using a rotary tiller. Seeding rates for cover crops were 70 kg ha−1 for SB and 35 kg ha−1 for SG, with seeds sown at a row spacing of 25 cm. In SS, SB was planted at 35 kg ha−1 and SG at 17.5 kg ha−1 at a row spacing of 25 cm. Cover crops did not receive any fertilizers, herbicides, pesticides, or irrigation.
In October in each year, winter wheat (cv. Changwu 134) was planted two weeks after cover crop residue incorporation. Wheat was sown at 160 kg ha−1 using a no-till drill at 20 cm row spacing. At sowing, N fertilizer as urea (46% N) at designated rates and P fertilizer as calcium superphosphate (45% P) at 60 kg P ha−1 were broadcast and then incorporated into the soil to a depth of 20 cm using the rotary tiller. Because of high soil K content, K fertilizer was not applied. Weeds were controlled by hand weeding, and pesticides were applied as needed to manage diseases and pests. No irrigation was applied. In June of the following year, winter wheat was harvested manually by cutting aboveground biomass with a sickle at 2 cm above the ground as per the conventional method.

2.2. Data Collections

Cover crop aboveground biomass was determined by harvesting biomass by hand 2 d before termination with a sickle at 2 cm above the ground after oven drying a subsample at 70 °C for 3 d. Similarly, wheat aboveground biomass was determined by removing biomass manually from the entire plot without returning crop residues to the soil and oven drying a subsample at 70 °C for 7 d. Wheat grain yield was determined by separating grains from the biomass by threshing the aboveground biomass on the ground and oven-drying a subsample at 70 °C for 7 d. The oven-dried cover crop and wheat biomass and grain subsamples were ground to 1 mm and N concentration was determined using a C and N analyzer (Euro Vector EA 3000). The 1000-seed weight was obtained by determining the weights of 1000 wheat grains.
Soil samples were collected from the 0–20 cm depth from five places in central rows of each plot using a hand probe (5 cm inside diameter) at wheat planting and harvest to determine NH4-N and NO3-N concentrations. Samples were composited within a plot, air-dried, ground, and sieved to 2 mm after removing crop residue, coarse roots, and stone fragments. The NH4-N and NO3-N concentrations in soil samples were determined with a discrete auto-analyzer (Cleverchem 380, DeChem-Tech, Florence, Italy). An additional undisturbed core from each plot was collected to a depth of 20 cm to determine soil bulk density, which was calculated by dividing the weight of the oven-dried soil at 105 °C by the volume of the core. Soil NH4-N and NO3-N contents were calculated by multiplying their concentrations by the bulk density and the thickness of the soil layer. Soil mineral N was calculated as the sum of NH4-N and NO3-N contents.

2.3. Calculations

Cover crop N accumulation was calculated by multiplying cover crop biomass by N concentration. Similarly, wheat aboveground biomass and grain N uptake were calculated by multiplying aboveground biomass and grain yield by their N concentrations. Harvest index was determined by dividing wheat grain yield by aboveground biomass. Protein concentration in wheat grain was determined by multiplying grain N concentration by a factor of 6.25 [23].
Nitrogen productivity in wheat aboveground biomass (BNP) and grain (GNP) were calculated as:
BNP = Aboveground biomass/(CCN + SMN + FN)
GNP = Grain yield/(CCN + SMN + FN)
where CCN = cover crop biomass N accumulation, SMN = soil mineral N at winter wheat planting, and FN = N fertilization rate.
Similarly, N recovery indices in wheat aboveground biomass (BNRI) and grain (GNRI) [24,25,26] were calculated as:
BNRI = Aboveground biomass N uptake/(CCN + SMN + FN)
GNRI = Grain N uptake/(CCN + SMN + FN)
Assuming that N losses to environment due to N leaching, denitrification, and volatilization are negligible in the dryland semiarid condition, N balance [25,27] was calculated as:
N balance = N inputs (CCN + SMN + FN) − N outputs (ABN + SMN2)
where ABN = wheat aboveground biomass N removal (grain N + straw N), and SMN2 = soil mineral N at winter wheat harvest.

2.4. Data Analysis

Data on cover crop, winter wheat, and soil mineral N were analyzed using the MIXED model of SAS after checking for the homogeneity and normal distribution of residuals [28]. Cover crop, N fertilization rate, year, and their interactions were considered as fixed effects, and replication as the random effect. Means were separated using the least square means test when treatments and interactions were significant [28]. Statistical significance was evaluated at p ≤ 0.05 unless otherwise mentioned. Threshold p values were adjusted using the least square means test.

3. Results

3.1. Monthly and Growing Season Precipitations

Mean monthly precipitation at the site was above the 30-year average in July 2018–2019 and 2019–2020; August 2017–2018 and 2020–2021; September 2019–2020; October 2017–2018 and 2019–2020; April 2017–2018, 2018–2019, and 2021–2021; and June 2017–2018, 2019–2020, and 2020–2021 (Table 1). Cover crop growing season precipitation (July–September) was 60–89 mm greater in 2018–2019 and 2019–2020 than the 30-year average. Similarly, winter wheat growing season precipitation (October–June) was 39–77 mm greater in 2017–2018, 2019–2020, and 2020–2021 than the 30-year average. Total annual precipitation was 2–129 mm greater in 2018–2019, 2019–2020, and 2020–2021 than the 30-year average. Cover crop growing season precipitation accounted for 40–63% and winter wheat growing season precipitation accounted for 37–60% of the total annual precipitation.

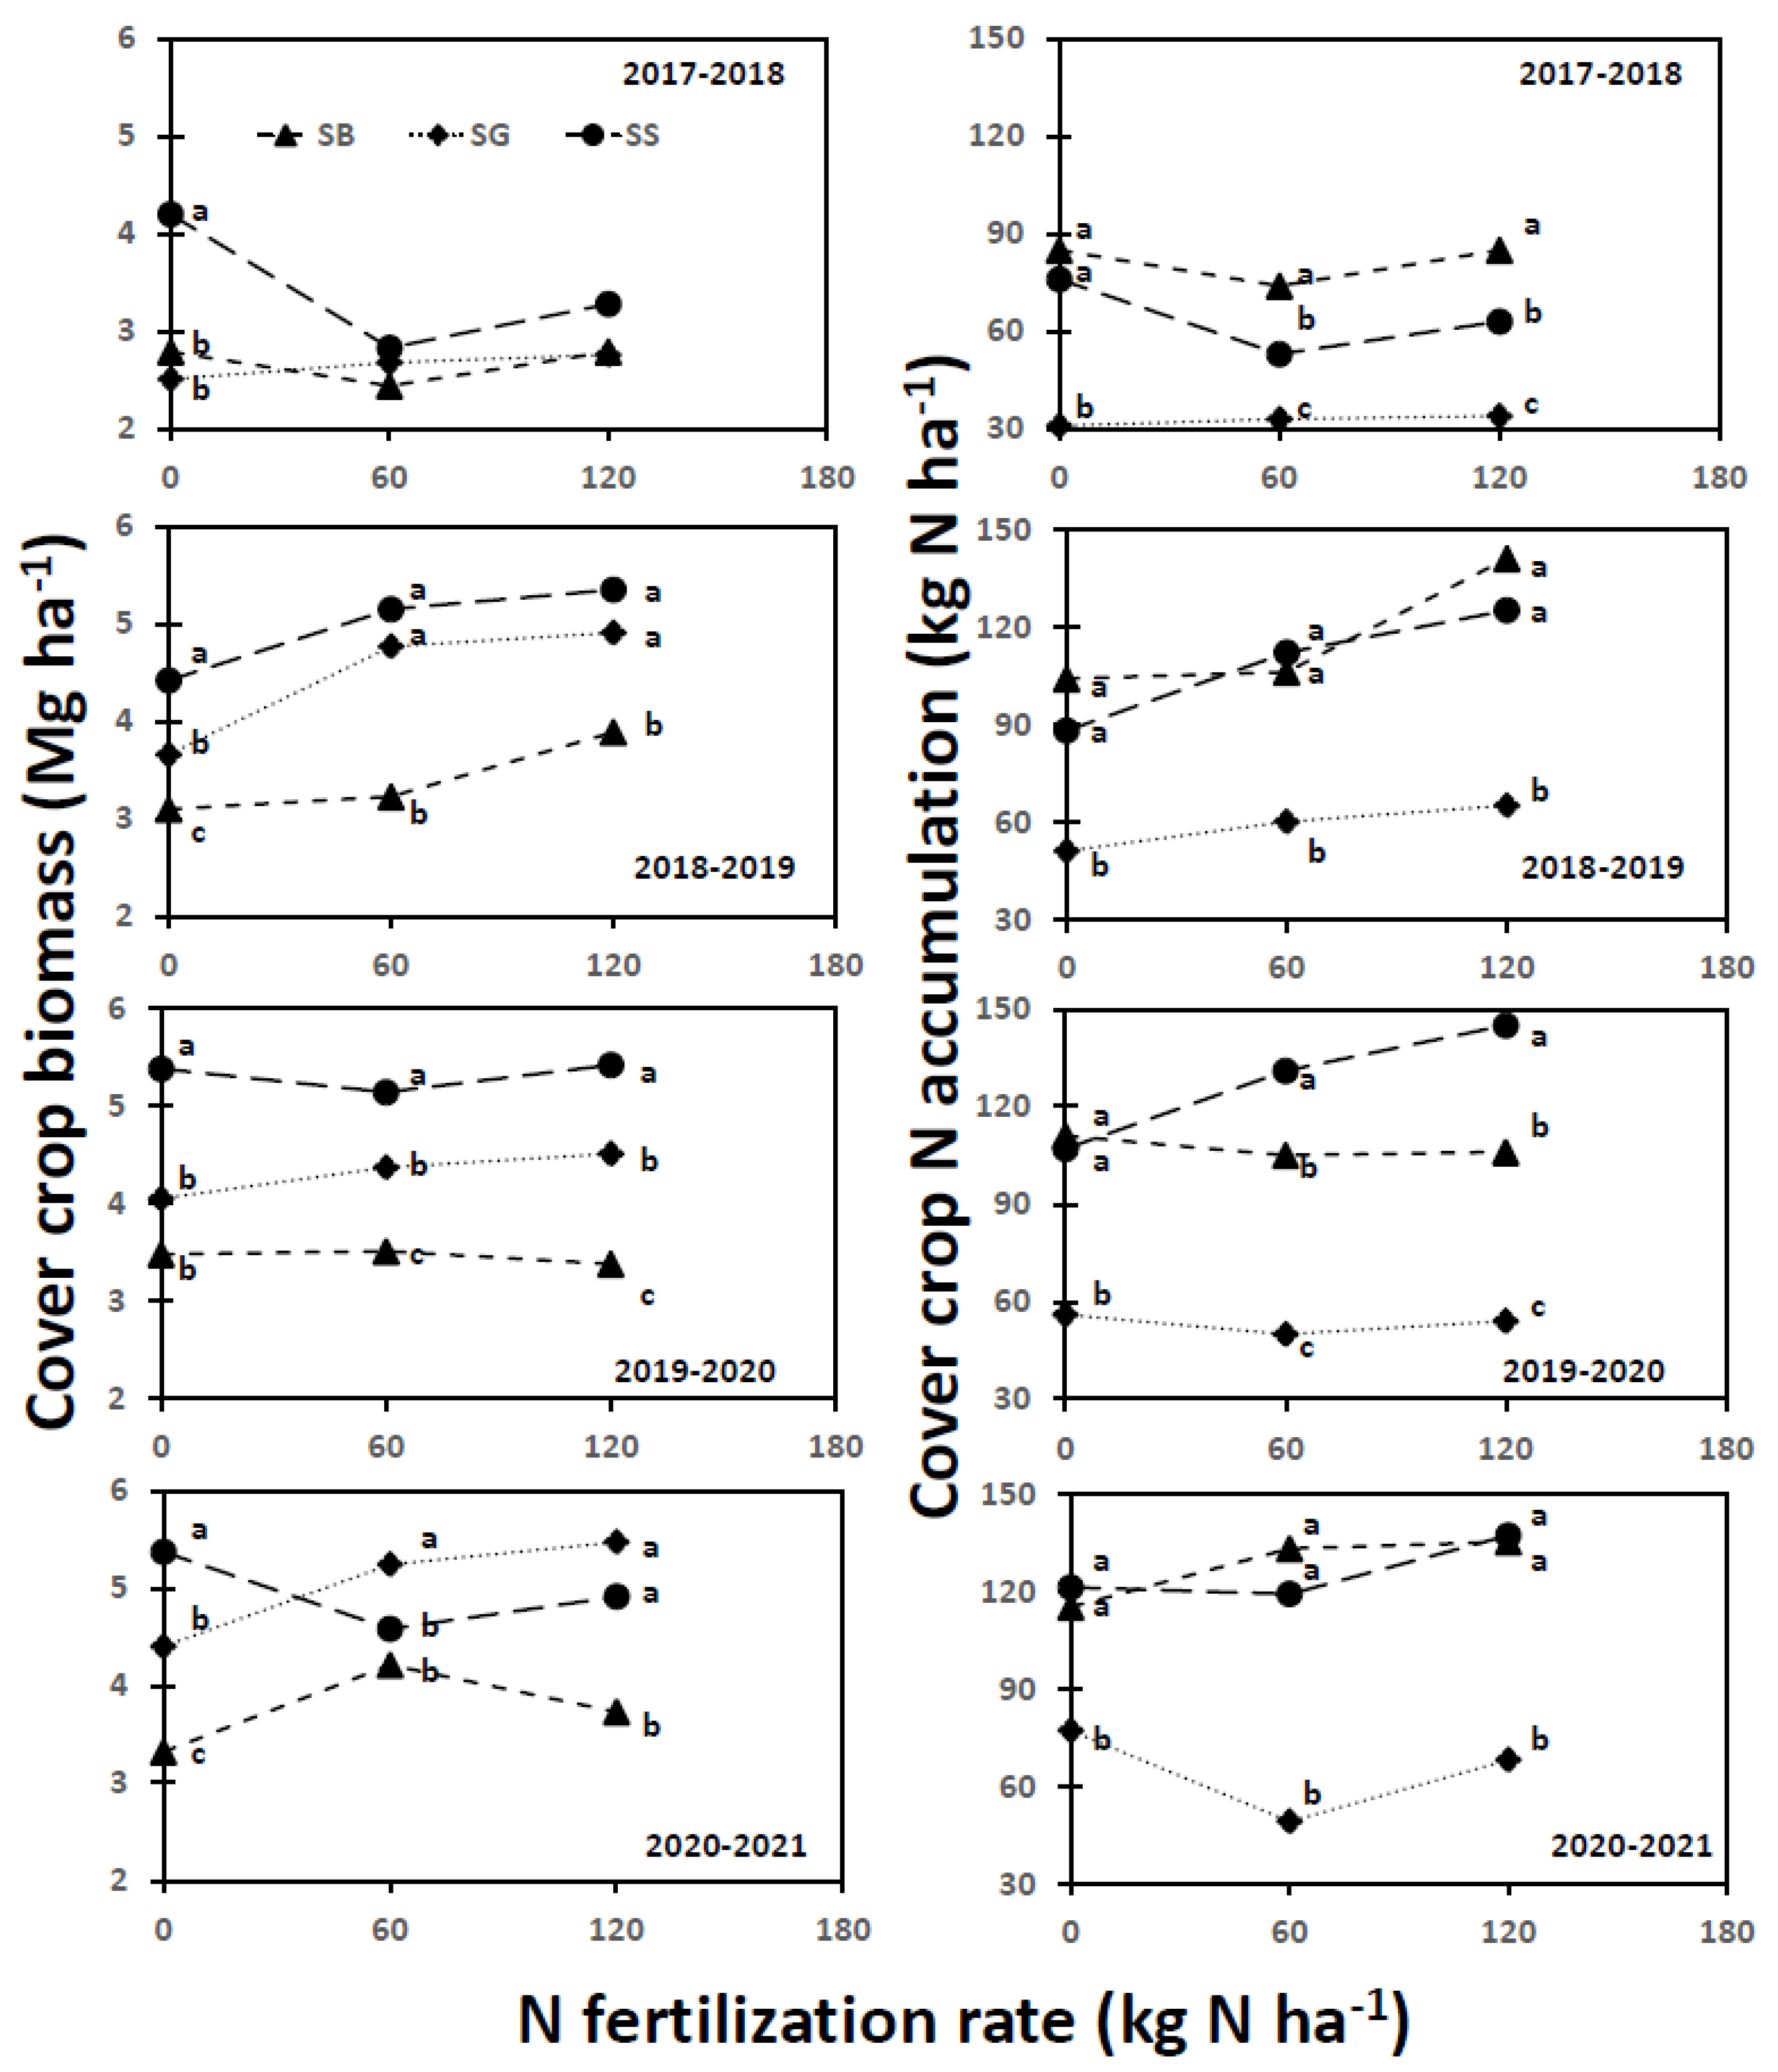
3.2. Cover Crop Biomass and Nitrogen Accumulation

Cover crop biomass and N accumulation were significantly affected by cover crop, N fertilization rate, year, cover crop × N fertilization rate, cover crop × year, N fertilization rate × year, and cover crop × N fertilization rate × year (Table 2). Cover crop biomass was greater for SS than other cover crops at 0 kg N ha−1 in 2017–2018 (Figure 1). In 2018–2019 and 2019–2020, cover crop biomass was greater for SS than SB and SG at 0 kg N ha−1 and greater for SS than SB at 60 and 120 kg N ha−1. In 2020–2021, cover crop biomass was greater for SS than SB and SG at 0 kg N ha−1 and greater for SG than SB at 60 and 120 kg N ha−1. Increasing N fertilization rate increased cover crop biomass for SG in all years and for SS in 2018–2019, but N fertilization rate had a variable effect on cover crop biomass for other cover crops in other years. Averaged across cover crops and N fertilization rates, cover crop biomass was lower in 2017–2018 than other years.
Cover crop N accumulation was greater for SB and SS than SG at 0 kg N ha−1 and greater for SB than SG and SS at 60 and 120 kg N ha−1 in 2017–2018 (Figure 1). From 2018–2019 to 2020–2021, cover crop N was greater for SB and SS than SG at all N fertilization rates. Increasing N fertilization rate increased cover crop N for SG in 2017–2018, for SS and SG in 2018–2019, and for SS in 2019–2020. Nitrogen fertilization rate had a variable effect on cover crop N for other cover crops and years. As with cover crop biomass, cover crop N, averaged across treatments, was lower in 2017–2018 than other years.

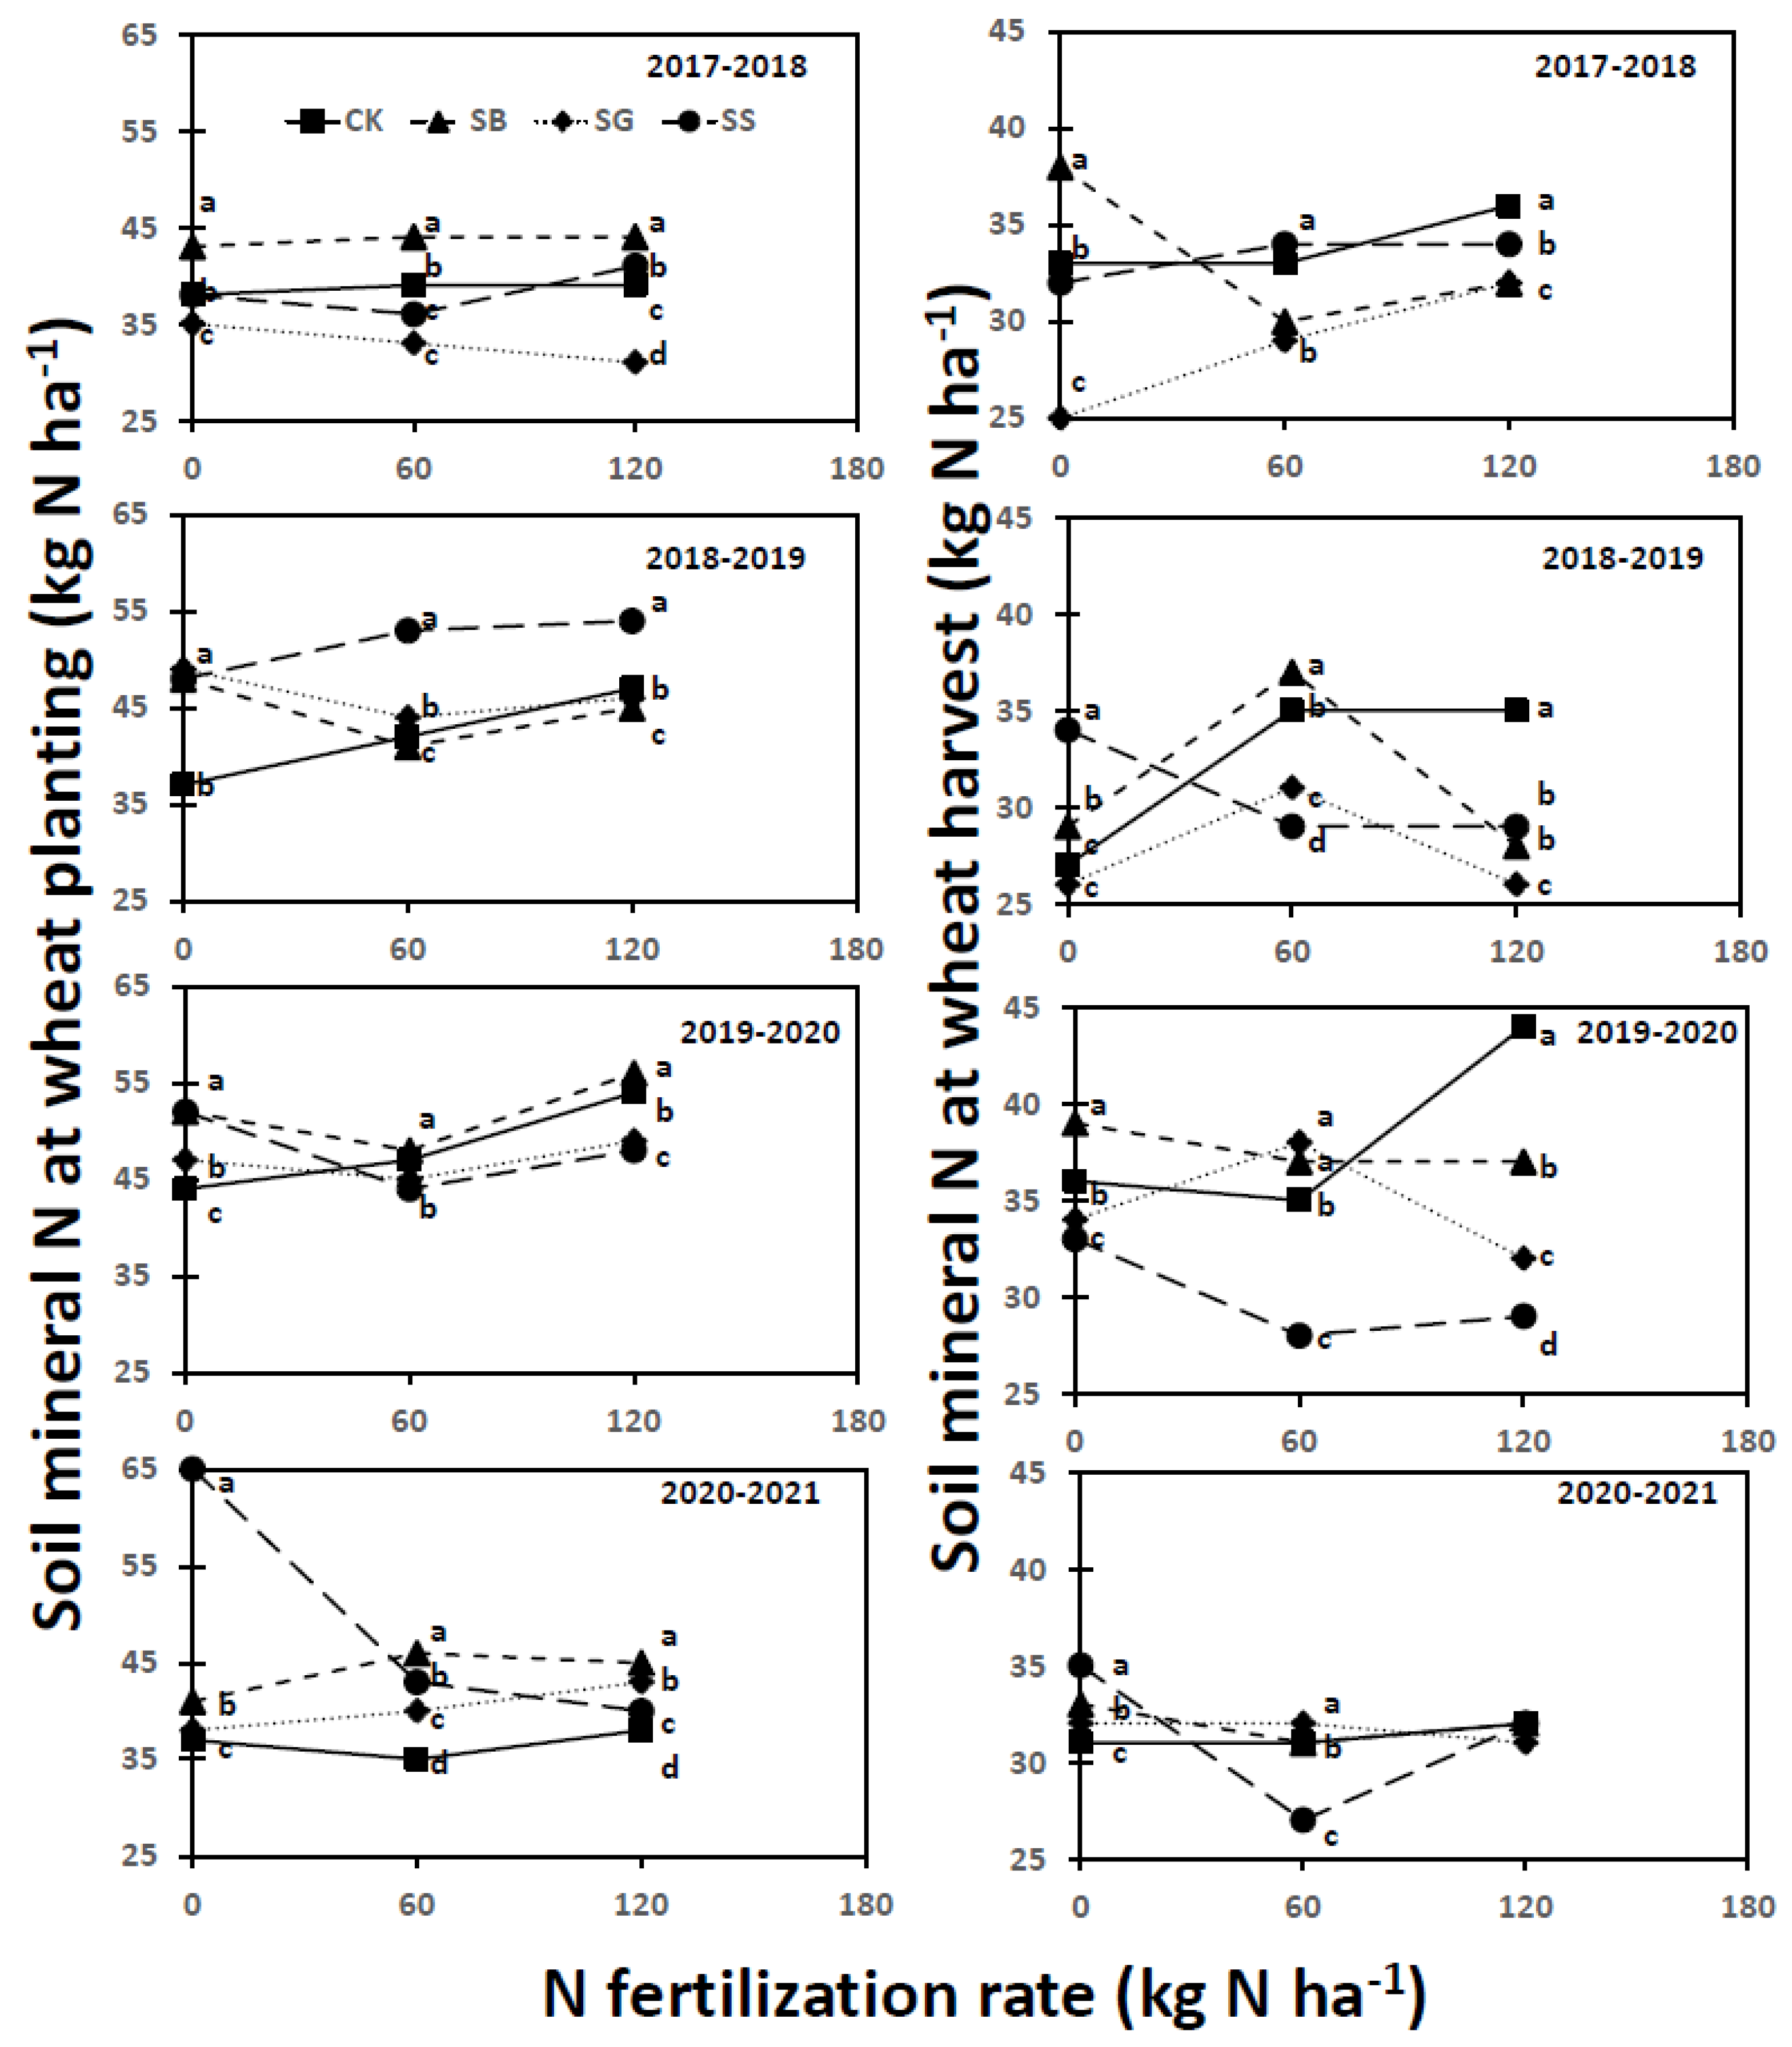
3.3. Soil Mineral Nitrogen

Soil mineral N at winter wheat planting and harvest was also significantly influenced by cover crop, N fertilization rate, year, cover crop × N fertilization rate, cover crop × year, N fertilization rate × year, and cover crop × N fertilization rate × year (Table 2). Mineral N at wheat planting was greater for SB than other cover crops at all N fertilization rates in 2017–2018 (Figure 2). In 2018–2019, mineral N was greater for SB, SG, and SS than CK at 0 kg N ha−1 and greater for SS than other cover crops at 60 and 120 kg N ha−1. In 2019–2020, mineral N was greater for SB and SS than SG and CK at 0 kg N ha−1 and greater for SB and CK than SG and SS at 60 and 120 kg N ha−1. Compared to other cover crops, mineral N was greater for SS at 0 kg N ha−1 and greater for SB at 60 and 120 kg N ha−1 in 2020–2021. Nitrogen fertilization rate had a variable effect on mineral N for various cover crops and years. Averaged across cover crops and N fertilization rates, mineral N was lower in 2017–2018 than other years.
At winter wheat harvest, mineral N was greater for SB than other cover crops at 0 kg N ha−1 and greater for SS and CK than SB and SG at 60 and 120 kg N ha−1 in 2017–2018 (Figure 2). In 2018–2019, compared to other cover crops, mineral N was greater for SG at 0 kg N ha−1, greater for SB at 60 kg N ha−1, and greater for CK at 120 kg N ha−1. In 2019–2020, mineral N was greater for SB than other cover crops at 0 kg N ha−1, greater for SG and SB than CK and SS at 60 kg N ha−1, and greater for CK than other cover crops at 120 kg N ha−1. In 2020–2021, mineral N was greater for SS than other cover crops at 0 kg N ha−1, and greater for SG, SB, and CK than SS at 60 kg N ha−1. The trend of mineral N with N fertilization rate also varied with cover crops and years. Averaged across cover crops and N fertilization rates, mineral N was lower in 2020–2021 than other years.

3.4. Winter Wheat Aboveground Biomass and Grain Yields

Winter wheat aboveground biomass and grain yields were significantly affected by cover crop, N fertilization rate, year, cover crop × N fertilization rate, cover crop × year, N fertilization rate × year, and cover crop × N fertilization rate × year (Table 2). Treatments did not affect aboveground biomass yield in 2017–2018 (Figure 3). In 2018–2019, aboveground biomass yield was greater for SB than SG and SS at 0 kg N ha−1, but greater for SS, SG, and SB than CK at 120 kg N ha−1. In 2019–2020, aboveground biomass yield was greater for SB than SG and CK at 0 kg N ha−1, greater for SB and SS than CK at 60 kg N ha−1, and greater for SS than other cover crops at 120 kg N ha−1. In 2020–2021, aboveground biomass yield was greater for SS and SB than SG and CK at 0 and 120 kg N ha−1 and was greater for SB than other cover crops at 60 kg N ha−1. Increasing N fertilization rate increased aboveground biomass yield for CK in 2017–2018; for SS and SG in 2018–2019; for all cover crops in 2019–2020; and for SS, SG, and CK in 2020–2021. Averaged across cover crops and N fertilization rates, aboveground biomass yield was greater in 2019–2020 than other years.
Winter wheat grain yield also followed pattens for cover crops and N fertilization rates somewhat similar to aboveground biomass yield in all years (Figure 3). Treatments did not affect grain yield in 2017–2018, but grain yield was greater for SS and SB than CK at 0 kg N ha−1 and greater for SS and SN than SG and CK at 60 kg N ha−1 in 2018–2019. In 2019–2020, grain yield was also greater for SS and SB than SG and CK at 0 and 60 kg N ha−1 and greater for SB than CK at 120 kg N ha−1. In 2020–2021, grain yield was greater for SS and SB than SG and CK at 0 and 120 kg N ha−1 and greater for SB than other cover crops at 60 kg N ha−1. Increasing N fertilization rate increased grain yield for all cover crops in 2017–2018 and 2019–2020, for SG and CK in 2018–2019, and for SS, SG, and CK in 2020–2021. Similar to aboveground biomass yield, grain yield was also greater in 2019–2020 than other years.

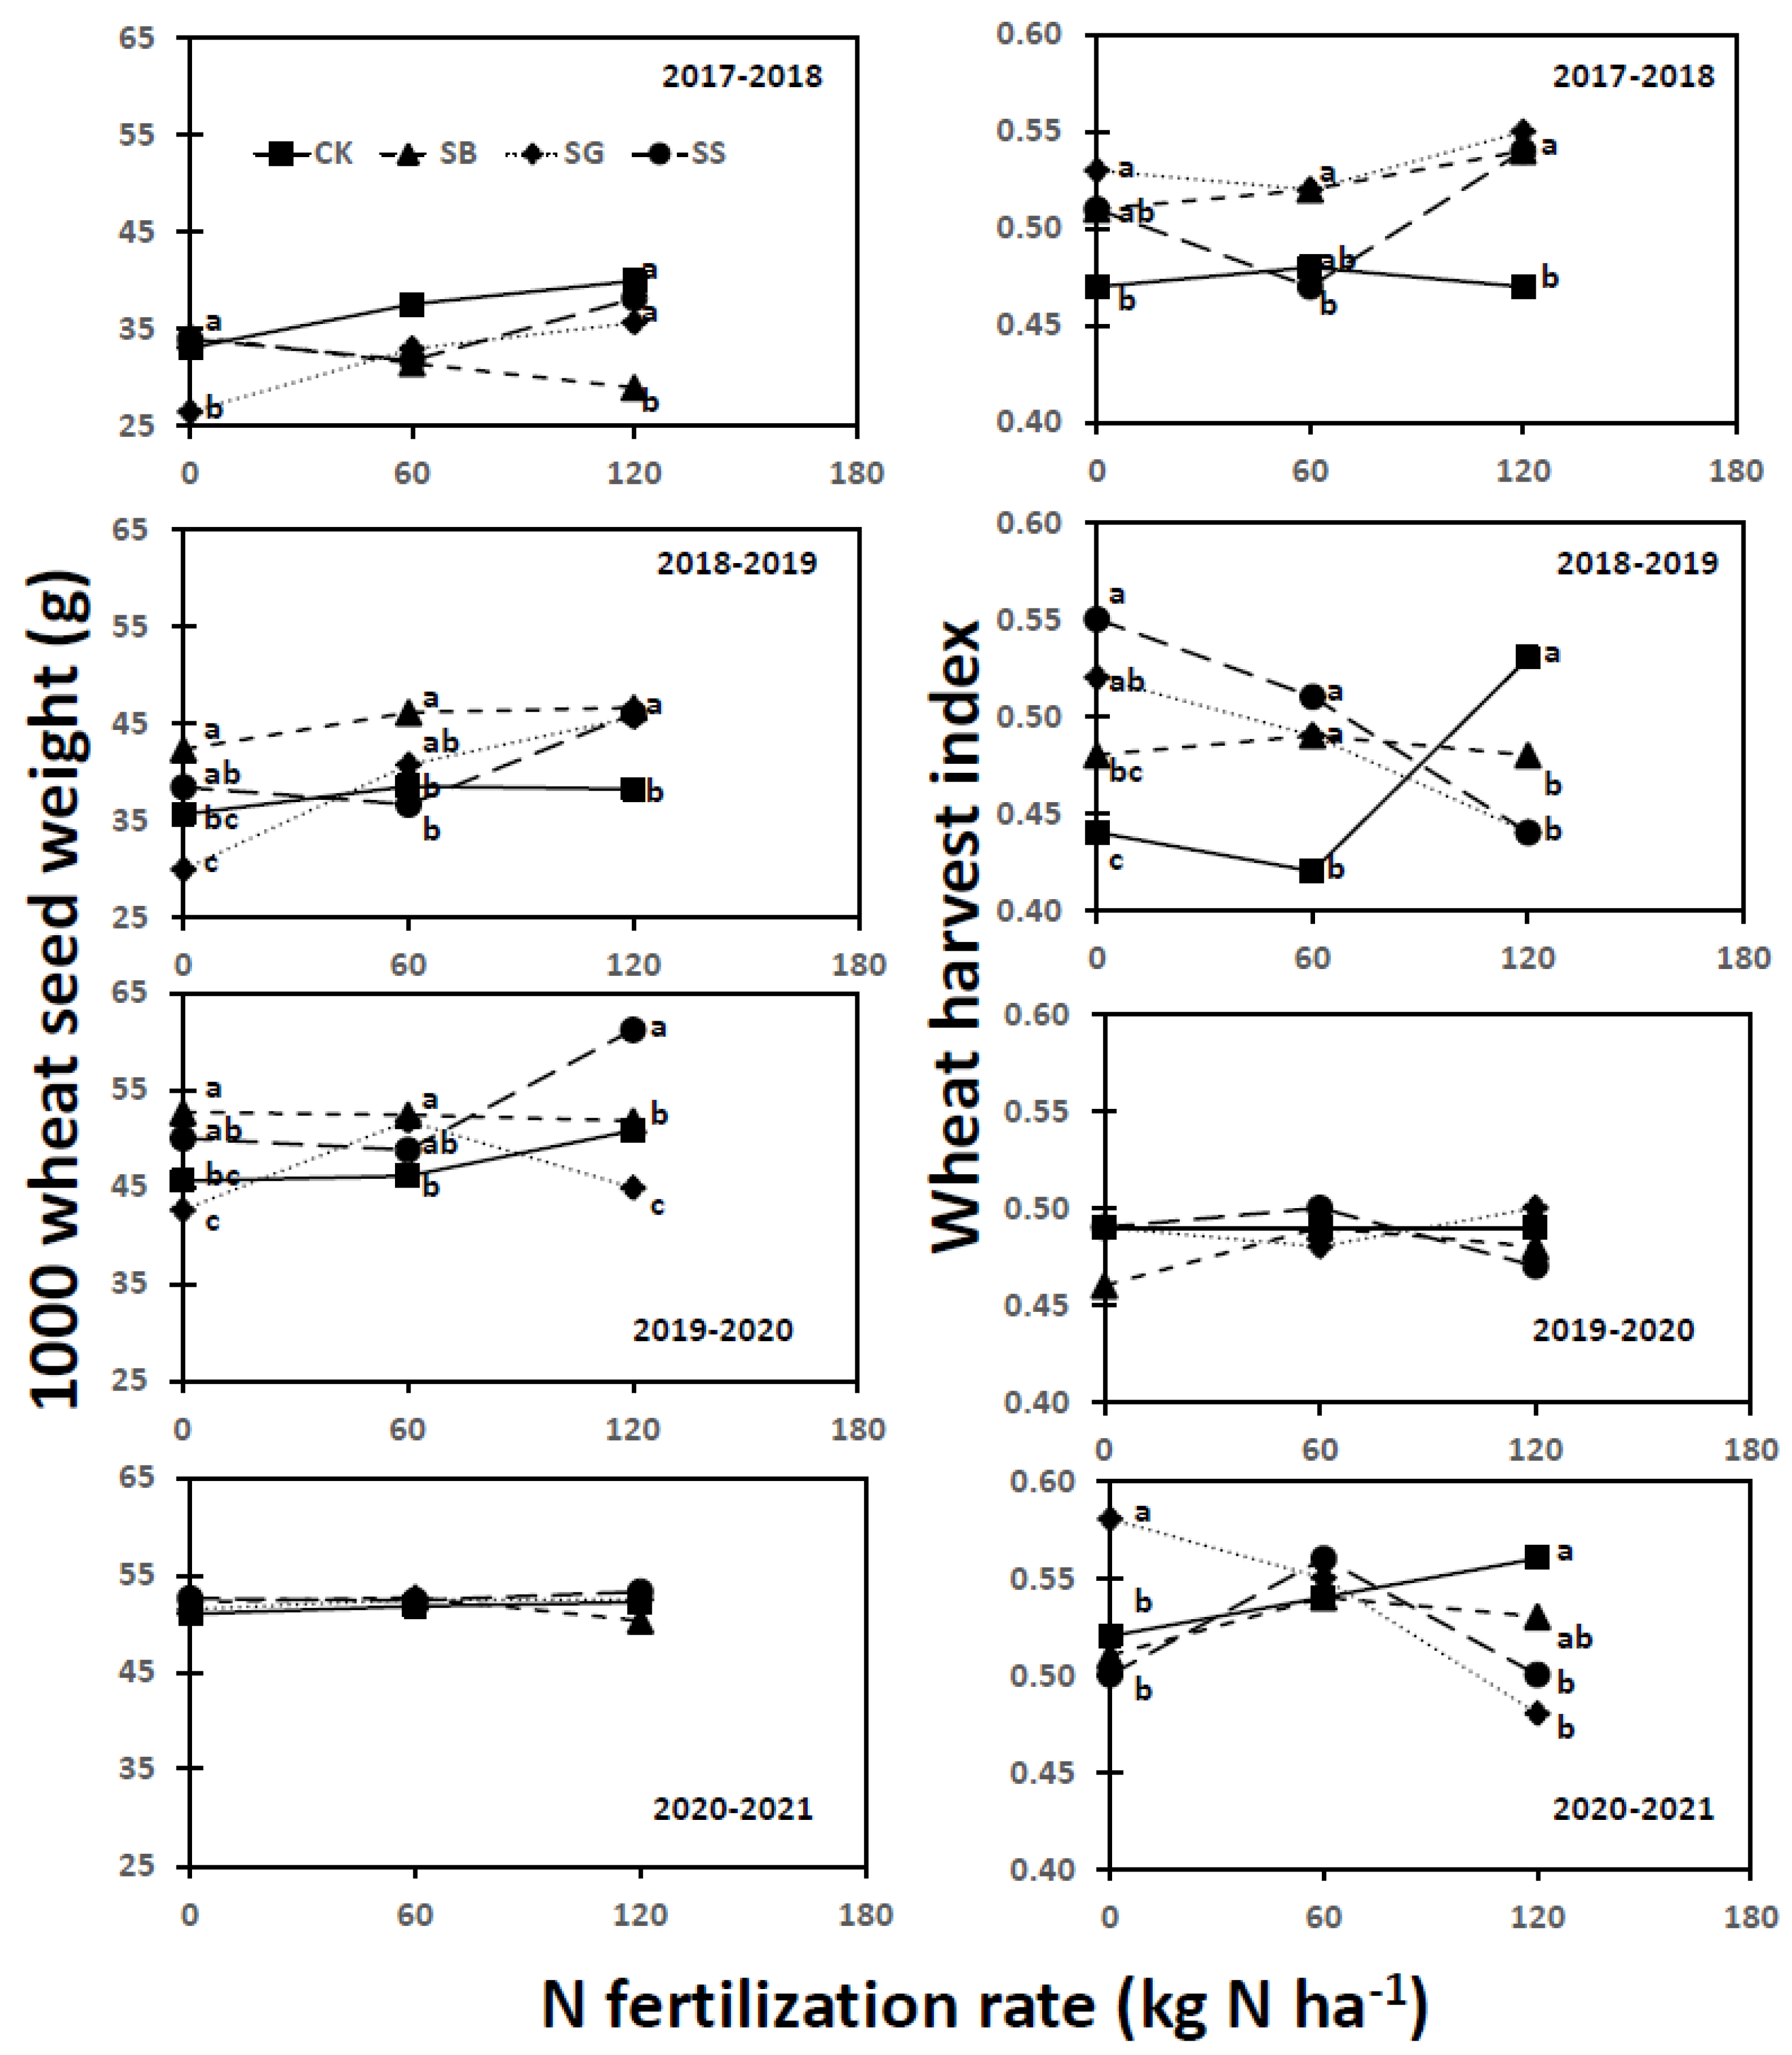
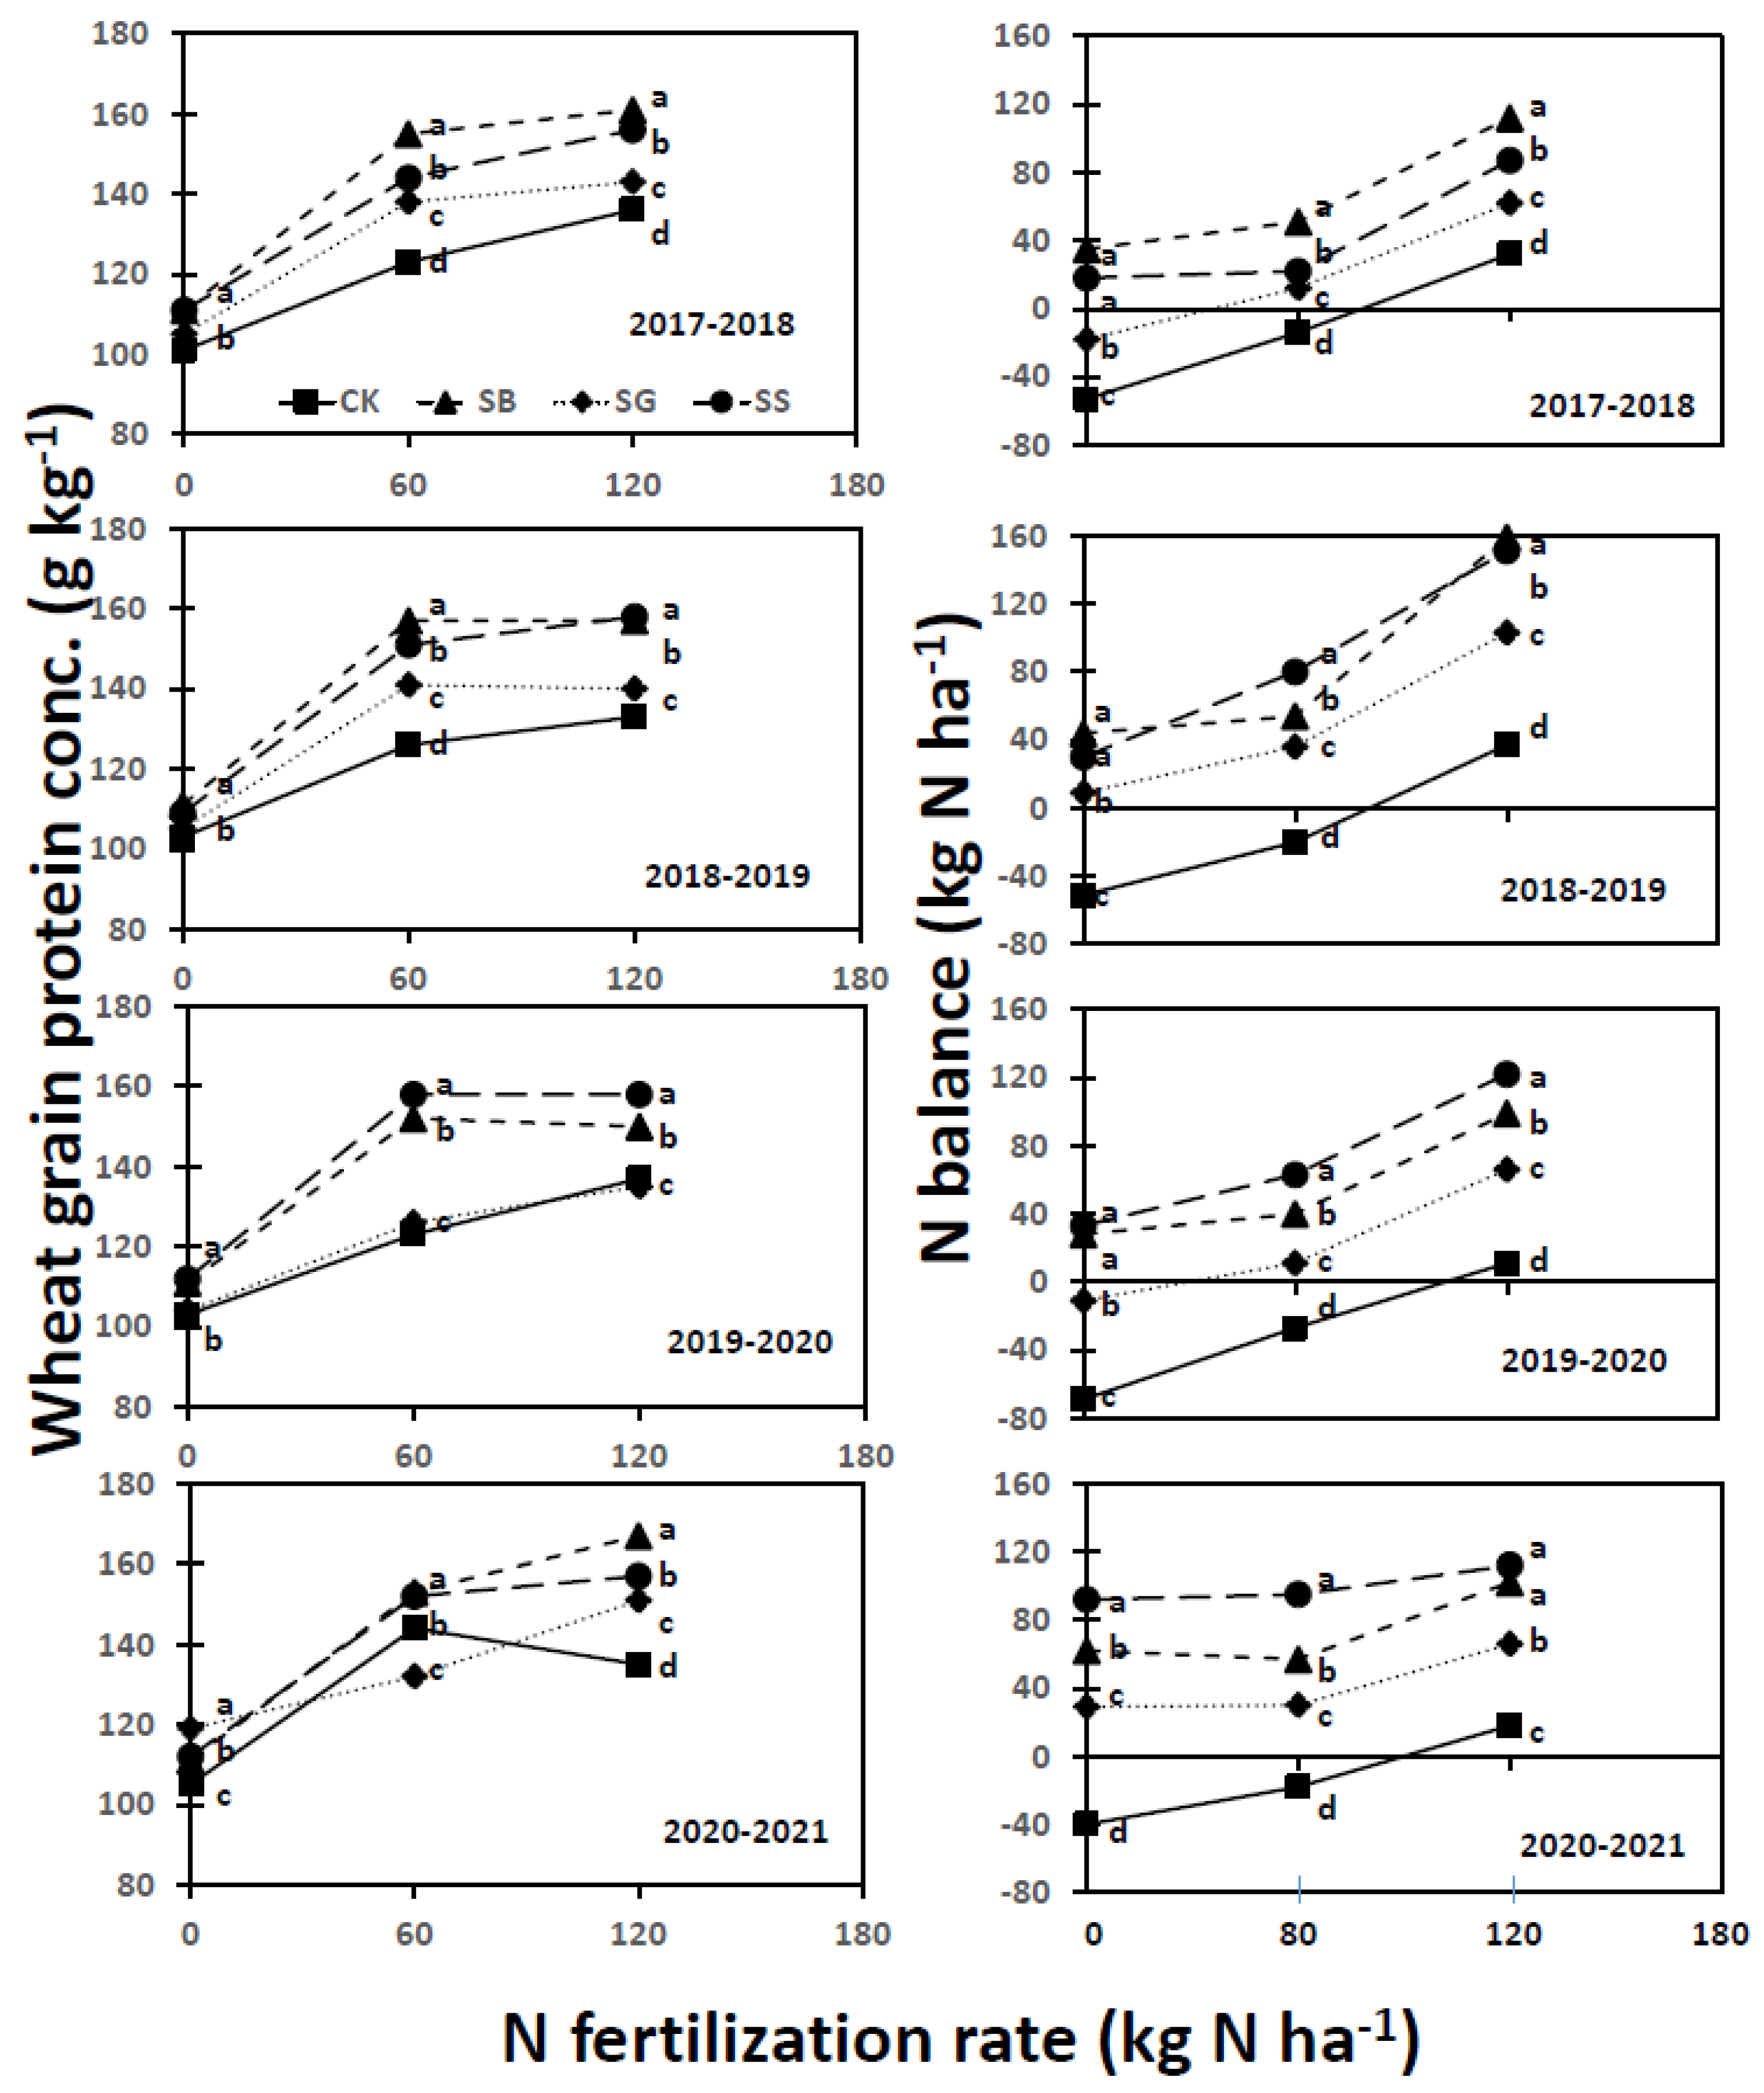
3.5. Winter Wheat Seed Weight, Protein Concentration, and Harvest Index

Cover crop, N fertilization rate, year, and their interactions significantly affected winter wheat 1000-seed weight and harvest index, except for the effects of N fertilization rate × year interaction for seed weight and cover crop and N fertilization rate for harvest index (Table 2). In 2017–2018, seed weight was greater for CK, SB, and SS than SG at 0 kg N ha−1 and greater for CK, SS, and SG than SB at 120 kg N ha−1 (Figure 4). In 2018–2019, seed weight was greater for SB than CK and SG at 0 kg N ha−1; greater for SB than CK and SS at 60 kg N ha−1; and greater for SB, SG, and SS than CK at 120 kg N ha−1. In 2019–2020, seed weight was greater for SB than SG and CK at 0 kg N ha−1, greater for SB than CK at 60 kg N ha−1, and greater for SS than other cover crops at 120 kg N ha−1. Treatments did not affect seed weight in 2020–2021. Increasing N fertilization rate increased seed weight for CK and SG in 2017–2018 and for SG in 2018–2019 but decreased for SB in 2017–2018. Averaged across treatments, seed weight was lower in 2017–2018 than other years.
The wheat harvest index was greater for SG than CK at 0 kg N ha−1; greater for SB and SG than SS and CK at 60 kg N ha−1; and greater for SB, SG, and SS than CK at 120 kg N ha−1 in 2017–2018 (Figure 4). In 2018–2019, the harvest index was greater for SS than SB and CK at 0 kg N ha−1 and greater for SB, SG, and SS than CK at 60 kg N ha−1 but was greater for CK than other cover crops at 120 kg N ha−1. In 2020–2021, the harvest index was greater for SG than other cover crops at 0 kg N ha−1 but was greater for CK than SS and SG at 120 kg N ha−1. Increasing N fertilization rate increased harvest index for SB in 2017–2018 and for CK in 2020–2021 but decreased for SS and SG in 2018–2019 and for SG in 2020–2021.
Wheat protein concentration was also affected by cover crop, N fertilization rate, year, cover crop × N fertilization rate, cover crop × year, N fertilization rate × year, and cover crop × N fertilization rate × year (Table 3). Protein concentration usually increased with increasing N fertilization rate for all cover crops in all years, except for SB and SG in 2018–2019, for SS and SB in 2019–2020, and for CK in 2020–2021 (Figure 5). In 2017–2018, 2018–2019, and 2019–2020, protein concentration was greater for SB and SS than SG and CK at all N fertilization rates. In 2020–2021, protein concentration was greater for SG than other cover crops at 0 kg N ha−1 but was greater for SS and SB than SG and CK at 60 and 120 kg N ha−1.

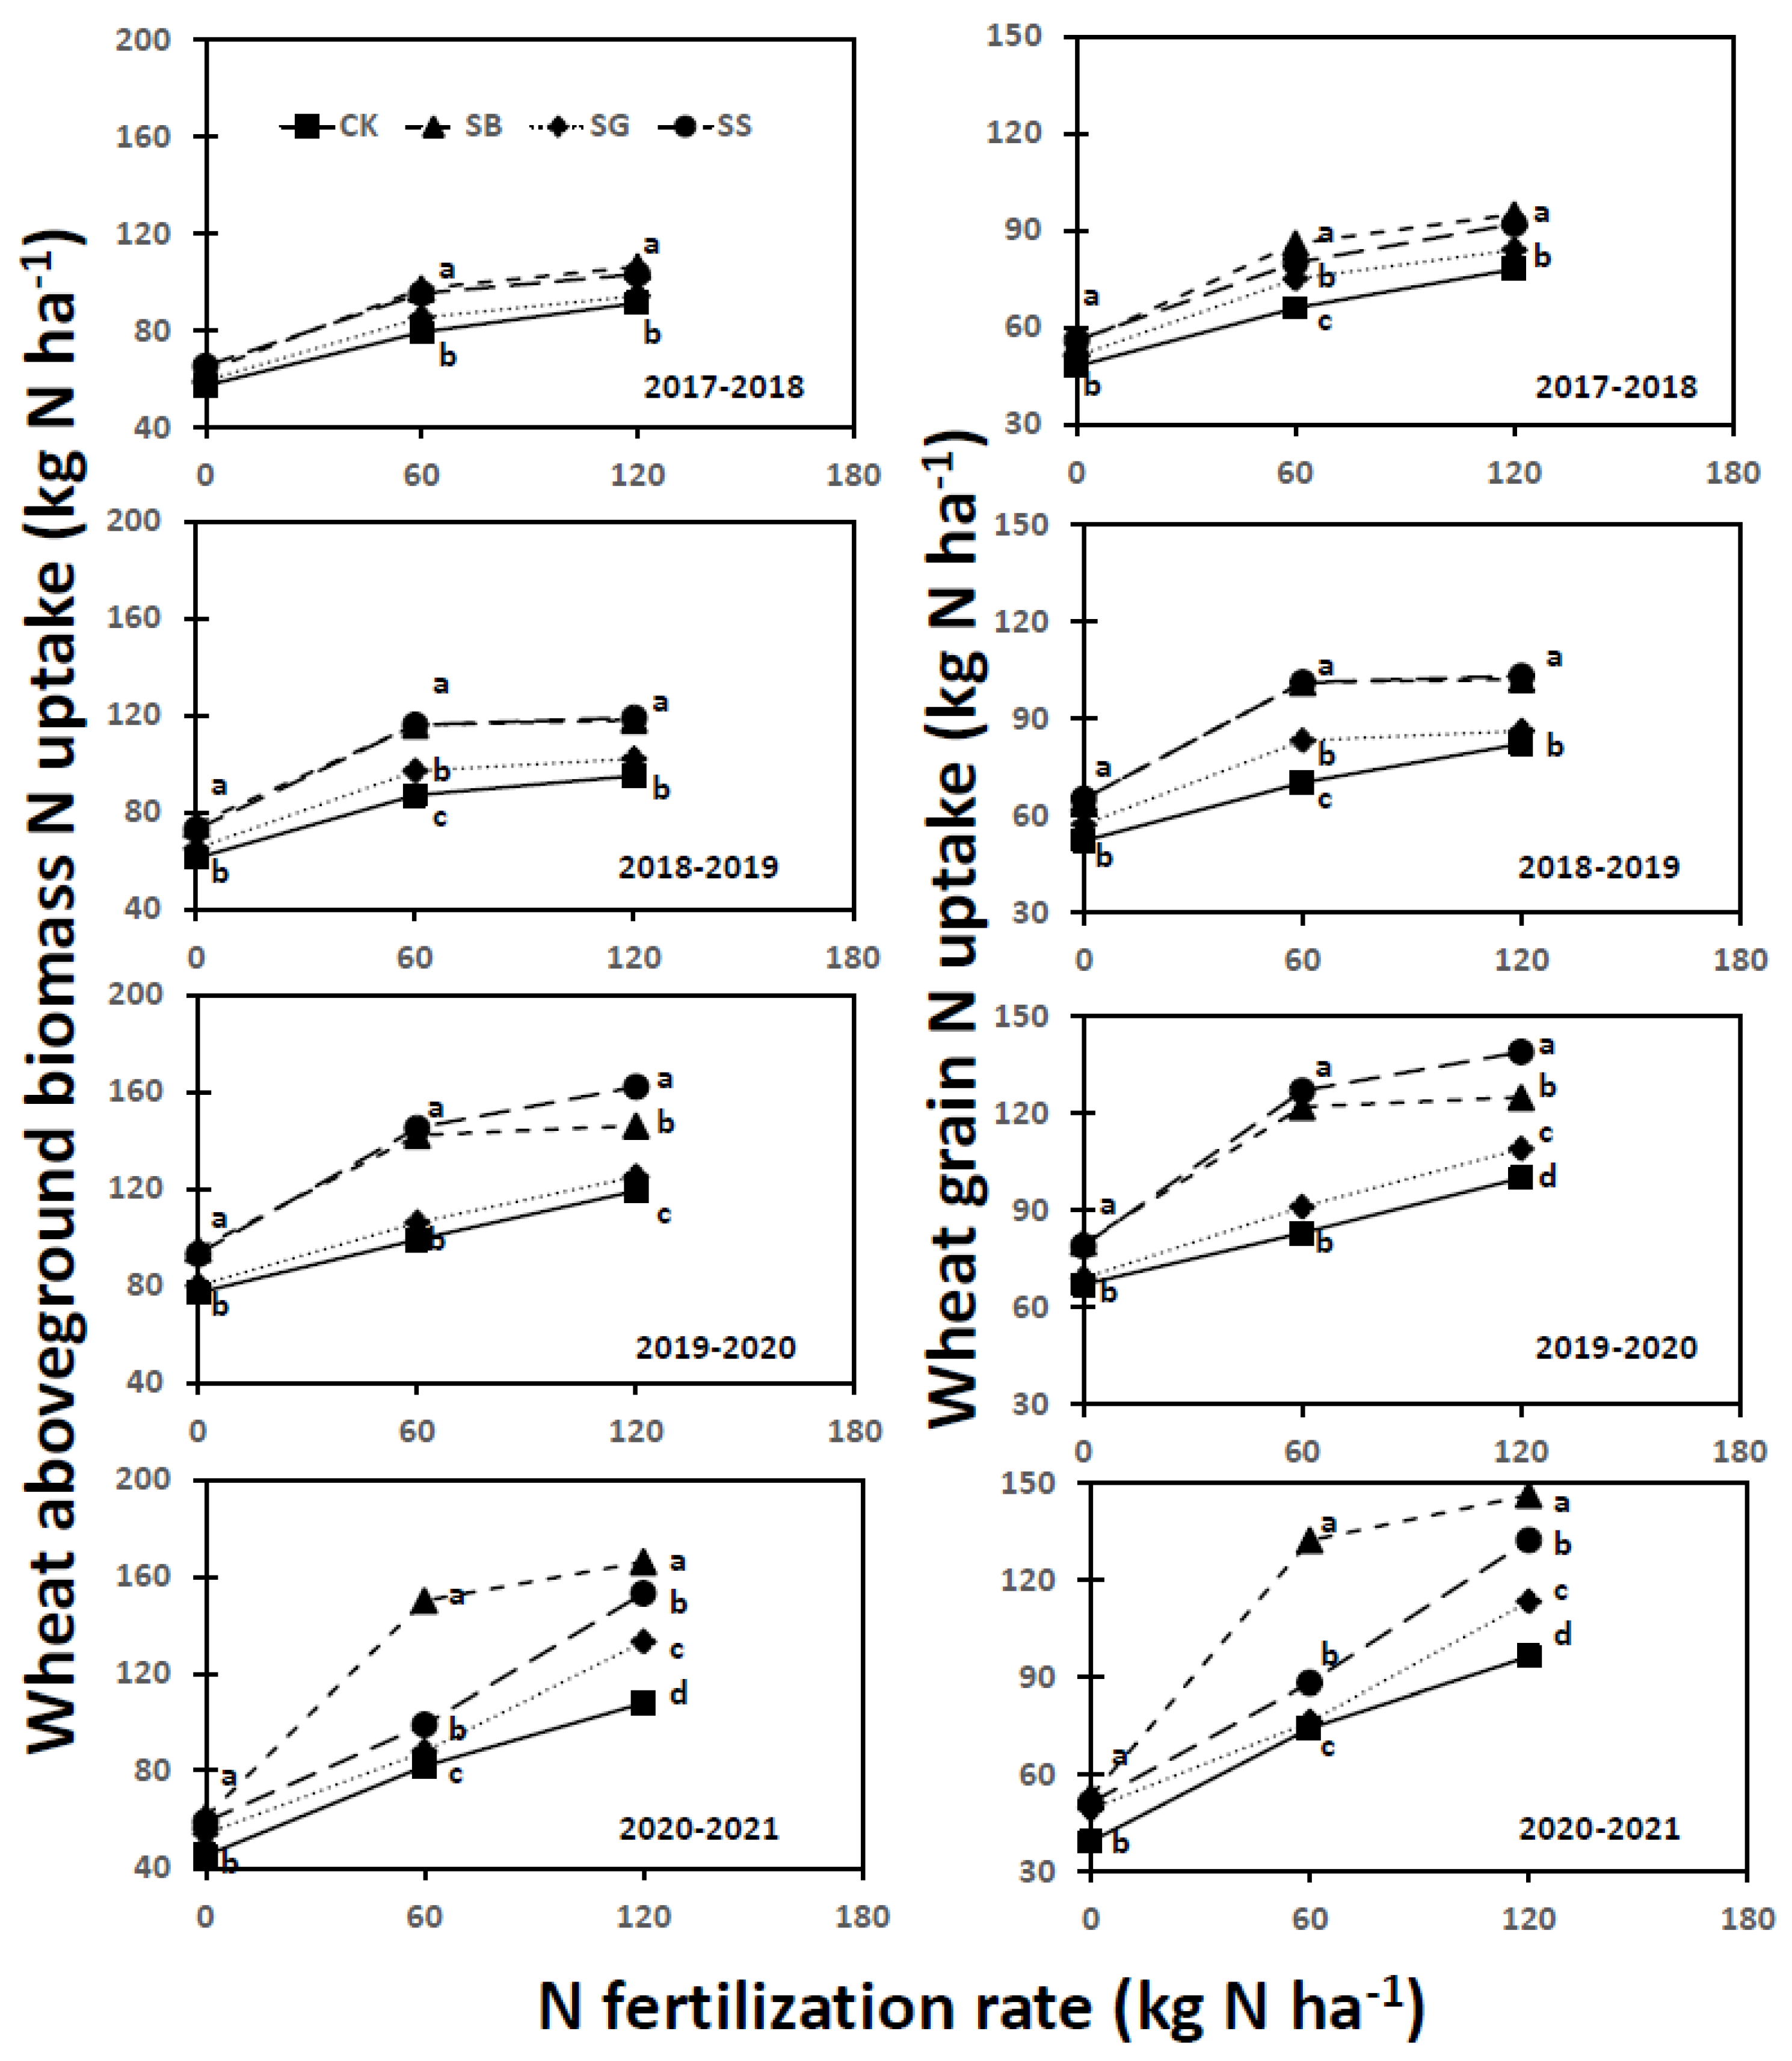
3.6. Winter Wheat Aboveground Biomass and Grain Nitrogen Uptake

Cover crop biomass, N fertilization rate, year, and their interactions significantly affected winter wheat aboveground biomass and grain N uptake (Table 3). Aboveground biomass N uptake was greater for SB and SS than SG and CK at all N fertilization rates in all years, except for cover crops at 0 kg N ha−1 in 2017–2018 and 2020–2021 (Figure 6). Increasing N fertilization rate increased aboveground biomass N uptake for all cover crops in all years, except for SB in 2019–2020. Averaged across treatments, aboveground biomass N uptake was lower in 2017–2018 and 2018–2019 than other years.
Wheat grain N uptake also increased with increasing N fertilization rate for all cover crops in all years, except for SB and SS in 2018–2019 and for SB in 2019–2020, which remained constant from 60 to 120 kg N ha−1 (Figure 6). Grain N uptake was greater for SB and SS than SG and CK at all N fertilization rates from 2017–2018 to 2019–2020, a case similar to that observed for aboveground biomass N uptake. In 2020–2021, grain N uptake was greater for SB, SS, and SG than CK at 0 kg N ha−1 and greater for SB and SS than SG and CK at 60 and 120 kg N ha−1. Similar to aboveground biomass N uptake, grain N uptake, averaged across treatments, remained lower in 2017–2018 and 2018–2019 than other years.

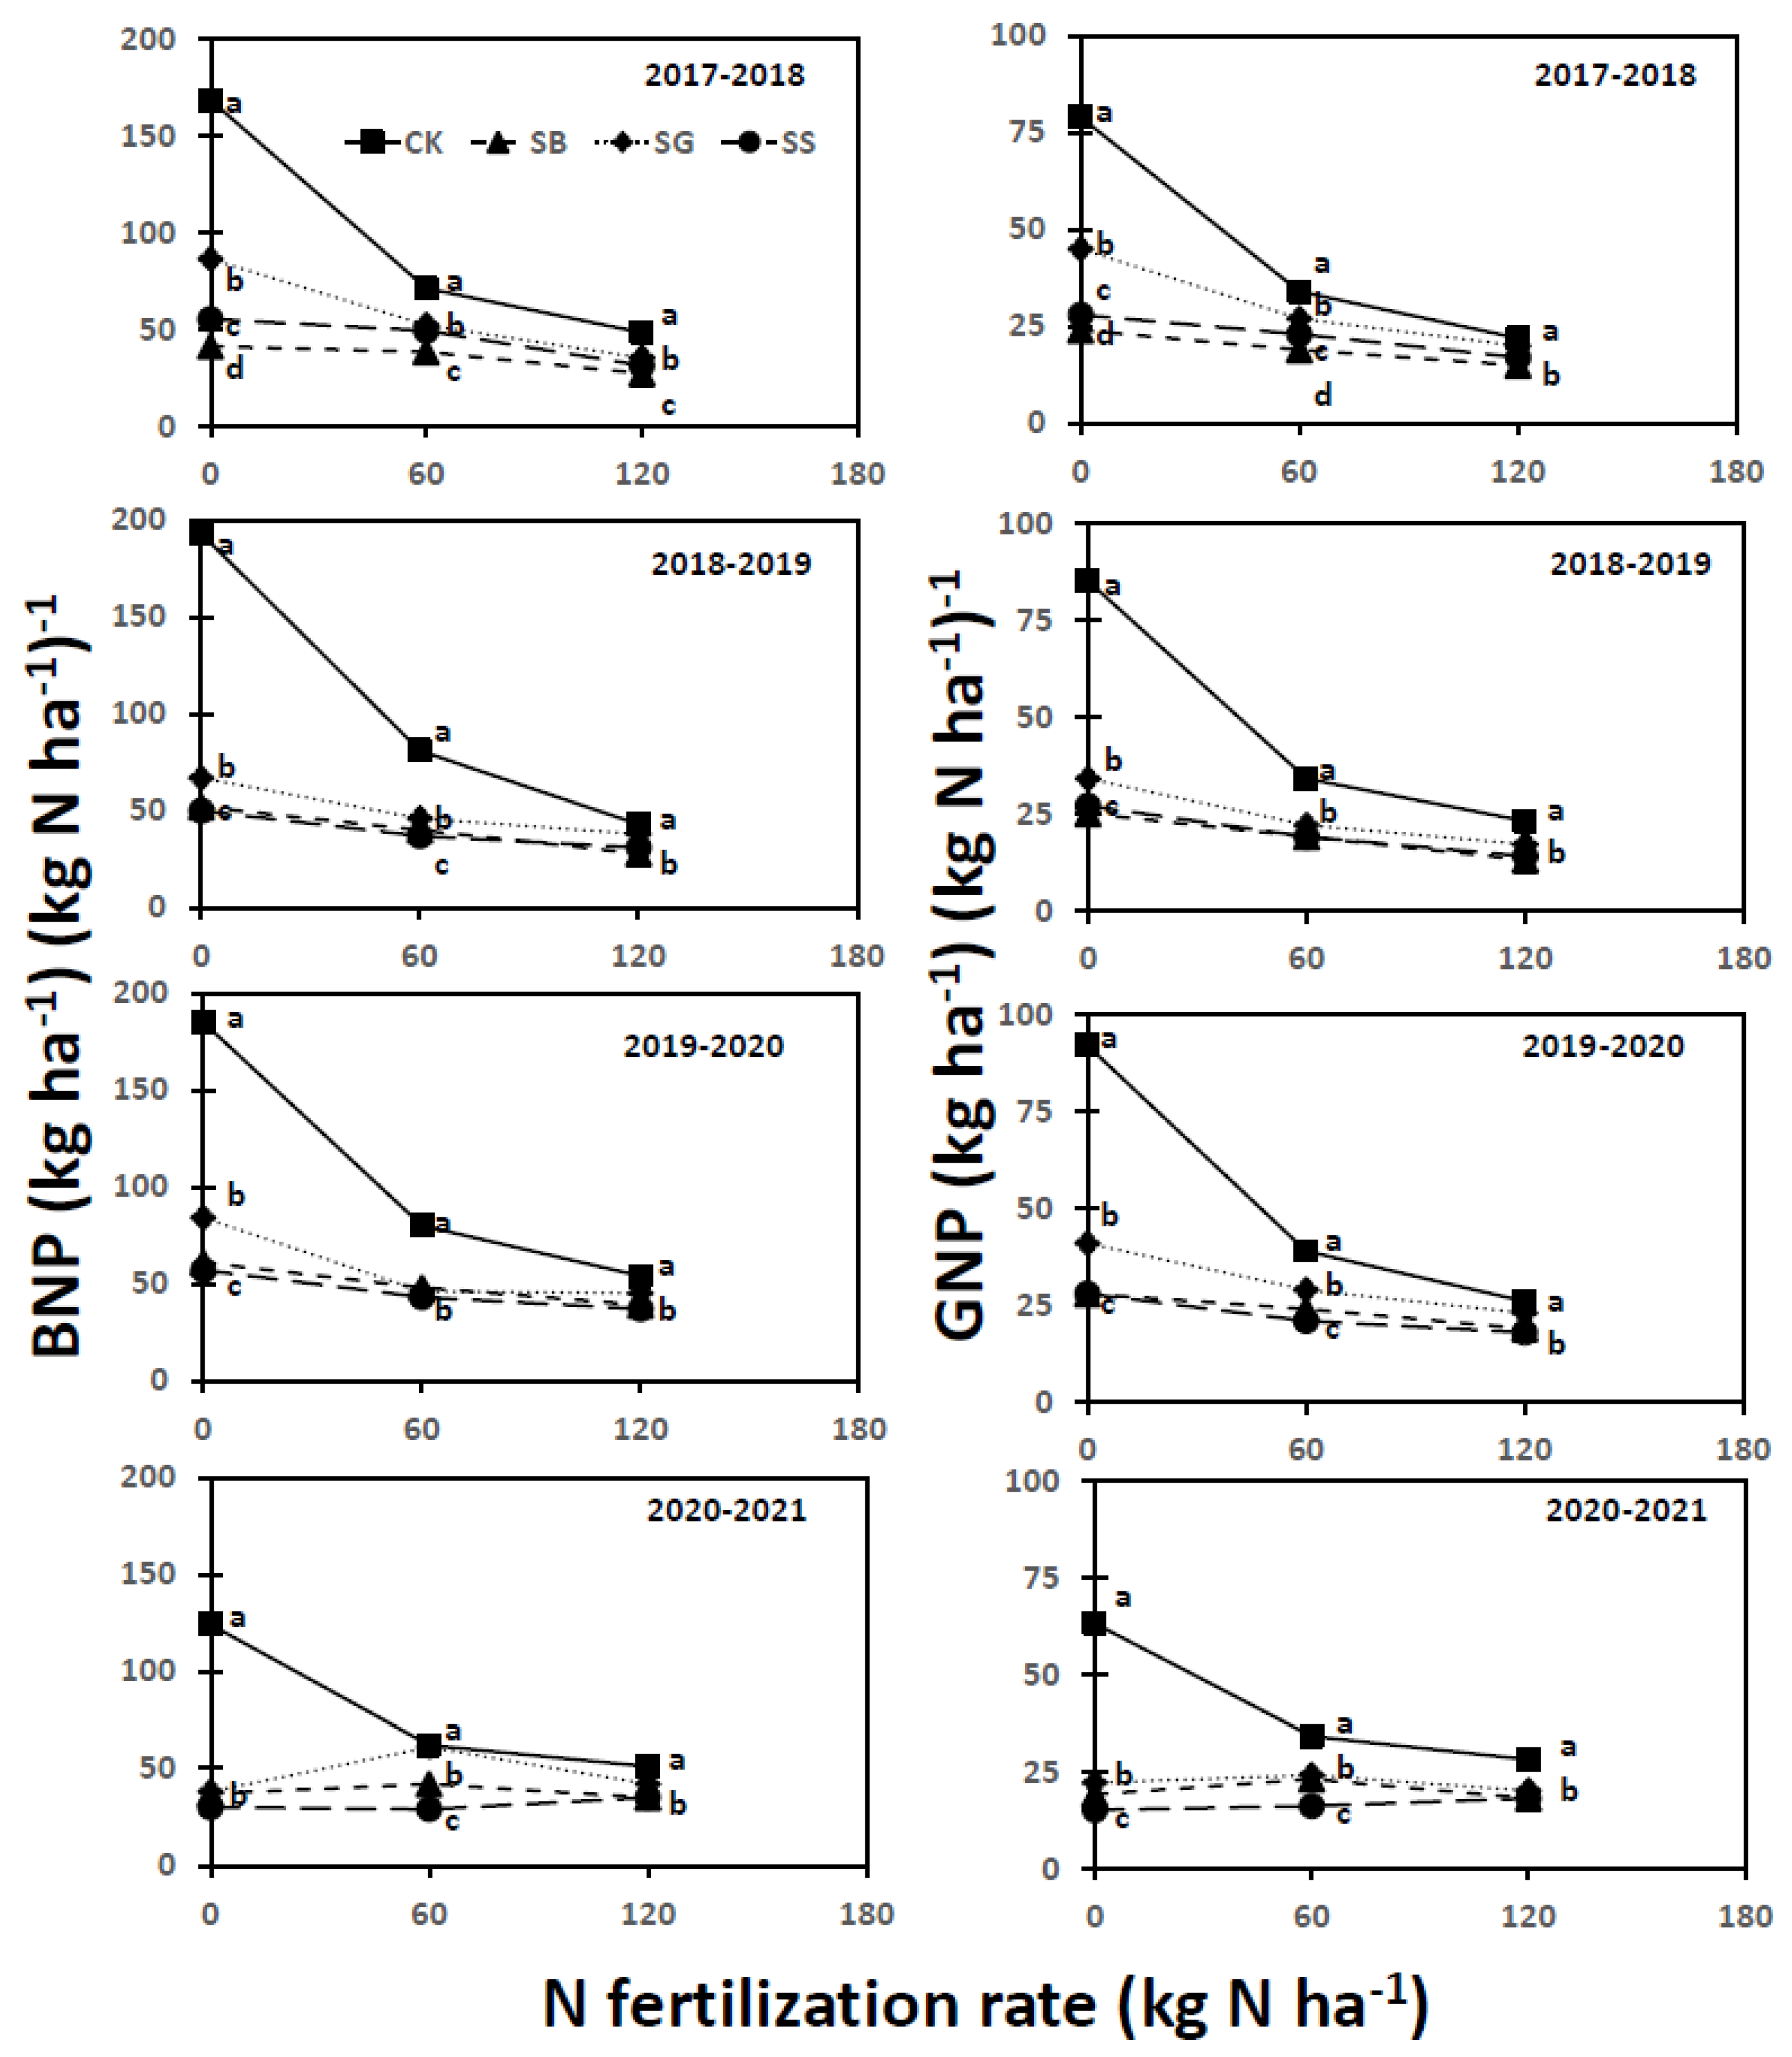
3.7. Winter Wheat Aboveground Biomass and Grain Nitrogen Productivity

The BNP and GNP were significantly affected by cover crop, N fertilization rate, year, and their interactions (Table 3). The BNP was greater for CK than SB, SS, and SG at 0 and 60 kg N ha−1 from 2017–2018 to 2019–2020 (Figure 7). At 120 kg N ha−1, BNP was greater for CK than SB, SS, and SG in 2017–2018 and greater than SB and SS in 2018–2019 and 2019–2020. In 2020–2021, BNP was greater for CK than other cover crops at 0 kg N ha−1, greater for CK and SG than SB and SS at 60 kg N ha−1, and greater for CK than SB and SS at 120 kg N ha−1. Increasing N fertilization rate decreased BNP for all cover crops and years, except for SG in 2019–2020 and for SG, SB and SS in 2020–2021. Averaged across treatments, BNP was lower in 2020–2021 than other years.
The GNP also declined with increasing N fertilization rate for all cover crops in all years, except for SB, SS, and SG in 2020–2021, which remained constant at 0, 60, and 120 kg N ha−1 (Figure 7). The GNP was greater for CK than other cover crops at 0 and 60 kg N ha−1 in all years and at 120 kg N ha−1 in 2018–2019 and 2020–2021. In 2017–2018 and 2019–2020, GNP was greater for CK than SS and SB at 120 kg N ha−1. Similar to BNP, GNP, averaged across treatments, was lower in 2020–2021 than other years.

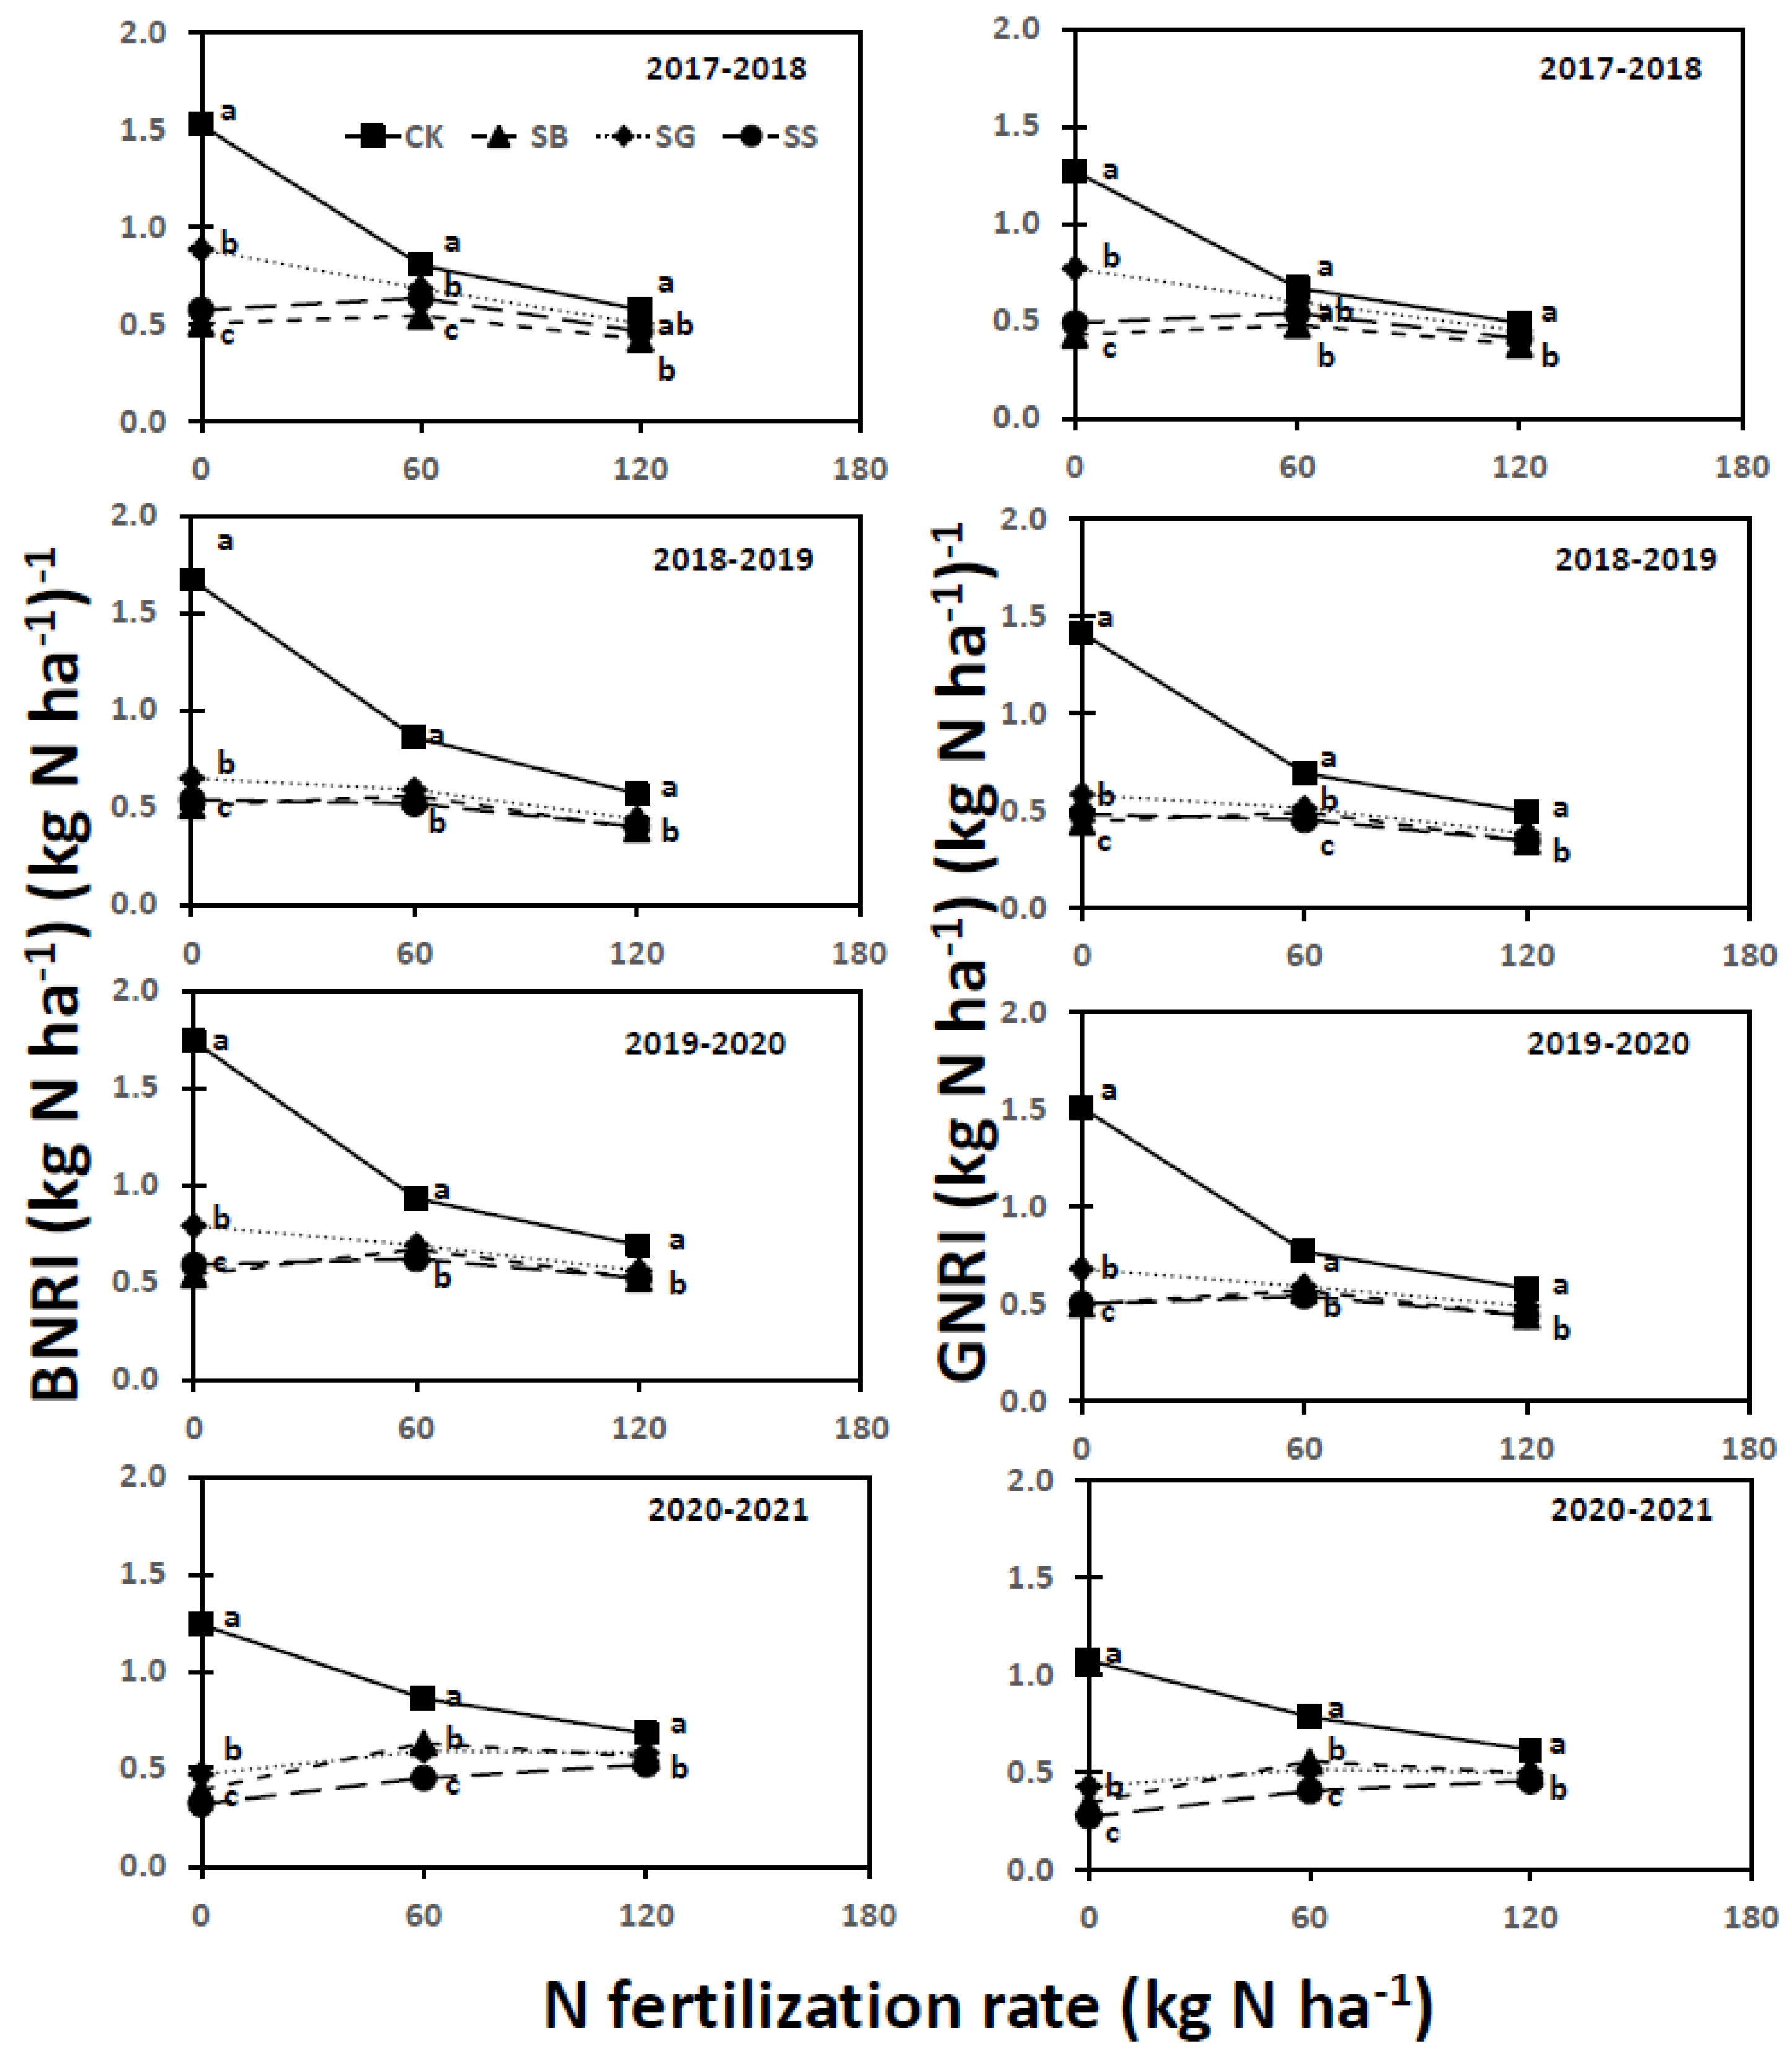
3.8. Winter Wheat Aboveground Biomass and Grain Nitrogen Recovery Indices

The BNRI and GNRI were also significantly affected by cover crop, N fertilization rate, year, and their interactions (Table 3). The BNRI was greater for CK than other cover crops at all N fertilization rates in all years, except for cover crops at 120 kg N ha−1 in 2017–2018, where BNRI was greater for CK than SB (Figure 8). Increasing N fertilization rate decreased BNRI for CK in all years and for SG from 2017–2018 to 2019–2020. The BNRI increased from 0 to 60 kg N ha−1 and then either declined or remained similar for SB and SS in all years. Averaged across treatments, BNRI was lower in 2020–2021 than other years.
The GNRI was greater for CK than other cover crops at 0 kg N ha−1 in 2017–2018 and greater at all N fertilization rates from 2018–2019 to 2020–2021 (Figure 8). In 2017–2018, GNRI was greater for CK than SB at 60 and 120 kg N ha−1. Increasing N fertilization rate decreased GNRI for CK in all years and for SG from 2017–2018 to 2019–2020 but increased for SS in 2020–2021. Averaged across treatments, GNRI was lower in 2020–2021 than other years.

3.9. Nitrogen Balance

Nitrogen balance was also significantly affected by cover crop, N fertilization rate, year, and their interactions (Table 3). Nitrogen balance was greater for SB and SS than SG and CK at 0 kg N ha−1 and greater for SB than other cover crops at 60 and 120 kg N ha−1 in 2017–2018 and 2019–2020 (Figure 5). In 2018–2019, N balance was greater for SB and SS than SG and CK at 0 and 120 kg N ha−1 and greater for SB than other cover crops at 60 kg N ha−1. In 2020–2021, N balance was greater for SS than other cover crops at 0 and 60 kg N ha−1 and greater for SS and SB than SG and CK at 120 kg N ha−1. Increasing N fertilization rate increased N balance for all cover crops in all years. Averaged across treatments, N balance was lower in 2017–2018 than other years. Nitrogen balance remained negative for SG at 0 kg N ha−1 in 2017–2018 and 2019–2020 and for CK at 0 and 60 kg N ha−1 in all years.

4. Discussion

4.1. Cover Crop Biomass and Nitrogen Accumulation

The lower cover crop biomass for SB than SG at most N fertilization rates and years (Figure 1) was probably due to the inability of legumes to produce greater biomass [29,30,31]. Legumes usually do not respond to soil mineral N, as they fix N from the soil, and maximum N fixation occurs when soil mineral N is low [30,31]. This may explain the variability of cover crop biomass for SB with increasing N fertilization rate in most years. However, nonlegumes respond to N fertilization in increasing their biomass [30,31], which is probably the reason for increased cover crop biomass for SG with increasing N fertilization rate in most years.
The greater cover crop biomass for SS than SB and SG at most N fertilization rates and years was likely due to the mutual benefit of legume and nonlegume in the mixture. Legumes transfer N fixed from atmosphere to nonlegumes, while nonlegumes provide physical support to legumes, resulting in increased biomass production of nonlegumes in the mixture compared to monoculture [32,33]. This enhances overall cover crop biomass production in the mixture compared to monocultures [32,33]. Variable response of cover crop biomass for SS with increasing N fertilization rate was due to different responses of SB and SG to N fertilization as stated above.
Increased cover crop N concentration, followed by greater biomass production may have increased cover crop N accumulation for SB and SG compared to SS and CK at all N fertilization rates and years (Figure 1). Nitrogen concentrations in cover crops, averaged across treatments and years, were 32.4, 12.8, and 22.4 g N kg−1 for SB, SG, and SS, respectively. While increasing N concentration increased cover crop N accumulation for SB, greater cover crop biomass and N concentration increased cover crop N accumulation for SS. The variable trend of cover crop biomass may have resulted in cover crop N accumulation differently to N fertilization for SB, but increased cover crop biomass probably enhanced cover crop N accumulation for SG and SS to N fertilization in most years. Lower cover crop growing season precipitation in 2017–2018 than in other years and the 30-year average (Table 1) likely resulted in decreased cover crop biomass yield and N accumulation in this year.

4.2. Soil Mineral Nitrogen

Increased N supplied by cover crop residue (Figure 1) may have increased soil mineral N at winter wheat planting for SB and SS at most N fertilization rates and years (Figure 2). This was especially true at 0 kg N ha−1, where soil mineral N for these cover crops was similar to or greater than at 60 and 120 kg N ha−1. Legume cover crop residues mineralize more rapidly than nonlegume residues because of their lower C/N ratio, thereby enriching soil mineral N with legume residues [34]. As a result, SB also maintained higher mineral N than other cover crops at 60 and 120 kg N ha−1 in most years. As soil samples were collected prior to N fertilization for wheat, the effect of N fertilization on soil mineral N at wheat planting was not evident at 60 and 120 kg N ha−1 for all cover crops in all years, except in 2019–2020, when increased cover crop growing precipitation (Table 1) may have mineralized cover crop residue and soil organic matter, thereby increasing mineral N from 60 to 120 kg N ha−1 for all cover crops.
Differences in cover crop N supply, soil mineral N at wheat planting, N fertilization rates, and N uptake by wheat may have affected soil mineral N at winter wheat harvest among cover crops and N fertilization rates in various years (Figure 2). Greater soil mineral N for SB and SS than other cover crops at 0 kg N ha−1 in all years was likely due to increased N supplied by cover crop residues and soil mineral N at wheat planting with these cover crops. In contrast, lower soil mineral N for SG and SS at 60 and 120 kg N ha−1 was likely due to increased N removal by wheat for increasing winter wheat yield and N uptake (Figure 3 and Figure 6). Increased soil mineral N for CK at most N fertilization rates and years, however, may have occurred from lower wheat yield and N uptake. Lower N supplied by cover crop residues (Figure 1) may have reduced soil mineral N at wheat harvest in 2017–2018 than other years. In contrast, increased N uptake by wheat (Figure 3 and Figure 6) may have reduced soil mineral N at wheat harvest in 2020–2021.

4.3. Winter Wheat Yield, Harvest Index, Seed Weight, and Protein Concentration

Increased N supplied by cover crop residue may have increased winter wheat aboveground biomass and grain yields for SB and SS at most N fertilization rates from 2018–2019 to 2020–2021 (Figure 3). Some researchers [12,35,36] have reported that succeeding crop yields increased with legumes and the mixtures of legumes and nonlegumes cover crops compared to nonlegumes and no cover crop. Increasing N fertilization rate usually had a favorable effect on enhancing wheat aboveground biomass and grain yields for most cover crops and years, probably due to increased N availability. This is similar to those reported by various researchers [34,35,36] who observed increased winter wheat yield with increasing N fertilization rate. However, the nonsignificant difference in wheat aboveground biomass and grain yields between 60 and 120 kg N ha−1 for SB in 2020–2021 was probably due to increased N compensation by soybean residue due to its greater mineralization rate during the year with higher wheat growing season precipitation (Table 1). Because SB produces lower crop residues that are not effective in controlling soil erosion [2,6] and wheat yield is almost similar between SB and SS at most N fertilization rates and years (Figure 3), SS would be preferable to sustain winter wheat yield and control soil erosion in the Loess Plateau of China. Furthermore, as wheat yield increased with increasing N fertilization rate, SS with 120 kg N ha−1 may be used to enhance winter wheat yield and support other ecosystem services. Lower N supplied by cover crop residue (Figure 1) reduced wheat aboveground biomass and grain yields in 2017–2018 than other years.
Absence or reduction in N supplied by cover crop residue likely resulted in heavier seeds for CK and SG at most N rates from 2017–2018 to 2019–2020 (Figure 4). It is possible that reduced N availability decreased wheat yield which may have increased soil water content and therefore heavier seeds for CK and SG. Several researchers [37,38] have shown that increased soil water availability increases spring wheat seed weight in the semiarid region. The response of seed weight to N fertilization rate was minimal for most cover crops and years. The reasons for lower seed weight in 2017–2018 than other years were not known.
Increased grain yield relative to aboveground biomass yield may have increased harvest index for SG compared to other cover crops at all N fertilization rates in 2017–2018 and at 0 kg N ha−1 in 2020–21 (Figure 4). Similarly, greater grain yield than aboveground biomass yield may have increased harvest index for SB, SG, and SS than CK at 60 kg N ha−1 in 2018–2019 and for CK at 120 kg N ha−1 in 2018–2019 and 2020–2021. Variations in grain yield relative to aboveground biomass may have resulted in different trends of harvest index with increasing N fertilization rates in various years.
Increased N supplied by cover crop residue and enhanced soil mineral N at wheat planting (Figure 1 and Figure 2) certainly increased wheat protein concentration for SB and SS compared to other cover crops at all N fertilization rates and years (Figure 5). Similarly, greater available N due to increasing N fertilization rate increased protein concentration for most cover crops and all years. Allen et al. [25] reported that increased soil N availability increased spring wheat protein concentration. Reduction in available N due to decreased N mineralization of cover crop residue and the inability of wheat to take applied N from N fertilizer during the years with below-average precipitation (Table 1) may have resulted in declining trends of protein concentration at 60 and 120 kg N ha−1 for SB in 2018–2019 and for SB and SS in 2019–2020.

4.4. Winter Wheat Aboveground Biomass and Grain Nitrogen Uptake

Increased wheat aboveground biomass and grain yields, followed by higher N concentrations, likely increased winter wheat aboveground biomass and grain N uptake for SB and SS at all N fertilization rates and years (Figure 6). Wheat aboveground biomass and grain yields were usually greater for SB and SS than SG and CK at most N fertilization rates and years (Figure 3). Nitrogen concentrations in wheat aboveground biomass, averaged across treatments and years, were 11.3, 13.1, 12.0, and 13.0 g N kg−1 for CK, SB, SG, and SS, respectively. Similarly, N concentrations in wheat grain, averaged across treatments and years, were 19.6, 22.6, 20.5, and 22.4 g N kg−1, respectively. As N uptake is the product of yield and N concentration, increased aboveground biomass and grain yields as well as their N concentrations benefited N uptake in both wheat aboveground biomass and grain. Our results are similar to those reported by various researchers [39,40,41] who have observed greater winter wheat N uptake with legumes and mixtures of legume and nonlegume cover crops than nonlegumes or no cover crop. Enhanced N availability may have increased aboveground biomass and grain N uptake with increasing N fertilization rates, regardless of cover crops and years. As with aboveground biomass and grain yield, SS with 120 kg N ha−1 can enhance N uptake in wheat aboveground biomass and grain. The lower aboveground biomass and grain N uptake in 2017–2018 and 2018–2019 than other years was due to lower aboveground biomass and grain yields in these years (Figure 3).

4.5. Winter Wheat Nitrogen Productivites and Recovery Indices

Lower wheat aboveground biomass and grain yields, followed by the absence of cover crop N, increased BNP and GNP for CK than other cover crops at all N fertilization rates and years (Figure 7). Although N was supplied by cover crop residue, lower cover crop N supply and soil mineral N and reduced aboveground biomass and grain yields increased BNP and GNP for SG compared to SB and SS at most N fertilization rates and years. In contrast, greater aboveground biomass and grain yields, followed by increased cover crop biomass N and soil mineral N, reduced BNP and GNP for SB and SS. As increasing N fertilization rate increased soil available N, BNP and GNP also decreased with increasing N rate for most cover crops and years, although N fertilization increased aboveground biomass and grain yields compared to no N fertilization. Exceptions occurred with BNP and GNP for SB, SG, and SS in 2020–2021 where similar or lower soil mineral N at wheat planting resulted in constant levels of BNP and GNP with increasing N fertilization rates. The increased aboveground biomass and grain yields relative to increasing fertilization N rates were not enough to maintain BNP and GNP. However, the rate of decline was slower from 60 to 120 kg N ha−1 than from 0 to 60 kg N ha−1.
The BNRI and GNRI also exhibited similar patterns as BNP and GNP with respect to treatments and years (Figure 8). The absence of cover crop N and lower soil mineral N, as well as aboveground biomass and grain N uptake, increased BNRI and GNRI for CK compared to other cover crops at all N fertilization rates and years. In contrast, greater aboveground biomass and grain N uptake and increased cover crop N contribution and soil mineral N reduced BNRI and GNRI for SB and SS. Enhanced N availability from increasing N fertilization rate decreased BNRI and GNRI in all cover crops and years, except for SB, SG, and SS in 2020–2021 where lower soil mineral N at wheat planting slightly increased BNRI and GNRI with increasing N fertilization rate.
The patterns of BNP, GNP, BNRI, and GNRI for cover crops with increasing N fertilization rates in all years (Figure 7 and Figure 8) suggest that these parameters declined more rapidly for CK where cover crop was absent compared to SB, SG, and SS, as N fertilization rate increased. The values of these parameters for CK reduced by more than 50% as N fertilization rate increased from 0 to 60 kg N ha−1 and to 65% as N fertilization rate further increased to 120 kg N ha−1. This was probably due to the inability of wheat to use N efficiently at higher N fertilization rates, as crops are able to use 50–60% of applied N from N fertilizers [42,43]. Nitrogen contribution from cover crops reduced the decline of BNP, GNP, BNRI, and GNRI for SB, SS, and SG compared to CK with increasing N fertilization rate. Therefore, cover crops may be able to maintain BNP, GNP, BNRI, and GNRI even at higher N fertilization rates. The BNRI and GNRI values >1.0 for CK at 0 kg N ha−1 suggest that N mineralized from soil organic matter during the wheat growing season may have resulted in N recovery for this treatment.

4.6. Nitrogen Balance

The greater N balance for SB and SS than SG and CK at all N fertilization rates and years (Figure 5) was due to increased cover crop N contribution and soil mineral N at wheat planting but lower soil mineral N at wheat harvest, although N removal in wheat aboveground biomass was higher. As cover crops will continue to supply N for three years [44,45,46] and N mineralization from soil organic matter as well as the accumulation of soil residual N will occur [42,43,46], the greater N balance for SB and SS will remain for several years unless substantial amount of soil N is lost to the environment through leaching, denitrification, and volatilization. Similarly, enhanced N availability from increasing N fertilization rate increased N balance for all cover crops and years, suggesting that N fertilization rate has an important implication for N balance because large quantity of soil mineral N remained after wheat harvest (Figure 2).
Negative N balance for SG and CK at 0 kg N ha−1 in 2017–2018 and 2019–2020 and for CK at 60 kg N ha−1 in all years occurred because N removed by wheat aboveground biomass and soil mineral N at wheat harvest were greater than N contributed by cover crop, N fertilizer, and soil mineral at wheat planting (Figure 1, Figure 2 and Figure 6). This suggests that a substantial portion of N supplied by mineralization of soil organic matter during the wheat growing season was probably removed by wheat aboveground biomass in these treatments which was not accounted for total N input in the calculation of N balance. Reduced annual precipitation likely reduced N inputs from cover crops and soil mineral N as well as N output as wheat N removal (Figure 1, Figure 2 and Figure 7), resulting in a lower N balance in 2017–2018 than other years.

5. Conclusions

The interaction of summer cover crop and N fertilization rate to wheat variably affected cover crop biomass and N accumulation, soil mineral N, winter wheat yield and quality, N uptake, N productivity, and N balance in various years. Cover crop biomass and N accumulation were greater for SB and SS than SG and CK. This resulted in increased soil mineral N at winter wheat planting, wheat aboveground biomass and grain yields, N uptake in these components, grain protein concentration, and N balance for SB and SS at higher N fertilization rates in most years. Increasing N fertilization rate increased wheat aboveground biomass and grain yields, protein concentration, N uptake, and N balance for most cover crops and years. However, increasing N fertilization rate decreased BNP, GNP, BNRI, and GNRI for cover crops, with larger decline for CK than other cover crops in all years. As SB produces less cover crop residue which mineralizes more rapidly due to higher N concentration than other cover crops and becomes less effective in controlling soil erosion, SS with 120 kg N ha−1 may be used to enhance winter wheat yield and quality, maintain N productivity, increase N balance, and support other ecosystem services in the Loess Plateau of China.

Author Contributions

J.W., methodology, resources, funding acquisition, data curation, project management, supervision, validation, writing and reviewing final manuscript; U.M.S., conceptualization, methodology, data curation and analysis, writing original manuscript, writing and editing final manuscript; S.Z., methodology, data curation, supervision, project management, writing initial manuscript. All authors have read and agreed to the published version of the manuscript.

Funding

The study was supported by the National Key Research and Development Program of China (2023YFE0122900), the National Natural Science Foundation of China (Grant No. 42277322), and the Shaanxi Agricultural Science & Technology Innovation-Driven Project (NYKJ-2021-XA-005).

Data Availability Statement

The original contributions presented in the study are included in this article, further inquiries can be directed to the corresponding author.

Acknowledgments

We highly appreciate the help and support provided by Mohammed Raza for collecting and analyzing soil and plant samples in the field and laboratory.

Conflicts of Interest

The author declares that there are no conflicts of interest and had no competing financial interests or personal relationships that could influence the work reported in the study.

Abbreviations

BNP, winter wheat aboveground biomass N productivity; BNRI, winter wheat aboveground biomass N recovery index; CK, no cover crop; GNP, winter wheat grain N productivity; and BNRI, winter wheat grain N recovery index; SB, soybean; SG, sudangrass; and SS, a mixture of soybean and sudangrass.

References

  1. Poeplau, C.; Don, A. Carbon sequestration in agricultural soils via cultivation of cover crops—A meta-analysis. Agric. Ecosyst. Environ. 2015, 200, 33–41. [Google Scholar] [CrossRef]
  2. Dabney, S.M.; Delgado, J.A.; Reeves, D.W. Using winter cover crops to improve soil and water quality. Commun. Soil Sci. Plant Anal. 2001, 32, 1221–1250. [Google Scholar] [CrossRef]
  3. Di, H.J.; Cameron, K.C. Nitrate leaching in temperate agroecosystems: Sources, factors, and mitigating strategies. Nutr. Cycl. Agroecosyst. 2002, 64, 237–256. [Google Scholar] [CrossRef]
  4. Gabriel, J.L.; Almendros, P.; Hontoria, C.; Quemada, M. The role of cover crops in irrigated systems: Soil salinity and salt leaching. Agric. Ecosyst. Environ. 2012, 158, 200–207. [Google Scholar] [CrossRef]
  5. Damien, M.; Le Lann, C.; Desneux, N.; Alford, L.; Al Hassan, D.; Georges, R.; Van Baaren, J. Flowering cover crops in winter increase pest control but not trophic link diversity. Agric. Ecosyst. Environ. 2017, 247, 418–425. [Google Scholar] [CrossRef]
  6. Kaspar, T.C.; Singer, J.W. The use of cover crops to manage soil. In Soil Management: Building a Stable Base for Agriculture; Hatfield, J.L., Sauer, T.J., Eds.; Soil Science Society of America: Madison, WI, USA, 2011; pp. 321–337. [Google Scholar]
  7. Thorup-Kristensen, K.; Magid, J.; Jensen, L.S. Catch crops and green manures as biological tools in nitrogen management in temperate zones. Adv. Agron. 2003, 79, 227–302. [Google Scholar]
  8. Finney, D.M.; White, C.M.; Kaye, J.P. Biomass production and carbon/nitrogen ratio influence ecosystem services from cover crop mixtures. Agron. J. 2016, 108, 39–52. [Google Scholar] [CrossRef]
  9. Lüscher, A.; Mueller-Harvey, I.; Soussana, J.F.; Rees, R.M.; Peyraud, J.L. Potential of legume-based grassland–livestock systems in Europe: A review. Grass Forage Sci. 2014, 69, 206–228. [Google Scholar] [CrossRef]
  10. Abdalla, M.; Hastings, A.; Cheng, K.; Yue, Q.; Chadwick, D.; Espenberg, M.; Truu, J.; Rees, R.M.; Smith, P. A critical review of the impacts of cover crops on nitrogen leaching, net greenhouse gas balance and crop productivity. Glob. Change Biol. 2019, 25, 2530–2543. [Google Scholar] [CrossRef]
  11. Wells, M.S.; Reberg-Horton, S.C.; Smith, A.N.; Grossman, J.M. The reduction of plant-available nitrogen by cover crop mulches and subsequent effects on soybean performance and weed interference. Agron. J. 2013, 105, 539–545. [Google Scholar] [CrossRef]
  12. Muhammad, I.; Wang, J.; Sainju, U.M.; Zhang, S.H.; Zhao, F.Z.; Khan, A. Cover cropping enhances soil microbial biomass and affects microbial community structure: A meta-analysis. Geoderma 2021, 381, 114696. [Google Scholar] [CrossRef]
  13. Hauggaard-Nielsen, H.; Ambus, P.; Jensen, E.S. Interspecific competition, N use, and interference with weeds in pea–barley intercropping. Field Crops Res. 2001, 70, 101–109. [Google Scholar] [CrossRef]
  14. Sainju, U.M.; Singh, H.P.; Singh, B.P.; Whitehead, W.F.; Chiluwal, W.; Paudel, R. Soil carbon and nitrogen under bioenergy forage sorghum influenced by cover crop and nitrogen fertilization. Agrosyst. Geosci. Environ. 2018, 1, 180004. [Google Scholar] [CrossRef]
  15. Rasmussen, J.; Søegaard, K.; Pirhofer-Walzl, K.; Eriksen, J. N2-fixation and residual N effect of four legume species and four companion grass species. Eur. J. Agron. 2012, 36, 66–74. [Google Scholar] [CrossRef]
  16. Tosti, G.; Benincasa, P.; Farneselli, M.; Pace, R.; Tei, F.; Gaiducci, M.; Thorup-Kistensen, K. Green manuring effect of pure and mixed barley–hairy vetch winter cover crops on maize and processing tomato N nutrition. Eur. J. Agron. 2012, 43, 136–146. [Google Scholar] [CrossRef]
  17. Dahlin, A.S.; Stenberg, M.; Marstorp, H.; Mulch, N. Recycling in green manure leys under Scandinavian conditions. Nutr. Cycl. Agroecosyst. 2011, 91, 119–129. [Google Scholar] [CrossRef]
  18. Pandey, A.; Li, F.; Askegaard, M.; Rasmussen, I.A.; Olesen, J.E. Nitrogen balances in organic and conventional arable crop rotations and their relations to nitrogen yield and nitrate leaching losses. Agric. Eecosyst. Environ. 2018, 265, 350–362. [Google Scholar] [CrossRef]
  19. Holmes, A.A.; Thompson, A.A.; Lovell, S.T.; Villamil, M.B.; Yanarell, A.C.; Dawson, J.; Wortman, S.E. Nitrogen provisioned and recycled by cover crops in monoculture and mixture across two organic farms. Nutr. Cycl. Agroecosyst. 2019, 115, 441–453. [Google Scholar] [CrossRef]
  20. Clark, A.J.; Decker, A.M.; Meisinger, J.J. Seeding rate and kill date effects on hairy vetch-cereal rye cover crop mixtures for corn production. Agron. J. 1994, 86, 1065–1070. [Google Scholar] [CrossRef]
  21. Sainju, U.M.; Ghimire, R.; Pradhan, G.P. Improving dryland cropping system nitrogen balance with no-tillage and nitrogen fertilization. J. Plant Nutr. Soil Sci. 2019, 182, 374–384. [Google Scholar] [CrossRef]
  22. Sigdel, S.; Chatterjee, A. Do cover crop and soil-mediated legacy influence succeeding wheat production? Commun. Soil Sci. Plant Anal. 2020, 51, 1514–1524. [Google Scholar] [CrossRef]
  23. Miller, P.R.; McConkey, B.; Clayton, G.W.; Brandt, S.A.; Staricka, J.A.; Johnston, A.M.; Lafond, G.P.; Schatz, B.G.; Baltensperger, D.D.; Neill, K.E. Pulse crop adaptation in the northern Great Plains. Agron. J. 2002, 94, 261–272. [Google Scholar] [CrossRef]
  24. Singer, J.W.; Cox, W.J. Agronomics of corn production under different crop rotations in New York. J. Prod. Agric. 1998, 1, 462–468. [Google Scholar] [CrossRef]
  25. Allen, B.L.; Lenssen, A.W.; Sainju, U.M.; Jabro, J.D.; Stevens, W.B. Nitrogen use in spring wheat impacted by crop diversification, tillage, and management. Agron. J. 2021, 113, 2437–2439. [Google Scholar] [CrossRef]
  26. Sainju, U.M.; Lenssen, A.W.; Allen, B.L.; Jabro, J.D.; Stevens, W.B. Crop water and nitrogen productivity in response to diversified crop rotations and management systems. Agric. Water Manag. 2021, 257, 107149. [Google Scholar] [CrossRef]
  27. Sainju, U.M.; Lenssen, A.W.; Allen, B.L.; Stevens, W.B.; Jabro, J.D. Soil residual nitrogen under various crop rotations and cultural practices. J. Plant Nutr. Soil Sci. 2017, 180, 187–198. [Google Scholar] [CrossRef]
  28. Littell, R.C.; Milliken, G.A.; Stroup, W.W.; Wolfinger, R.D.; Schabenberger, O. SAS for Mixed Models, 2nd ed.; SAS Institute Inc.: Cary, NC, USA, 2006. [Google Scholar]
  29. Sainju, U.M.; Lenssen, A.W.; Allen, B.L.; Stevens, W.B.; Jabro, J.D. Nitrogen balance in response to dryland crop rotations and cultural practices. Agric. Ecosyst. Environ. 2016, 233, 25–32. [Google Scholar] [CrossRef]
  30. De Notaris, C.; Rasmussen, J.; Sørensen, P.; Melander, B.; Olesen, J.E. Manipulating cover crop growth by adjusting sowing time and cereal inter-row spacing to enhance residual nitrogen effects. Field Crops Res. 2019, 234, 15–25. [Google Scholar] [CrossRef]
  31. Pinto, P.; Rubio, G.; Gutierrez, F.; Sawchik, J.; Arana, S.; Pinero, G. Variable root: Shoot ratios and plant nitrogen concentrations discourage using just aboveground biomass to select legume service crops. Plant Soil 2021, 463, 347–358. [Google Scholar] [CrossRef]
  32. Russell, M.P.; Hargrove, W.L. Cropping systems: Ecology and management. In Nitrogen Management and Groundwater Protection; Follett, R.F., Ed.; Elsevier Science Publication Company: New York, NY, USA, 1989; pp. 277–317. [Google Scholar]
  33. Ranells, N.N.; Wagger, M.G. Nitrogen release from grass and legume cover crop monocultures and bicultures. Agron. J. 1996, 88, 777–782. [Google Scholar] [CrossRef]
  34. Kuo, S.; Sainju, U.M.; Jellum, E.J. Winter cover cropping influence on nitrogen in soil. Soil Sci. Soc. Am. J. 1997, 61, 1392–1399. [Google Scholar] [CrossRef]
  35. Crandall, S.M.; Ruffo, M.L.; Bollero, G.A. Cropping system and nitrogen dynamics under a cereal winter cover crop preceding corn. Plant Soil 2005, 268, 209–219. [Google Scholar] [CrossRef]
  36. Brozovic, B.; Jug, D.; Jug, I.; Durdevic, B.; Vukadinovic, V.; Tadic, V.; Stipesevic, B. Influence of winter cover crops incorporation on weed infestation in popcorn maize (Zea mays everta Sturt.) organic production. Agric. Conspec. Sci. 2018, 83, 77–81. [Google Scholar]
  37. Lenssen, A.W.; Sainju, U.M.; Jabro, J.D.; Iversen, W.M.; Allen, B.L.; Evans, R.G. Crop diversification, tillage, and management system influence spring wheat yield and water use. Agron. J. 2014, 106, 1445–1454. [Google Scholar] [CrossRef]
  38. Osmond, D.L.; Riha, S.J. Nitrogen fertilizer requirements for maize produced in the tropics: A comparison of three computer-based recommendation systems. Agric. Syst. 1996, 50, 37–50. [Google Scholar] [CrossRef]
  39. Geleto, T.; Tanner, D.G.; Mamo, T.; Gebeyehu, G. Response of rainfed bread and durum wheat to source, level, and timing of nitrogen fertilizer on two Ethiopian Vertisols: II. N uptake, recovery and efficiency. Fertil. Res. 1996, 44, 195–204. [Google Scholar] [CrossRef]
  40. López-Bellido, R.J.; Castillo, J.E.; López-Bellido, L. Comparative response of bread and durum wheat cultivars to nitrogen fertilizer in a rainfed Mediterranean environment: Soil nitrate and N uptake and efficiency. Nutr. Cycl. Agroecosyst. 2008, 80, 121–130. [Google Scholar] [CrossRef]
  41. Zhang, D.B.; Yao, P.W.; Zhao, N.; Changwei, Y.; Weidong, C.; Gao, Y. Contribution of green manure legumes to nitrogen dynamics in traditional winter wheat cropping system in the Loess Plateau of China. Eur. J. Agron. 2016, 72, 47–55. [Google Scholar]
  42. Eickhout, B.; Bouwman, A.P.; van Zeijts, H. The role of nitrogen in world food production and environmental sustainability. Agric. Ecosyst. Environ. 2006, 116, 4–14. [Google Scholar] [CrossRef]
  43. Ross, S.M.; Izaurralde, R.C.; Janzen, H.H.; Robertson, J.A.; McGill, W.B. The nitrogen balance of three long-term agroecosystems on a boreal soil in western Canada. Agric. Ecosyst. Environ. 2008, 127, 241–250. [Google Scholar] [CrossRef]
  44. Lupawi, N.Z.; Soon, Y.K. Nitrogen-related rotational effects of legume crops on three consecutive subsequent crops. Soil Sci. Soc. Am. J. 2016, 80, 306–316. [Google Scholar] [CrossRef]
  45. Wang, J.; Sainju, U.M.; Zhang, S.; Raza, M.A. Soil mineral nitrogen and winter wheat nitrogen productivity influenced by summer cover crop and nitrogen fertilization. J. Plant Nutr. 2024. [Google Scholar] [CrossRef]
  46. Sainju, U.M.; Ghimire, R.; Wang, J. Relating soil organic carbon fractions to crop yield and quality with cover crops. In Soil Organic Matter and Feeding the Future; Lal, R., Ed.; Taylor and Francis: Boca Raton, FL, USA, 2022; pp. 65–90. [Google Scholar]
Figure 1. Cover crop biomass and N accumulation as affected by cover crop species and N fertilization rate from 2017–2018 to 2020–2021. SB denotes soybean; SG, sudangrass; and SS, a mixture of soybean and sudangrass. Markers followed by different letters are significantly different among cover crops at a N fertilization rate at p ≤ 0.05 by the least square means test.
Nitrogen 05 00056 g001
Figure 2. Soil mineral N at winter wheat planting and harvest as affected by cover crop species and N fertilization rate from 2017–2018 to 2020–2021. SB denotes soybean; SG, sudangrass; and SS, a mixture of soybean and sudangrass. Markers followed by different letters are significantly different among cover crops at a N fertilization rate at p ≤ 0.05 by the least square means test.
Nitrogen 05 00056 g002
Figure 3. Winter wheat aboveground biomass and grain yield as affected by cover crop species and N fertilization rate from 2017–2018 to 2020–2021. SB denotes soybean; SG, sudangrass; and SS, a mixture of soybean and sudangrass. Markers followed by different letters are significantly different among cover crops at a N fertilization rate at p ≤ 0.05 by the least square means test.
Nitrogen 05 00056 g003
Figure 4. Winter wheat 1000-seed weight and harvest index as affected by cover crop species and N fertilization rate from 2017–2018 to 2020–2021. SB denotes soybean; SG, sudangrass; and SS, a mixture of soybean and sudangrass. Markers followed by different letters are significantly different among cover crops at a N fertilization rate at p ≤ 0.05 by the least square means test.
Nitrogen 05 00056 g004
Figure 5. Winter wheat grain protein concentration and N balance as affected by cover crop species and N fertilization rate from 2017–2018 to 2020–2021. SB denotes soybean; SG, sudangrass; and SS, a mixture of soybean and sudangrass. Markers followed by different letters are significantly different among cover crops at a N fertilization rate at p ≤ 0.05 by the least square means test.
Nitrogen 05 00056 g005
Figure 6. Winter wheat aboveground biomass and grain N uptake as affected by cover crop species and N fertilization rate from 2017–2018 to 2020–2021. SB denotes soybean, SG; sudangrass; and SS, a mixture of soybean and sudangrass. Markers followed by different letters are significantly different among cover crops at a N fertilization rate at p ≤ 0.05 by the least square means test.
Nitrogen 05 00056 g006
Figure 7. Winter wheat aboveground biomass and grain N productivities (BNP and GNP, respectively) as affected by cover crop species and N fertilization rate from 2017–2018 to 2020–2021. SB denotes soybean; SG, sudangrass; and SS, a mixture of soybean and sudangrass. Markers followed by different letters among cover crops at a N fertilization rate are significantly different at p ≤ 0.05 by the least square means test.
Nitrogen 05 00056 g007
Figure 8. Winter wheat aboveground biomass and grain N recovery indices (BNRI and GNRI, respectively) as affected by cover crop species and N fertilization rate from 2017–2018 to 2020–2021. SB denotes soybean; SG, sudangrass; and SS, a mixture of soybean and sudangrass. Markers followed by different letters are significantly different among cover crops at a N fertilization rate at p ≤ 0.05 by the least square means test.
Nitrogen 05 00056 g008
Table 1. Monthly and growing season precipitation from 2017–2018 to 2020–2021 at Changwu.
MonthPrecipitation (mm)
2017–20182018–20192019–20202020–202130-Year Average
July4119219188105
August14910592145116
September27751193391
October9313804649
November19212117
December00335
January190718
February410141511
March22442823
April415077636
May4566444853
June1076313111070
Cover crop growing season (July–September)218372401266312
Wheat growing season (October–June)331214311349272
Total (July–June)549586713615584
Table 2. Analysis of variance for cover crop biomass (CCB) and N accumulation (CCBN), soil mineral N at winter wheat planting (SMNP) and harvest (SMNH), and winter wheat aboveground biomass (AB), grain yield (GY), 1000-seed weight (SW), and harvest index (HI), with sources of variance from cover crop (C), N fertilization rate (N), and year (Y).
SourceCCBCCBNSMNPSMNHABGYSWHI
p Values
C<0.001<0.001<0.001<0.001<0.001<0.0010.0030.073
N<0.001<0.001<0.001<0.001<0.001<0.001<0.0010.863
C × N<0.0010.065<0.001<0.001<0.001<0.001<0.0010.002
Y<0.001<0.001<0.001<0.001<0.001<0.001<0.001<0.001
C × Y<0.001<0.001<0.001<0.001<0.001<0.001<0.0010.008
N × Y<0.001<0.001<0.001<0.001<0.001<0.0010.0960.018
C × N × Y<0.001<0.001<0.001<0.001<0.001<0.0010.016<0.001
Table 3. Analysis of variance for winter wheat protein concentration (PC), aboveground biomass N uptake (BNU), grain N uptake (GNU), aboveground biomass N productivity (BNP), grain N productivity (GNP), aboveground biomass N recovery index (BNRI), grain N recovery index (GNRI), and nitrogen balance (NB), with sources of variance from cover crop (C), N fertilization rate (N), and year (Y).
SourcePCBNUGNUBNPGNPBNRIGNRINB
p Values
C<0.001<0.001<0.001<0.001<0.001<0.001<0.001<0.001
N<0.001<0.001<0.001<0.001<0.001<0.001<0.001<0.001
C × N<0.001<0.001<0.001<0.001<0.001<0.001<0.001<0.001
Y<0.001<0.001<0.001<0.001<0.001<0.001<0.001<0.001
C × Y<0.001<0.001<0.001<0.001<0.001<0.001<0.001<0.001
N × Y0.003<0.0010.001<0.001<0.001<0.001<0.001<0.001
C × N × Y<0.001<0.001<0.001<0.001<0.001<0.001<0.0010.003
Disclaimer/Publisher’s Note: The statements, opinions and data contained in all publications are solely those of the individual author(s) and contributor(s) and not of MDPI and/or the editor(s). MDPI and/or the editor(s) disclaim responsibility for any injury to people or property resulting from any ideas, methods, instructions or products referred to in the content.

