1. Introduction
The statistical distributions of binary nucleon-nucleon collisions in A+A collisions (
), calculated by the Glauber Model [
1], as a function of impact parameter
b, play an important role in probing nuclear modification in A+A collisions. The
distributions are binned into centrality classes. In each distribution,
is maximum for the most central bin, i.e., with
, and decreases monotonically through the most peripheral bin. The results of hard scatterings are compared in ratio to those from p+p collisions scaled by
. For jets, the deviation of this ratio (
) from unity is an indication of nuclear modification. In A+A events, the strong suppression of
is an indicator of quark gluon plasma (QGP) formation. The traditional assumption was that small systems would not form a QGP. Therefore,
was measured in order to study cold nuclear matter effects.
The first inclusive measurements of
were reported for
TeV p+Pb collisions at the LHC by ALICE [
2], CMS [
3], and ATLAS [
4], and for 200 GeV d+Au collisions at PHENIX at RHIC [
5]. As expected, the values of
, when not binned into centrality classes, were consistent with unity. However, centrality binned
showed significant suppression/enhancement for central/peripheral collisions at both ATLAS and PHENIX, a similar result to that interpreted as a QGP signal in A+A collisions. Tantalizingly, this coincided with larger community interest in small systems as a variety of particle collectivity signals were observed in s+A collisions.
2. Event Activity Estimation and Correlations to
Calculating assumes that the probability of a hard scattering scales linearly with , which is applied to collisions by assuming that it scales monotonically with a measured event activity estimation (). In the above measurements, values were determined by detectors at values outside of the region where the jets were reconstructed in order to avoid auto-correlations between and .
The observed suppression/enhancement of
may artificially result from difficulties applying
which are unique to small systems. First, compared to A+A collisions, small systems have large fluctuations in
coupled with a relatively limited range of
. This can result in a dynamical bias when calculating
[
6]. More intriguing is the possibility that individual nucleon-nucleon collisions within a single s+A collision that share a common nucleon are not independent. The effects of such a correlation would be strongly evident in a p+A collision relative to an A+A collision. In the former, every nucleon-nucleon collision shares the same proton; in the latter many independent sets of such collisions would be superimposed, thereby masking the effects of the correlation.
A study of p+Pb collisions at LHC energies concluded that a 20% suppression of soft particles correlated with the presence of a hard scattering would reproduce the enhancement/suppression observed in
[
7]. Energy conservation of a proton (or deuteron) common to a set of nucleon-nucleon collisions may provide the physics mechanism for this correlation. Jet production would require a hard scattering in one nucleon-nucleon collision, and therefore a reduction in energy available for the production of soft particles in the remaining collisions. Two such theory calculations found this to be a sufficient explanation for the observed suppression of central
, one of which also found it sufficient for the peripheral enhancement [
8,
9].
3. Correlations of to Mid-Rapidity Charged Tracks at STAR for p+Au Collisions
STAR has a large set of
p+Au collisions recorded in 2015 which will help address questions raised by the jet measurements already released by PHENIX and the LHC experiments. Measurements of mid-rapidity charged track correlations to high-
, presented in
Figure 1 and
Figure 2, clearly indicate that further study is required prior to calculating the
.
The figures present data from events with two separate triggers. First: minimum bias (MB) events. Second: events triggered by the electromagnetic calorimeter (EMC) selected by the hit with the maximum transverse energy (). The correlations reported are for charged tracks measured in the time projection chamber (TPC) which has good track resolution from 0.2 to 30 GeV/c and has, as does the EMC, full azimuthal coverage. is measured as the sum of the signal in the inner ring of the beam beam counter (BBC) in the Au-going direction. The BBC consists of sets of plastic scintillators arrayed around the beam pipe; the inner ring of which covers rapidity range 3.3 to 5.8.
These preliminary results are detector level and uncorrected for detector acceptance or inefficiency effects. However, the conclusions presented depend on the data’s monotonicity and relative distributions and are consequently not sensative to detector tracking efficiencies and pileup. Statistical uncertainties are plotted for all data. Additionally, a small relative trigger bias is added in quadrature with the statistical uncertainty in
Figure 2a2,b,c. This bias is quantified by the difference in results from the MB data when cut for EMC hits so as to mimic the EMC trigger and the results from the actual EMC triggered data.
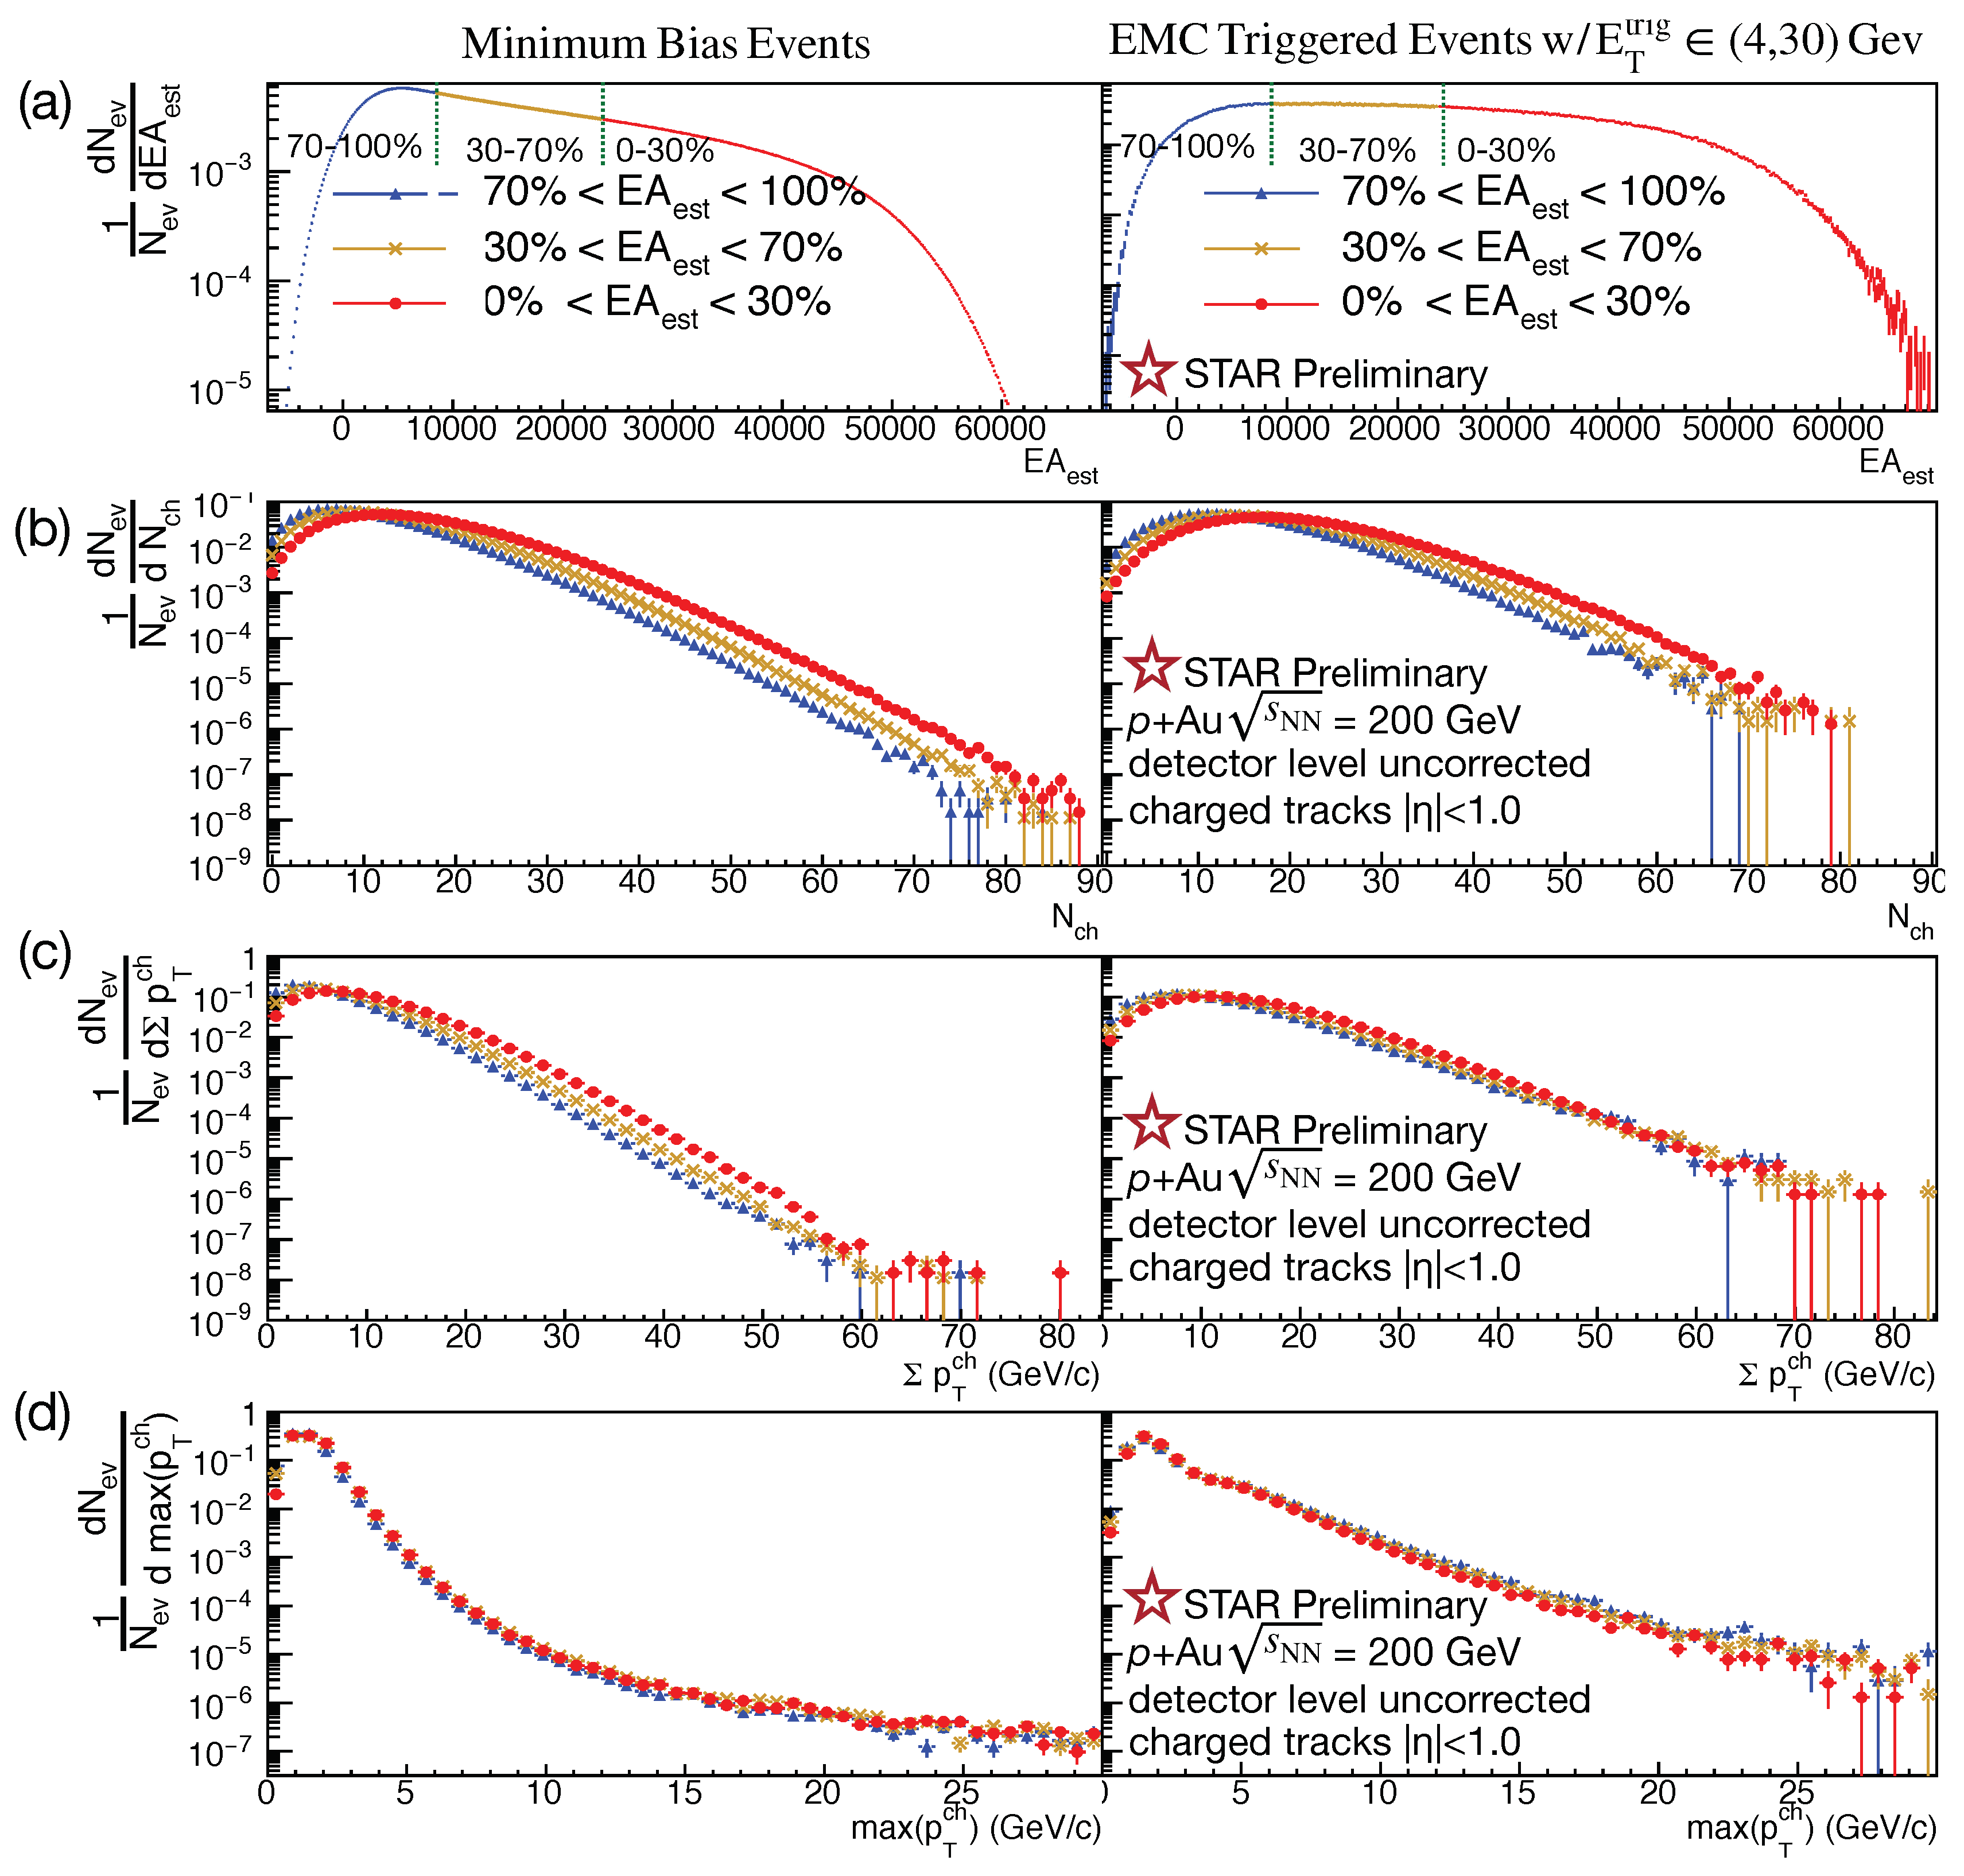
Figure 1a shows the
distributions for MB events (on left) and EMC triggered events (on right). As in the case of centrality in Glauber calculations,
percentiles are defined by the MB distribution with 100% being the lowest and 0% the highest value. Here the EA distribution is divided into low (70–100%), medium (30–70%), and high (0–30%) activity bins. For each
bin, the distribution of multiplicity, summed
, and maximum single track
, are given in (b), (c), and (d). Compared to A+A collisions, the distributions in p+Au collisions heavily overalp among
bins. As expected, the mean values of multiplicity and summed track
are higher for the high
bins. The normalization of the curves in (d) is dominated by the first few, low-
, bins. In these bins the spectra from high, medium, and low
events are fairly comparable. After these low
bins, the spectrum of each
bin continues to be roughly equivalent for harder scatterings in the MB data; however, for the EMC triggered data, the high
bin’s spectrum is somewhat suppressed relative to the low
bin’s spectrum.
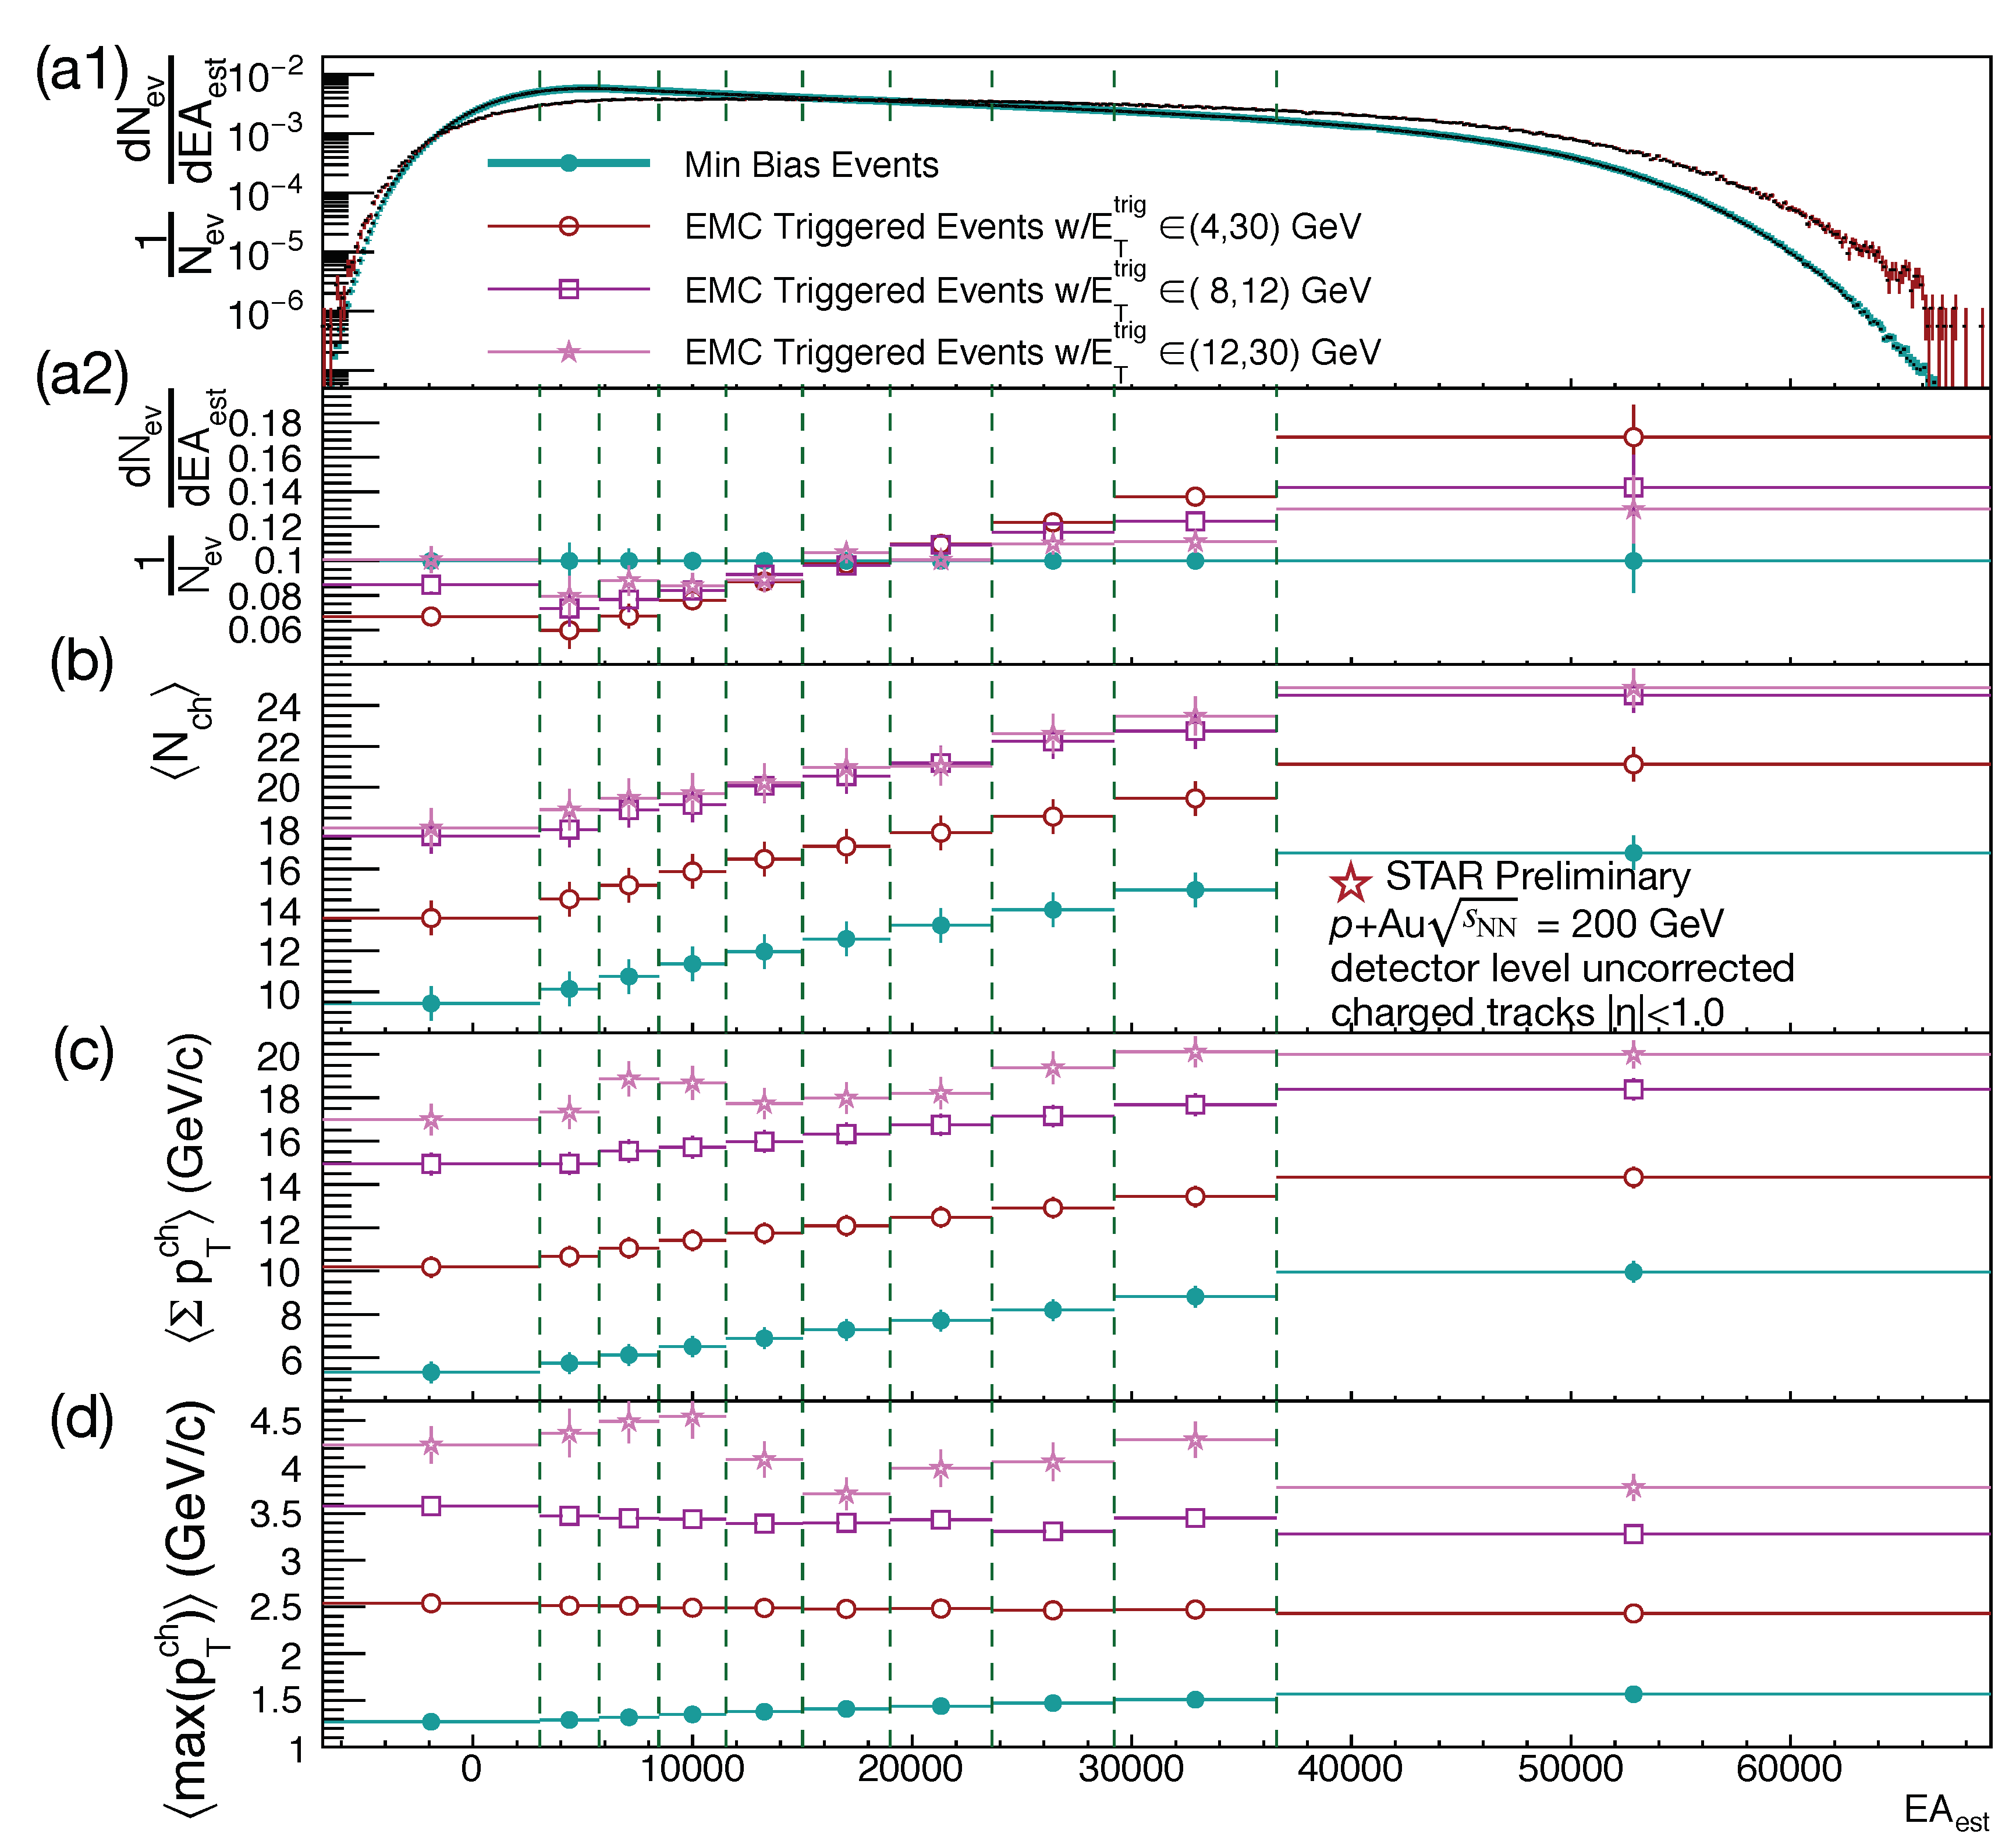
Figure 2a1 gives the same
distributions (MB and EMC triggered) shown in
Figure 1a. The
binning, consistent between all plots, is selected for uniform numbers of MB events. The remaining panels plot average (a2) (normalized) number of events, (b) multiplicity, (c) summed track
, and (d) maximum single track
. The results of two subsets of the EMC data, with higher trigger thresholds, are also plotted. The most striking results are deviations from what would result if
and
scaled positively, monotonically, together. If true, that scaling would result in correlations in (a2)–(d) that are: (1) positive, except, of course, for MB events in (a2), and, (2) smallest for MB events and successively larger for EMC triggered events with successively higher trigger thresholds. Instead, while each correlation is positive in (a2), the correlations are smaller for each successively higher
threshold; the data is too limited for harder triggers to see if there would be an actual turnover at a sufficiently high threshold. Correlations in (c) and (d) are about as naively expected, although it is curious that mean multiplicity and summed
appear relatively saturated by the time there is an 8 GeV
such that they increase only slightly with the higher 12 GeV threshold. Most notably, each EMC triggered distribution (d) is anti-correlated; this directly contradicts the assumption that hard scatterings (and therefore naively higher
values) scale linearly with
.


