Abstract
The basis for the desing of water supply devices is knowledge of the distribution of water demand. The purpose of this work was to determine the structure of water demand for selected building objects. Differences between real and literature values of water flow and water demand were determined. On the basis of the analysis, water meters were selected and peak factors were determined. The analysis was performed based on current legal acts, technical literature, and data obtained from Dabrowskie Wodociagi Sp. z o.o. in Dabrowa Gornicza, Poland.
1. Introduction
The key issue in the design and operation of water supply networks and systems is to evaluate the volume of water supplied, which represents the basis for the calculating of such systems. Water meters are mainly used as devices for measuring volumetric flow. The optimum choice for a water meter is not simple. There is no easy and effective method which would allow for correct measurements of service connection. This is due to the following factors influencing the structure of water distribution: differentiation of consumers in terms of water demand and the resulting varied volumetric water streams over time; residential buildings, hotels, restaurants, schools, industrial plants, shops, etc.; a constant reduction in water consumption by consumers, due to the introduction of modern and more efficient equipment and fittings, as well as for economic reasons; the impact of weather and climate changes on water demand; the large variety of types and sizes of measuring devices [1,2,3,4,5].
Measurements of water consumption performed in order to enable settlements between water suppliers and consumers require the use of water meters. They are designed for the automatic measurement and registration of the volume of flowing water. Properly designed and chosen measurement equipment installed in the water supply system should guarantee the reliability of measurements and ensure water supply for all consumers without any breaks and with appropriate pressure. The reliability of a water supply system depends on the reliability of its individual components, including water meters [6]. Water meters have to meet increasingly high metrological requirements and work over wide measuring ranges. This is necessary due to the substantial variation of water volume streams resulting from the variability in water demand, e.g., taking into account the demand for fire-fighting purposes [7,8].
Water is used unevenly to meet the needs of the population; there occur daily and hourly flow variability. These values are directly related to the way that people use water, their lifestyle (sleep, working hours, meal preparation, washing, etc.). The emergence on the market of smart water meters allows for better knowledge of the average daily demand for water and the maximum daily and hourly demand. We can calculate the daily and hourly peak factors on the basis of the flow variability, and based on these data, we can choose the optimal water meter for a particular customer [9,10].
2. Aim and Scope of the Study
The aim of this study was to determine the structure of water distribution for single-family buildings. The differences between the actual and literature values of maximum water flow rates and water demand per unit of time were determined. The analysis allowed for determination of actual peak factors of water distribution to individual objects. These values were used to choose optimal measuring devices.
The analysis was performed based on current legal acts, technical literature, and data made available by Dabrowskie Wodociagi Sp. z o.o. in DabrowaGornicza, Poland. Two types of water meters were used for data recording: the electromagnetic iPerl meter and volumetric type 640 (SENSUS) meter. The water meters were equipped with integrated digital recorders and radio modules for remote data transmission.
3. Methods of the Research
The research was conducted in the area of the city of DąbrowaGórnicza (Silesian region). There were 116,916 inhabitants registered for permanent residence at the end of 2016 in this town. The average daily water consumption in DąbrowaGórnicza was q = 83 dm3/inhabitant*day.
The analysis of water consumption included 10 single-family houses and was carried out in 2017 and 2018. Water consumption and maximum volume flow for every house were recorded at hourly intervals. The duration of the measurement in individual building objects ranged from two to six months. The measurement period was dependent on the type of device, the number of programmed parameters, and the time of installation of a water meter. The metrological parameters of installed water meters are shown in Table 1.

Table 1.
parameters of installed and planned to be installed water meters.
The number of inhabitants, the total water consumption during the year, and water demand per unit were determined for each building. The following graphs (Figure 1) present hourly water consumption for two selected buildings, for weekly periods in which the maximum values of the measuredvolumetric flow were observed. Graphs showing the maximum of momentary volumetric flows in the analyzed periods are shown in Figure 2.
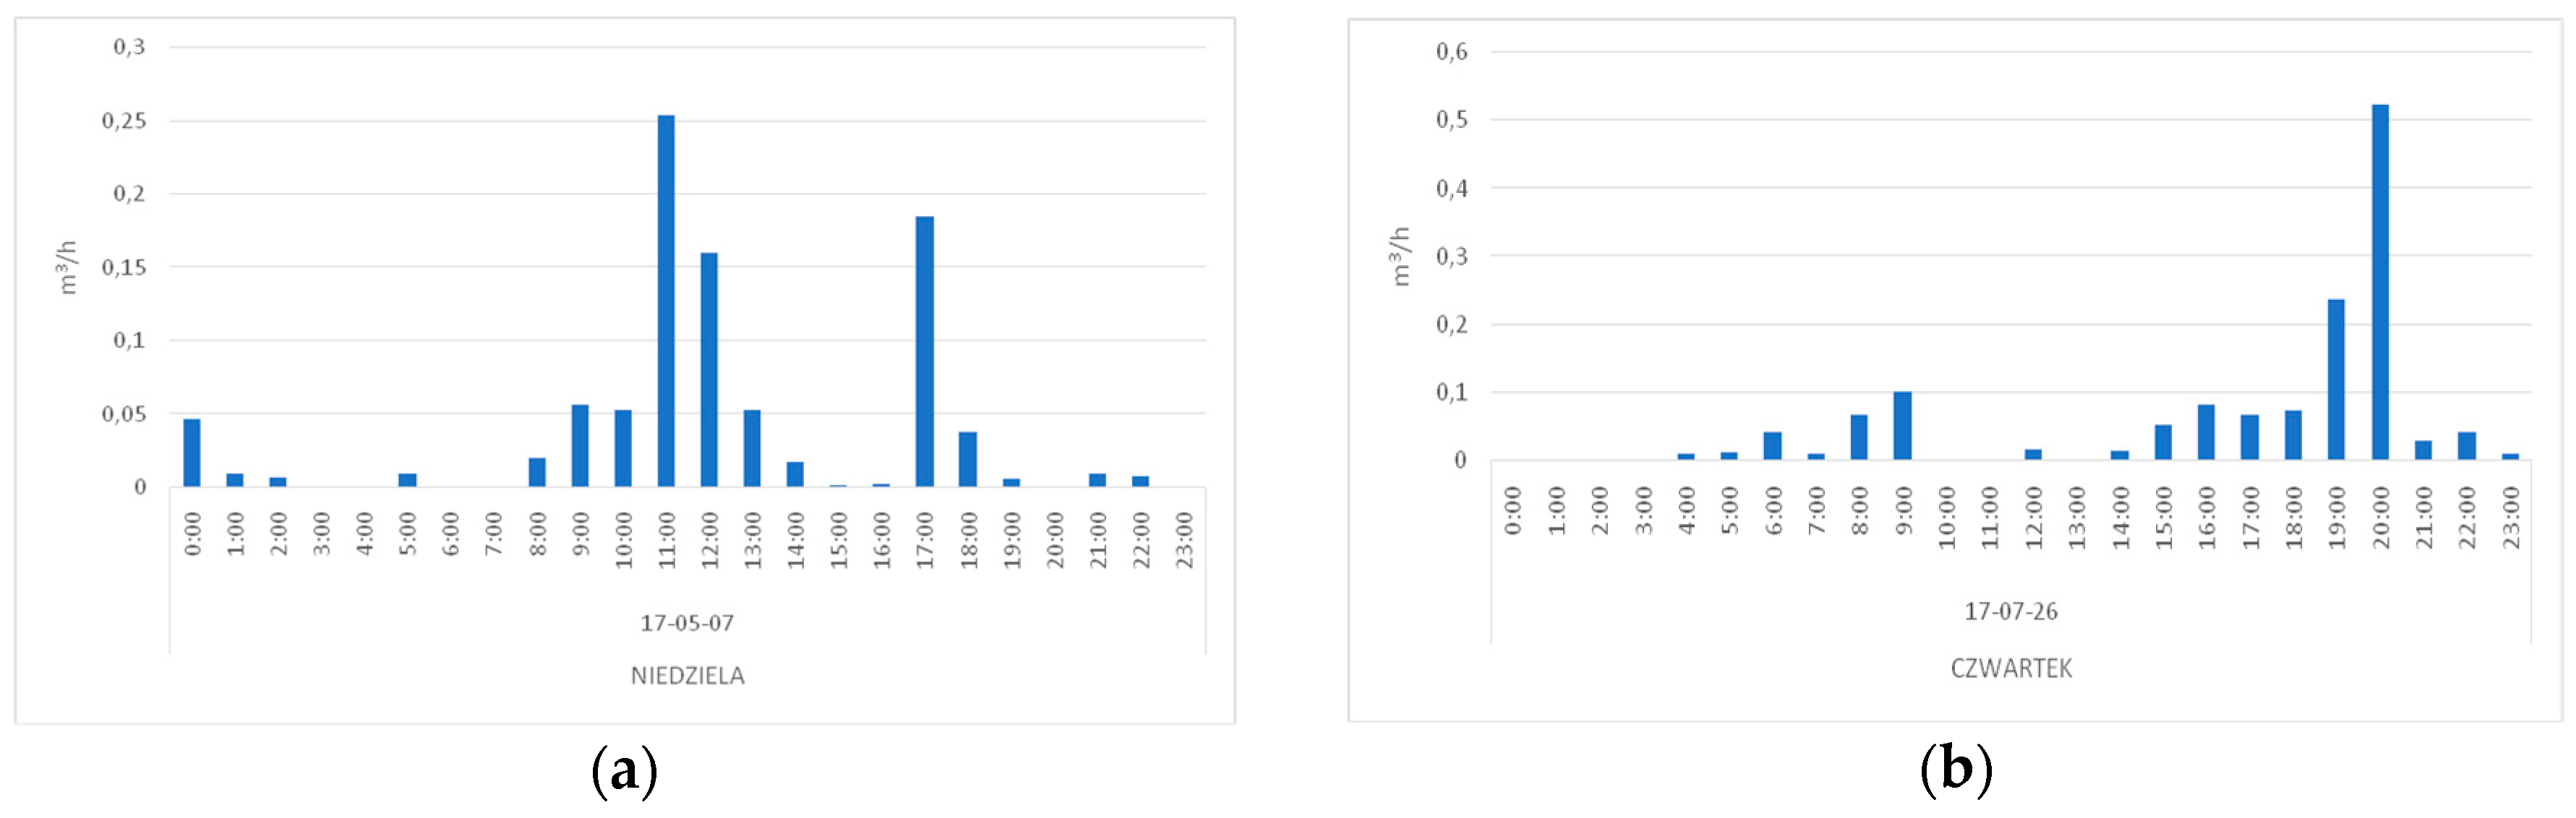
The following figure (Figure 3) shows the distribution of water consumption for a day with maximum demand for the same buildings, which isshown in Figure 1 and Figure 2. The maximum of momentary volumetric flows were not always observed in the same day when the maximum demand for water appeared. Using the obtained data, the daily and hourly peak factors were calculated for each building.

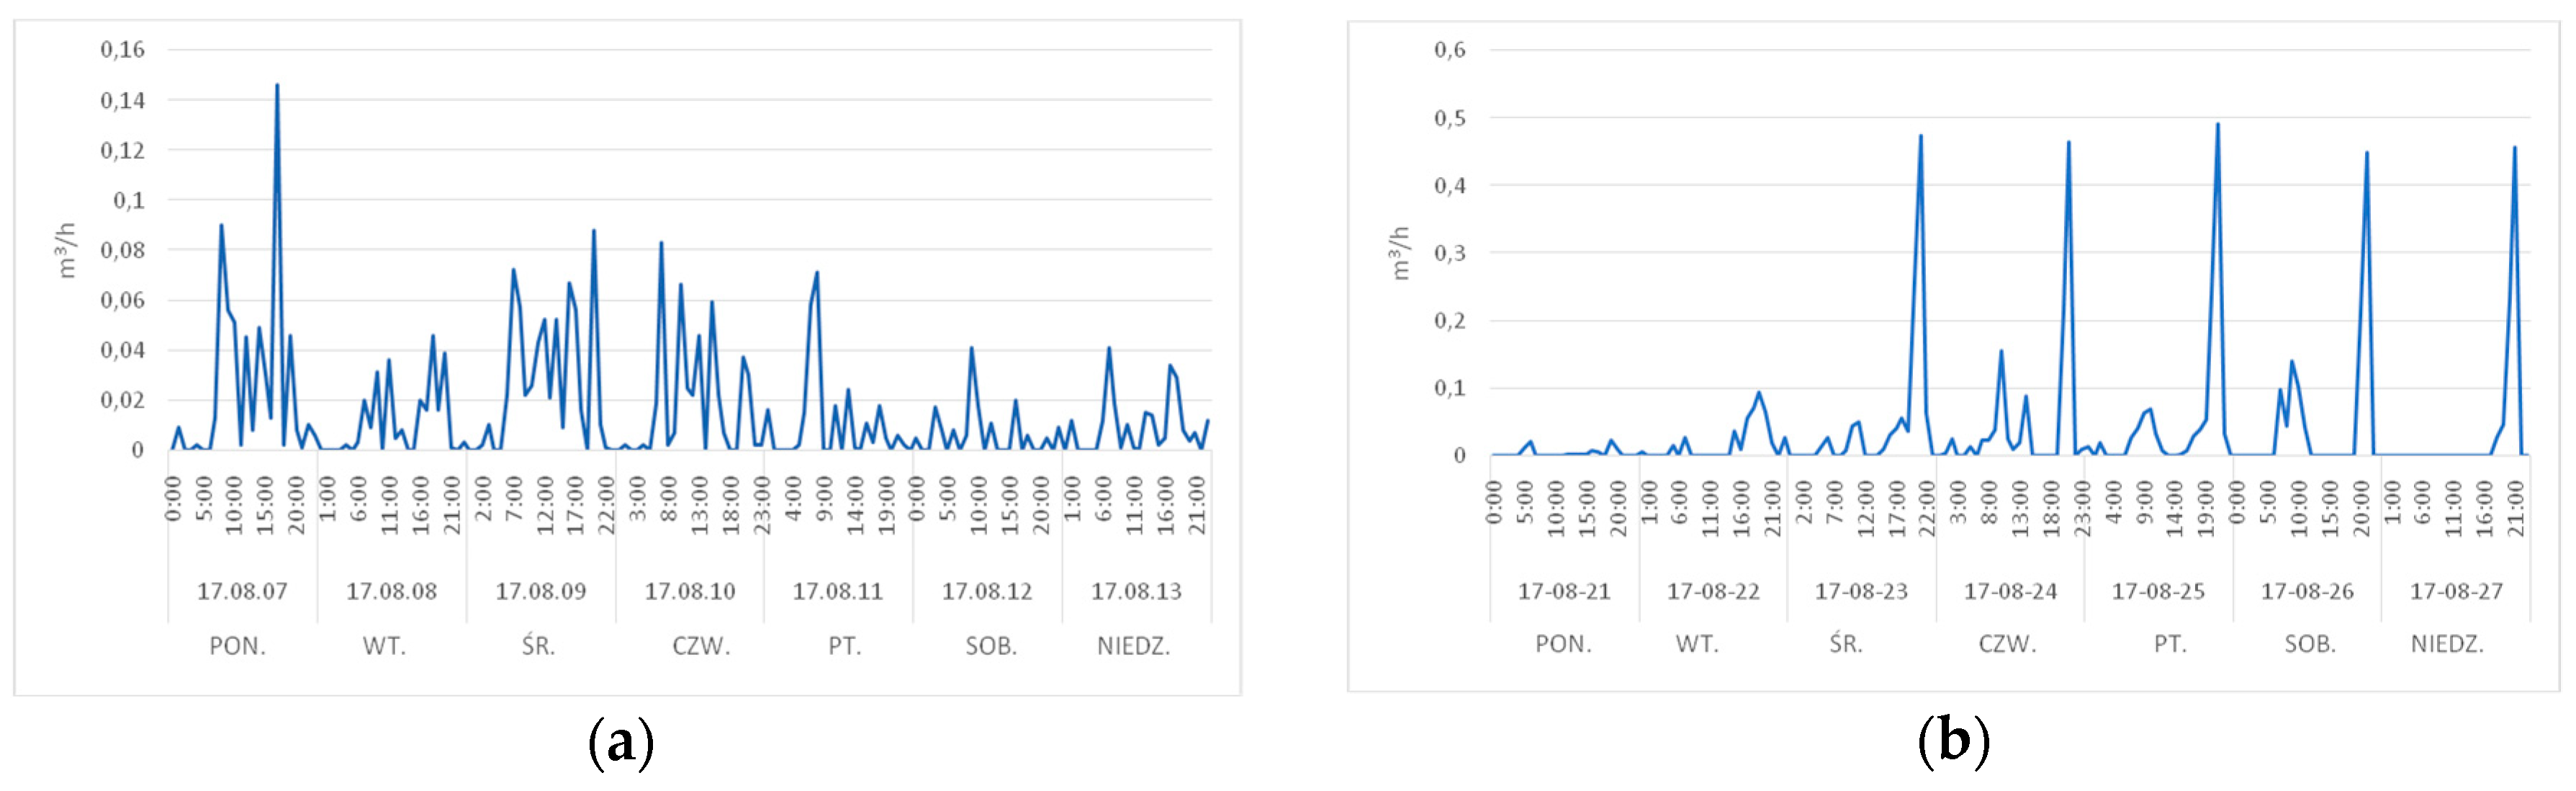
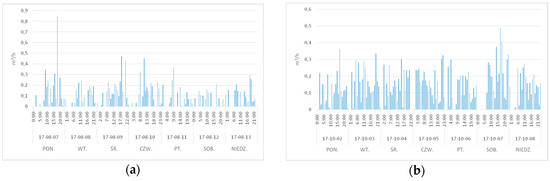
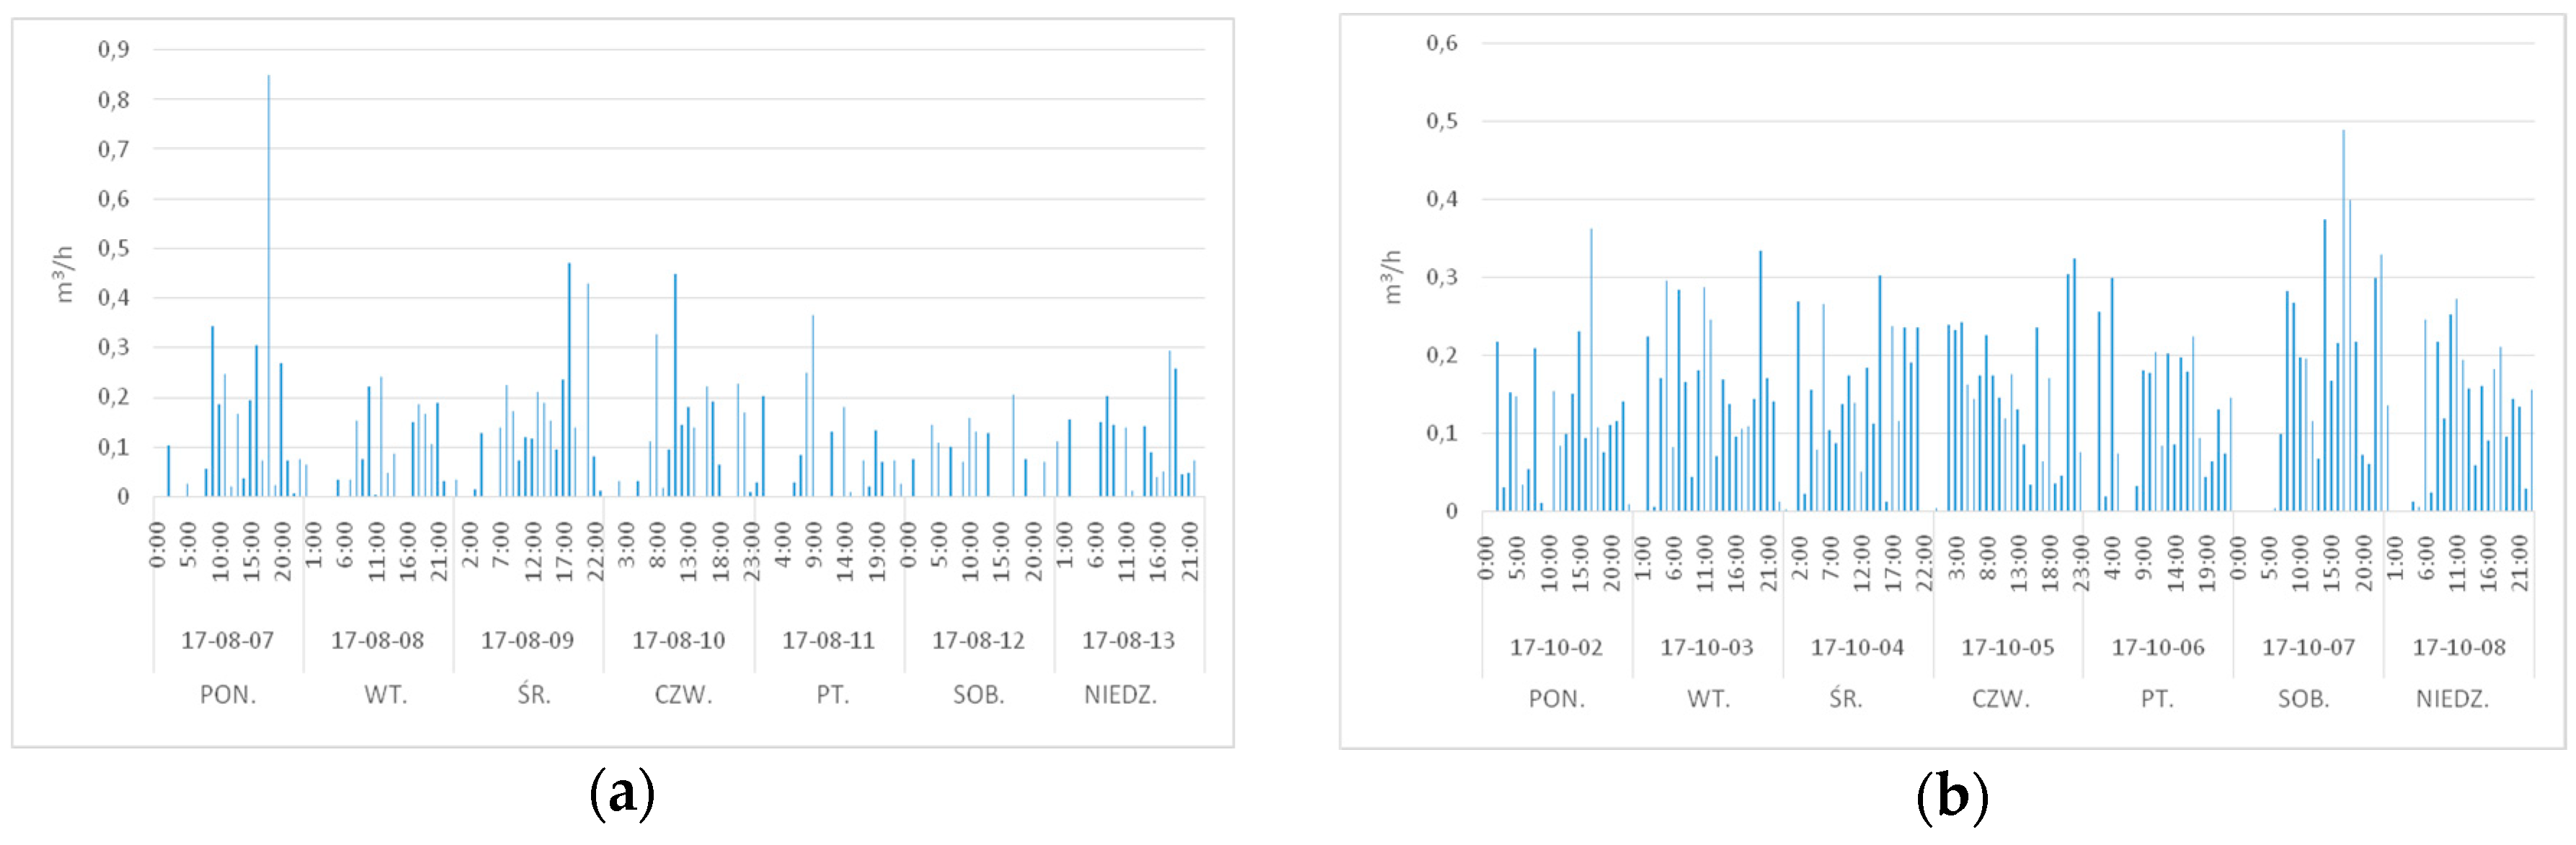
Figure 1.
Examples of hourly water consumption in weekly periods in selected single-family houses: (a) building no. 1, (b) building no. 7.
Figure 1.
Examples of hourly water consumption in weekly periods in selected single-family houses: (a) building no. 1, (b) building no. 7.
Figure 2.
The maximum of momentary volumetric flows in selected single-family houses: (a) building no. 1, (b) building no. 7.
Figure 2.
The maximum of momentary volumetric flows in selected single-family houses: (a) building no. 1, (b) building no. 7.
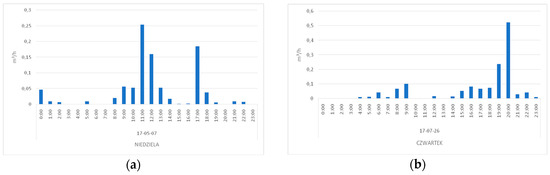
Figure 3.
Examples of variability of hourly water consumption in a day with maximum demand in selected single-family houses: (a) building no. 1, (b) building no. 7.
4. Discussion of Results
For ten selected single-family houses, the average unit water demand was equal to q = 124 dm3/inhabitant*day (Table 2). This value was higher than the consumption in the regulations [12] for buildings equipped with water supply, toilet, bathroom, and local hot water source (q = 80 ÷ 100 dm3/inhabitant*day). Average consumption in the analyzed buildings was also higher than the average water consumption for DąbrowaGórnicza—q = 83 dm3/inhabitant*day.
Single-family houses were characterized by a large variation in water consumption per capita, in the range of 60 to 231 dm3/inhabitant*day. The highest consumption occurred in building no. 7 and 8. These buildings were relatively new, equipped with automatic watering systems. It should be noted that new, single-family houses, as well as urban green areas, are increasingly equipped with automatic watering systems. In this case, it had a significant impact on increasing the average value of water demand. However, for most buildings, the average daily demand was close to or lower than the values in the regulations [12] and in the literature [4,13].
Table 2.
results obtained for single-family buildings.
Table 2.
results obtained for single-family buildings.
| Building | No. 1 | No. 2 | No. 3 | No. 4 | No. 5 | No. 6 | No. 7 | No. 8 | No. 9 | No. 10 | Average |
|---|---|---|---|---|---|---|---|---|---|---|---|
| the number of inhabitants | 3 | 4 | 4 | 4 | 5 | 4 | 2 | 3 | 3 | 5 | 3.7 |
| q, l/Mk*d | 109 | 108 | 167 | 104 | 96 | 60 | 231 | 181 | 80 | 107 | 124 |
| Qdśr, m3/h | 0.326 | 0.430 | 0.668 | 0.416 | 0.482 | 0.238 | 0.463 | 0.542 | 0.241 | 0.534 | 0.43 |
| qmax, m3/h | 0.849 | 0.793 | 0.490 | 0.499 | 0.592 | 1.386 | 0.859 | 1.668 | 0.446 | 0.491 | 0.81 |
| Nd | 2.89 | 1.83 | 1.78 | 1.81 | 2.54 | 1.40 | 2.95 | 3.37 | 2.88 | 1.04 | 2.25 |
| Nh | 6.51 | 2.97 | 3.16 | 4.06 | 5.61 | 3.29 | 9.18 | 14.71 | 5.10 | 5.35 | 5.99 |
q—average daily water consumption per customer, Qdśr—average daily water demand per building, qmax—maximum momentary volumetric flow, Nd—daily peak factor, Nh—hourly peak factor, the maximum results have been marked with a grey background.
5. Conclusions
The analyzed buildings were characterized by a diversified demand for water per capita. This indicator was lower for most of the buildings compared to those contained in the regulations of the Ministry of Infrastructure on average water consumption standards. The calculated peak factor of daily Nd and hourly Nh unevenness ranged from 1.4 to 3.4 and from 3.0 to 14.7, respectively. These values are much higher than the peak factors available in the technical literature [13].
In technical conditions specified by some water supply companies, the use of DN 20 mm water meters for single-family houses is required. The analysis revealed that it is possible in these buildings to use water meters with a smaller diameter (DN 15 mm) instead of the currently used meters. This will allow for reduction in the cost of purchasing new water meters, whereas installation of devices with a different diameter will increase the costs insignificantly and the costs will be incurred only once. It should be also emphasized that current DN 20 water meters have very good metrological parameters and do not adversely affect the amount of water measured. For this reason, their replacement will be advisable only after the expiry of the verification period.
Author Contributions
U.K. and L.S. conceived and designed the experiments; K.C. performed the experiments; U.K. and K.C. analyzed the data; E.S.-M. contributed analysis tools; U.K. and E.S.-M. wrote the paper.
Acknowledgments
The research was financed by BS-PB-401/301/12 and BS-PB-400-301/19 funds.
Conflicts of Interest
The authors declare no conflict of interest. The founding sponsors had no role in the design of the study; in the collection, analyses, or interpretation of data; in the writing of the manuscript, and in the decision to publish the results.
References
- Ociepa, A.; Lach, J. Nowoczesne techniki w eksploatacji sieci wodociągowej i kanalizacyjnej. Ecol. Chem. Eng. 2007, 13, 567–574. (In Polish) [Google Scholar]
- Lewandowski, P.; Walkowski, C. Poradnik wodomierzowy: Wodomierze silnikowe. Toruń. Available online: www.vapro.pl (accessed on 26 May 2018). (In Polish).
- Parker, J.M.; Wilby, R.L. Quantifying Household Water Demand: A Review of Theory and Practice in the UK. Water Resour. Manag. 2013, 27, 981–1011. [Google Scholar] [CrossRef]
- Rathnayaka, K.; Malano, H.; Arora, M.; George, B.; Maheepala, S.; Nawarathna, B. Prediction of urban residential end-use water demands by integrating known and unknown water demand drivers at multiple scales I: Model development. Resour. Conserv. Recycl. 2017, 117, 85–92. [Google Scholar] [CrossRef]
- Rathnayaka, K.; Malano, H.; Maheepala, S.; George, B.; Nawarathana, B.; Arora, M.; Roberts, P. Seasonal Demand Dynamics of Residential Water End-Uses. Water 2015, 7, 202–216. [Google Scholar] [CrossRef]
- Ociepa-Kubicka, A.; Wilczak, K. Water Loss Reduction as the Basis of Good Water Supply Companies Management. In Proceedings of the International Conference Energy, Environment and Material Systems (EEMS 2017), Polanica Zdrój, Poland, 13–15 September 2017; Volume 19, p. 02015. [Google Scholar]
- Chudzicki, J.; Sosnowski, S. Instalacje wodociągowe: Projektowanie, wykonanie, eksploatacja; Wyd. 3.; Wydawnictwo Seidel-Przywecki; Wydawnictwo “Seidel-Przywecki”: Warszawa, Poland, 2011. (In Polish) [Google Scholar]
- Tuz, P. Dobór średnicy wodomierza–wytyczne dla budynków wielolokalowych i jednorodzinnych. Available online: www.zgkczernica.pl (accessed on 26 May 2018). (In Polish).
- Gurung, T.R.; Stewart, R.A.; Sharma, A.K.; Beal, C.D. Smart meters for enhanced water supply network modelling and infrastructure planning. Resourccesconserv. Recycl. 2014, 90, 34–50. [Google Scholar] [CrossRef]
- Boyle, T.; Giurco, D.; Mukheubir, P.; Liu, A.; Moy, C.; White, S.; Stewart, R. Intelligent Metering for Urban Water: A Review. Water 2013, 5, 1052–1081. [Google Scholar] [CrossRef]
- Directive 2004/22/EC of the European Parliament nad of the Council, of 31 March 2004, on Measuring Instruments. Available online: https://eur-lex.europa.eu/legal-content/EN/ALL/?uri=celex%3A32014L0032 (accessed on 26 May 2018).
- Rozporządzenie Ministra Infrastruktury z dnia 14 stycznia 2002 r. w sprawie określenia przeciętnych norm zużycia wody. (Dz. U. z 2002 r. nr 8 poz. 70). (In Polish)
- Heidrich, Z. Wodociągi i kanalizacja; Wyd. 7.; Wydawnictwo Szkolne i Pedagogiczne; Available online: https://www.taniaksiazka.pl/wodociagi-i-kanalizacja-cz-1-heidrich-wsip-zbigniew-heidrich-p-313050.html (accessed on 26 May 2018). (In Polish)
Publisher’s Note: MDPI stays neutral with regard to jurisdictional claims in published maps and institutional affiliations. |
© 2019 by the authors. Licensee MDPI, Basel, Switzerland. This article is an open access article distributed under the terms and conditions of the Creative Commons Attribution (CC BY) license (https://creativecommons.org/licenses/by/4.0/).