Abstract
In the energy transition from fossil to renewable resources, gas is foreseen to play an important role. However, the composition of the gas is expected to change due to a wider variation of sources. In order to mitigate potential challenges for distributors and end-users, a new low-cost gas composition sensor was developed that will be able to monitor the composition and energy content of these gas sources, ranging from biogas to liquid natural gas (LNG). Together with industrial and academic partners a gas sensor was realized that can be inserted in an existing gas grid. A first demonstrator was realized that was small enough to be used in low and medium pressure gas pipes (100 mbarg—8 barg). Adding the pressure and temperature data to the chip readings enables to determine the concentrations of methane, ethane, propane, butane, nitrogen and carbon dioxide, including small fluctuations in water vapor pressure and subsequently calculate the Calorific Value, Wobbe Index and Methane Number.
1. Introduction
The Netherlands and other regions are facing major changes during the coming decades in the production and use of natural gas for household heating and industrial processes. Both economic and political changes induce an accelerated reduction of the use of the nationally produced natural gas, and require a shift towards LNG from different sources all over the world and sustainable solutions such as biogas. Both these gases have a deviating composition related to the traditional sources. This will require a more intense monitoring of the composition along the gas grid. The currently available gas quality measuring systems (e.g., GC, Wobbe Index analyzer, etc.) cannot fulfill the need for a cost-effective inline measuring method [1]. The number of biogas feeds into an existing gas grid will increase significantly during the coming years. This not only asks for a clear monitoring of the distribution of this gas along the grid, but also a more intense monitoring of the gas feed quality. Biogas may suffer from larger fluctuations in composition and accompanying contaminations. These should be recognized before entering a gas grid. Currently, gas chromatographs are used for these ‘gate keeper’ activities, but lower cost solutions may be required in order to lower the hurdles for starting biogas producers. For that reason, TNO started the development of a new type of gas sensor, based on gas sensitive coatings on an array of electronic chips.
This paper presents the development of a low cost calorific value sensor for natural gas and biogas, based on the measurement of the composition of the individual components methane, ethane, propane, butane, carbon dioxide and nitrogen. This gas sensor is based on gas sensitive coatings on an electronic platform (Figure 1). New coating formulations were developed that selectively absorb the target gas and consequently will give rise to a change in material behavior (i.e., dielectric constant). This change in material properties is monitored using capacitive comb electrodes. Combining the response of multiple sensor chips makes it possible to simultaneously obtain the concentrations of the individual components of the target gas. Subsequently the calorific value and Wobbe Index of the gas mixture can be calculated.
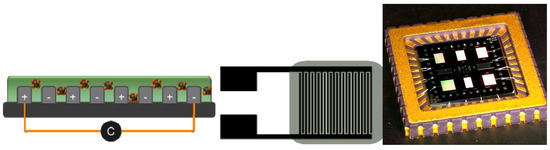
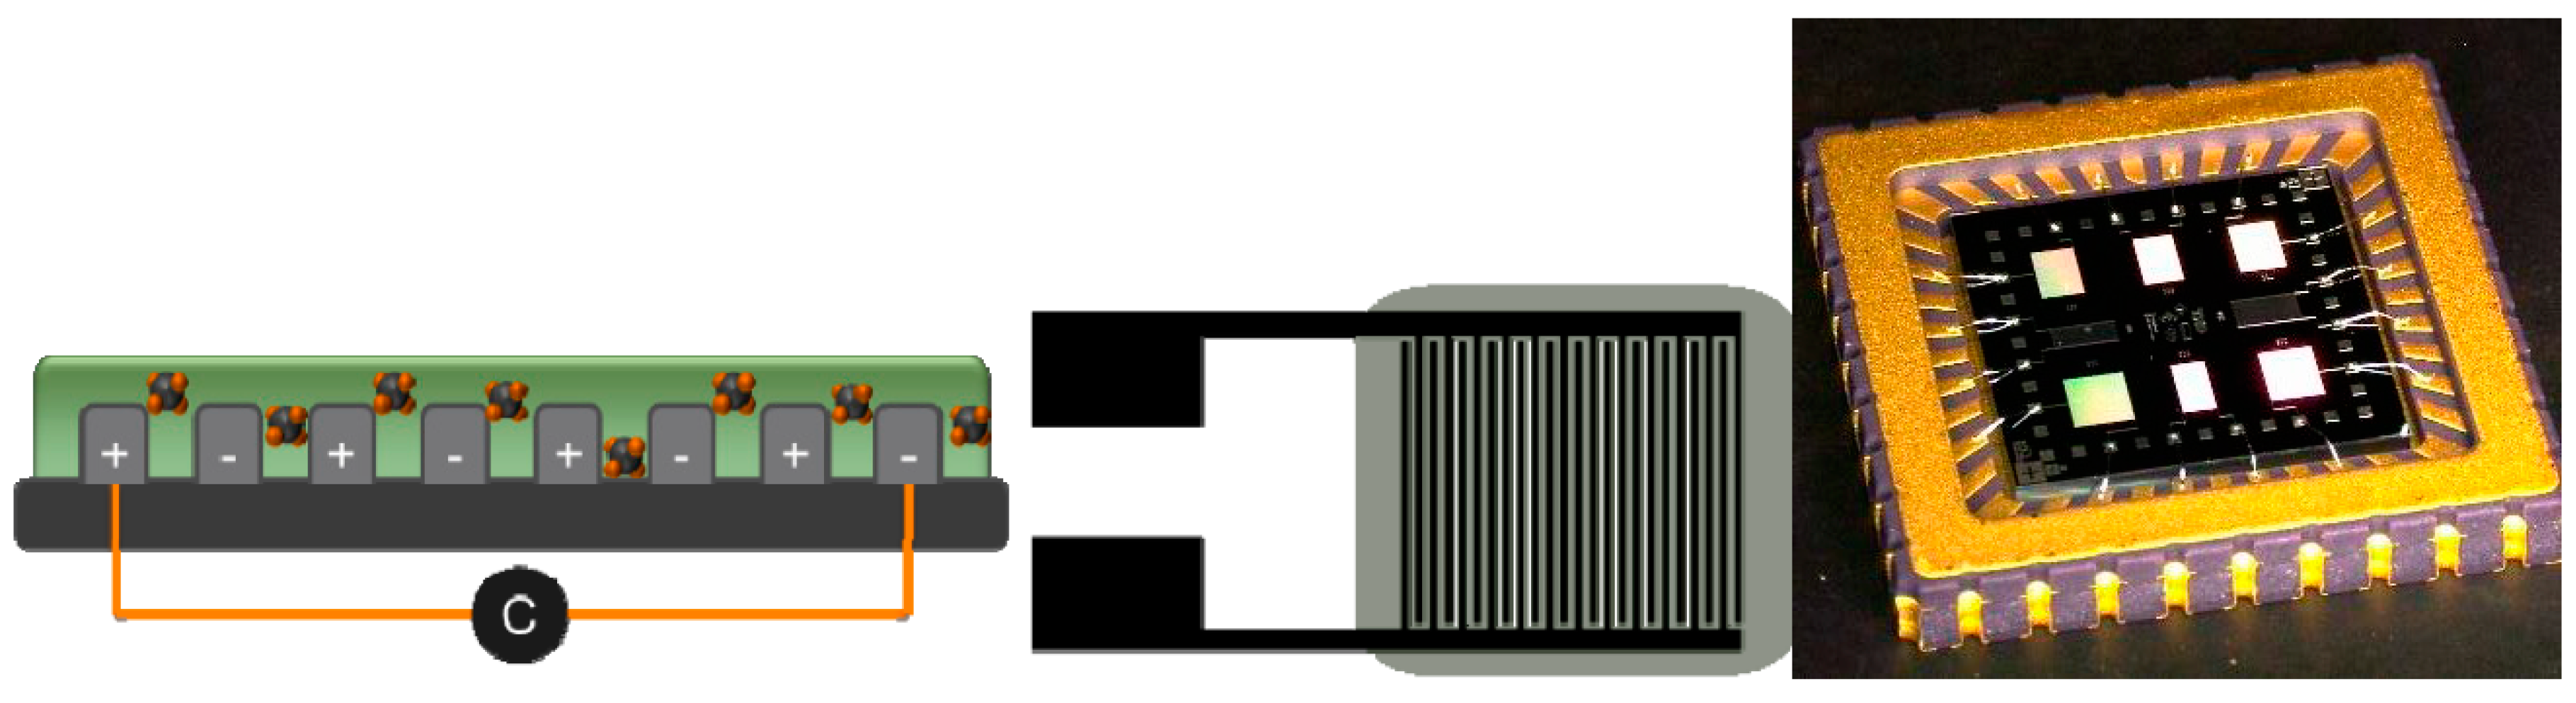
Figure 1.
Concept of capacitive detection of gas absorption using interdigitated electrodes, and silicon chip having eight electrodes.
2. Approach
The use of capacitive interdigitated electrodes (IDE) has been discussed already in several papers, ranging from gas sensors to liquid sensors [2,3,4,5]. In general, these electrodes are coated with responsive layers that absorb the target molecules. This concept has the ability for miniaturization, since the electrodes can be made using CMOS compatible technologies, and the read-out electronics only require a small PCB. So, the approach disclosed in the current paper is a next step in miniaturization of a gas sensor array. Therefore, a capacitive platform was chosen, made from an array of interdigitated electrodes (Figure 1), each of which was coated with a polymer based coating, specifically tuned to one of the target gasses [2,3]. The responsive coatings that were applied on the capacitive comb electrodes were based on fluoro, silicone and imide polymers, some having porous additives for the capture of the gas molecules. These porous additives were based on zeolites, cage molecules, and Metal Organic Framework (Figure 2). Zeolites have been shown to be a very interesting and versatile group of porous materials, that is often used for sensor applications [6]. The cavity size and porosity can be tuned to the chemistry and molecular size of the individual gasses. When gas molecules are captured inside a cavity, the dielectric constant changes, giving rise to changing capacitances, measured by the electronics.

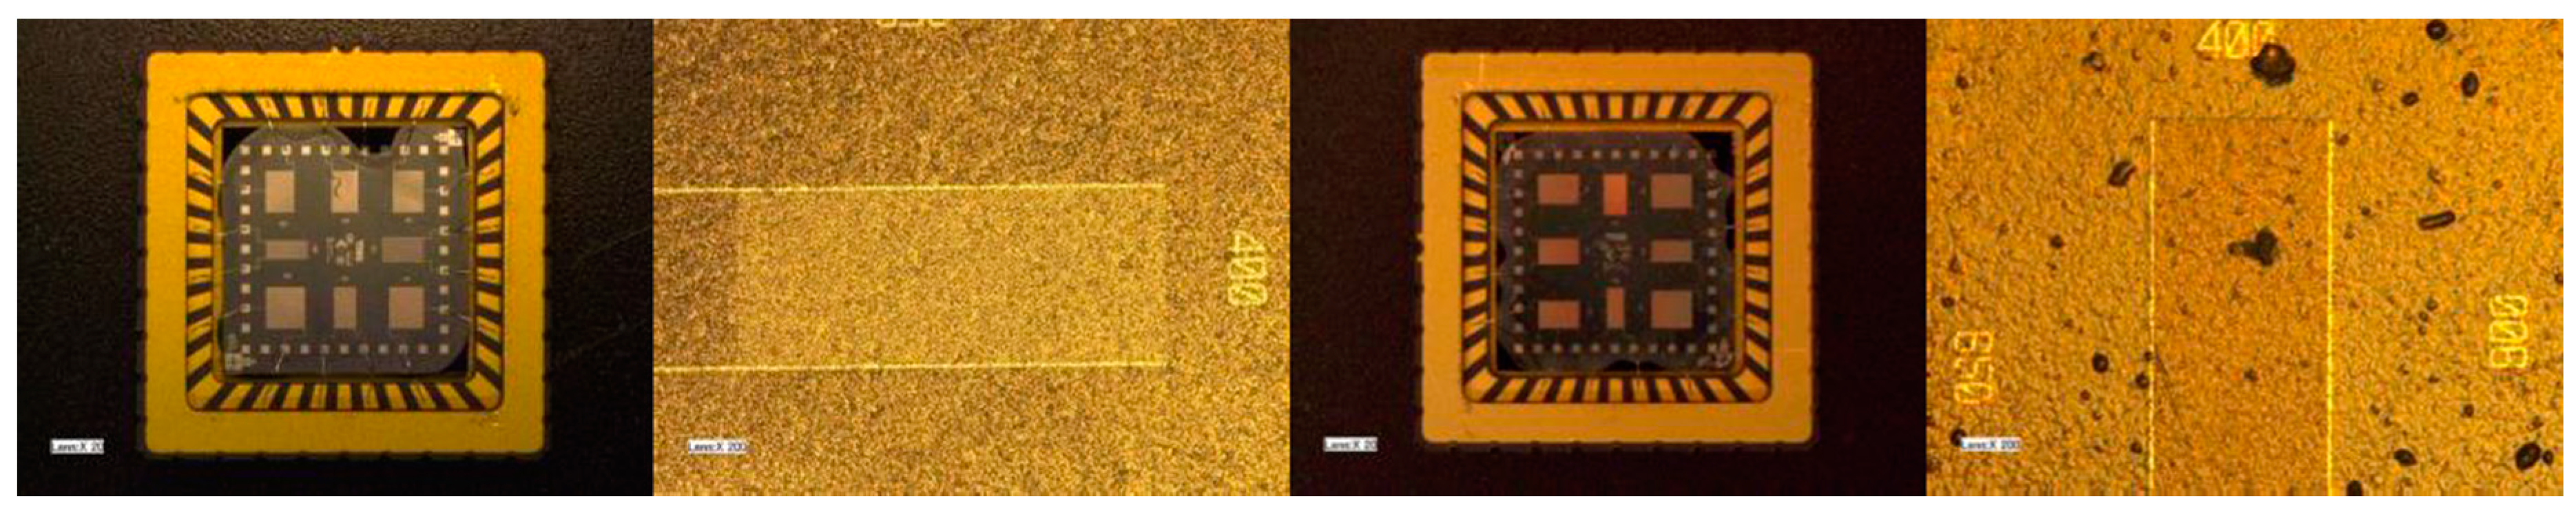
Figure 2.
Sensor chips coated with a Metal Organic Framework coating (left), and zeolite coating (right) on the eight electrodes, and close-up of the smallest electrodes (400 × 1000 µm).
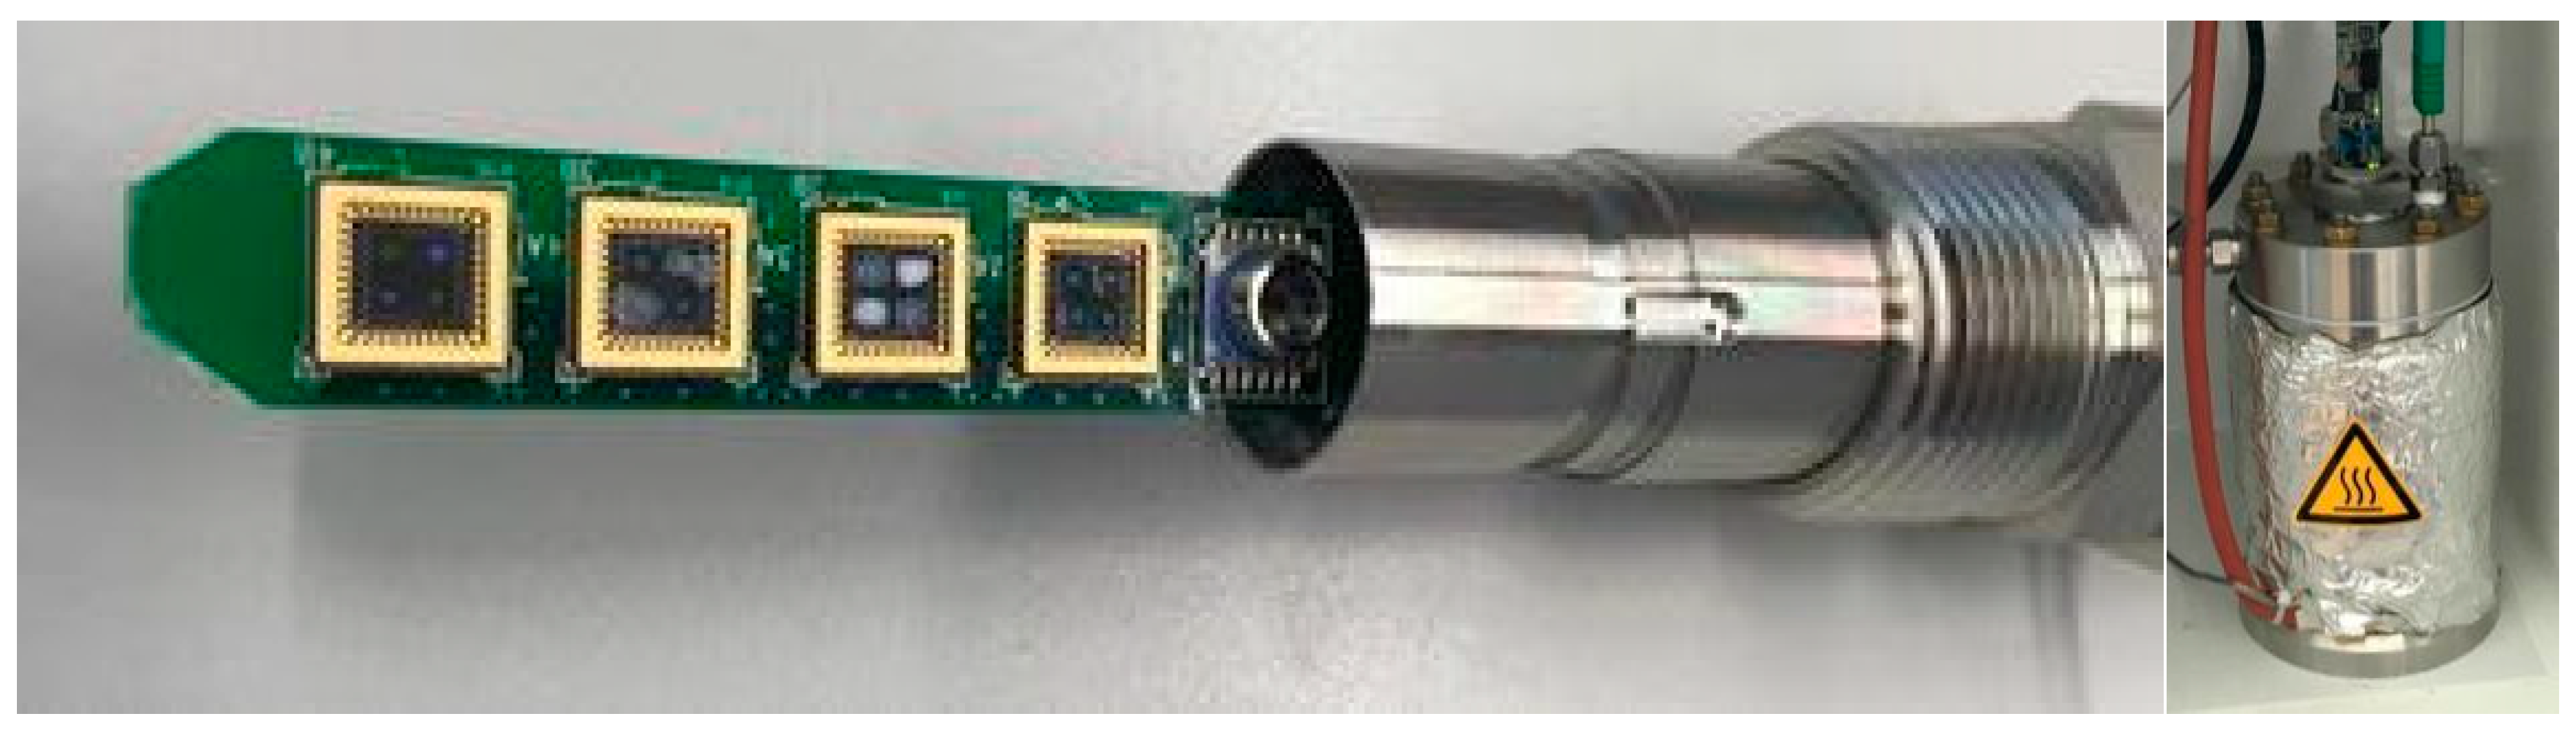
The capacitive chips were bonded to a sensing-PCB (Figure 3), and installed in the gas exposure vessel (Figure 4). The signal processing PCB was kept out of the gas mixtures for security reasons.
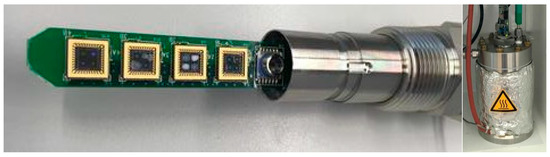
Figure 3.
Coated capacitive chips mounted to the PCB and inserted into the protective housing (left). The sensor is inserted into the heated pressure vessel for the laboratory validation tests (right).

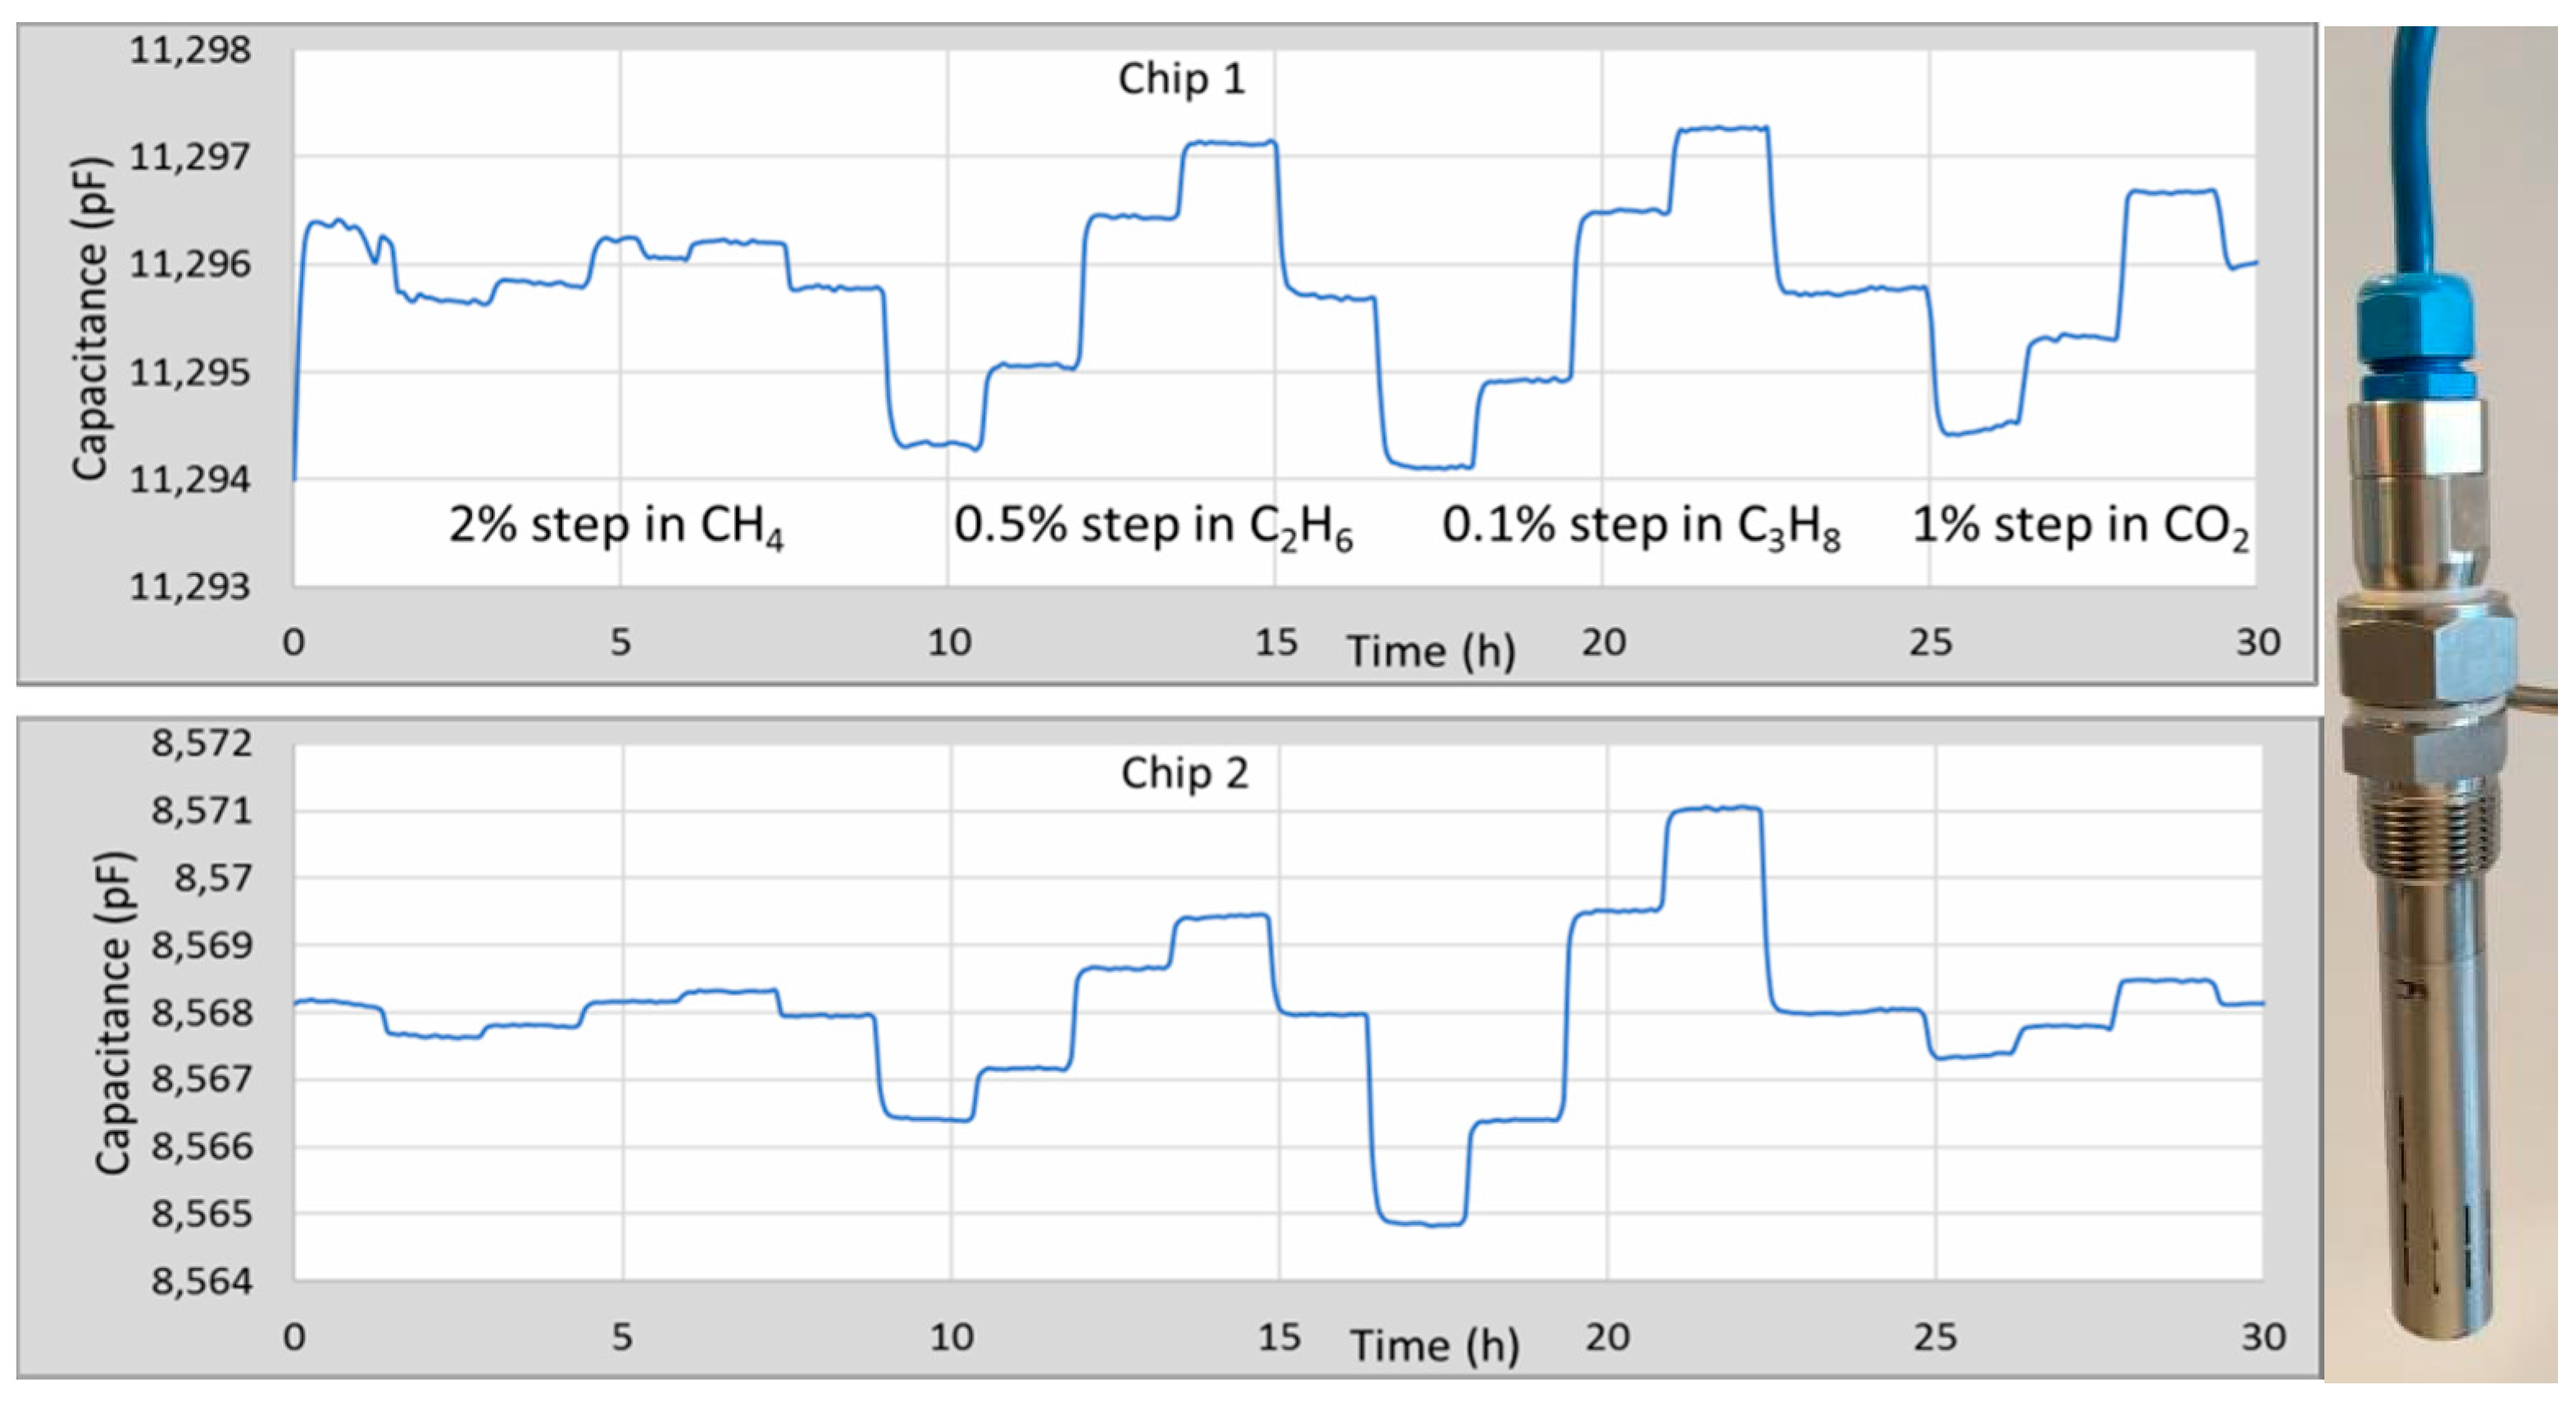
Figure 4.
Typical response of two coated chips to small changes in concentration of CH4 (78–86 vol%), C2H6 (2–4 vol%),C3H8 (0.5–0.9 vol%),CO2 (1–4 vol%) in nitrogen as a carrier gas (left). Packaged sensor in protective housing (right).
First the gas sensing device was exposed to well defined gas mixtures of methane, ethane, propane, nitrogen, and carbon dioxide in a laboratory environment. The concentrations in these mixtures were chosen to approach the concentrations in a typical gas (i.e., ~80 vol% methane, ~3 vol% ethane, ~1 vol% propane, ~3 vol% CO2). Two examples are given in Figure 4: two coated chips exposed to small variations in gas concentration (at 1 bara and 25 °C). Combining the response of multiple sensor chips makes it possible to simultaneously obtain the concentrations of the individual components of the target gas mixtures. Subsequently, other gas parameters can be calculated from the composition, such as the calorific value, Wobbe index, and density.
3. Results of the Field Tests
The final validation of the sensors was done in field tests, where the sensors were installed in several real gas grids that transport natural gas and/or mixtures with biogas to customers. The sensors were operating for several weeks Two field tests were executed in the Dutch gas grid. First, a test to monitor changes in composition due to feed of biogas from a sugar processing plant into a local gas grid of the city of Groningen (Figure 5). And secondly, a stability test in the gas grid of the island of Texel, where the sensor was exposed to Dutch natural gas.

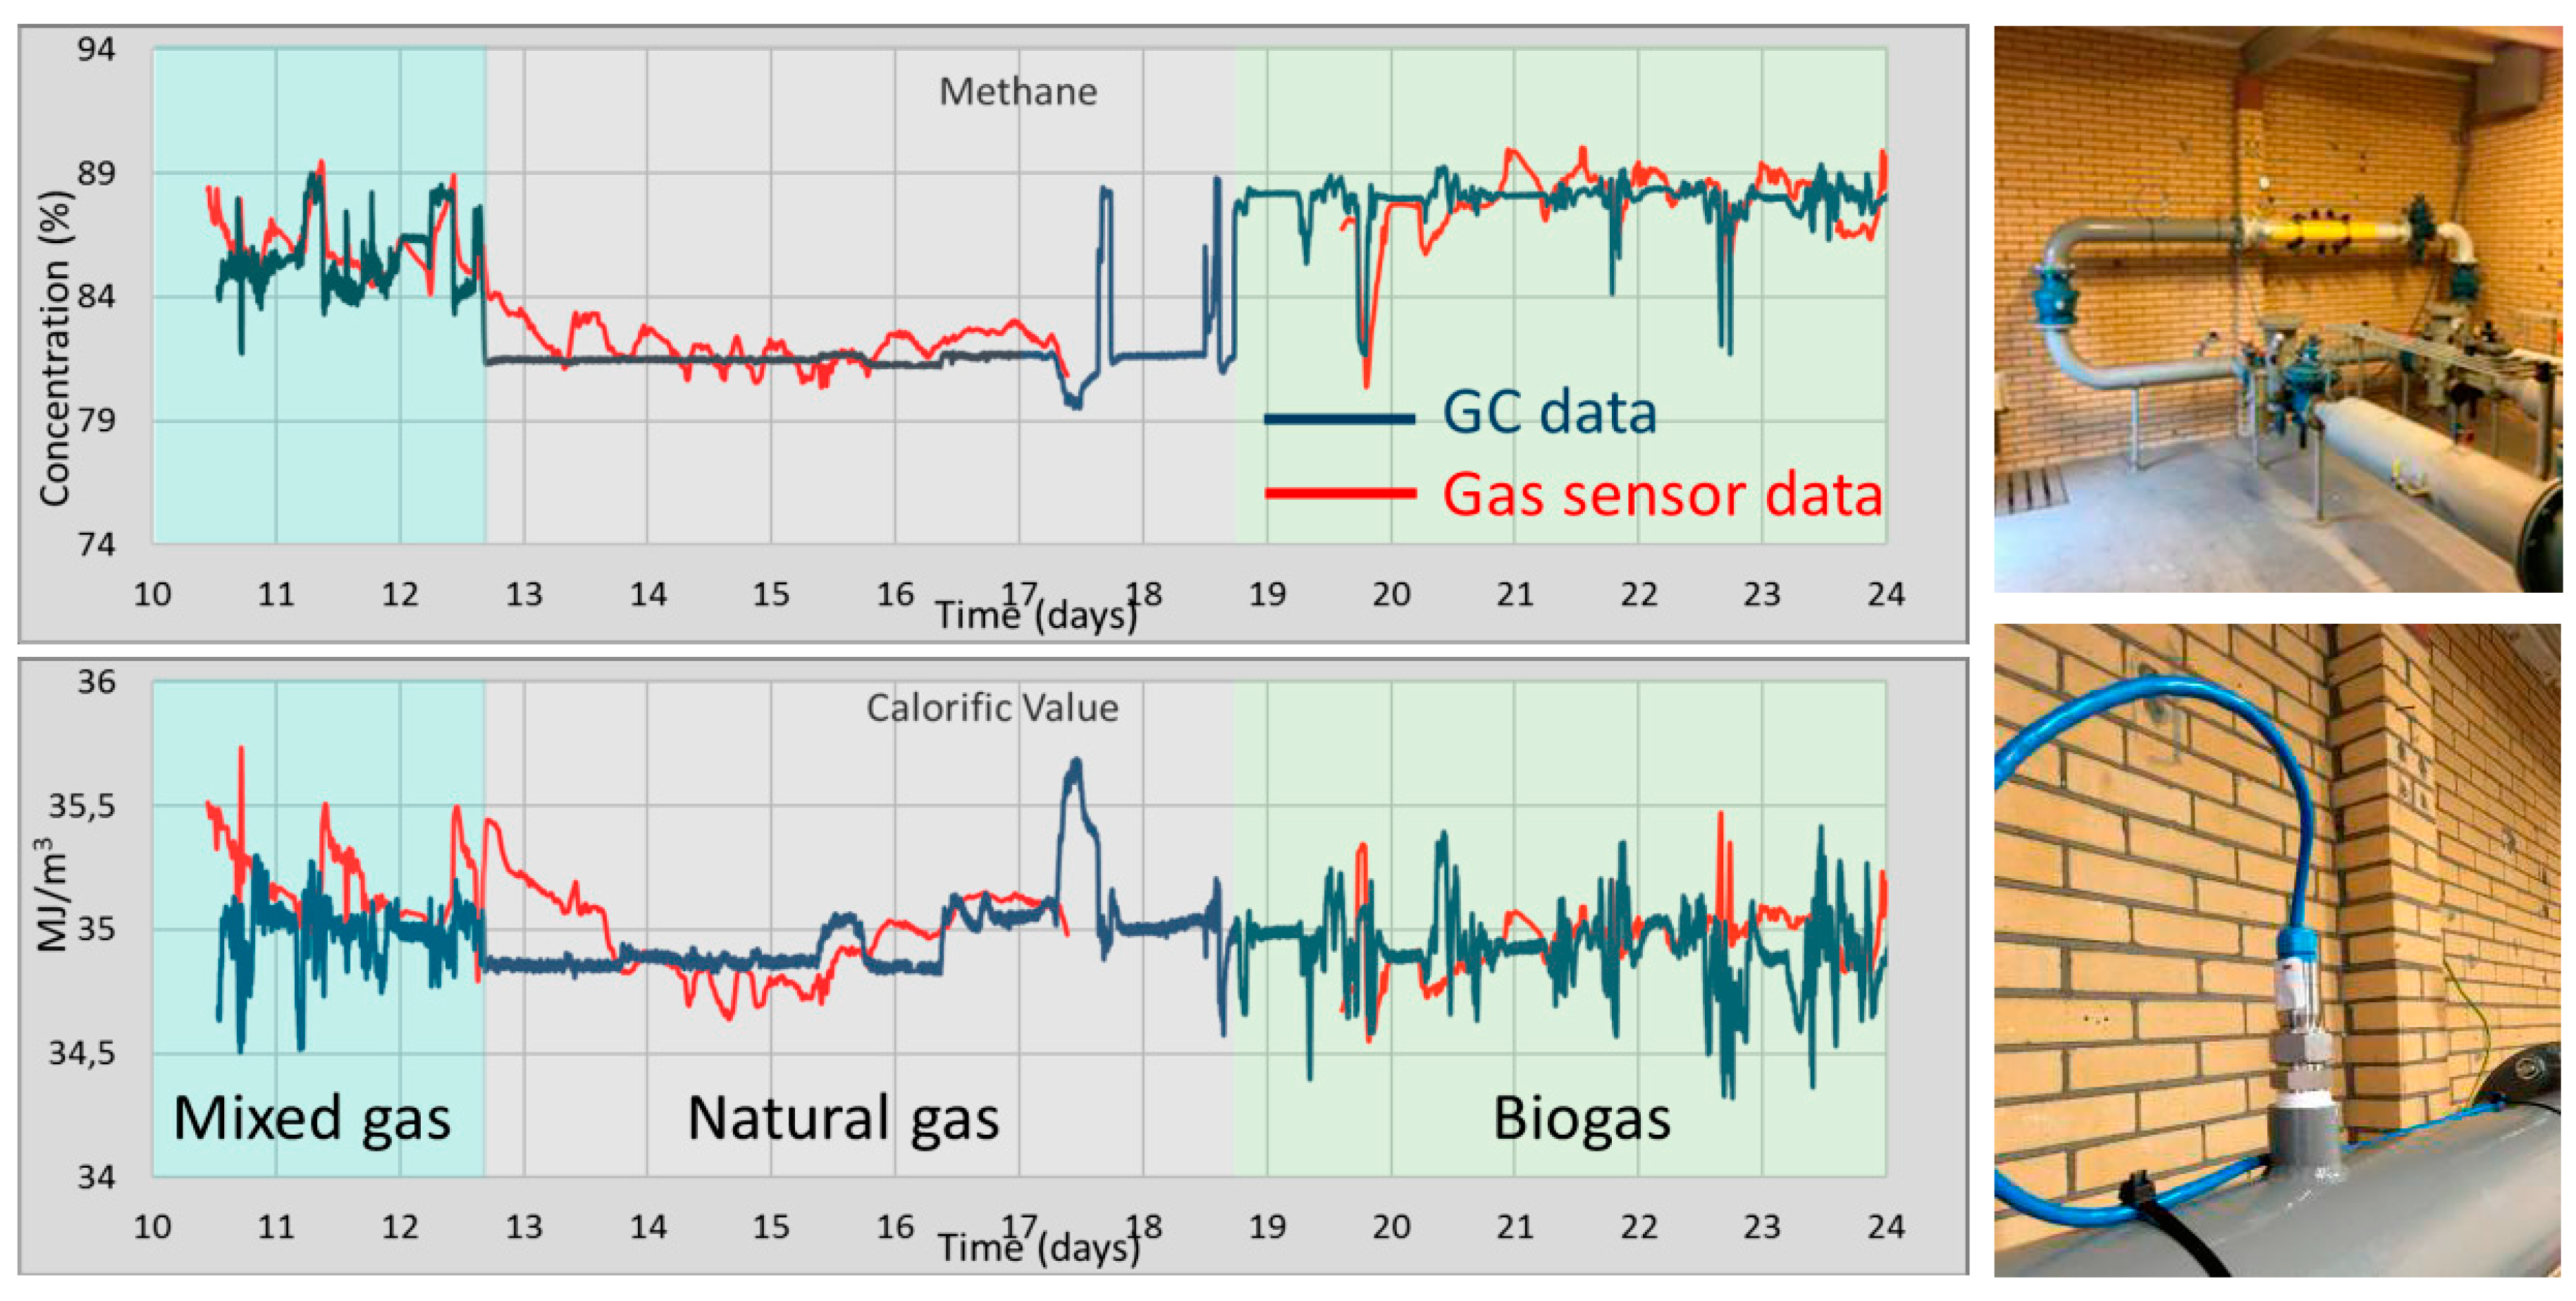
Figure 5.
Comparison of Sensor and GC data for a switch between mixed, natural and Biogas. Calorific Value is calculated from the composition (left). Installed sensor in distribution station (right).
The sensors that were installed in the gas grid were first calibrated in laboratory conditions. When installed in the gas grid, some shifting of the baseline was observed, and a correction for this shift was introduced in the data processing. For the first few days, the GC data was compared with the sensor data and used for correction of the data processing protocol. For the rest of the time (3–4 weeks), the composition and corresponding energy values were calculated from the raw data using the processing protocol. The calculated methane concentration and calorific value are plotted versus time (in days) for two weeks measurement (Figure 5). The calculated sensor data follows the GC values very nicely when changing from a mixture of biogas and natural to natural gas and finally to biogas. The differences in methane concentration between natural gas (~82 vol%) and biogas (~88 vol%) can be clearly validated. Furthermore, although the gas concentrations change significantly when switching from natural gas to biogas (e.g., biogas does not contain any higher hydrocarbons), the calculated calorific value is rather constant (~35 MJ/m3) over time, which is confirmed both in the GC as well as the sensor data. The second field test was performed only on natural gas, and resulted in a much more homogeneous gas composition over time, which was confirmed by comparing the GC results with the sensor data.
This hydrocarbon sensor will also be used for the assessment of the composition of LNG as a fuel for automotive engines. The conversion of the gas composition to a relevant number for the fuel quality (i.e., methane number), is more complex than the calorific value; the higher hydrocarbons have a larger influence on this methane number, and must therefore be measured with a higher accuracy.
4. Conclusions
It was found that the new sensor array can very well detect the changes in composition over a period of several weeks. The accuracy in the measured concentration of all gasses was well below 1 vol%. Furthermore, the calculated Calorific Value and Wobbe Index was within 0.4% of the actual values. The signal to noise ratio of the proposed micro-structured responsive coating, functionalized electronic device was over 500. When LNG is used for fuel in transportation, the quality of the fuel is quantified in the methane number, which can also be derived from the composition.
Author Contributions
A.B. designed the IDE structures, responsive coatings and data processing protocol; J.S. synthesized, formulated and applied the coatings to the chips, and performed the gas exposure experiments; H.B. has initiated the current research, and was supervising, discussing the experiments and editing the content of the paper.
Acknowledgments
This work has been supported by Bronkhorst High Tech for the integration of electronics and housing, by Venne Electronics for providing the read-out electronics, by Alliander and Enexis for providing the field test locations and test support, by Brighlands Material Center and by the Euramet LNGIII project.
Conflicts of Interest
The authors declare no conflict of interest.
References
- De Graaf, G.; Bakker, F.; Wolffenbuttel, R.F. Sensor platform for gas composition measurement. Proc. Eng. 2011, 25, 1157–1160. [Google Scholar] [CrossRef]
- Snelders, D.; Boersma, A.; De Jong, A.-J. Gas Sensor Array and Method. U.S. Patent WO2016003272, 30 June 2014. [Google Scholar]
- Boersma, A.; Sweelssen, J.; Blokland, H. Gas composition sensor for natural gas and biogas. Proc. Eng. 2016, 168, 197–200. [Google Scholar] [CrossRef]
- Clausen, C.H.; Skands, G.E.; Bertelsen, C.V.; Svendsen, W.E. Coplanar electrode layout optimized for increased sensitivity for electrical impedance spectroscopy. Micromachines 2015, 6, 110–120. [Google Scholar] [CrossRef]
- Oberänder, J.; Jildeh, Z.B.; Kirchner, P.; Wendeler, L.; Bromm, A.; Iken, H.; Wagner, P.; Keusgen, M.; Schöning, M.J. Study of interdigitated electrode arrays using experiments and finite element models for the evaluation of sterilization processes. Sensors 2015, 15, 26115–26127. [Google Scholar] [CrossRef] [PubMed]
- Snelders, D.J.M.; Valega Mackkenzie, F.O.; Boersma, A.; Peeters, R.H.M. Zeolites as coating materials for Fiber Bragg Grating chemical sensors for extreme conditions. Sens. Actuators B 2016, 235, 698–706. [Google Scholar] [CrossRef]
Publisher’s Note: MDPI stays neutral with regard to jurisdictional claims in published maps and institutional affiliations. |
© 2018 by the authors. Licensee MDPI, Basel, Switzerland. This article is an open access article distributed under the terms and conditions of the Creative Commons Attribution (CC BY) license (https://creativecommons.org/licenses/by/4.0/).