Abstract
A sensors network based on 8 stationary nodes distributed in Bari (Southern Italy) has been deployed for urban air quality monitoring during advection events of Saharan dust in the period 2015–2017. The low-cost sensor-systems have been installed in specific sites (buildings, offices, schools, streets, airport) to assess the PM10 concentration at high spatial and temporal resolution in order to supplement the expensive official air monitoring stations for citizen science purposes. Continuous measurements were performed by a cost-effective optical particle counter (PM10), including temperature and relative humidity sensors. They are operated to assess the performance during a long-term campaign (July 2015–December 2017) of 30 months for smart cities applications. The sensor data quality has been evaluated by comparison to the reference data of the 9 Air Quality Monitoring Stations (AQMS), managed by local environmental agency (ARPA-Puglia) in the Bari city.
1. Introduction
Urban air quality is a major issue for public health, especially in cities and metropolises. Many European cities do not meet the requirements for cleaner air (European Environment Agency 2017 Report) [1] including exceedance of the Ambient Air EU Directive (2008/50/EC) regulatory limits [2]. A critical environmental issue is the particulate monitoring during Saharan dust events in the urban areas, especially in the Mediterranean zone. Moreover, climate change monitoring is crucial to implement abatement strategies of greenhouse gases and CO2 emissions for a low-carbon chemical footprint in the sustainable cities [3]. In this context, new sensing technologies at low-cost and low-power consumption for urban air quality monitoring [4,5,6] are extremely demanding for decision support and enhanced environmental awareness of the citizens. The sensors network with several cost-effective sensor-nodes distributed in urban hot-spots can be a valid approach for air quality monitoring at high spatial and temporal resolution [5].
In this paper, a Wireless Sensors Network (WSN) based on low-cost particulate matter (PM10) sensors, including meteorological parameters (temperature, relative humidity), has been deployed in the Bari (Italy) city for a long-term experimental campaign such as 30 months of continuous measurements in 8 urban stationary nodes. The PM10 WSN results during Saharan dust events are presented in terms of measured concentrations compared to reference official data of the air quality monitoring stations managed by the environmental local authority (ARPA-Puglia).
2. Materials and Methods
The AIRBOX sensor-nodes using PM10 counter (PPD20V, Shinyei), distributed in hot-spots at Bari, deliver one-hour averaged data but can be configured to deliver 15 min averaged data. The sampling rate can be programmed in the range from 10 s to 60 min. An integrated General Packet Radio Service (GPRS) modem allows data transfer to a database server for post-processing. A Virtual Private Network (VPN) has been designed and implemented to monitor the remote nodes. The recorded data can be downloaded and visualized from a Global Information System (GIS) dedicated website. The sensor-node data are compared to the closest air quality monitoring station to assess the sensors performance with official reference data.
3. Results
As an example, the PM10 (μg/m3) daily mean of a typical node (Node 1-ENEL), operated in Bari, has been compared to the reference data of the all 9 AQMS by ARPA-Puglia during the Saharan dust events as certified by local environmental authority. The data are reported in Table 1. The PM10 level of the sensor node 1 exceeded the regulation limit as 50 μg/m3 during some days of the Saharan dust peak detection up to a maximum amount of 77.84 μg/m3 (23 March 2016) to be compared with the AQMS level ranging from 81 μg/m3 (ARPA-Puglia, Kennedy) to 96 μg/m3 (ARPA-Puglia, Caldarola).

Table 1.
PM10 daily mean (μg/m3) of a selected sensor node (Node 1, ENEL) versus the Air Quality Monitoring Stations (9 AQMS), managed by ARPA-Puglia, during the Saharan dust events at Bari in the period 2015-2017.
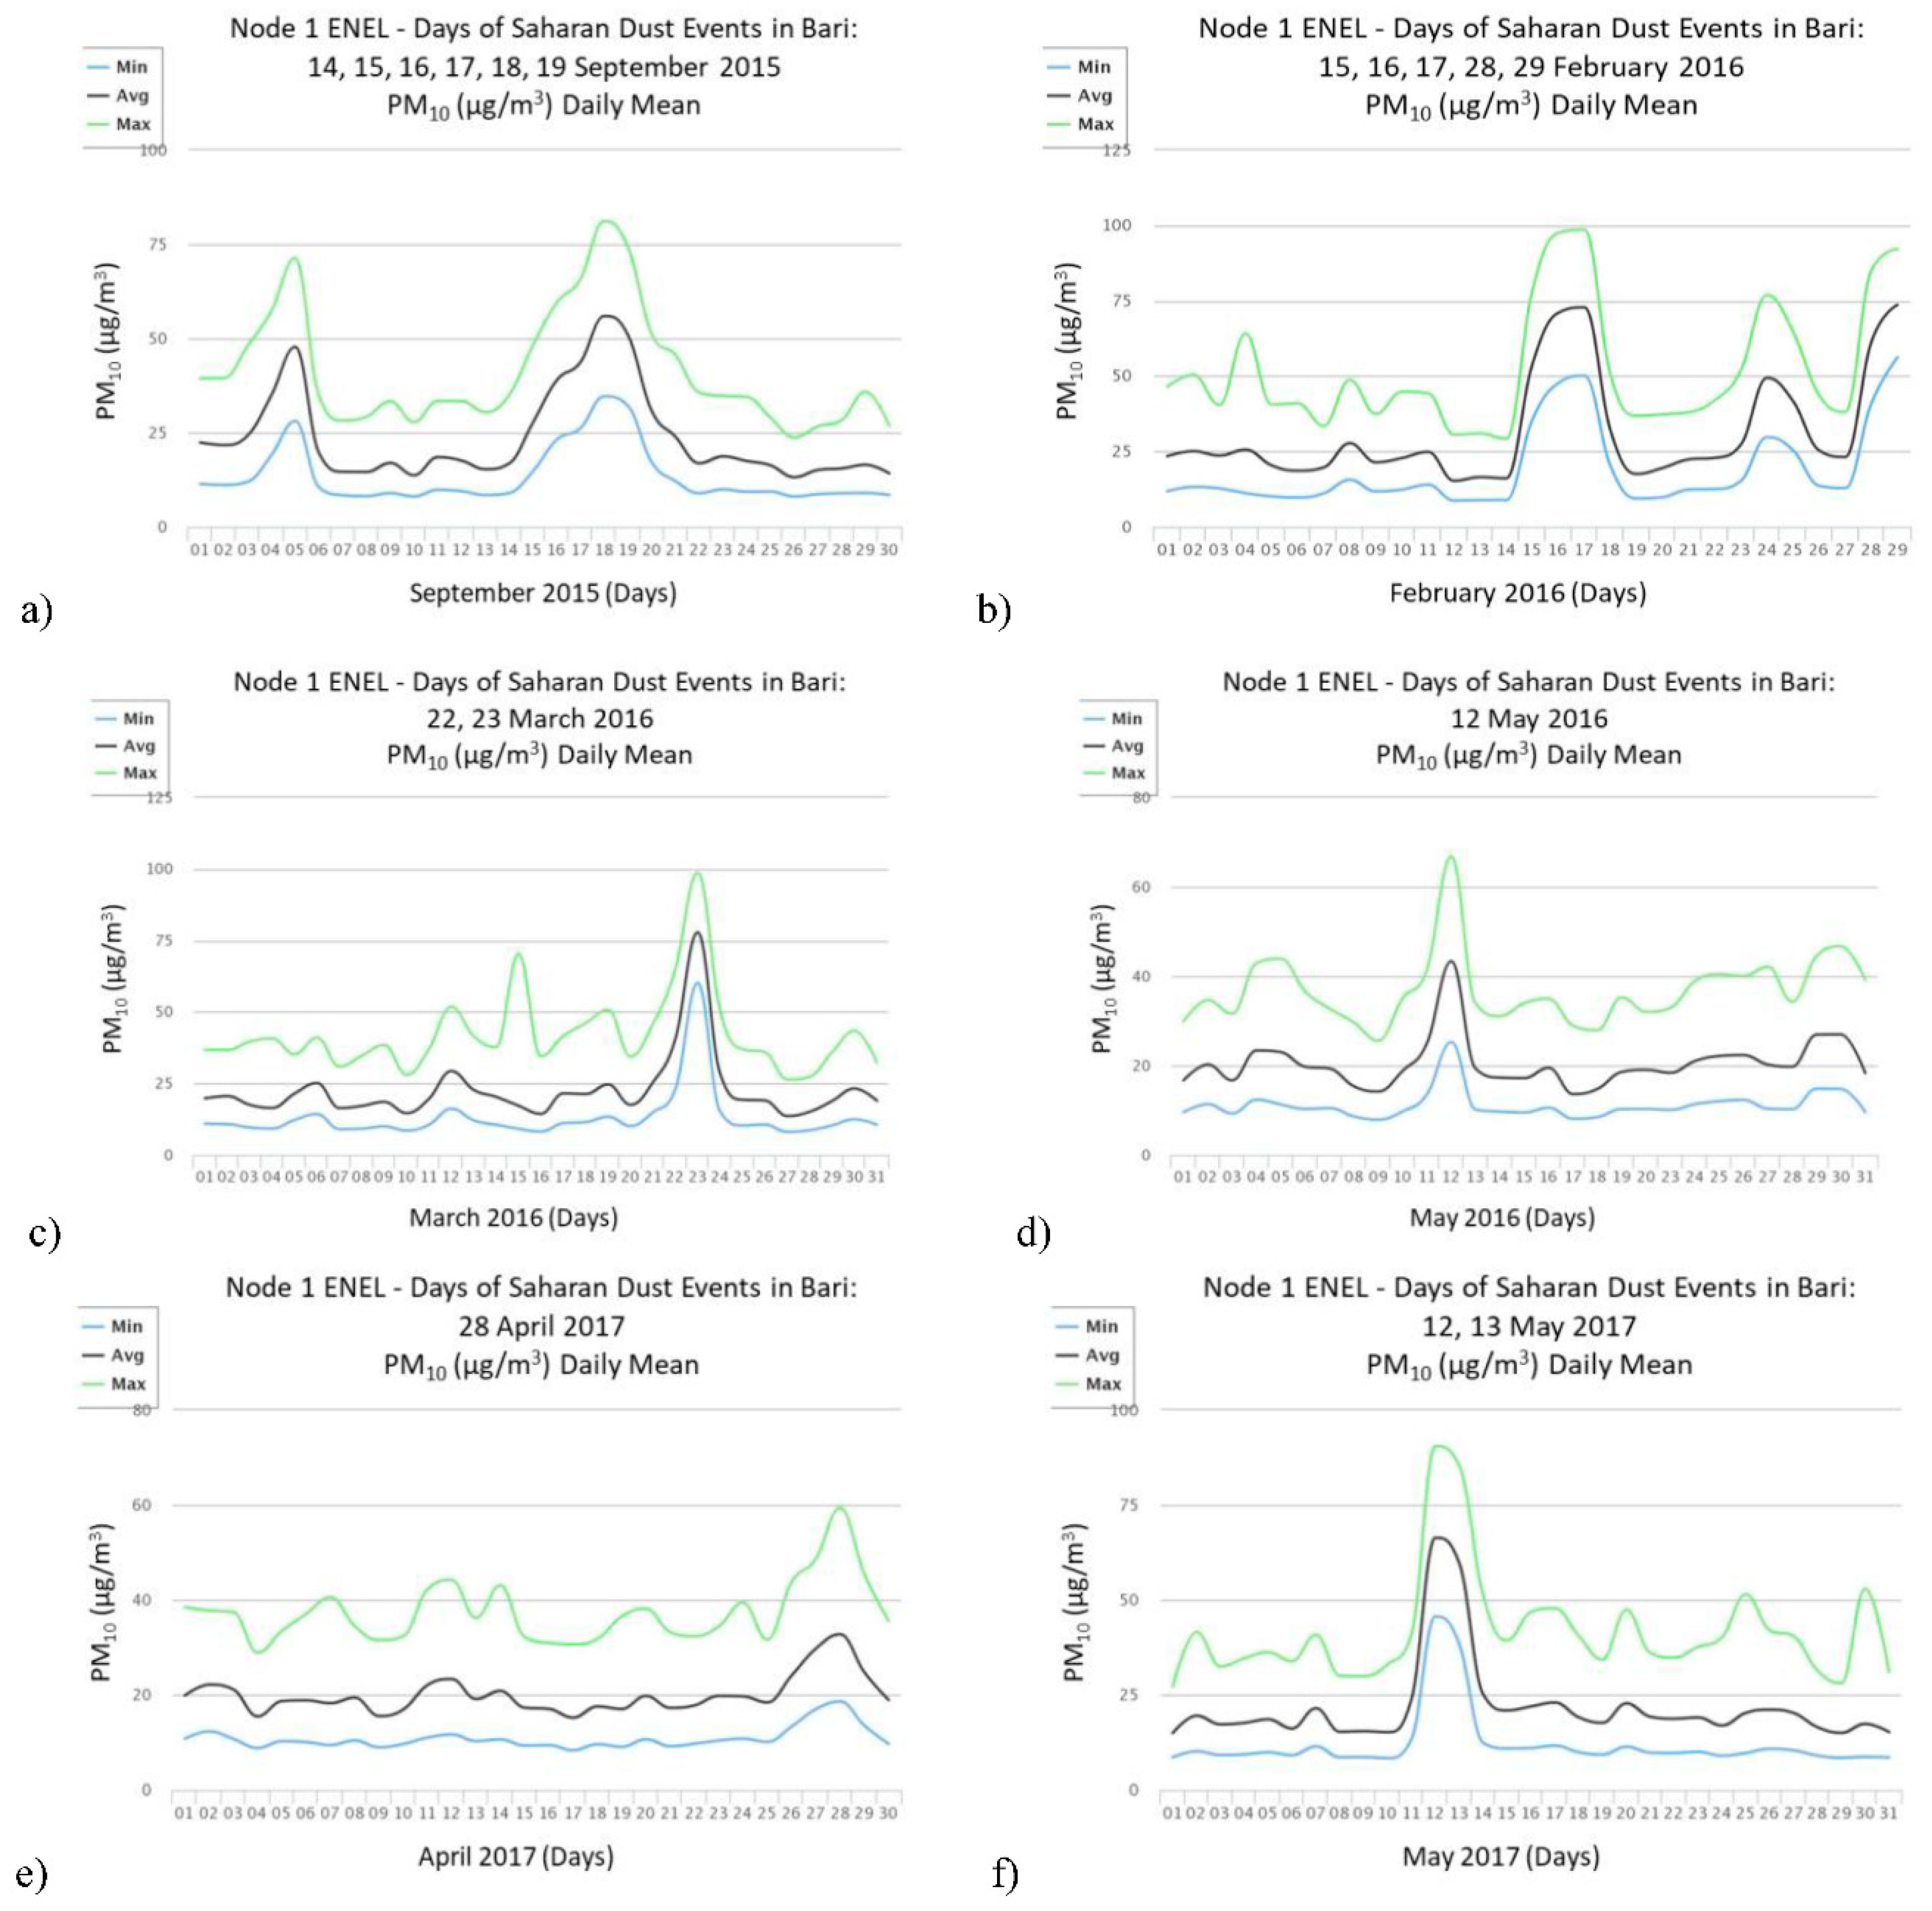
Figure 1 shows some typical PM10 daily mean trends (Min, Avg, Max) of the sensor node 1 during Saharan dust events on September 2015, February 2016, March 2016, May 2016, April 2017, and May 2017 in Bari. The determination coefficient (R2) of sensor node 1 compared to the 9 AQMS is very high ranging from 0.95 (ARPA-Puglia, Kennedy on September 2015) to 0.65 (ARPA-Puglia, EN5 on September 2015).
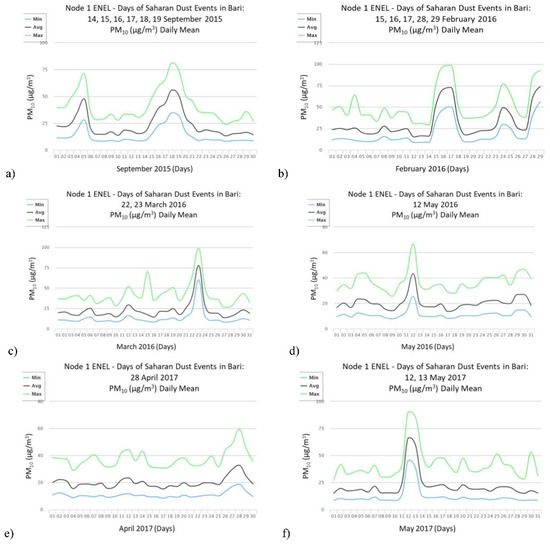
Figure 1.
PM10 daily mean (μg/m3) time-series of the sensor node (Node 1), installed on the roof of the ENEL building (Longitude East: 16.87370 and Latitude Nord: 41.11720), close to a street with daily busy traffic: (a) September 2015; (b) February 2016; (c) March 2016; (d) May 2016; (e) April 2017; (f) May 2017.
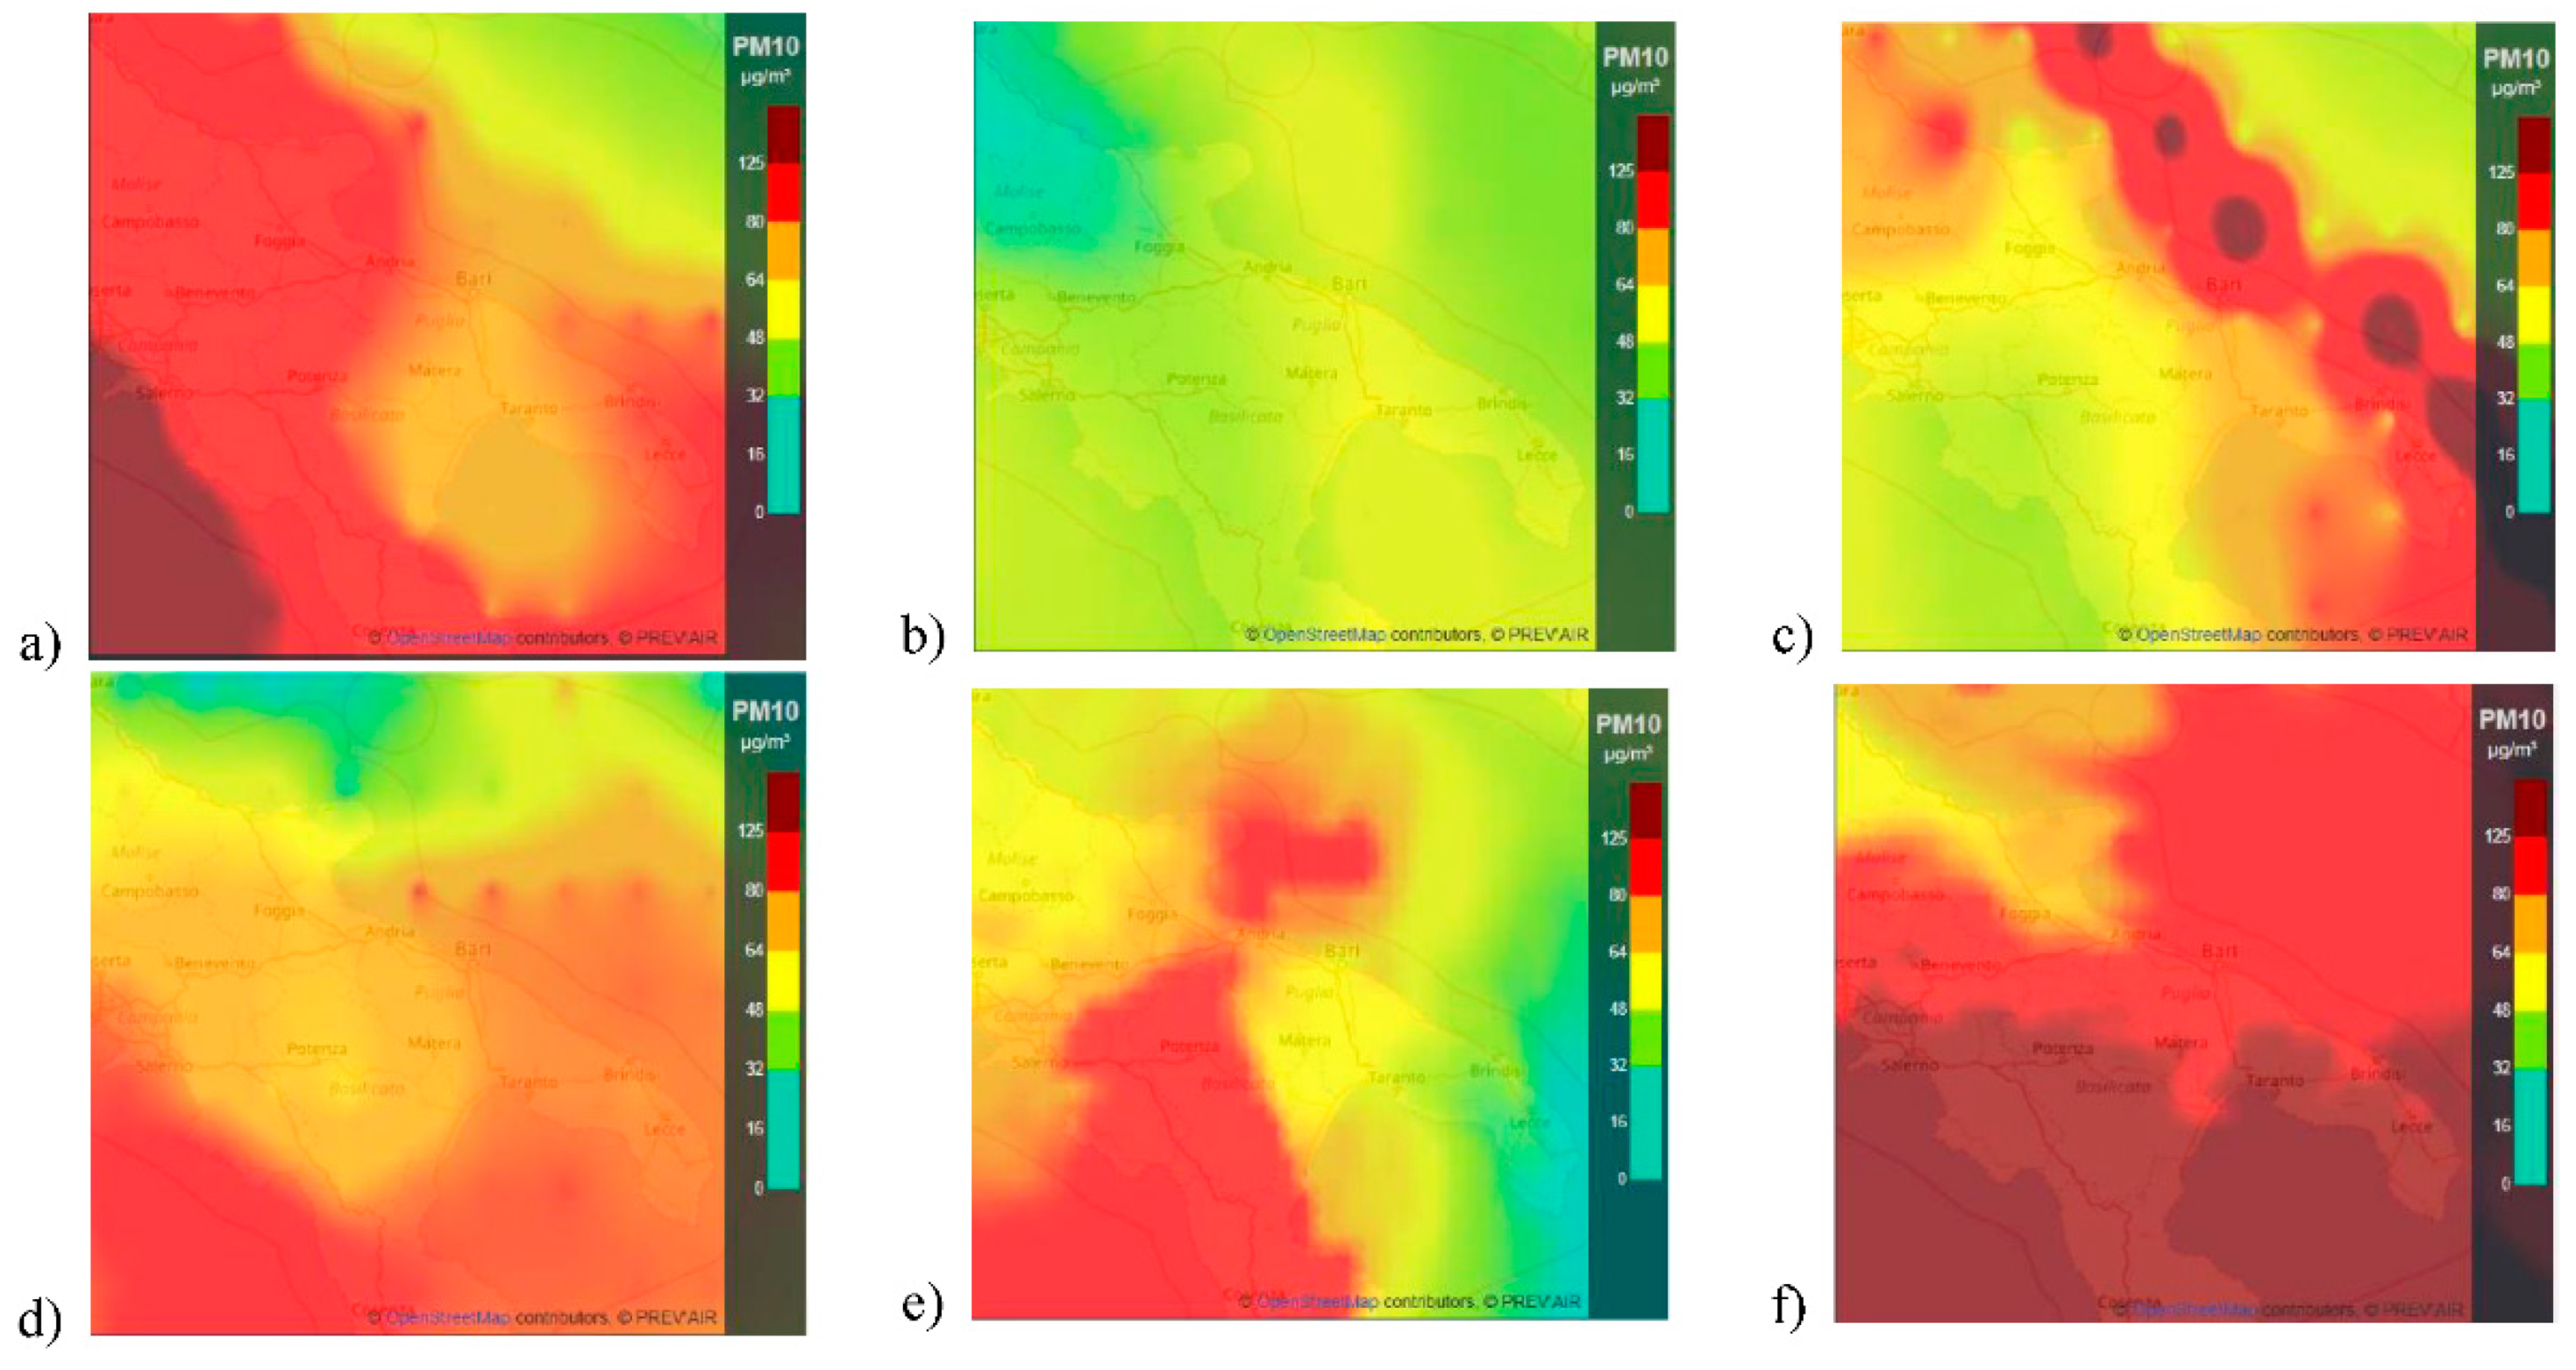
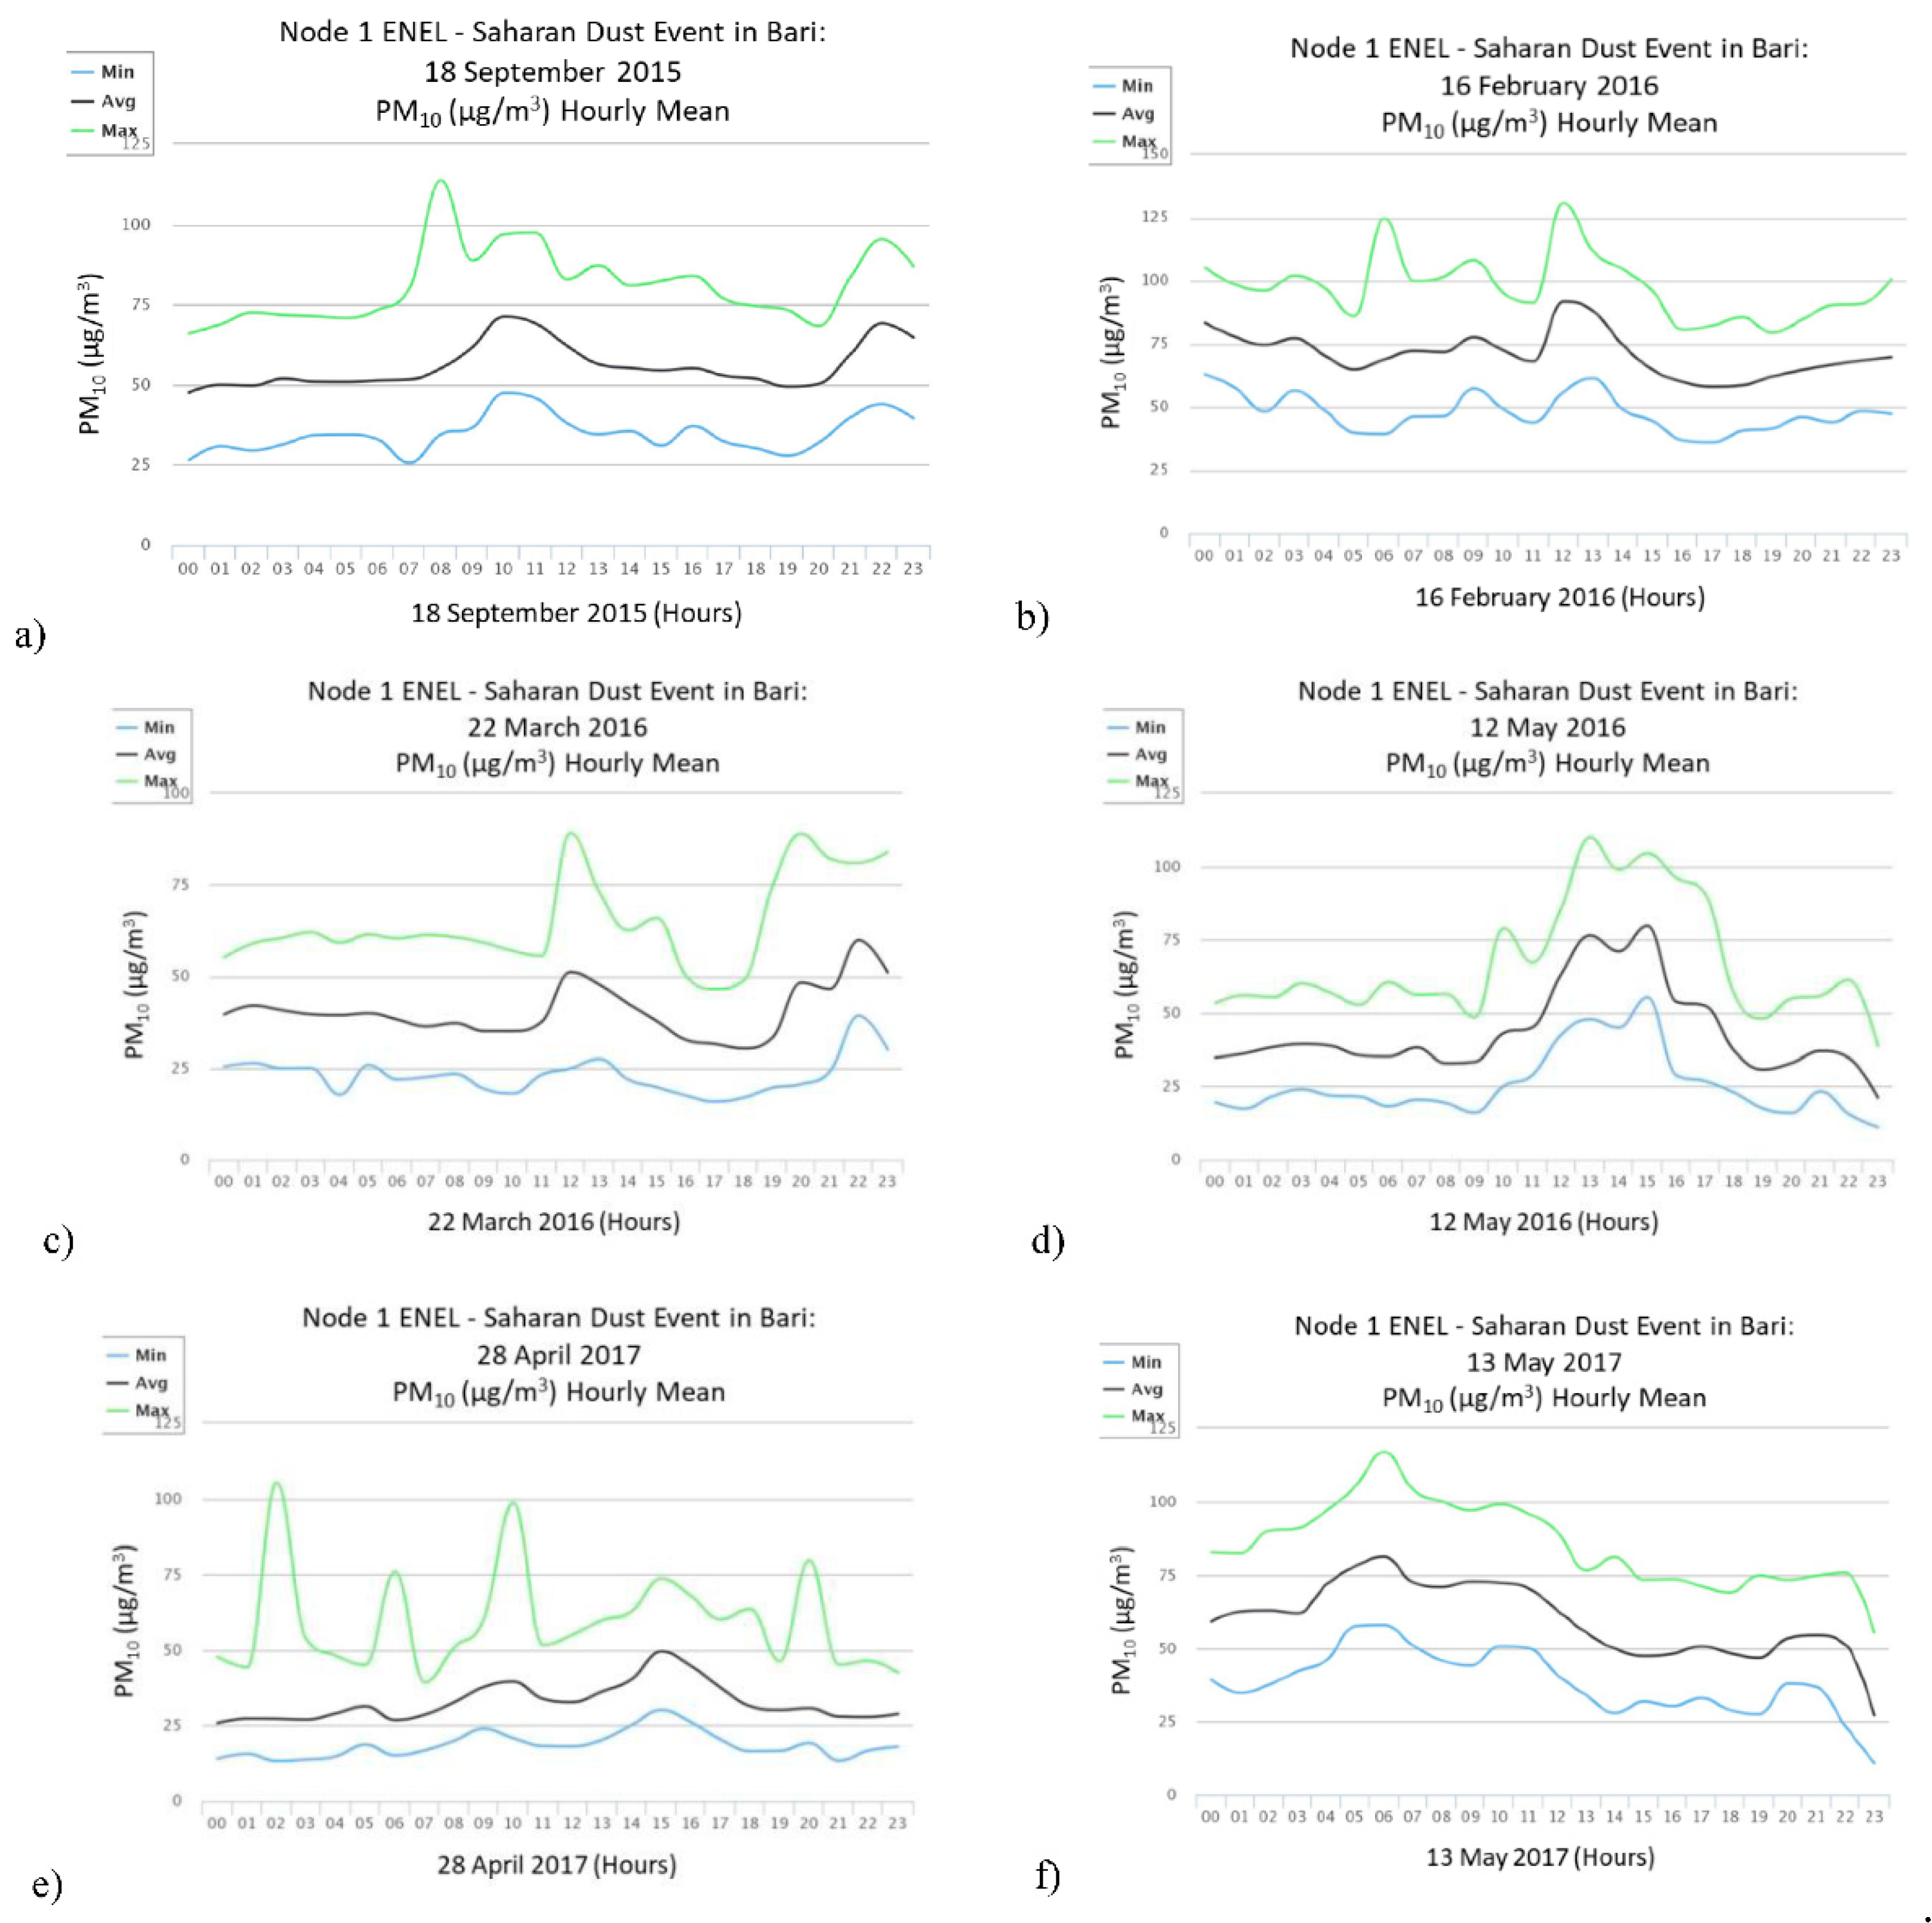
Figure 2 shows the daily mean of the PM10 simulated by PREV’AIR system (France) at global level and specialized in the Bari city during the advection events of Saharan dust in some specific days in the period 2015–2017, as certified by the local environmental authority (ARPA-Puglia). Figure 3 shows typical PM10 hourly mean trends (Min, Avg, Max) of the node 1 during Saharan dust events in Bari.

Figure 2.
PM10 daily mean (μg/m3) simulated by PREV’AIR (www2.prevair.org) predicted in Bari: (a) 18 September 2015; (b) 16 February 2016; (c) 22 March 2016; (d) 12 May 2016; (e) 28 April 2017; (f) 13 May 2017.
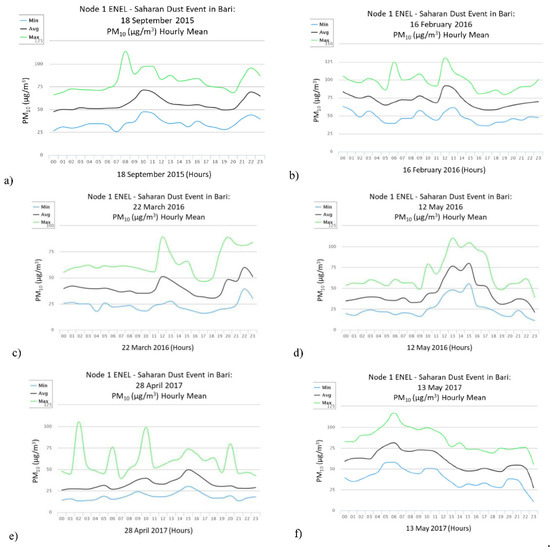
Figure 3.
PM10 hourly mean (μg/m3) time-series of the sensor node (Node 1), installed on the roof of the ENEL building (Longitude East: 16.87370 and Latitude Nord: 41.11720), close to a street with daily busy traffic in Bari: (a) 18 September 2015; (b) 16 February 2016; (c) 22 March 2016; (d) 12 May 2016; (e) 28 April 2017; (f) 13 May 2017.
4. Summary and Conclusions
The results indicate that these low-cost sensing solutions are promising for air quality monitoring in order to address the data quality objective (DQO) of the Indicative Measurements (Directive 2008/50/EC) [2] but intensive re-calibration in long-term operation is crucial for better accuracy. Co-location of low-cost sensors and reference instruments is a valid approach to improve data quality of the urban WSN. The use of the low-cost networked sensors for urban air quality monitoring is expected to grow with cloud data storage and IoT applications for smart cities.
Acknowledgments
This work was financially supported by Italian project RES-NOVAE (PON04a2_E) Networks, Buildings, Streets—New Challenging Targets for Environment and Energy funded by the Italian Ministry of High Schools, University and Research (MIUR). The authors wish to thank ARPA-Puglia for official air quality public data and ENEL, AMTAB and Aeroporti di Puglia to host a sensor-node during the campaign.
Conflicts of Interest
The authors declare no conflict of interest. The founding sponsors had no role in the design of the study; in the collection, analyses, or interpretation of data; in the writing of the manuscript, and in the decision to publish the results.
References
- European Environment Agency—Air Quality in Europe 2017 Report. 2017. Available online: https://www.eea.europa.eu/publications/air-quality-in-europe-2017.
- EU Air Quality Directive 2008/50/EC. Available online: https://eur-lex.europa.eu/legal-content/EN/TXT/PDF/?uri=CELEX:32008L0050&from=en (accessed on 25 November 2018).
- Penza, M. COST Action TD1105 - European Network on New Sensing Technologies for Air Pollution Control and Environmental Sustainability—Overview & Plans. Procedia Eng. 2015, 120, 476–479. [Google Scholar]
- Borrego, C.; Costa, A.M.; Ginja, J.; Amorim, M.; Coutinho, M.; Karatzas, K.; Sioumis, Th.; Katsifarakis, N.; Konstantinidis, K.; De Vito, S.; Penza, M.; et al. Assessment of air quality microsensors versus reference methods: The EuNetAir joint exercise. Atmos. Environ. 2016, 147, 246–263. [Google Scholar] [CrossRef]
- EuNetAir. Available online: www.cost.eunetair.it (accessed on 2 August 2018).
- Penza, M.; Suriano, D.; Pfister, V.; Prato, M.; Cassano, G. Urban air quality monitoring with networked low-cost sensor-systems. Proceedings 2017, 1, 573. [Google Scholar] [CrossRef]
Publisher’s Note: MDPI stays neutral with regard to jurisdictional claims in published maps and institutional affiliations. |
© 2018 by the authors. Licensee MDPI, Basel, Switzerland. This article is an open access article distributed under the terms and conditions of the Creative Commons Attribution (CC BY) license (https://creativecommons.org/licenses/by/4.0/).