Proceeding Paper

Estimation of PM10 Distribution using Landsat5 and Landsat8 Remote Sensing †

by
V. M. Fernández-Pacheco
1,*,
C. A. López-Sánchez
2,
E. Álvarez-Álvarez
1,
M. J. Suárez López
1,
L. García-Expósito
1,
E. Antuña Yudego
3 and
J. L. Carús-Candás
3
1
Energy Department, University of Oviedo, 33600 Oviedo, Spain
2
Biology of Organisms and Systems Department, University of Oviedo, 33600 Oviedo, Spain
3
TSK Company, Gijón 33203, Spain
*
Author to whom correspondence should be addressed.
Presented at the 2nd International Research Conference on Sustainable Energy, Engineering, Materials and Environment (IRCSEEME), Mieres, Spain, 25–27 July 2018.
Proceedings 2018, 2(23), 1430; https://doi.org/10.3390/proceedings2231430
Published: 31 October 2018

Abstract

:
Air pollution is one of the major environmental problems, especially in industrial and highly populated areas. Remote sensing image is a rich source of information with many uses. This paper is focused on estimation of air pollutants using Landsat-5 TM and Landsat-8 OLI satellite images. Particulate Matter with particle size less than 10 microns (PM10) is estimated for the study area of Principado de Asturias (Spain). When a satellite records the radiance of the surface received at sensor, does not represent the true radiance of the surface. A noise caused by Aerosol and Particulate Matters attenuate that radiance. In many applications of remote sensing, that noise called path radiance is removed during pre-processing. Instead, path radiance was used to estimate the PM10 concentration in the air. A relationship between the path radiance and PM10 measurements from ground stations has been established using Random Forest (RF) algorithm and a PM10 map was generated for the study area. The results show that PM10 estimation through satellite image is an efficient technique and it is suitable for local and regional studies.

1. Introduction

Atmospheric pollution is one of the major problems in modern society, especially in industrial and highly populated areas. Many studies show the link between air pollution and damage to human, animal, crops and water bodies [1,2]. For this reason, air quality analysis becomes highly important, especially for governments in order to use these data to design actions that reduce pollution in the air of urban areas.
When air quality studies are realized, one of the most use indicators are PM10 concentration [3,4]. Particulate Matter 10 (PM10) are particles with seize less than 10 microns. The ambient concentration of PM10 is measured through ground air quality stations that are located in strategic points. Regional administrations place these stations allowing continuous monitoring and PM10 data are collected into the European Environment Agency database. There are no spatially continuous data for PM10 measurements. For this reason, remote sensing can be used to estimate the concentration of PM10 in order to obtain spatially continuous data.
The main objective of this study is to design and validate a predictive algorithm for mapping PM10 concentration using a database of Landsat satellite images. This investigation is unique and differs from previous studies [5,6,7] in term of high data resolution. In situ measurements provided by ground quality stations have been required for algorithm validation. PM10 data have been collected simultaneously while the satellite Landsat overpass the study area.

2. Methodology

2.1. Study Area

The validation study was carried out in Principado de Asturias (Spain). Asturias has traditionally been a highly industrialized region, especially in the surroundings of the cities like Gijón and Avilés where the main steel and chemical industries are located. The monitoring of pollutants is primarily required to control that industrial emissions are within the limits set by environmental regulations. The traditional method of its measurement is by using ground stations, therefore data may be collected only for selected locations and it is not possible to obtain spatially continuous PM10 data.

2.2. Data Adquisition

The spectral data used for the study were obtained from Landsat-5 TM and Landsat-8 OLI satellite images between 2001 to 2017 (path 203, row 30). The spatial resolution of Landsat is 30 m for reflective bands, which is more accurate compared to other satellites like MODIS. Table 1 shows the equivalence between Landsat-5 TM and Landsat-8 OLI bands that have been used. The temporal resolution of Landsat is also reasonable. For this study, 38 scenes with no cloud cover were downloaded through USGS ESPA [8] on demand interface. These files are higher-level products that include top of atmosphere reflectance and surface reflectance which are atmospherically corrected using 6S method. Ground measurements of PM10 were downloaded through the European Environment Agency database for 23 selected stations that are located in Asturias.

2.3. Data Processing

The atmospheric path radiance is the result of backscattering to space by particles and molecules in the atmosphere [9]. When a satellite records the radiance of the surface received at sensor, does not represent the true radiance of the surface. Aerosol and Particulate Matters attenuate that radiance. To obtain the true radiance, the recorded values need to be corrected using the sensor calibration [10] values and then remove the noise added due to the atmospheric scattering.
In many applications of remote sensing, this noise called path radiance is removed from the image during pre-processing, so value they use is target radiance from Figure 1. Instead, this noise was used to estimate the PM10 concentration in the air. After processing remote sensing data, atmospheric path radiance was calculated for selected stations. A relationship between the path radiance and the ground station PM10 values has been established using Random Forest (RF) algorithm.
Random Forest [11] is a broadly used classification and regression non-parametric approach that consists in building an ensemble of decision trees. Bagging allows to estimate for the samples not included in the training subset, creating different subsets and fitting a tree for each one. The randomized sampling leads to increased stability and better accuracy compared to a single decision tree approach [12]. The final estimate in regression for each sample is obtained as a weighted mean of the estimates of a large number of individual trees [9]. Additionally, number of input data and multicollinearity of the data are relatively insensitive in a non-parametric approach [13].
Figure 2 shows a scheme of the methodology used in this study.

3. Results and Discussion

In this study, the Random Forest package [14] implemented in the R software [15] was used to fit the RF models by setting the number of trees to 500 and the number of features selected in each split to the square root of the total number of features.
The results were significant. Two goodness-of fit statistics were used for evaluating model performance: the relative value of the root mean squared error (rRMSE) was 25.29% and the Pseudo R2 was 0.94. Finally, the adjusted model was applied for mapping PM10 in the study area using R software [14].
The advantage of this methodology is that it can be used in any global location. It is also possible to use data from other satellites such as Sentinel or to increase the ground data with point measurements. Another work line is to use this method as a first step in a detailed simulation. Using PM10 concentration hotspots obtained by satellite images like input area in another pollution simulator software such as Aermod, Calpuff or Computer Fluid Dynamics (CFD). Currently, our studies are using this framework.

References

  1. Kampa, M.; Castanas, E. Human health effects of air pollution. Environ. Pollut. 2008, 151, 362–367. [Google Scholar] [CrossRef]
  2. Kanakiya, R.S.; Singh, S.K.; Shah, U. GIS application for spatial and temporal analysis of the air pollutants in urban area. Int. J. Adv. Remote Sens. GIS 2015, 4, 1120–1129. [Google Scholar]
  3. World Health Organization. Ait Quality Guidelines. Global Update 2005 Ed.; World Health Organization: Geneva, Switzerland, 2005. [Google Scholar]
  4. World Health Organization. Ambient (Outdoor) Air Quality and Health: Fact Sheet. 2016. Available online: http://www.who.int/mediacentre/factsheets/fs313/en/ (accessed on 31 May 2018).
  5. Emili, E.; Popp, C.; Petitta, M.; Riffler, M.; Zebisch, M. PM10 remote sensing from geostationary SEVIRI and polar-orbiting MODIS sensors over the complex terrain of the European Alpine region. Remote Sens. Environ. 2010, 114, 2485–2499. [Google Scholar] [CrossRef]
  6. Li, L.; Yang, J.; Wang, Y. Retrieval of high-resolution atmospheric particulate matter concentrations from satellite-based aerosol optical thickness over the Pearl River Delta Area, China. Remote Sens. 2015, 7, 7914–7937. [Google Scholar] [CrossRef]
  7. Lim, H.S.; MatJafri, M.Z.; Abdullah, K.; Saleh, N.M. PM10 retrieval in urban area from space. In Algorithms and Technologies for Multispectral, Hyperspectral, and Ultraspectral Imagery XIII; Shen, S.S., Lewis, P.E., Eds.; International Society for Optics and Photonics: Orlando, FL, USA, 2007; p. 65651Z. [Google Scholar]
  8. ESPA Ordering Interface. Available online: https://espa.cr.usgs.gov (accessed on 8 May 2017).
  9. Yoram, J.K. Aerosol optical thickness and atmospheric path radiance. J. Geophys. Res. 1993, 98, 2677–2692. [Google Scholar]
  10. Landsat USGS. Differences between Landsat 4–7 and Landsat 8 Surface Reflectance Algorithms. 2018. Available online: https://landsat.usgs.gov/landsat-surface-reflectance-data-products (accessed on 31 May 2018).
  11. Breiman, L. Random forests. Mach. Learn. 2001, 45, 5–32. [Google Scholar] [CrossRef]
  12. Immitzer, M.; Vuolo, F.; Atzberger, C. First Experience with Sentinel-2 Data for Crop and Tree Species Classifications in Central Europe. Remote Sens. 2016, 8, 166. [Google Scholar] [CrossRef]
  13. Gislason, P.O.; Benediktsson, J.A.; Sveinsson, J.R. Random Forests for land cover classification. Pattern Recognit. Lett. 2006, 27, 294–300. [Google Scholar] [CrossRef]
  14. Liaw, A.; Wiener, M. Classification and Regression by Random Forest. R. News 2002, 2, 18–22. [Google Scholar]
  15. R Core Team. R: A Language and Environment for Statistical Computin; R Foundation for Statistical Computing: Vienna, Austria, 2017; Available online: https://www.R-project.org/ (accessed on 31 May 2018).
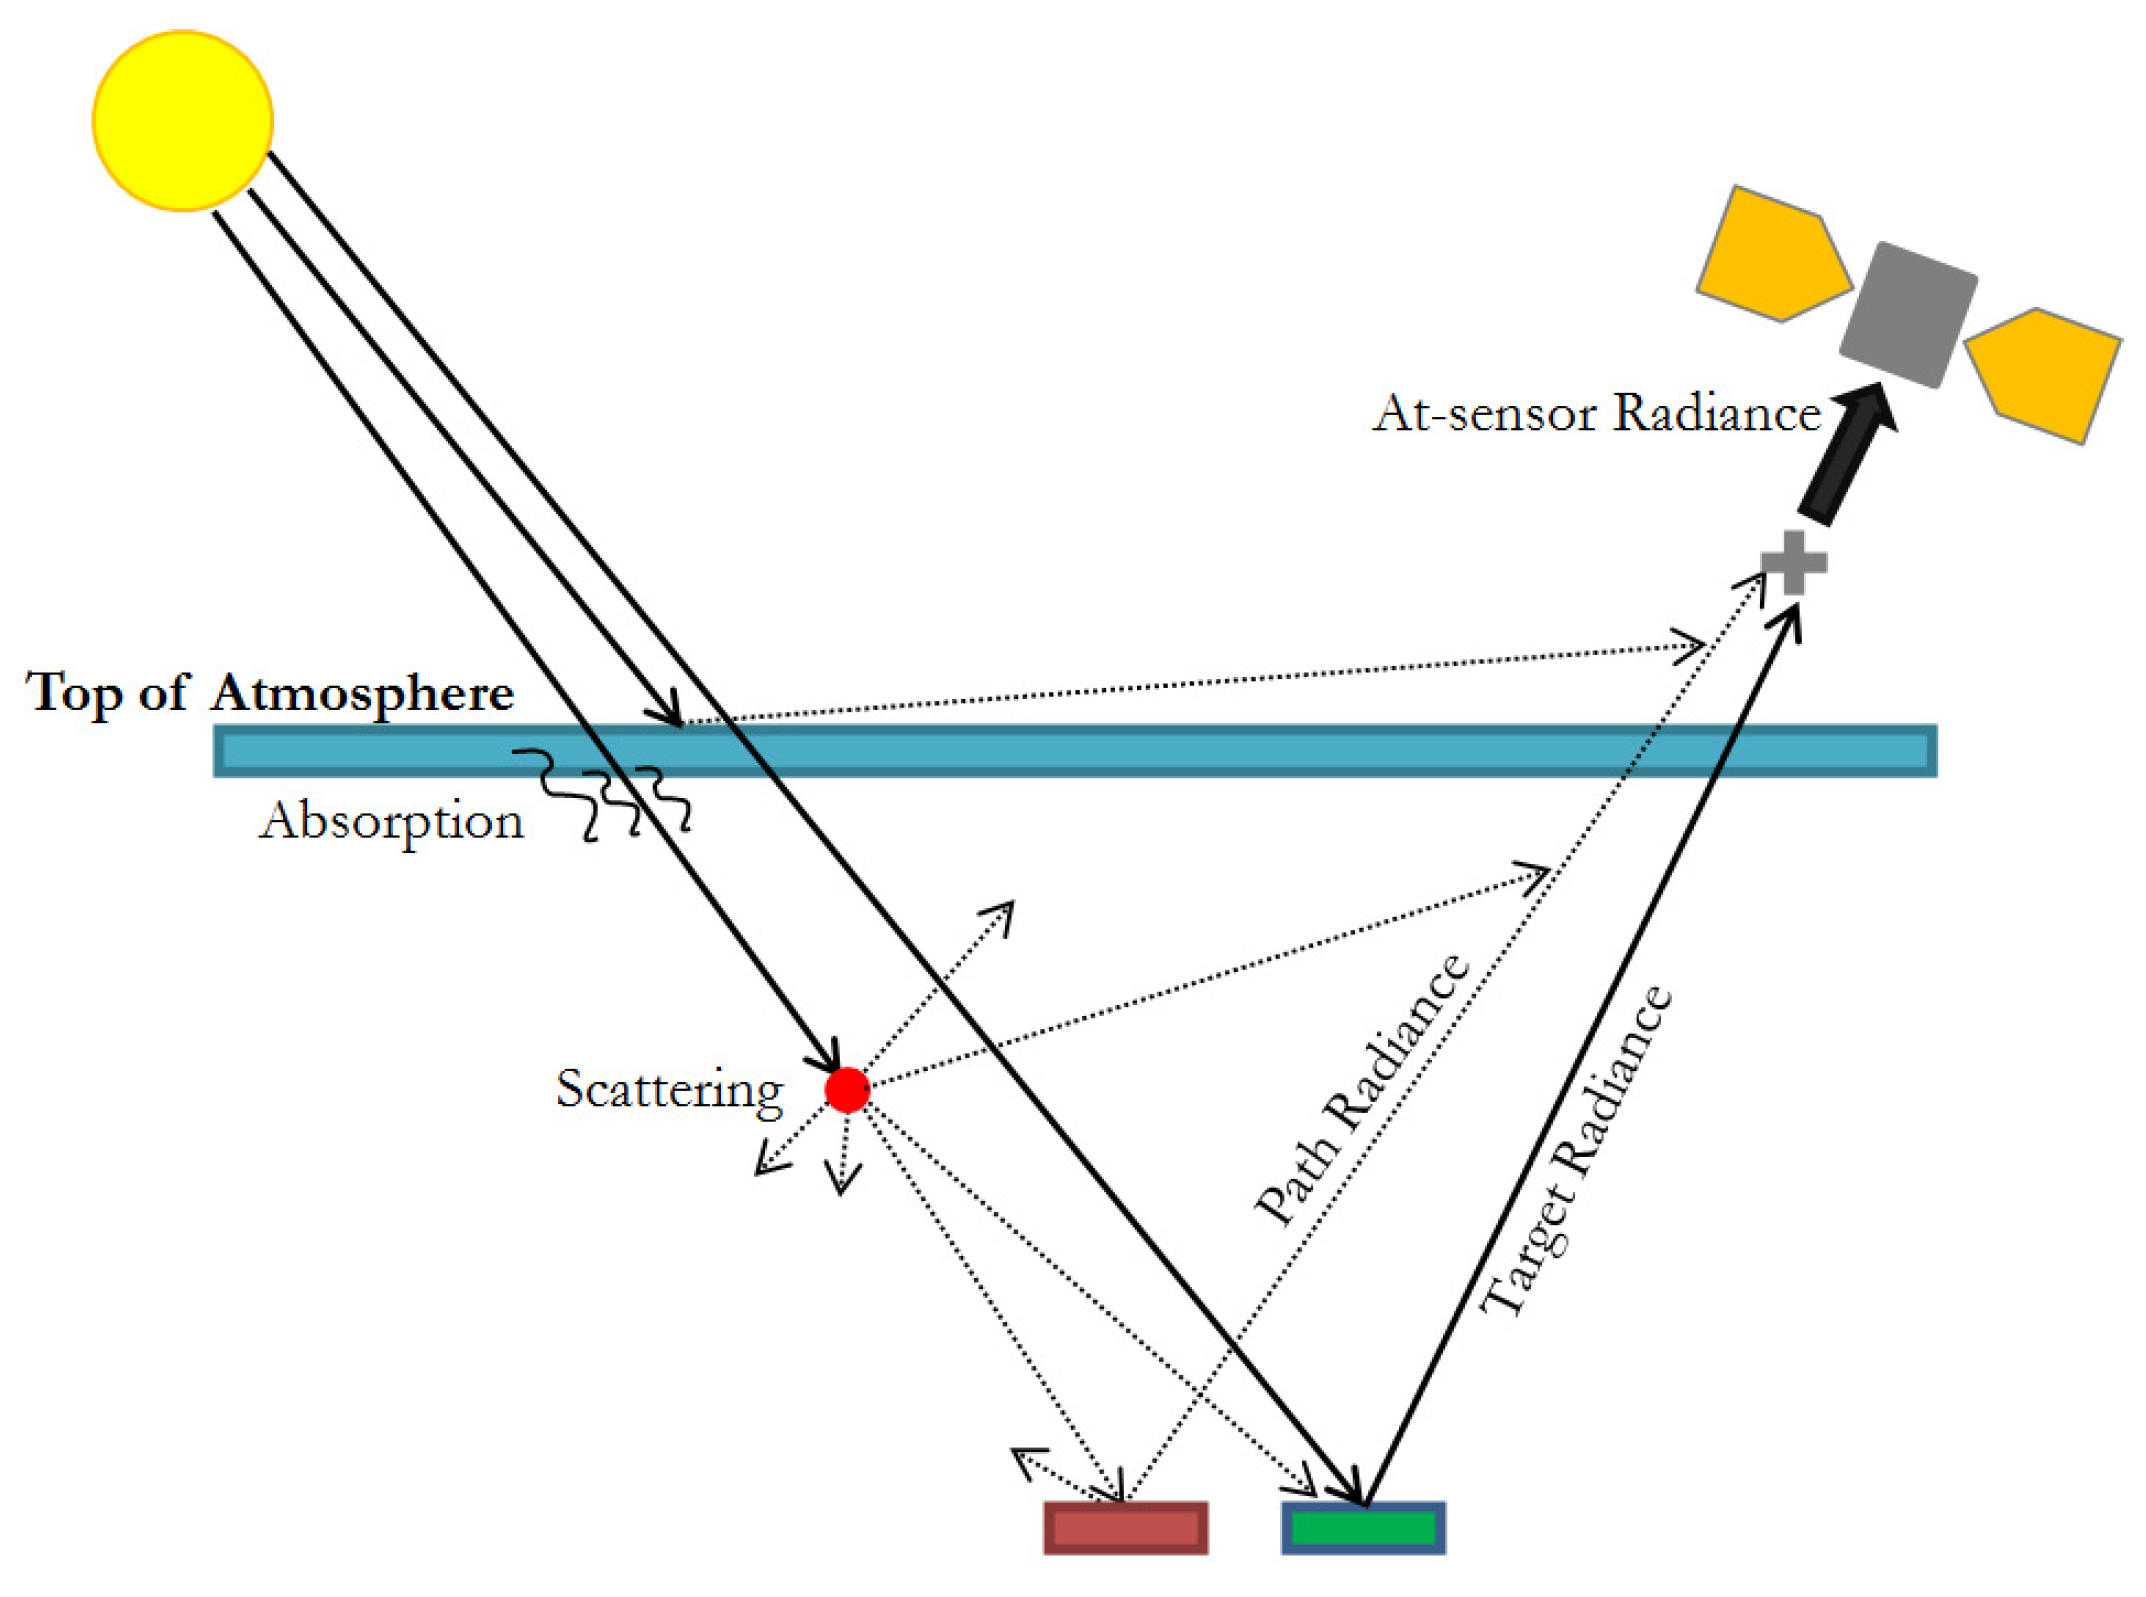
Figure 1. Scheme of how satellite sensor captures surface radiance. The difference between the target radiance and path radiance is also shown.
Proceedings 02 01430 g001
Figure 2. Steps to estimate PM10 from Landsat: (a) Data acquisition from Landsat and ground measurements; (b) Processing to obtain path radiance; (c) Using Random Forest (RF) algorithm; (d) Obtain spatially continuous PM10 mapping.
Proceedings 02 01430 g002
Table 1. Equivalence between Landsat-5 TM and Landsat-8 OLI bands. Only the bands that have been used in the study are shown.
LANDSAT-5 TMLANDSAT-8 OLI
Band (Description)Wavelength (Micrometers)Resolution (Meters)Band (Description)Wavelength (Micrometers)Resolution (Meters)
1 (Blue)0.45–0.52302 (Blue)0.45-0.5130
2 (Green0.52–0.60303 (Green0.53-0.5930
3 (Red)0.53–0.60304 (Red)0.64-0.6730
4 (Near infrared)0.76–0.90305 (Near infrared)0.85-1.8830
5 (SWIR1 1)1.55–1.75306 (SWIR 1 1)1.57-1.6530
7 (SWIR1 2)2.08–2.35307 (SWIR 1 2)2.11-2.2930
1 Short Wave InfraRed.
Publisher’s Note: MDPI stays neutral with regard to jurisdictional claims in published maps and institutional affiliations.