Abstract
This work presents the effects that ambient temperature causes on the SL900A sensor tag’s current consumption. Temperature conditions inside a metallic tray, transporting ready meal for the service food industry, are replicated through a climatic chamber whereas the current consumption is measured using a DC power analyser. Both active and data logging modes of operation have been used and the correlation between their current consumption and the temperature variation has been analysed.
1. Introduction
In recent years, the sector of catering services has increased the number of contracts up to 33% of firms or collective organizations in the EU. This represents an annual turnover of about 24 billion euro from educational institutions, healthcare and social sectors, prisons and private companies [1]. However, large economic losses appear every year at each stage of the food value chain [2,3,4,5,6,7]. In particular, Beretta et al. have pointed out that the 12.5% of the losses in the food service industry are avoidable whereas 1% might be catalogued as possible avoidable losses and the 4.5% are simply not avoidable [8]. Such avoidable losses cannot be accepted and entities such as the Food and Agriculture Organization of the United Nations (FAO) and the European Parliament (EP) have already launched several policies and initiatives [9,10].
Following to these efforts, temperature control has come up as a key factor in the distribution sector of the whole food supply chain. As a counterpart, food distribution groups frozen, fresh and even cooked food so the temperature monitoring system has to face different scenarios with unalike ambient temperature.
This variety of scenarios affects on the consumption of the electronics. In most of the electronics’ datasheet, power consumption values are given for an ambient temperature of 25 °C, which differs from the conditions of interest. As P.A. Lee pointed out [11], among others, conductivity varies together with the temperature. Whereas the conductivity at zero temperature would vanish, it rises together with the temperature, so an analysis on this effect to anticipate system autonomy issues is recommended. The scope of this work is to focus on the effect of the temperature in the ranges that concerns the ready meal delivery services.
The structure of the paper is as follows: Section 2 details the data logging system that is going to be tested. Section 3 describes the scenario conditions where the experiment is carried out. Section 4 details the experimental setup, both the configuration of the data logger and the equipment used. Finally, Section 5 draws results and main conclusions.
2. Data Logging System
The selected chip is the SL900A from AMS [12]. Although it is capable of operate in fully passive mode, it also operates in semi-passive mode (battery-assisted passive) which makes it ideal for data logging applications. In the case of the battery-assisted passive mode, both 1.5 V and 3 V power sources are accepted by the chip making the system versatile versus the constraints that can appear during a complete system design.
Regarding the monitoring, it offers the possibility of connecting a vast variety of external sensors and up to two at the same time, apart from the already built in internal temperature sensor. Pressure, humidity, color, light and any other resistive sensors can be used, after considering the constraint imposed by the chip that all sensors must be analog.
The datasheet provided by the manufacturer details the typical current consumption in each mode of operation. In Table 1, the operating modes used in this experiment will be detailed. In Section 5, the current consumption values measured will be compared and contrasted with the provided ones.

Table 1.
Modes of operation.
3. Scenario Conditions
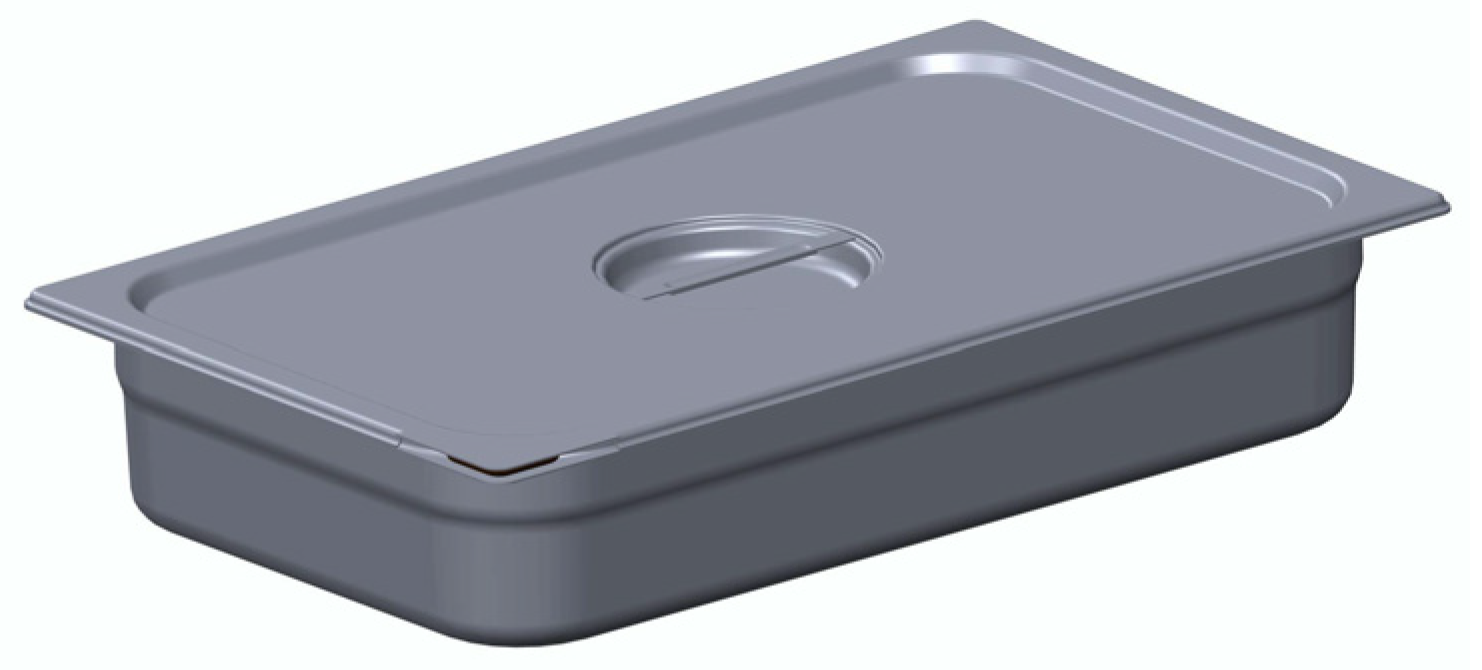
As it was pointed out, the scenario of interest concerns the ready meal delivery services. Food industry services cater cooked food in metallic trays like the shown in Figure 1, making possible to deliver it within the required temperature ranges.
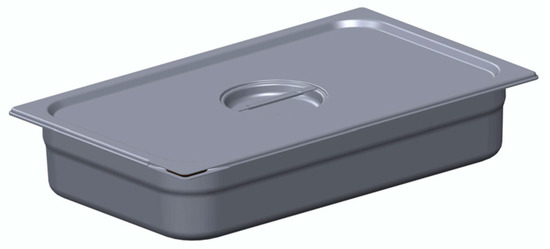
Figure 1.
Metallic tray used in food industry services.
Following to the regulations, food should be above 60 °C since it is cooked until delivered, as bacteria grow more rapidly below that temperature [13]. In order to have a detailed behaviour of the chip, it takes a measurement every minute for a total time that can vary between 4 and 6 h.
4. Experimental Setup
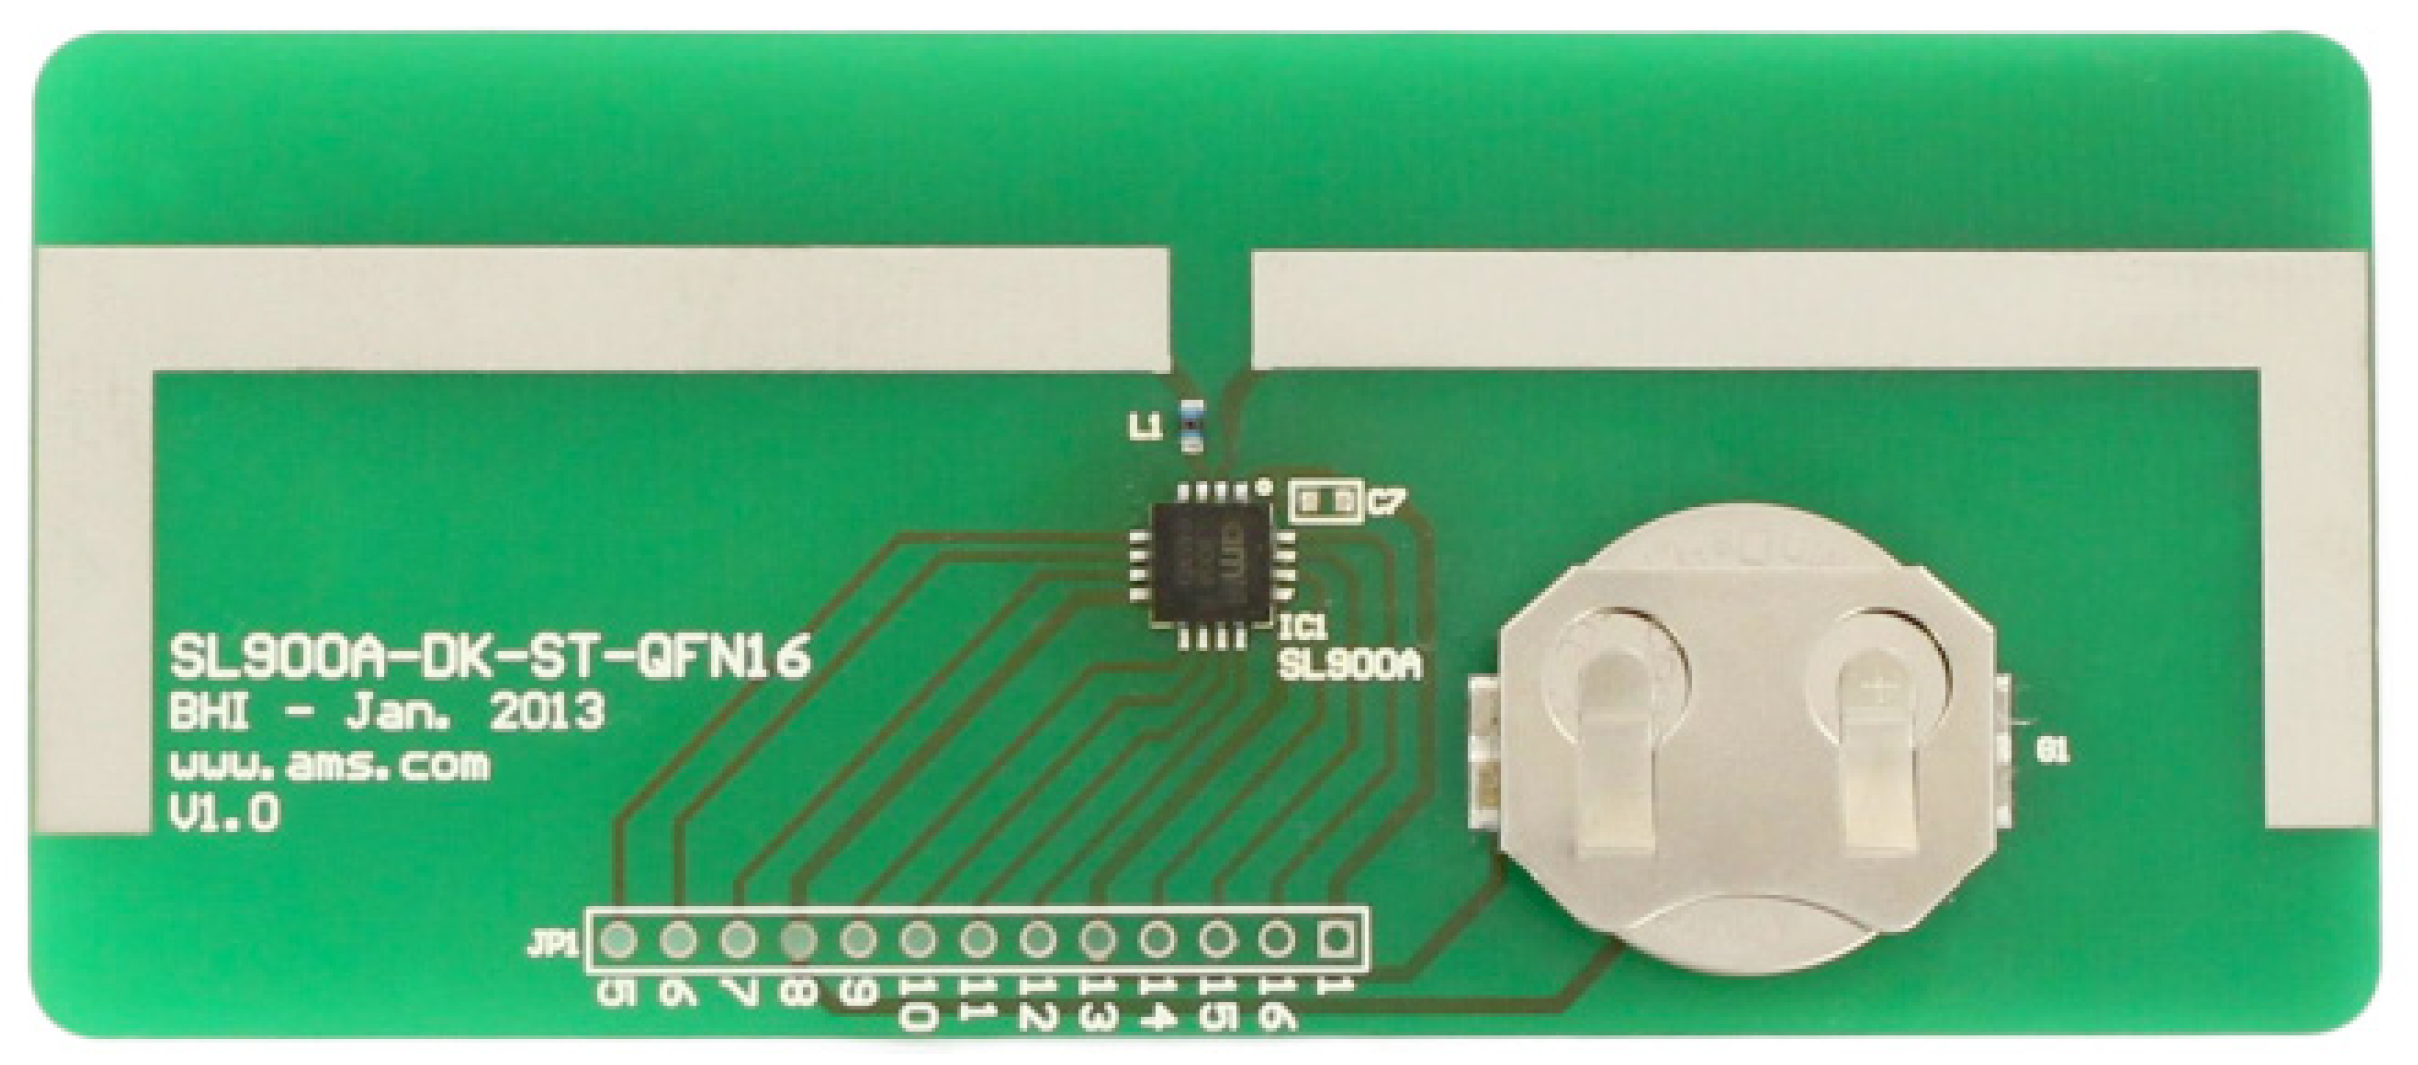
The purpose of this experiment is to measure the current consumption of the SL900A sensor tag while the temperature conditions present inside a food tray are replicated. Particularly, it has been used the SL900A evaluation board shown in Figure 2. The temperature range for the experiment is assumed to be from 25 °C to 90 °C, as it is considered that the data logging would start running at that low temperature and might reach that high temperature during specific processes.

Figure 2.
SL900A evaluation board.
Regarding the described scenario conditions, the SL900A sensor tag should be set up toward acquire temperature information in the appropriate range and resolution. For this purpose, the corresponding values of the reference voltages Vo1 and Vo2 are selected, together with the sampling frequency.
Apart from the indicated sensor tag, the equipment required to carry out the experiment is the following:
- Climatic chamber. The model used is the Excal 5424-HE from the manufacturer Climats & Sapratin. It allows performing tests from −80 °C to +200 °C with rates from 2° to 20 °C/min, which makes it ideal for the pretended experiment [14].
- DC Power Analyser. The module used is the N6781A SMU for battery drain analysis together with the N6705B device from Keysight Technologies [15,16]. This module’s resolution is up to 8 nA which supports this experiment, as the resolution is a key parameter.
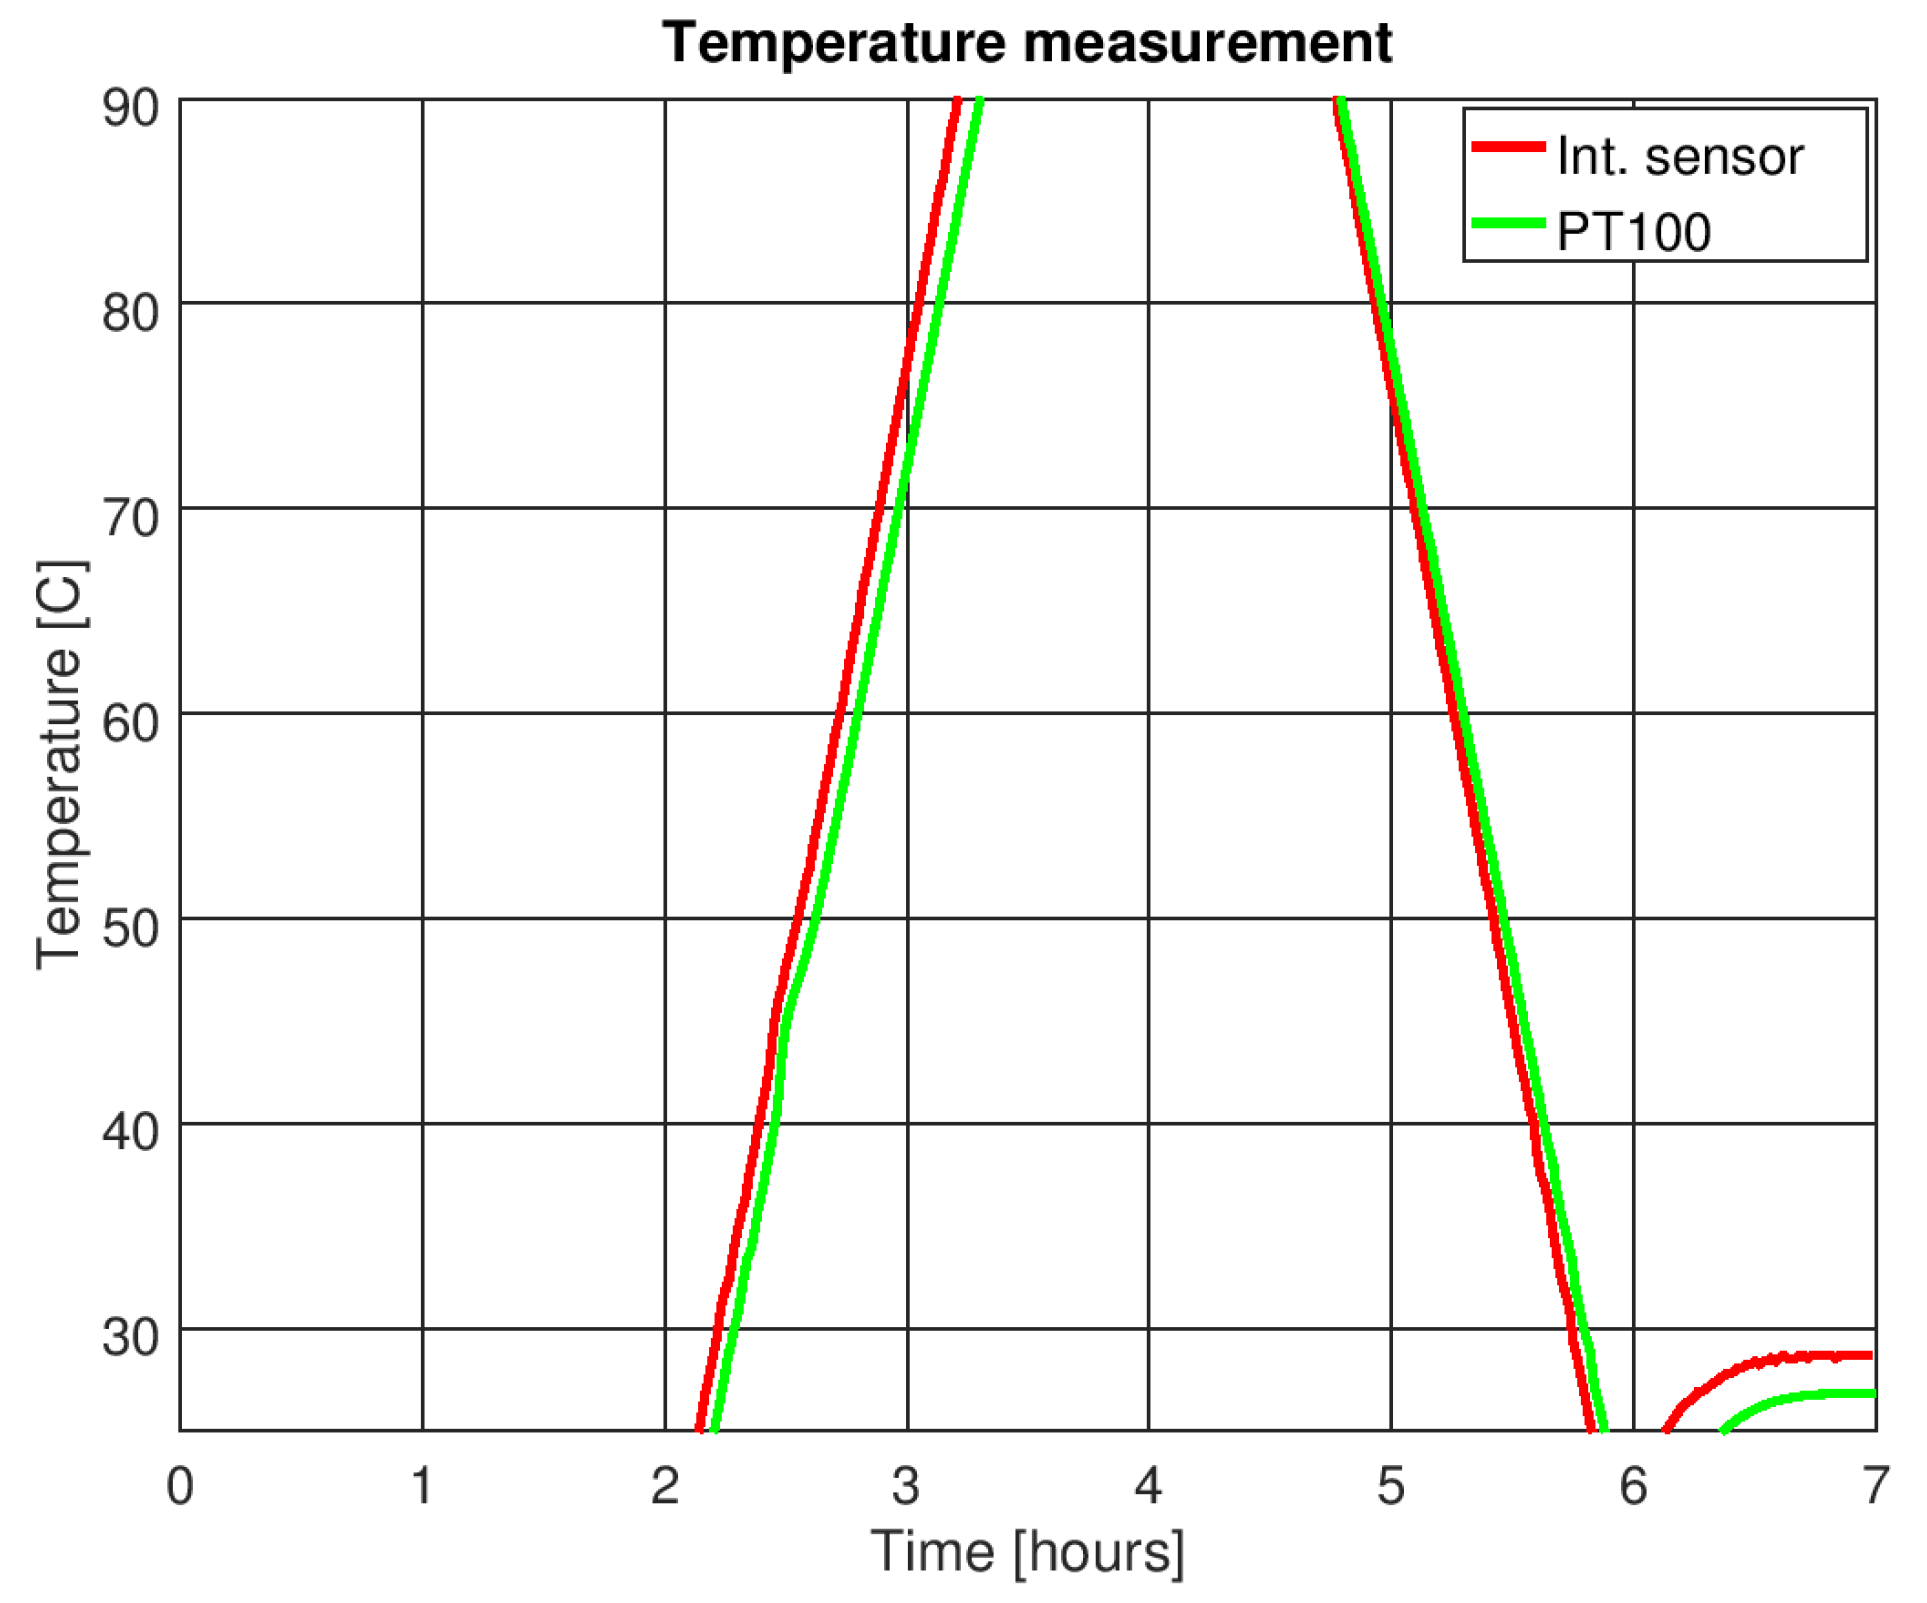
- External temperature sensor. A commercial standard ceramic Pt-100 was used.
The comparison between Pt-100 and internal sensor measurements is showed in Figure 3.
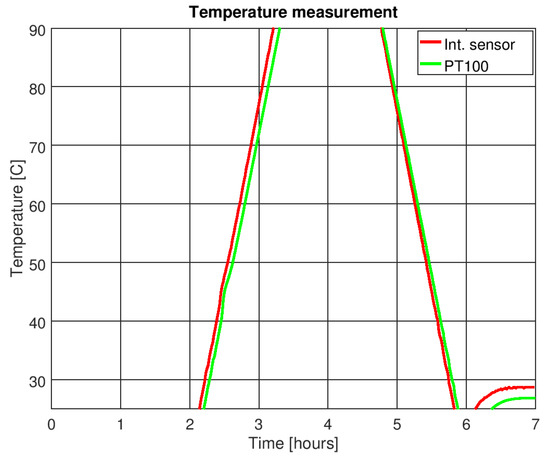
Figure 3.
Temperature measurement comparison between SL900A internal sensor and PT100 sensor.
5. Results and Conclusions
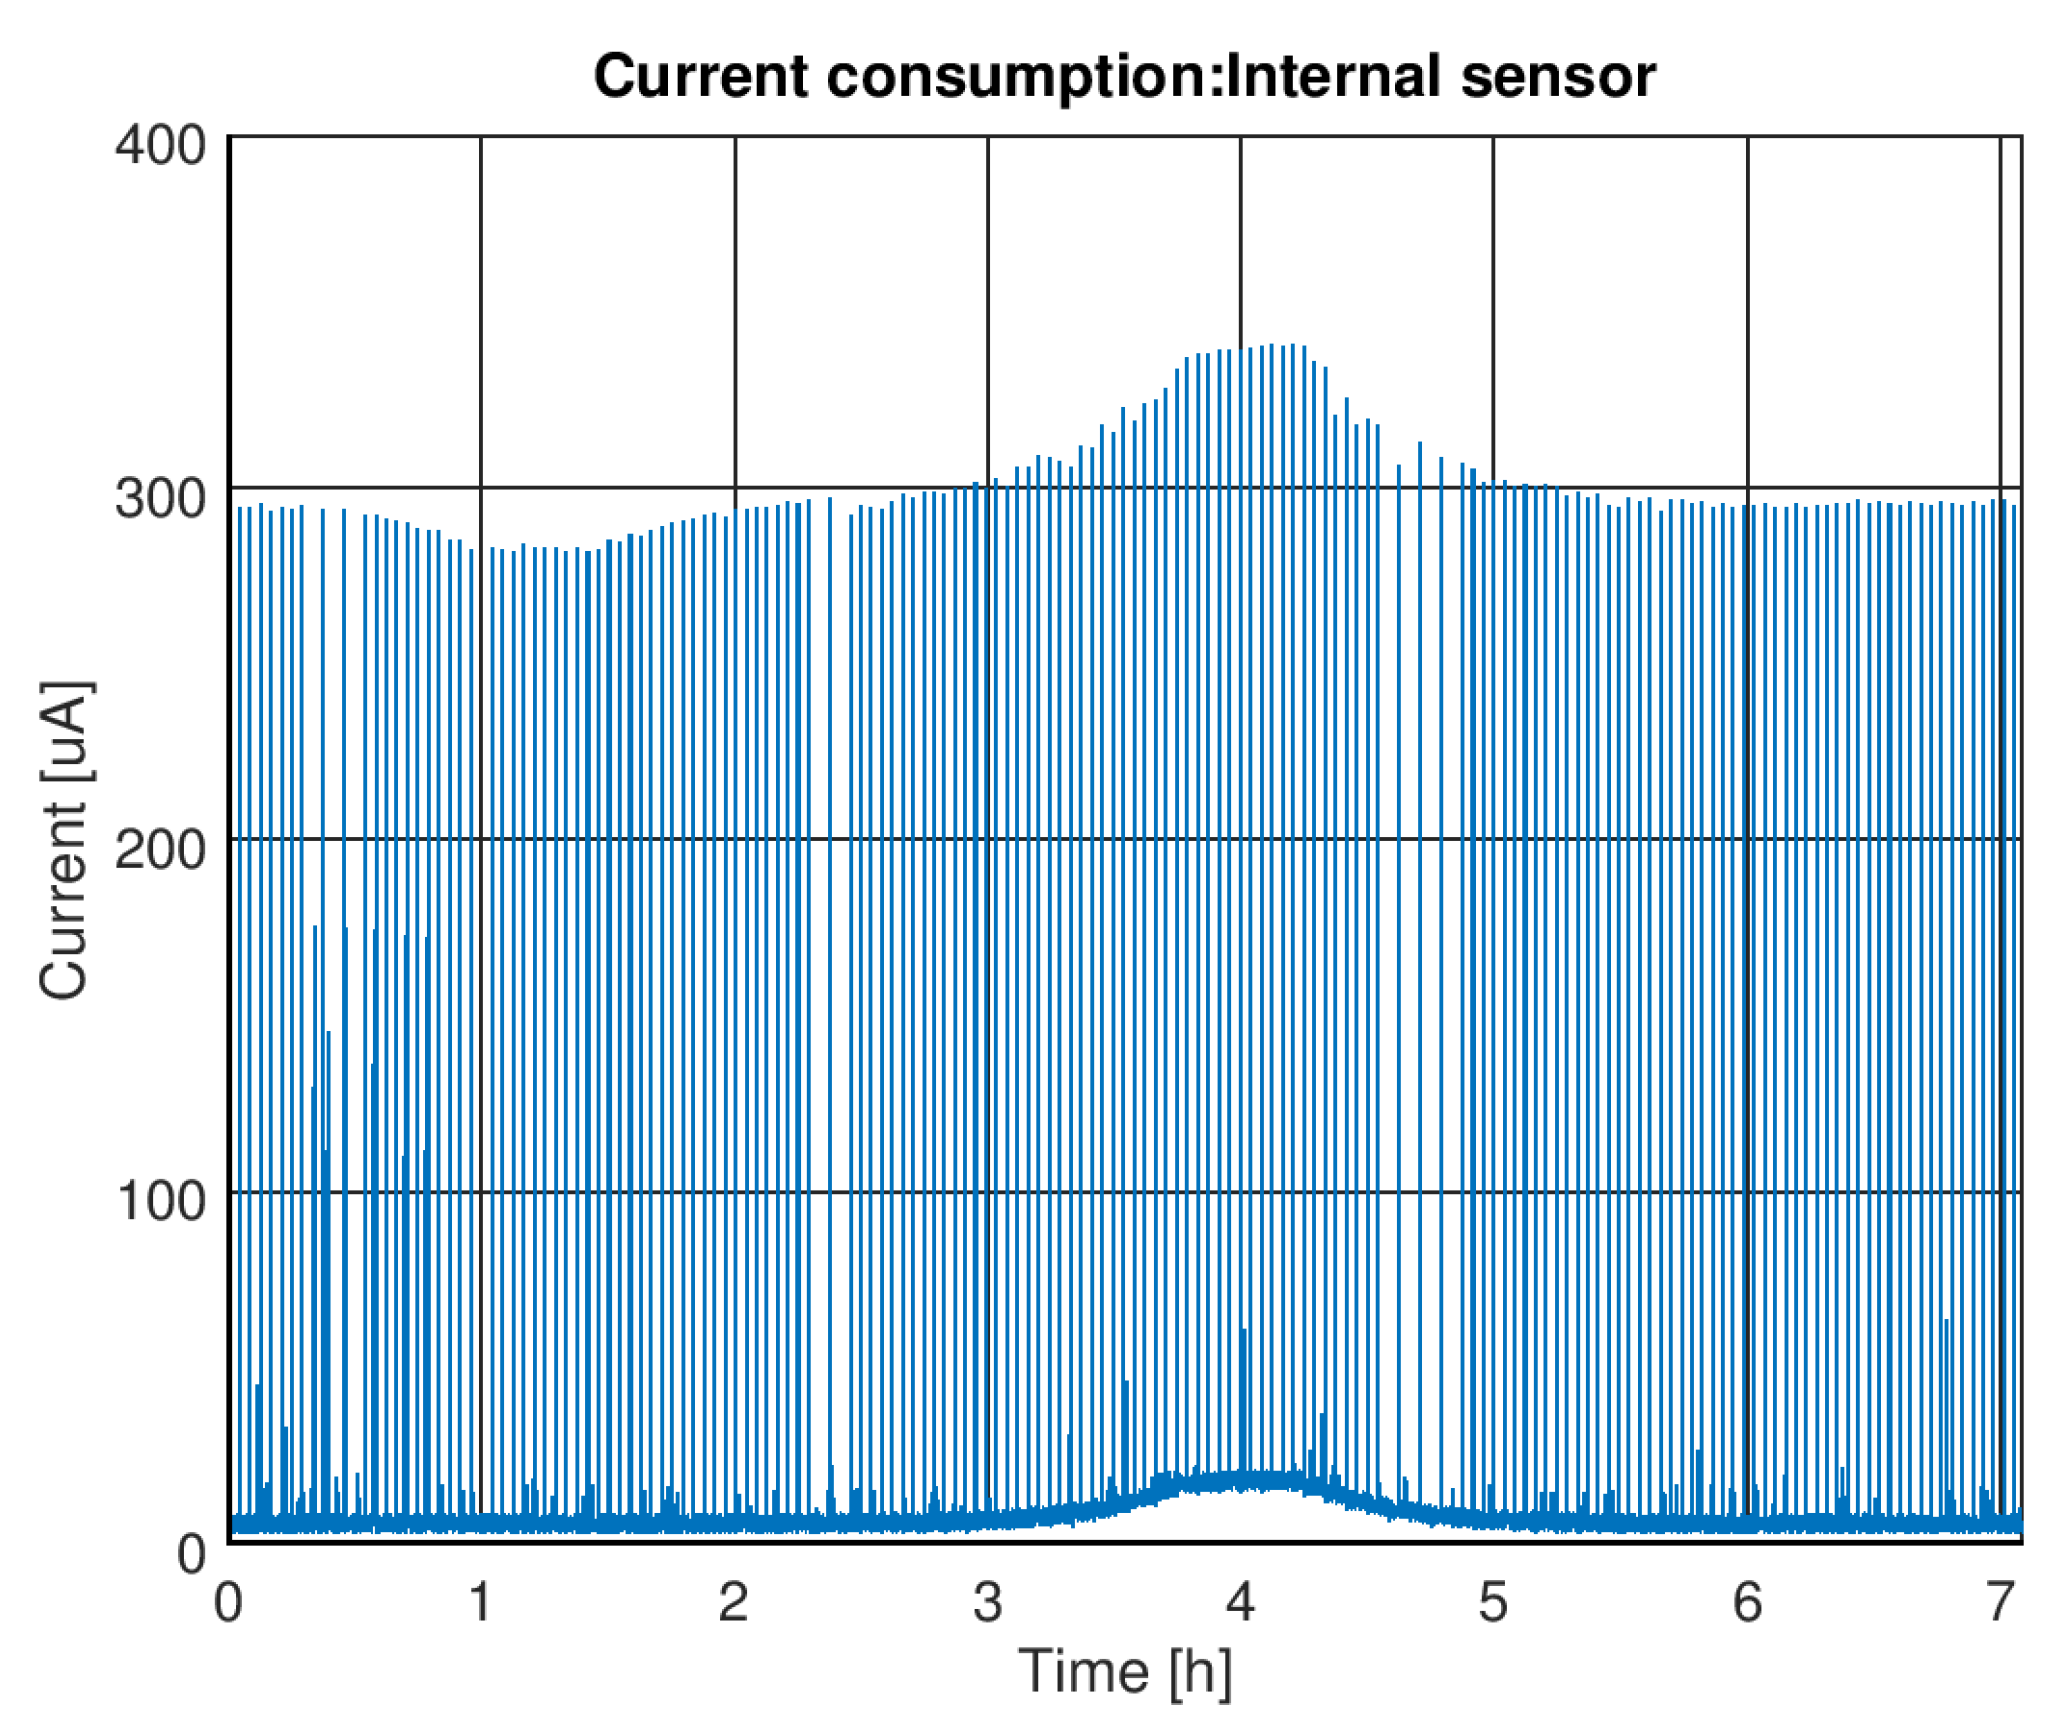
The current consumption of the sensor tag for a 7 h running time is shown in Figure 4. It can be distinguished the peaks of current consumption when each measurement is made and recorded, every minute, and the current consumption in active mode, when the sensor is on stand-by and only the RTC is running. Furthermore, both modes’ current consumption are higher than the indicated ones at the datasheet and showed in Table 1.

Figure 4.
Current consumption of the SL900A sensor tag.
However, an important variation on the current consumption is recorded over the time, which corresponds with the rise and fall of the temperature inside the climatic chamber.
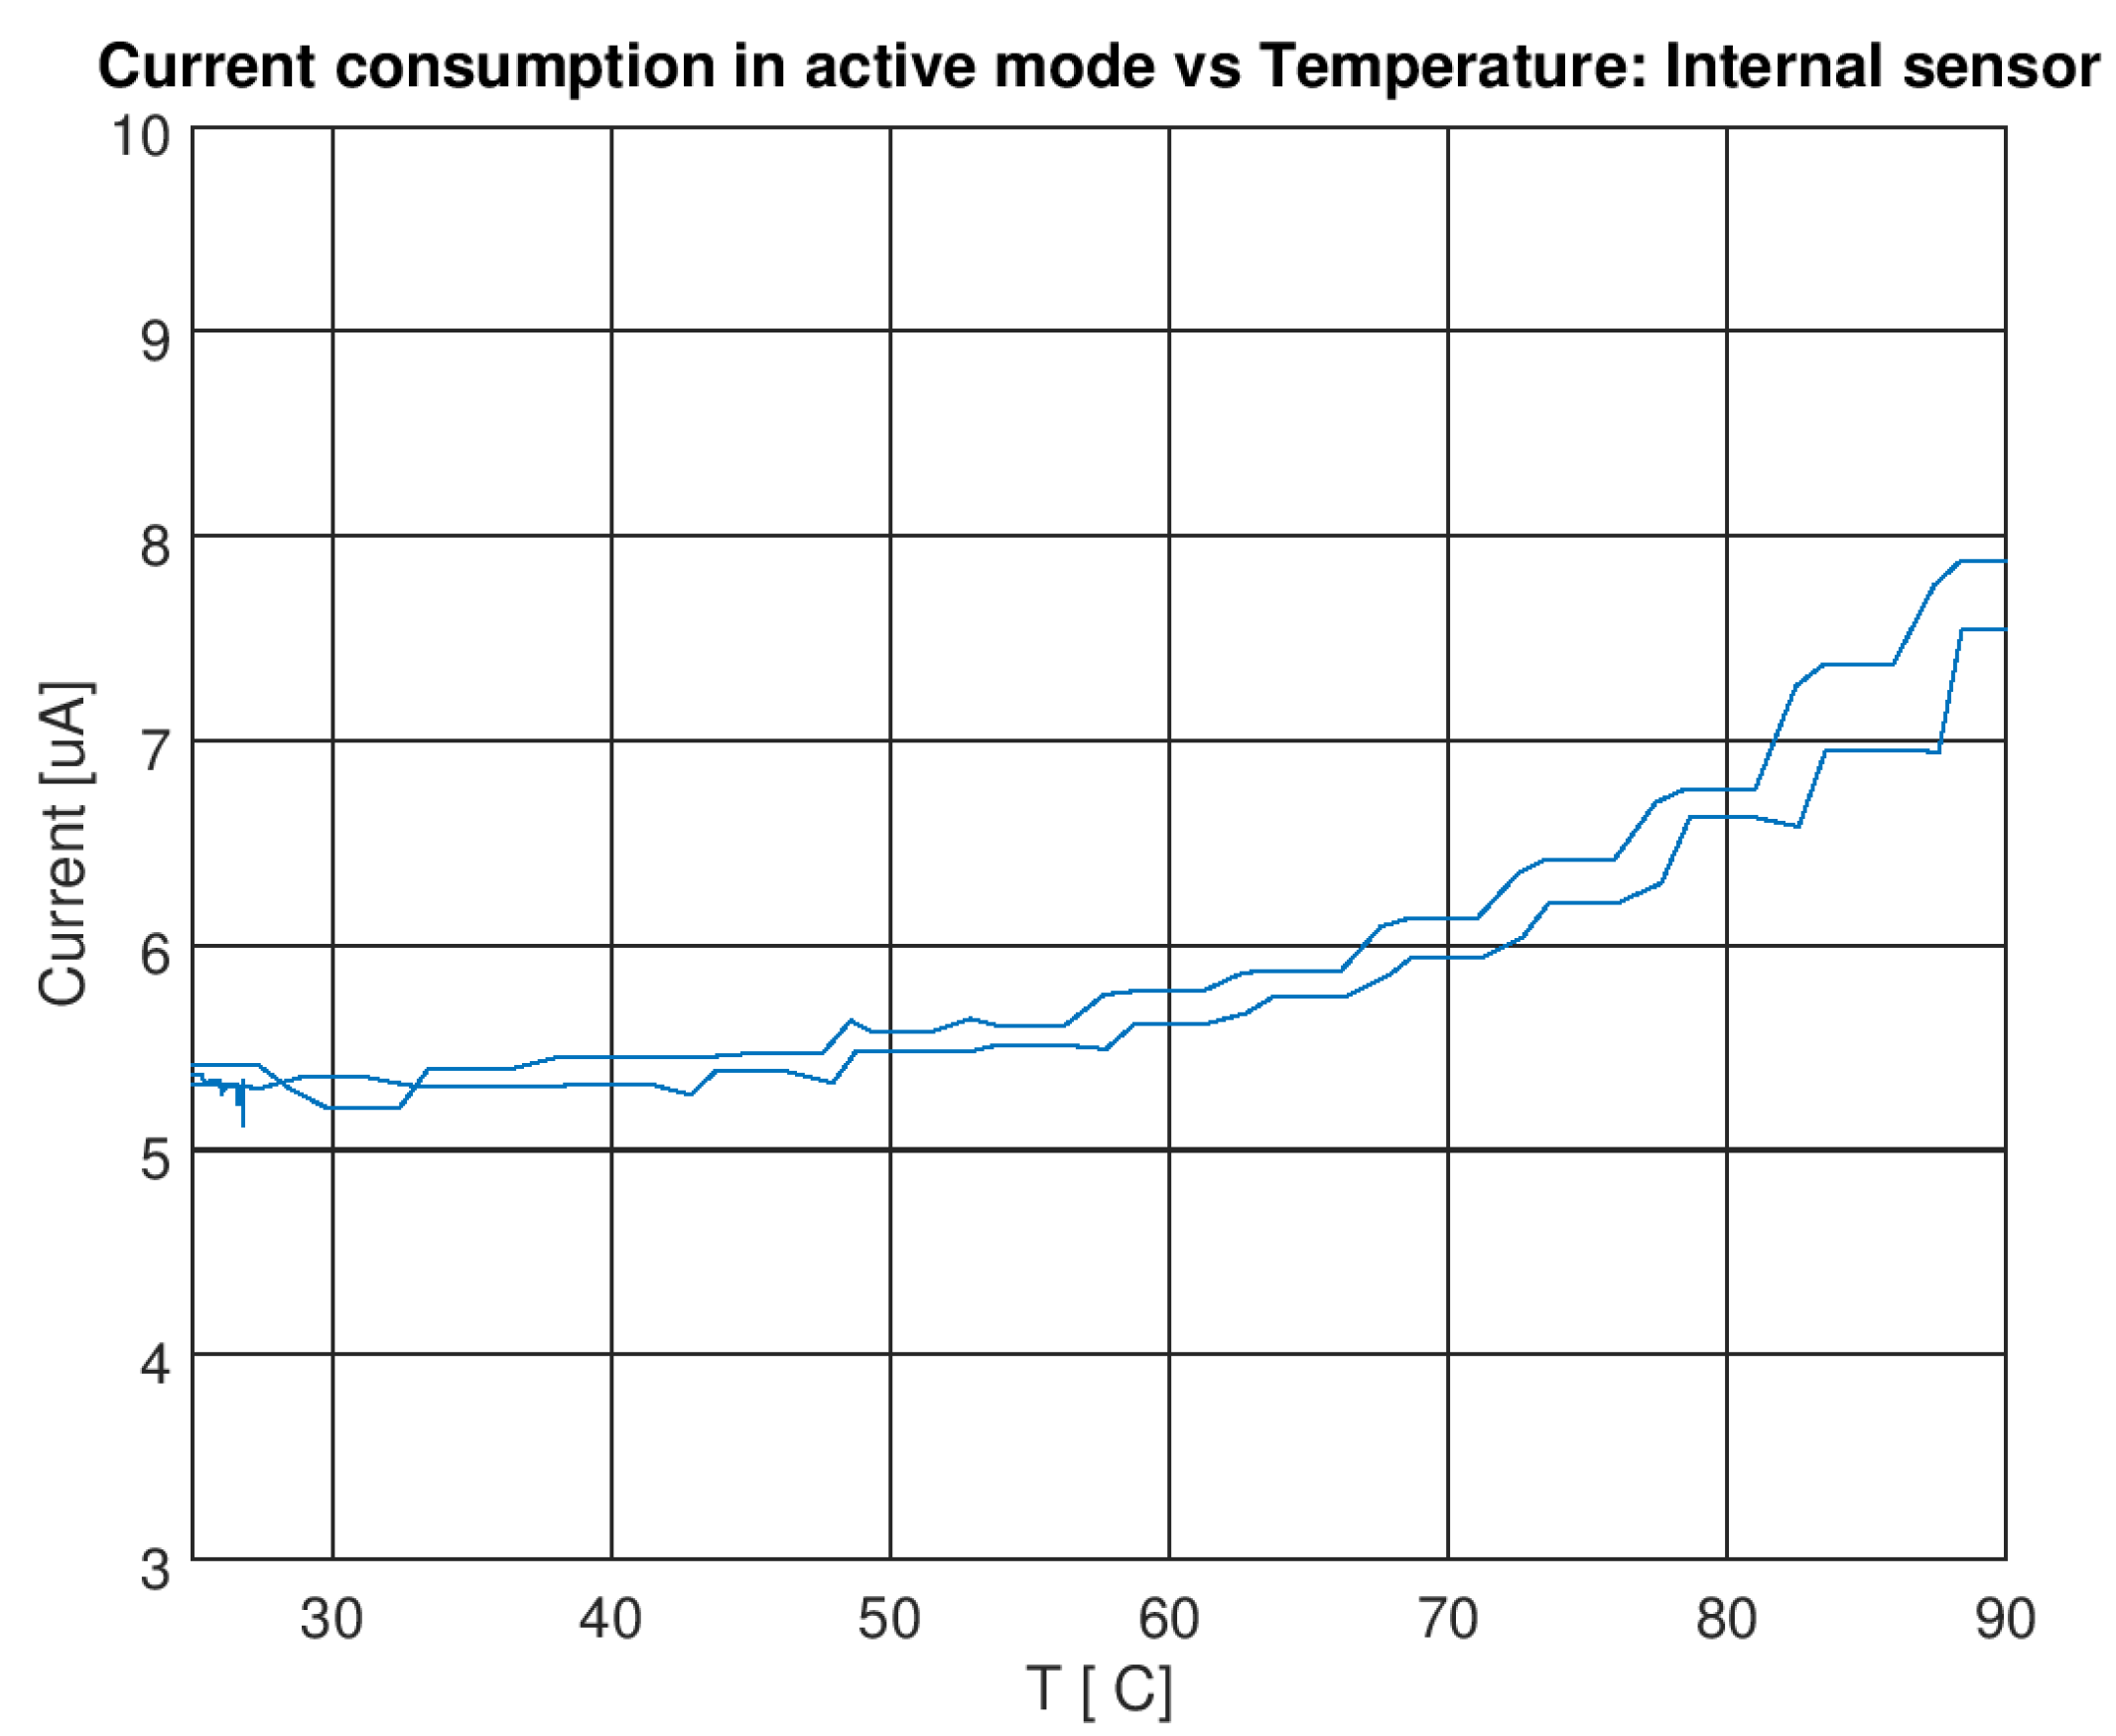
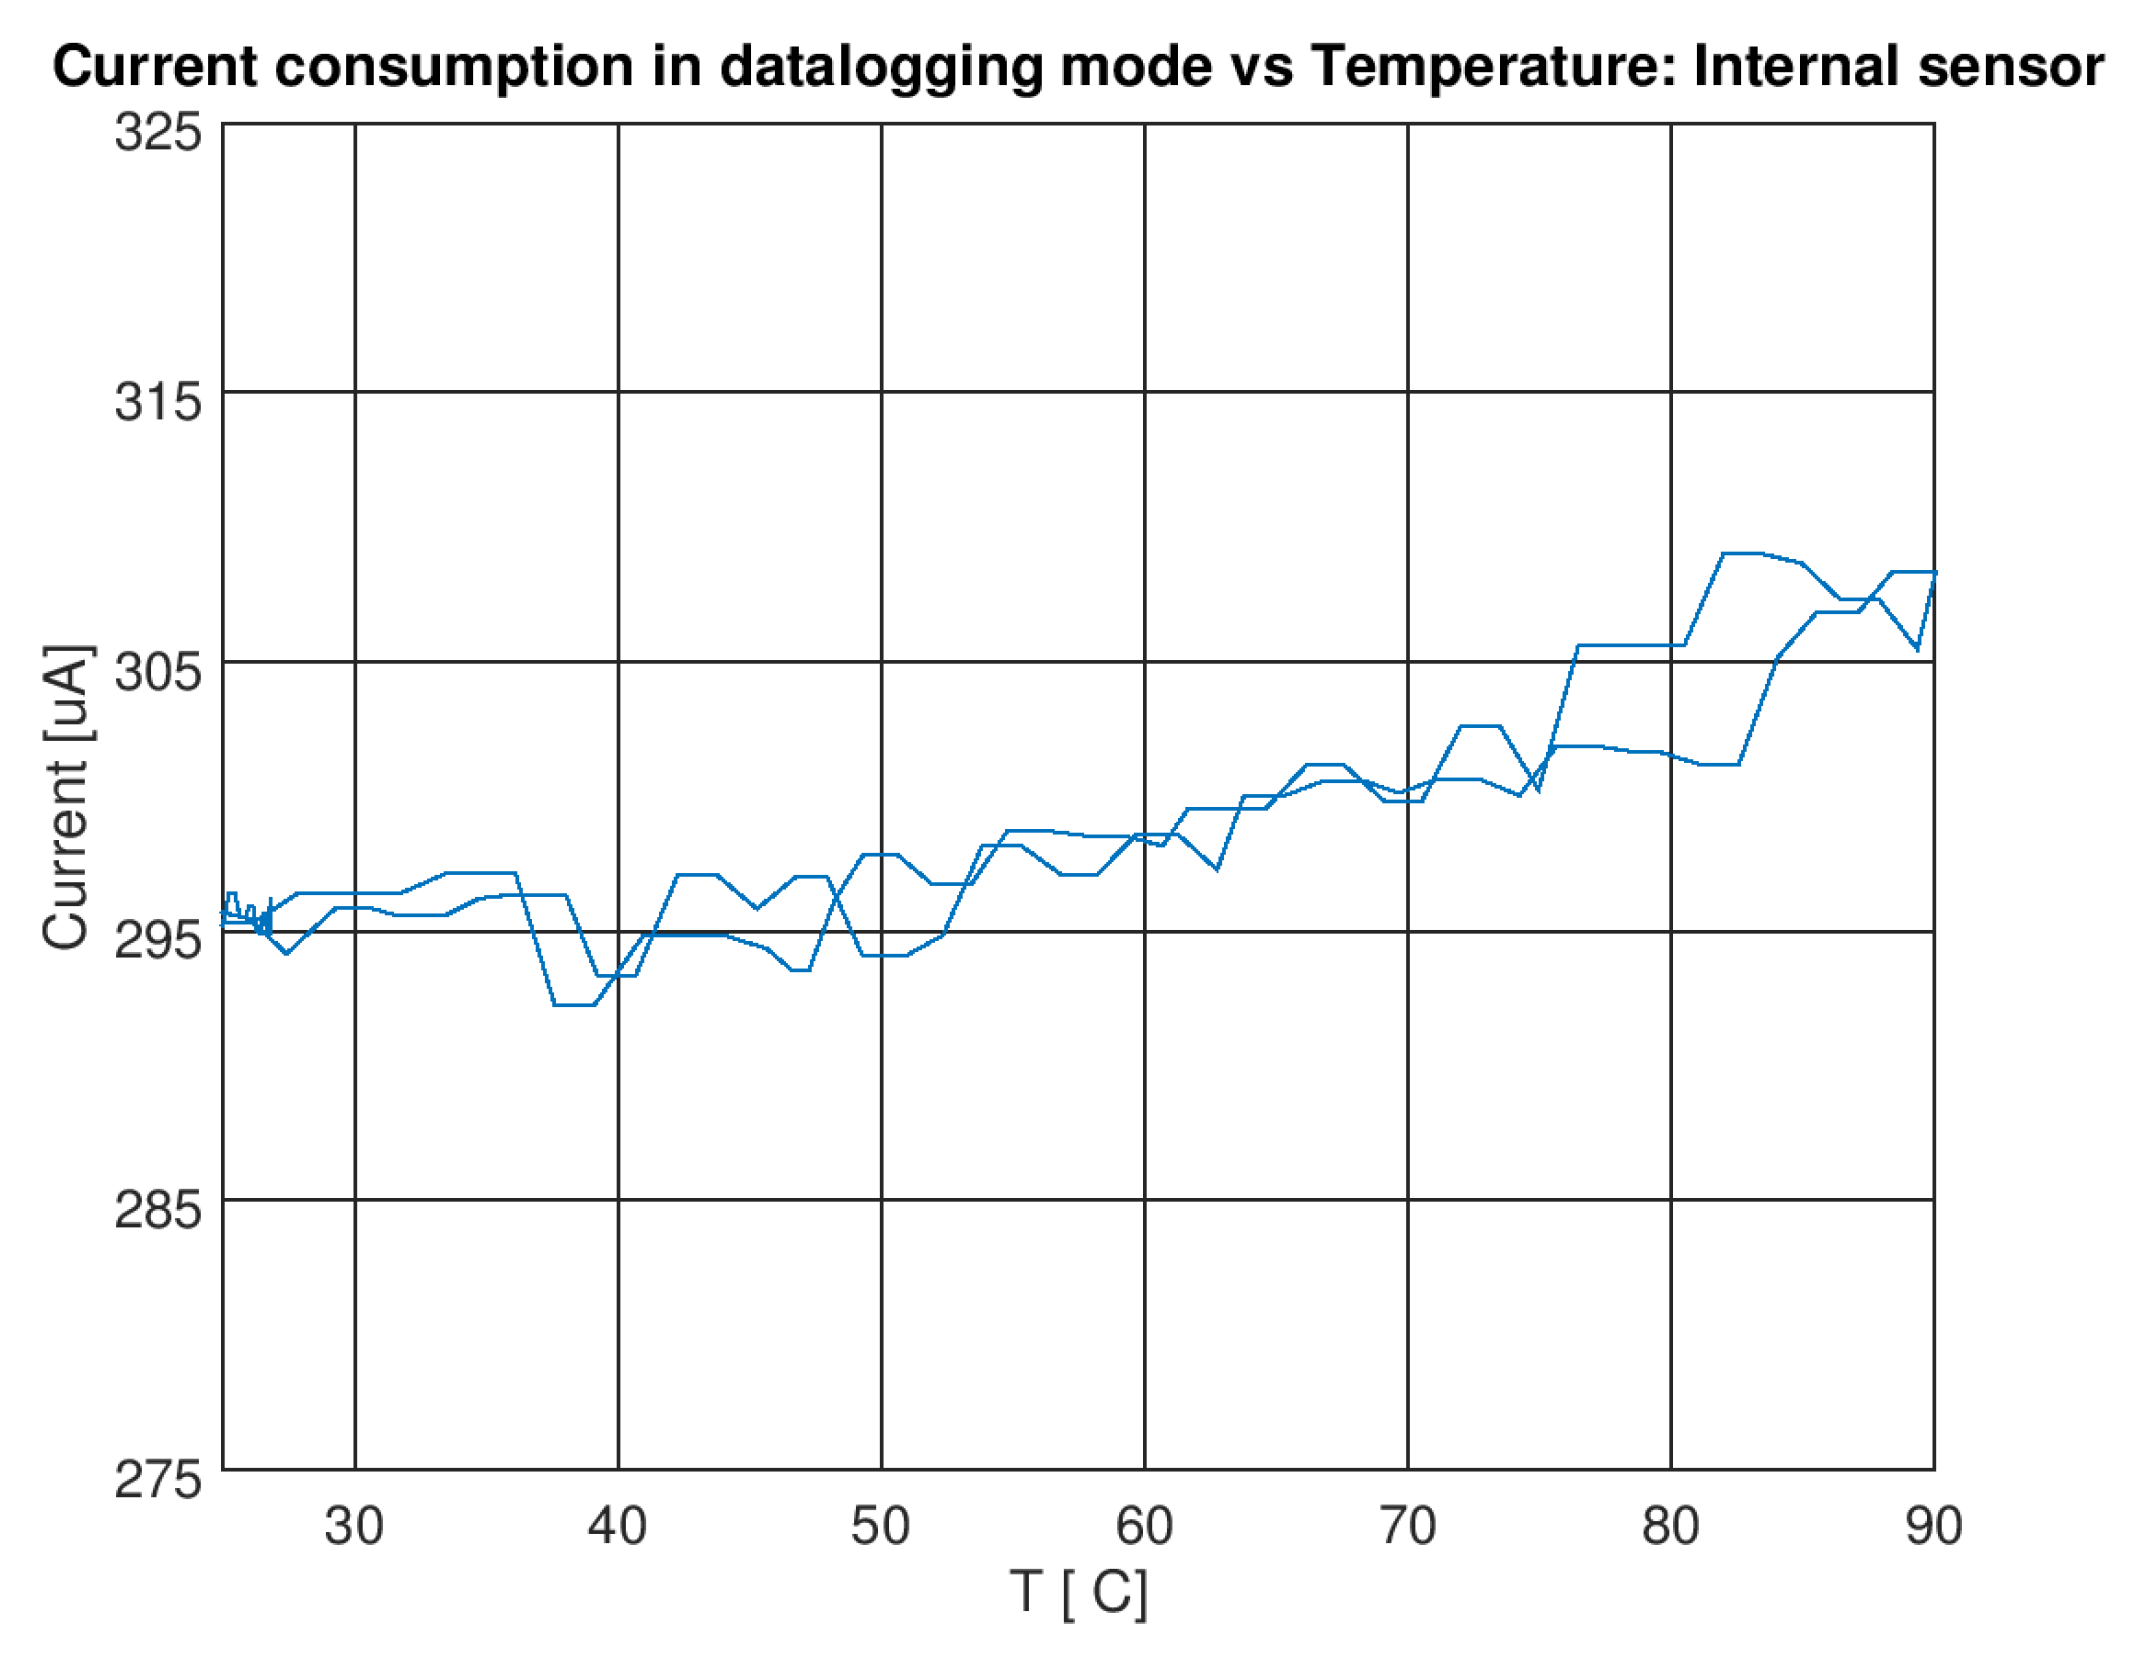
The current consumption of both working modes are separated in Figure 5 and Figure 6, where are represented over temperature.
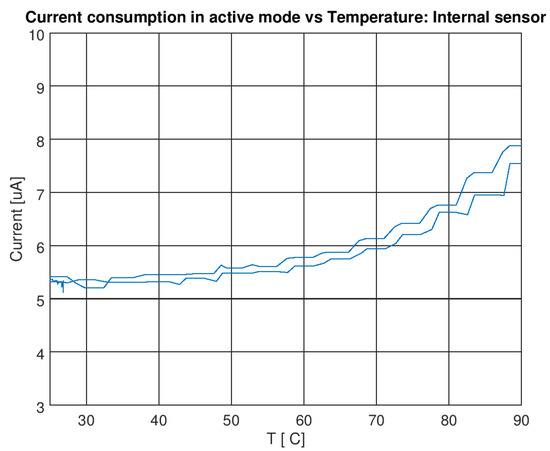
Figure 5.
Effects of the temperature over current consumption in active mode.
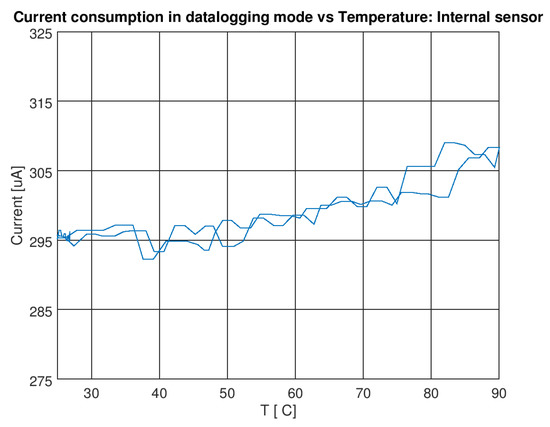
Figure 6.
Effects of the temperature over current consumption in data logging mode.
During the active mode, the current consumption experiences an increase up to 45%, from 5.5 μA to 8 μA, when temperature is 90 °C.
However, data logging mode’s current consumption increases from 295 μA to 310 μA, which only makes a 5% increment.
This confirms the impact of the temperature over the sensor tag’s current consumption, which should be taken into account when the autonomy of the system is estimated.
Moreover, the current consumption increment during the active mode, which corresponds to the 99.9% of the running time of the system, has to be watched over closely and could be a bottleneck for long term applications in hot temperature environments.
Author Contributions
All the authors contributed equally in this work.
Acknowledgments
Funded by the MICRO4FAB project (KK-2016/00030), under ELKARTEK Programme of the Basque Government.
Conflicts of Interest
The authors declare no conflict of interest. The founding sponsors had no role in the design of the study; in the collection, analyses, or interpretation of data; in the writing of the manuscript, and in the decision to publish the results.
References
- FoodServiceEurope. European Industry Overview. Available online: http://www.ferco-catering.org/en/european-industry-overview (accessed on 2 October 2017).
- Betz, A.; Buchli, J.; Göbel, C.; Müller, C. Food waste in the Swiss food service industry—Magnitude and potential for reduction. Waste Manag. 2015, 35, 218–226. [Google Scholar] [CrossRef] [PubMed]
- Falasconi, L.; Vittuari, M.; Politano, A.; Segrè, A. Food waste in school catering: An Italian case study. Sustainability 2015, 7, 14745–14760. [Google Scholar] [CrossRef]
- HOTREC. European Hospitality Industry Guidelines to Reduce Food Waste and Recommendations to manage Food Donations. Available online: http://www.hotrec.eu/Documents/Document/20170119161052-HOTREC_guidelines_on_food_waste_reduction_and_recommendations_to_manage_donations_-_Final.pdf (accessed on 2 October 2017).
- Parfitt, J.; Barthel, M.; Macnaughton, S. Food waste within food supply chains: Quantification and potential for change to 2050. Philos. Trans. R. Soc. B Biol. Sci. 2010, 365, 3065–3081. [Google Scholar] [CrossRef] [PubMed]
- WRAP_UK. Food Waste in the Hospitality and Food Service Sector. 2012. Available online: http://www.wrap.org.uk/content/food-waste-hospitality-and-food-service-sector-0 (accessed on 2 October 2017).
- Strotmann, C.; Niepagenkemper, L.; Göbel, C.; Flügge, F.; Friedrich, S.; Kreyenschmidt, J.; Ritter, G. Improving Transfer in the Food Sector by Applying a Target Audience-Centered Approach—The Development of a Nonprofit Marketing Campaign Guide Based on a Case Study of the LAV Platform. Sustainability 2017, 9, 512. [Google Scholar] [CrossRef]
- Beretta, C.; Stoessel, F.; Baier, U.; Hellweg, S. Quantifying food losses and the potential for reduction in Switzerland. Waste Manag. 2013, 33, 764–773. [Google Scholar] [CrossRef] [PubMed]
- FAO. Global Food Losses and Food Waste—Extent, Causes and Prevention. 2011. Available online: http://www.fao.org/docrep/014/mb060e/mb060e00.pdf (accessed on 2 October 2017).
- FAO. HLPE 2014. Food Losses and Waste in the Context of Sustainable Food Systems. A Report by the High Level Panel of Experts on Food Security and Nutrition of the Committee on World Food Security. Available online: http://www.fao.org/3/a-i3901e.pdf (accessed on 2 October 2017).
- Lee, P.A.; Ramakrishnan, T. Disordered electronic systems. Rev. Mod. Phys. 1985, 57, 287. [Google Scholar] [CrossRef]
- amsAG. SL900A EPC Sensor Tag. Available online: http://ams.com/eng/Products/Wireless-Connectivity/Sensor-Tags-Interfaces/SL900A (accessed on 2 October 2017).
- United States Department of Agriculture. Food Safety and Inspection Service. Available online: https://www.fsis.usda.gov/wps/portal/fsis/topics/food-safety-education/get-answers/food-safety-fact-sheets/safe-food-handling/danger-zone-40-f-140-f/CT_Index (accessed on 2 October 2017).
- Climats. Excal 5424-HE. Available online: http://www.climats-tec.com/en/products/1042-our-product-lines/1073-temperature-andor-humidity-environmental-test-chamber/168-temperature-andor-humidity-excal-range.html (accessed on 2 October 2017).
- Keysight Technologies. N6781A 2-Quadrant Source/Measure Unit for Battery Drain Analysis. Available online: http://www.keysight.com/en/pd-1842316-pn-N6781A/2-quadrant-source-measure-unit-for-battery-drain-analysis-20-v-1-a-or-6-v-3-a-20-w?&cc=ES&lc=eng (accessed on 2 October 2017).
- Keysight Technologies. N6705B DC Power Analyzer, Modular, 4 Slots. Available online: http://www.keysight.com/en/pd-1842303-pn-N6705B/dc-power-analyzer-modular-600-w-4-slots?&cc=ES&lc=eng (accessed on 2 October 2017).
Publisher’s Note: MDPI stays neutral with regard to jurisdictional claims in published maps and institutional affiliations. |
© 2018 by the authors. Licensee MDPI, Basel, Switzerland. This article is an open access article distributed under the terms and conditions of the Creative Commons Attribution (CC BY) license (https://creativecommons.org/licenses/by/4.0/).