1. Introduction
The kicking technique is an important skill composing most part of game performance in soccer. Thus, many studies about kicking motion of instep straight, curve and knuckle exist [
1,
2,
3,
4].
In motion analysis of kicking, ball velocity or foot-to-ball speed ratio are used for assessment of performance [
5]. Furthermore, the point where impact occurs is analyzed to assess the performance of kick impact in ball games [
6,
7]. Using mechanical leg makes it easy to detect impact point because of high reproducibility [
6], but capturing real kicking motion is hard to detect impact point. Because there is a difficulty of visual capturing of impact point, because impact point is hidden by ball and foot when they make collision. Even if we use high speed camera or optical motion capture system, there is a same visually limitation. In this situation, challenging survey to detect the impact point in three dimension with high accuracy are few. To solve the problem, we need to visualize the invisible area, and making virtual impact model of ball and foot applicable to captured motion is useful to reproduce kicking motion in analysis software. On process to make virtual impact model using optical three dimensional motion capture system, we can tell three dimensional coordinate value of all markers.
The data of three dimensional coordinate value of impact point makes it possible to calculate moment torque at the point of where impact occurs. Calculating foot-to-ball speed ratio also can take a data that is nearer to impact than previous studies. The trajectory of impact point can show the behavior of foot in collision.
The aim of this study was to compare three kinds of kicking motion straight, curve and knuckle using detected three dimensional coordinate value of impact point and its trajectory by making virtual impact model.
2. Materials and Methods
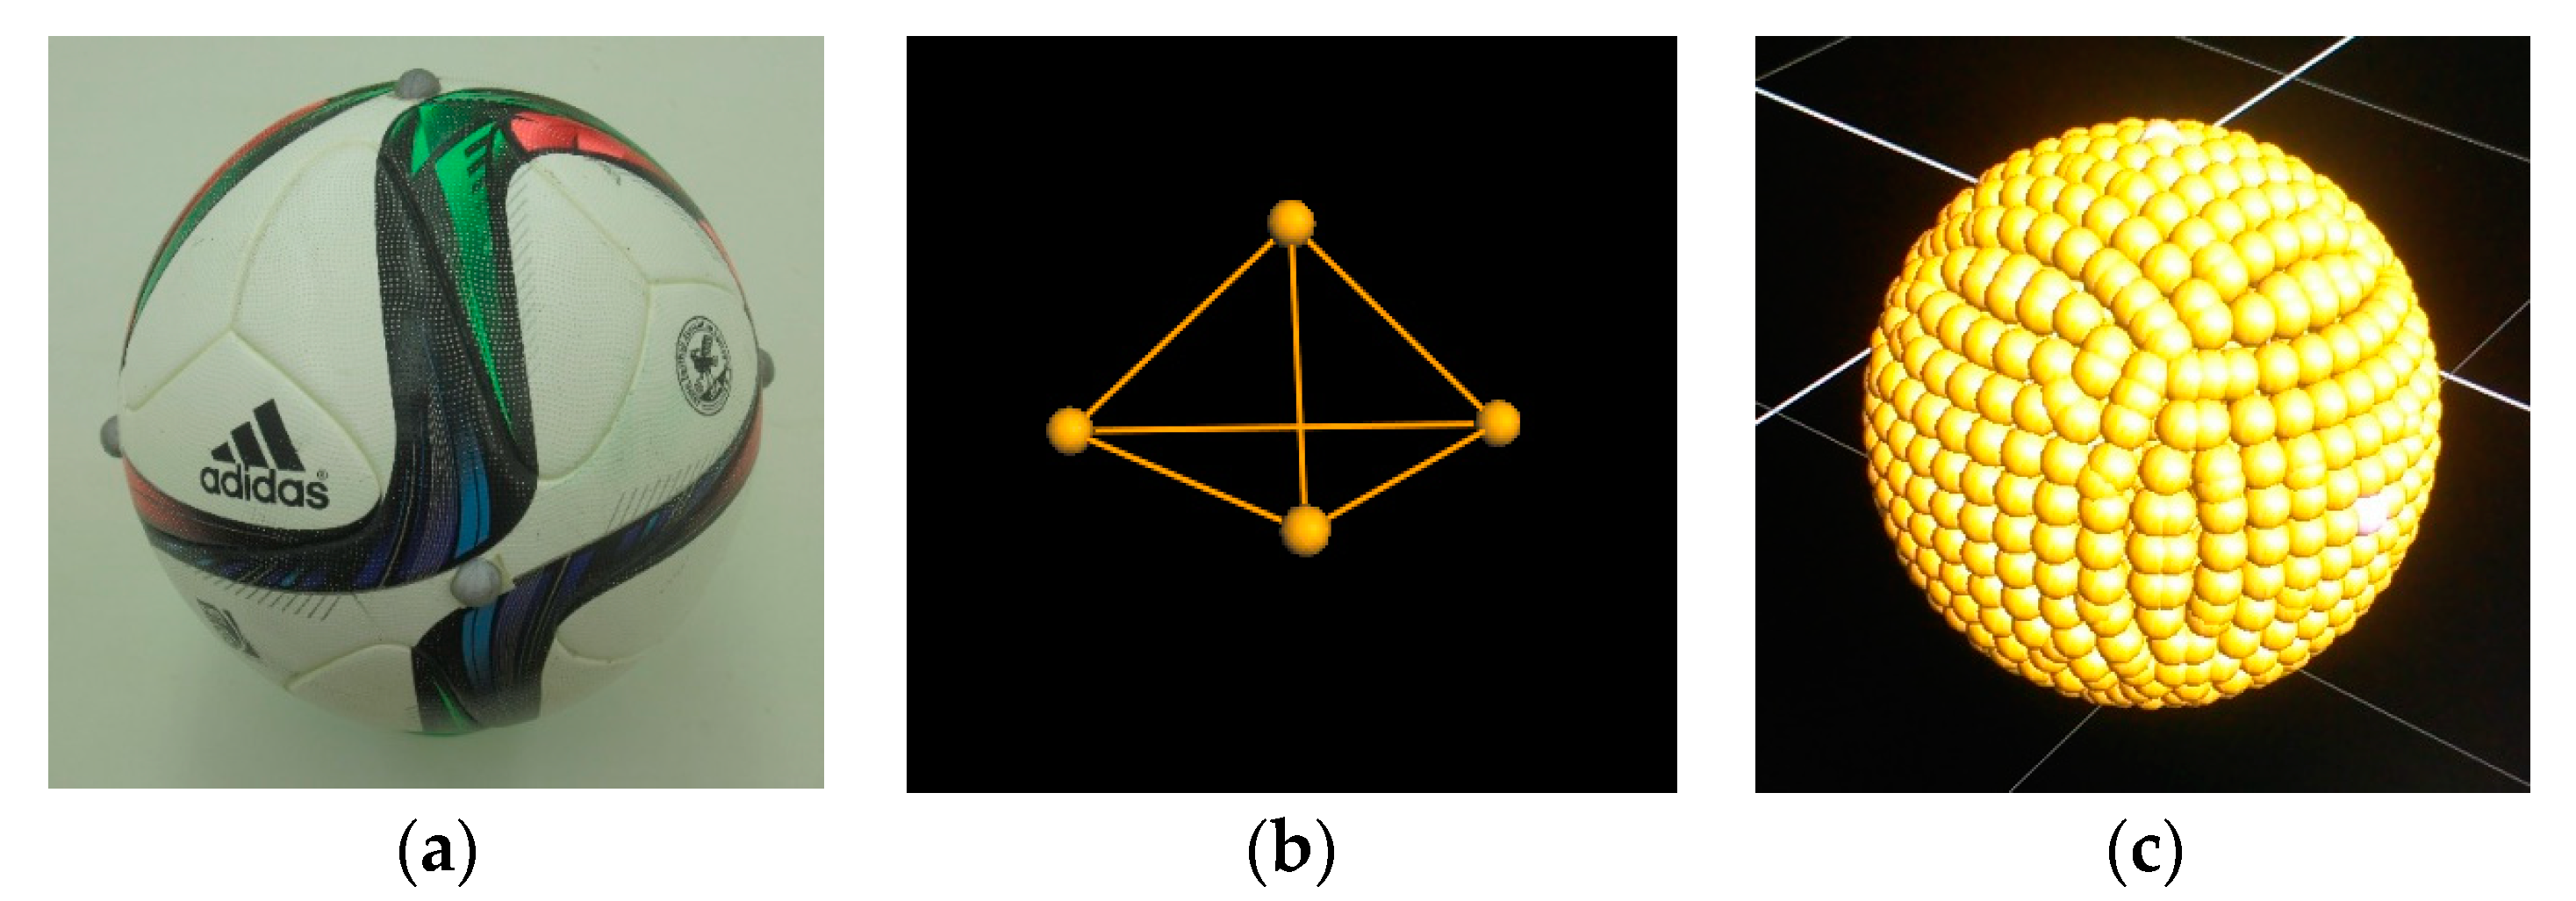
Participants were right-foot dominant 15 collegiate soccer players (Height: 1.70 ± 0.06 m, Body mass: 65.6 ± 5.1 kg, Experience: 14.3 ± 1.8 years; mean ± SD). They performed three kind of kick; straight, curve and knuckle. We captured that impact of kicking motion using three dimensional optical motion capture system (Oxford Metrics Ltd., Oxfordshire, UK, 2000 Hz). Reflection markers were placed on foot and ball. Three markers on foot located heel and both side of MTP (metatarsophalangeal) joint. Four markers on ball located top, left, right and front point that three axes from center of ball gravity contact with surface of ball. Segment of foot and ball were made from markers, then Virtual Surface model of foot and ball were made by calculating and using coordinate value of captured real markers against each segment.
We calculated Ball Velocity, Foot Velocity, Foot-to-ball Speed Ratio, Impact Point on Foot and its trajectory. BV (ball velocity) was defined as velocity of center of ball that obtained from right and left marker of ball as the midpoint. FV (foot velocity) was defined the as velocity at the POF (impact Point on Foot). SR (foot-to-ball speed ratio) was calculated from BV and velocity of POF (impact Point on Foot). POF was expressed coordinate values in local coordinate system against foot segment. Heel point was origin point of foot segment. In the local coordinate system of foot, Y (Horizontal) axis was directed to midpoint of both side points of MTP joint from heel, Z (vertical) axis was defined as vertical direction against plane that made by three markers of foot and X (lateral) axis was defined direction that orthogonal to other axes. The trajectory of POF in each trial are showed 10 frame before impact till 20 frame after impact, with a point of ball center fixed at the coordinate value before the impact.
Surface models of foot and ball made from each own segment were used to detect impact point both on foot and ball. We constructed Virtual markers using coordinate value of captured real marker, then we made surface model by spreading virtual markers as the surface of each segment. To make surface model of ball, virtual markers were located in surface by fixing radius from center of ball (
Figure 1). To make surface model of foot (in not worn), additional real markers were placed in a grid on impact area (instep and inside), and virtual markers filled the blank. Because of that process, surface model of foot was composed by virtual markers like linked small panels (
Figure 2).
The coordinate value of virtual markers against the foot segment were saved as the surface model. It enabled to apply the model to motion data of trial in experiment using three makers on foot. In the trial data, pairs of virtual marker of each foot and ball model that showed the earliest contact were defined as the impact point of each segment. The distance of pair of impact points showed bimodal displacement, the pair showed the smallest value of the first extremely small was considered that make first contact. The impact point of foot was expressed as coordinate value in local coordinate system on foot segment. The accuracy test of the virtual impact model was conducted by calculating the distance between the virtual impact model and captured real marker.
In all statistics comparison, we used the one-way ANOVA, then used Bonferroni method in the case we found significance between groups at the level of 5%.
3. Results
3.1. Ball Velocity
The BV values of each trial were as following; Straight: 25.8 ± 1.5 m/s, Curve: 24.9 ± 1.0 m/s, Knuckle: 24.8 ± 1.9m/s. There were no significance in one-way ANOVA (
Figure 3).
3.2. Foot-to-Ball Speed Ratio
The mean value of Foot-to-ball speed Ratio were as following; Straight: 1.32 ± 0.06, Curve: 1.30 ± 0.05, Knuckle: 1.38 ± 0.05. The value of knuckle was significantly larger than other trials. The mean value of knuckle SR was significant larger than other two trials.
The Blue-Red color scaled foot-to-ball speed ratio on each trial was showed in below (
Figure 4).
3.3. Impact Point on Foot
The local coordinate value of POF were as following; Straight: (Lateral: −24.0 ± 5.6 mm, Horizontal: 152.7 ± 8.4 mm, Vertical: 52.3 ± 4.0 mm) with the mean distance between the POF and POB(impact Point on Ball): 3.52 ± 1.62 mm, Curve: (Lateral: −35.6 ± 4.8 mm, Horizontal: 151.6 ± 13.7 mm, Vertical: 47.5 ± 5.2 mm) with the mean distance between the POF and POB: 4.06 ± 1.20 mm, Knuckle: (Lateral: −33.3 ± 9.0 mm, Horizontal: 140.8 ± 10.7 mm, Vertical: 52.1 ± 2.7 mm) with the mean distance between the POF and POB: 3.35 ± 1.34 mm(
Figure 5). Lateral value of straight was significantly larger than other trials. Horizontal value of knuckle was significantly smaller than other trials. Vertical value of curve was significantly smaller than other trials. In the accuracy test of the virtual impact model of foot, the error of the impact point was 1.0 mm at the most.
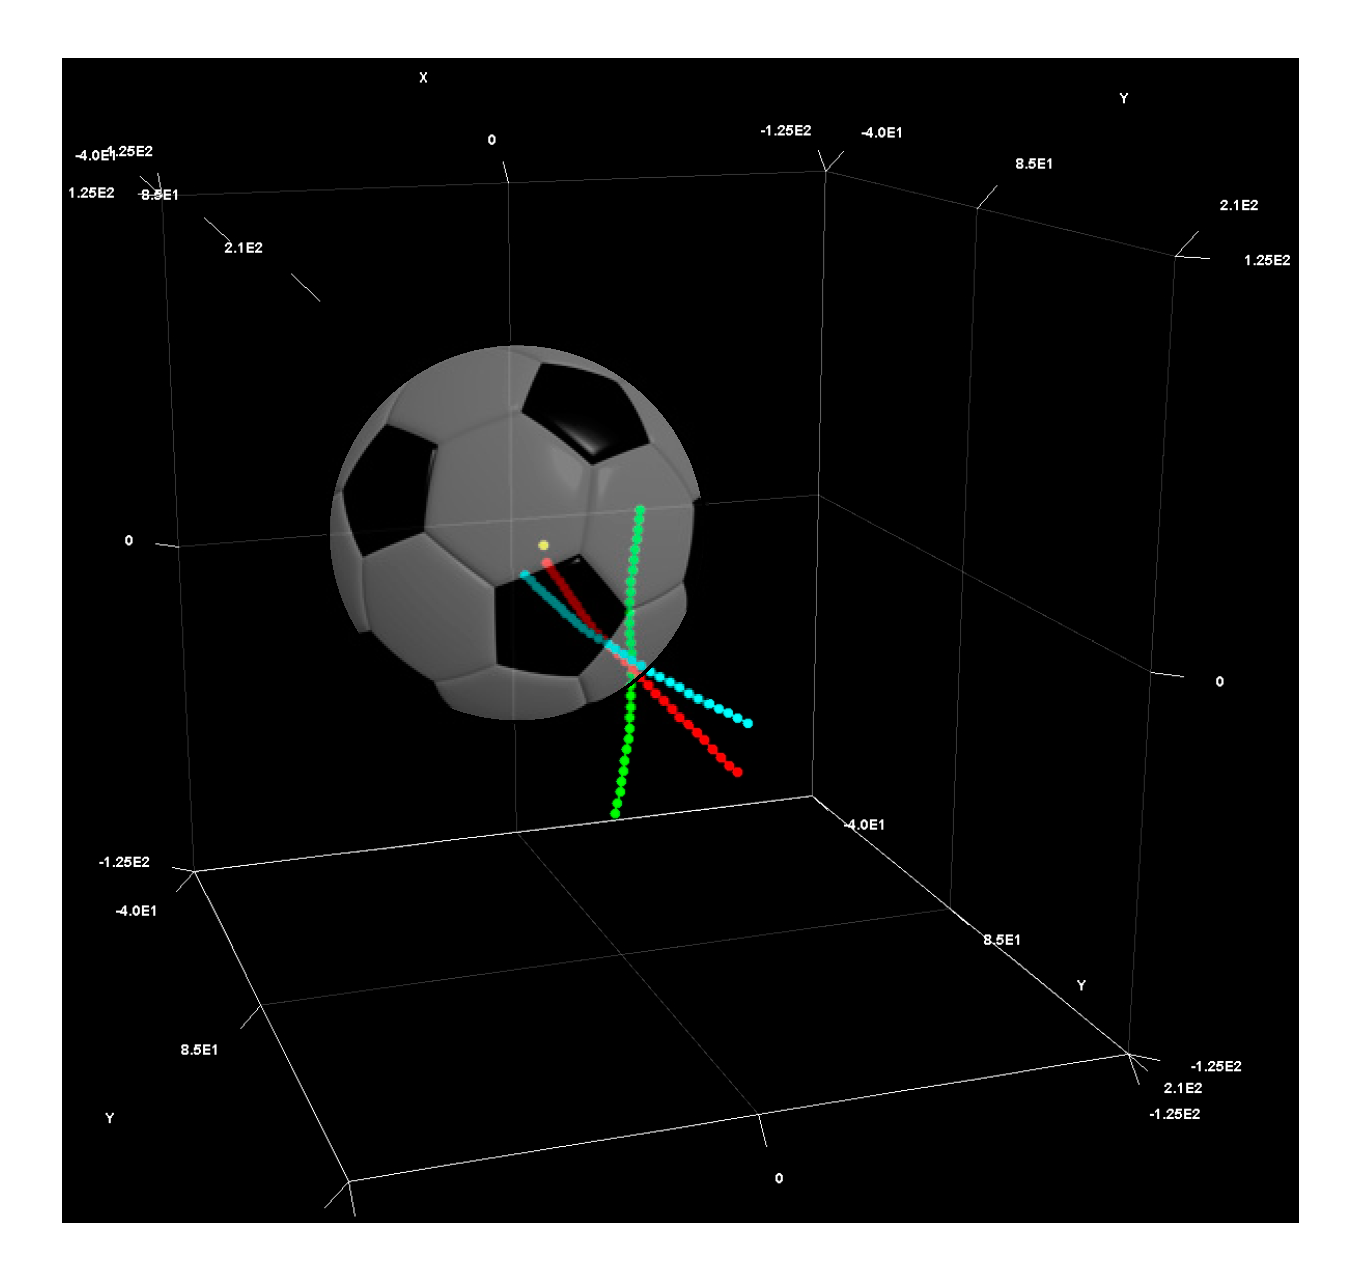
3.4. Trajectory of Impact Point on Foot
The trajectory of POF are showed in
Figure 6. They showed in mean value of each trial. Side view of POF trajectory in each trial of typical data of a participant are showed in
Figure 7.
3.5. Foot Velocity
The FV values of each trial were as following; Straight: 19.5 ± 0.7 m/s, Curve: 19.1 ± 0.7 m/s, Knuckle: 18.0 ± 1.5 m/s. The value for knuckle was significantly smaller (p < 0.05) than the other two cases.
4. Discussion
The result of BV shows no significance. It is considered that difference of intensity are not in between trials.
Because of the mean value of SR in knuckle, participants are considered that they have an aim to gain the BV by effective impact and make low rotation. It is considered that large SR is appropriate than large foot velocity to make large BV in knuckle kick said that large BV and low rotation are required to succeed. Because large foot velocity can make ball rotation. Then, if to gain the BV by large foot velocity is the feature of straight trial, in contrast, it has a possibility that the feature of knuckle is accuracy of kick impact to increase SR, not to make ball rotation.
Results of POF have features in each trial. In straight showed lower value in lateral axis, it can be said that POF is located in center of instep area compared with other trials. It is considered that participants aimed to gain large BV generated from large swing velocity of foot by impact with instep. In curve showed lower height, it shows that impact occurs near the inside area. In knuckle showed lower value in horizontal axis, POF are located in the area near the foot joint. The result of POF can tell one of the aim in knuckle to decrease the joint angle displacement by impact with near the proximal segment end. Furthermore in knuckle thought that it needs low ball rotation, POF may converts to flatter area compared with straight to make planar impact.
The difference of POF trajectory shows the feature of kinds of kicking. The trajectory of POF of straight going down under the center of ball make back spin around the lateral axis to the ball. The trajectory of POF of curve shows larger displacement in lateral axis. It is considered that the movement of POF make side spin around vertical axis to the ball. The trajectory of POF of knuckle what needs low ball rotation went through the near the center of ball. It can be said that more appropriate to decrease ball rotation. It is suggested that participants make difference of kinds of kicking by not only POF but also its trajectory before and during impact.
We think three dimensional quantification of impact point on foot makes it possible to analyze detail of kick impact. We showed difference of foot-to-ball speed ratio by difference of impact point even in same trial. In the future works, we should focus on moment torque at impact point.
5. Conclusions
In this study, we tried to quantify the impact point of kick in three dimensional coordinate system using original virtual model in analysis software. Then we got results as below from analysis data of three kinds of kicking motion:
Coordinate values of impact point in three kicking motion straight, curve and knuckle are difference. The impact point of straight located center area of instep. The impact point of curve located low area near the inside of foot. The impact point of knuckle located near the foot joint.
The value of foot-to-ball speed ratio in knuckle is significantly larger than other straight and curve. Furthermore it is considered that the farther impact point from foot joint shows the smaller foot-to-ball speed ratio.
The difference of trajectory of impact point shows that participants make difference of kicking skill using both of impact point and its trajectory during kick motion.


