Abstract
Inertial and inertial-magnetic sensors are miniaturised and lightweight which allows the technology to be used to assess human movements in sports. These sensors can produce up to nine channels of time series data which can often be difficult to read and interpret. This paper describes the development of a 3D visualisation tool for inertial/magnetic sensors. A sensor fusion technique known as an attitude heading reference system (AHRS) is used to calculate 3D orientation of the sensor. With AHRS data from a gyroscope and magnetometer can be expressed in animation as orientation of the sensor. However acceleration does not appear in the animation. Therefore the function to express the magnitude and direction of the acceleration using a shake of the sensor animation is added to the tool. It was confirmed that the tool produce an animation which clearly portrayed athlete posture and accelerations synchronised with the gait cycle.
1. Introduction
Recent advances in micro-electromechanical systems (MEMS) technology have led to development of various types of micro sensors including inertial and magnetic sensors. The sensors are miniaturised and lightweight which allow the technology to be used to assess human movements in sports. Current inertial sensors consist of tri-axial accelerometer and gyroscope which measure acceleration and angular velocity three-dimensionally. Magnetometers are used as magnetic compass to measure magnetic orientation.
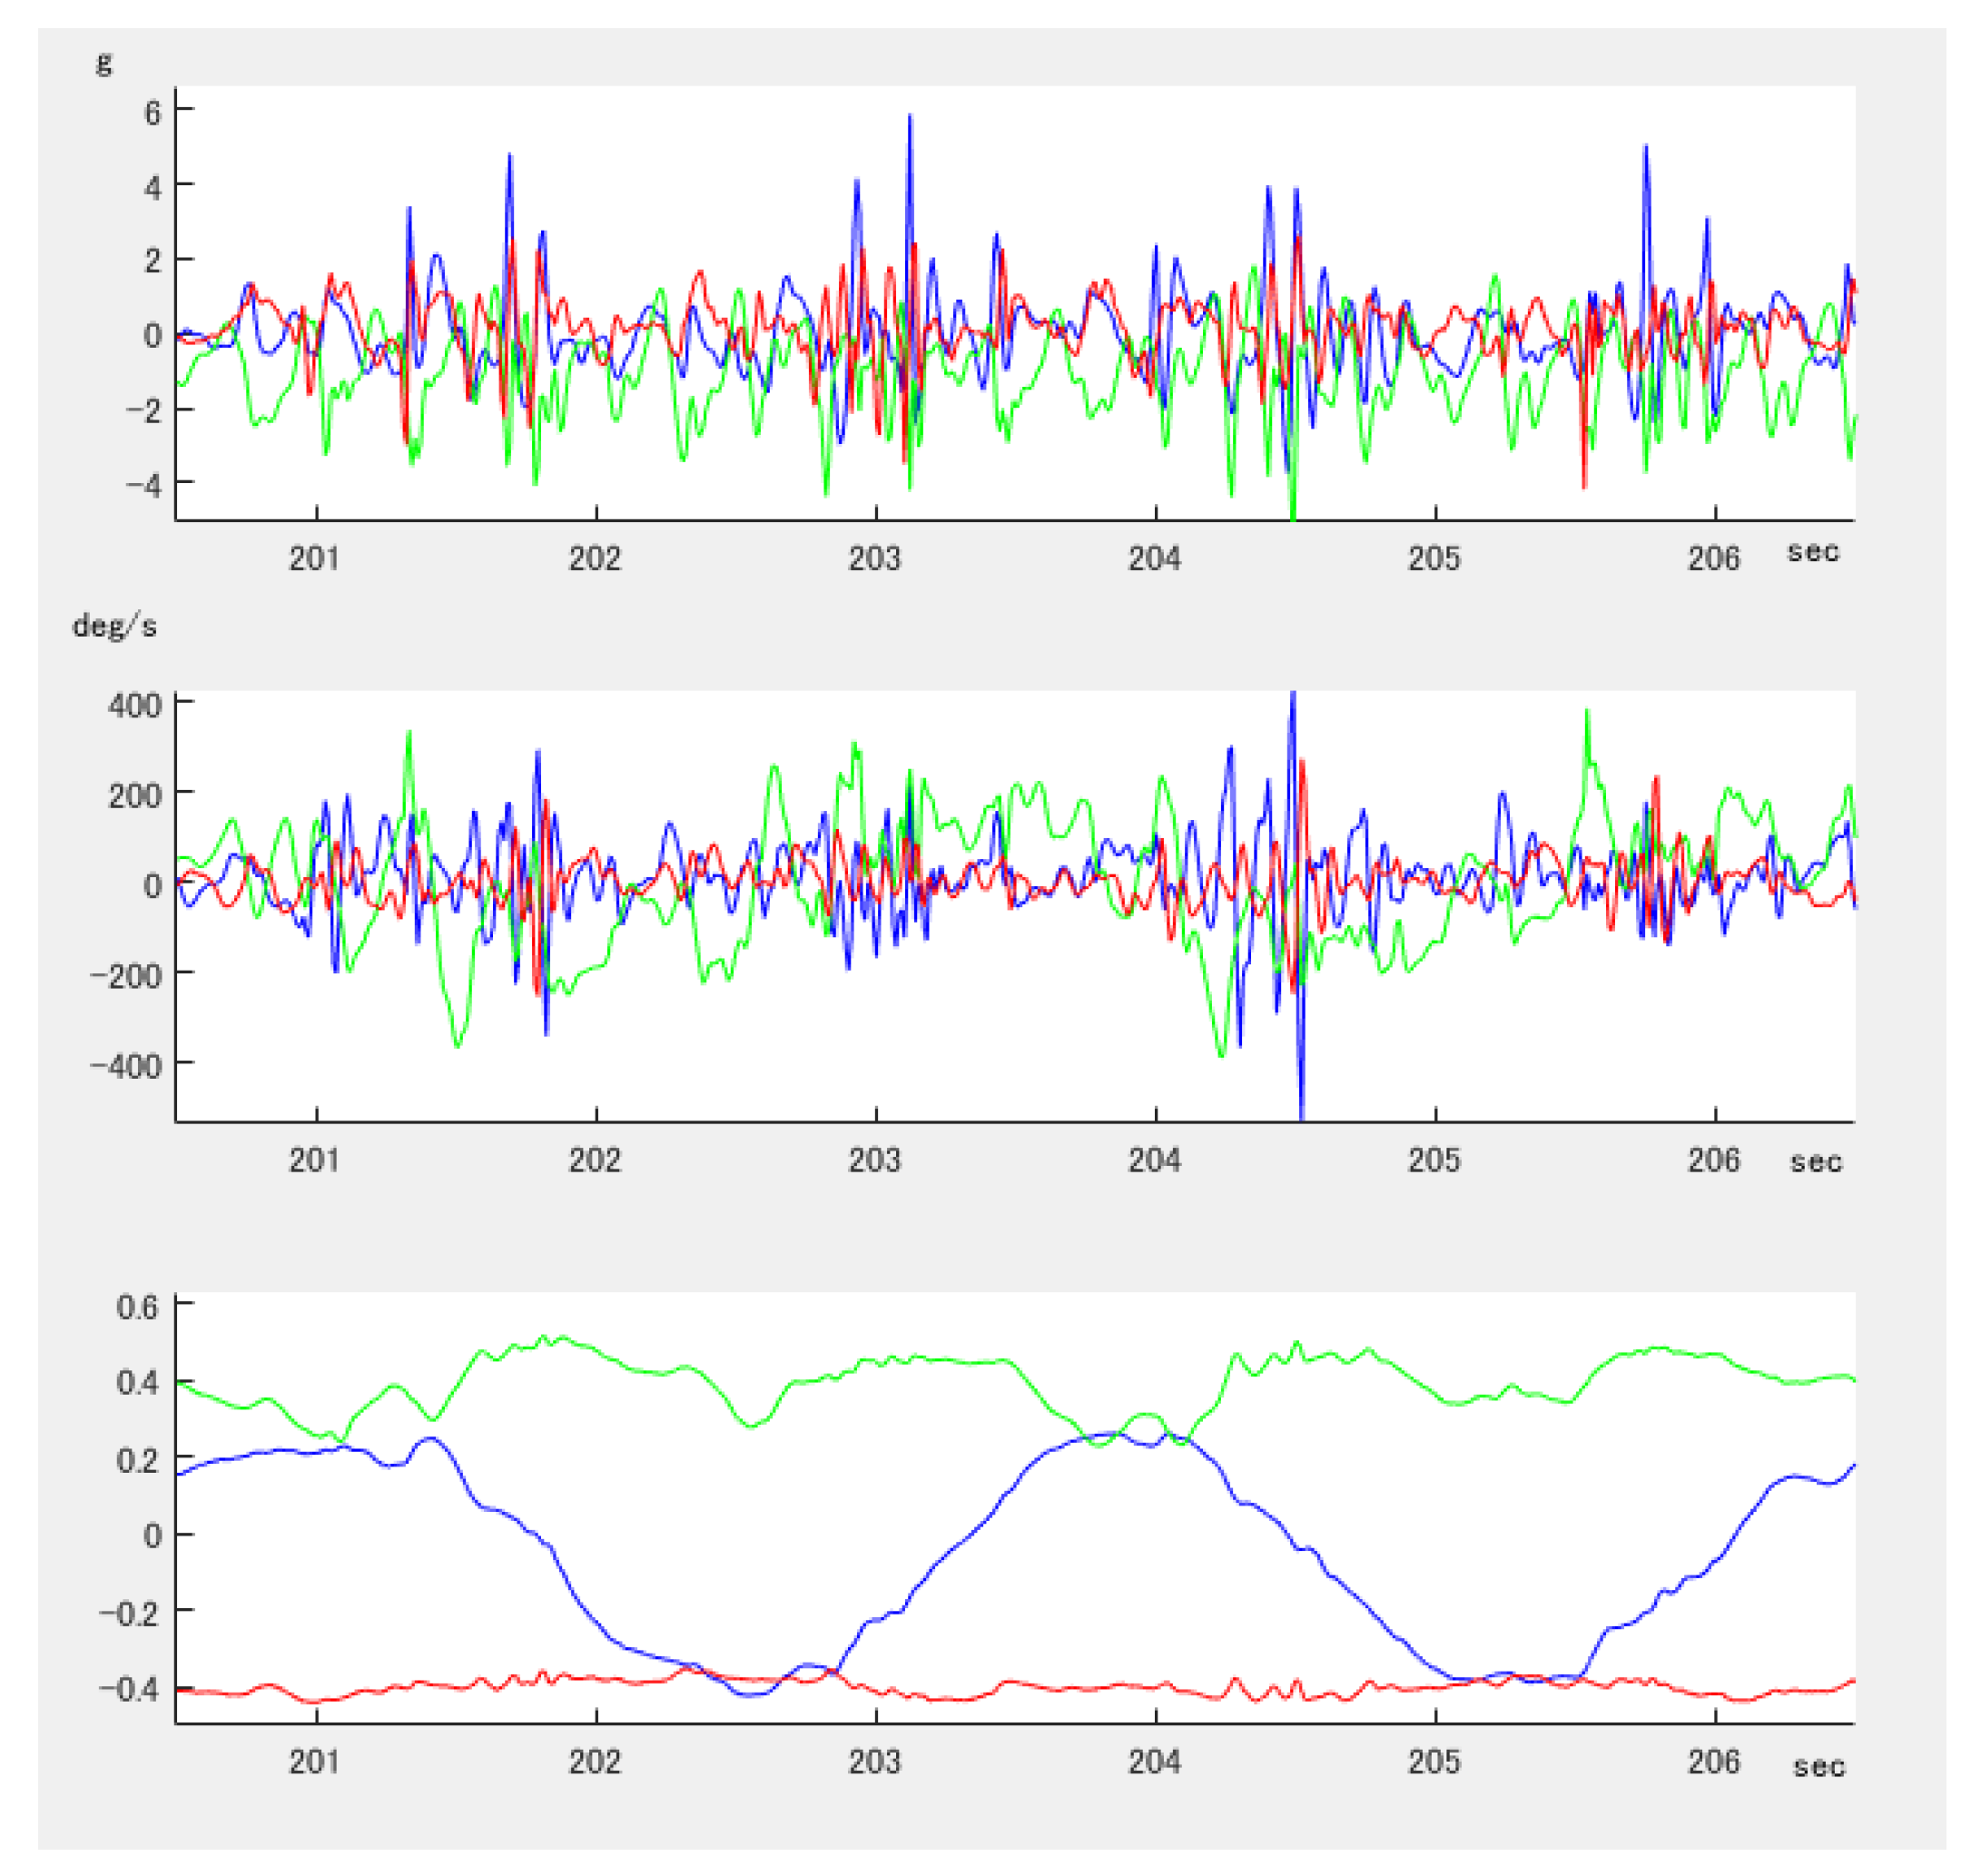
Accelerations, angular velocity and orientation can be significant information in the analysis of the movement in sports [1,2]. However it is often difficult to understand and interpret the raw data because it is typically composed of multiple channels of time series data. For example, a gyroscope measures a change of angular velocity, however the sensors total amount of rotation or current angle is not easily discernable within the data. Additionally, there can be difficulties in data interpretation when the sensor is not standing upright with respect to gravity or the sensor does not move along the sensor axis due to the gravitational force and accelerations being injected into multiple channels. Time series data has typically been obtained using a sacrum mounted inertial/magnetic sensor [3,4]. Figure 1 shows six seconds of data (600 samples) from a sacrum mount sensor during 53 degree cutting run (zig zag run) including four times of directional change. The X-axis positioned mediolaterally, Y-axis was positioned longitudinally (Y positive down) and Z-axis was positioned anteroposterior. However it is obvious that it requires specialised and time consuming skills to interpret the data. To utilise and share the information obtained by the sensor with not only scientists and technicians but also coaches and athletes, it is important to present the information in an easier to understand form.
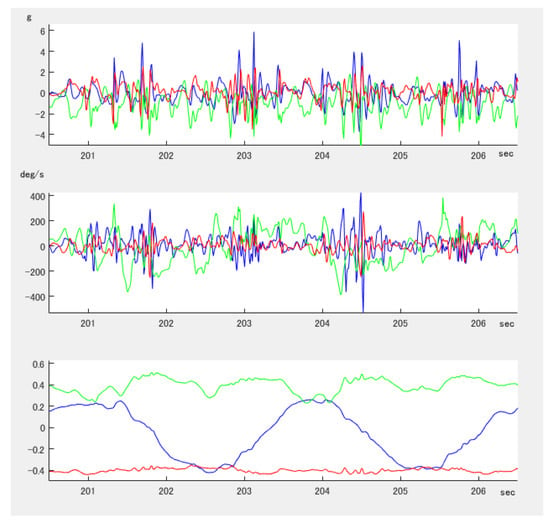
Figure 1.
A typical data obtained by a sacrum mounted 9DoF inertial-magnetic sensor. Accelerometer (top), gyroscope (middle), magnetometer (bottom).
Therefore we developed a 3D visualisation tool to provide a straightforward and intuitive way of observing the data from inertial magnetic sensors. This paper described the development of a tool to visualise the data three dimensionally.
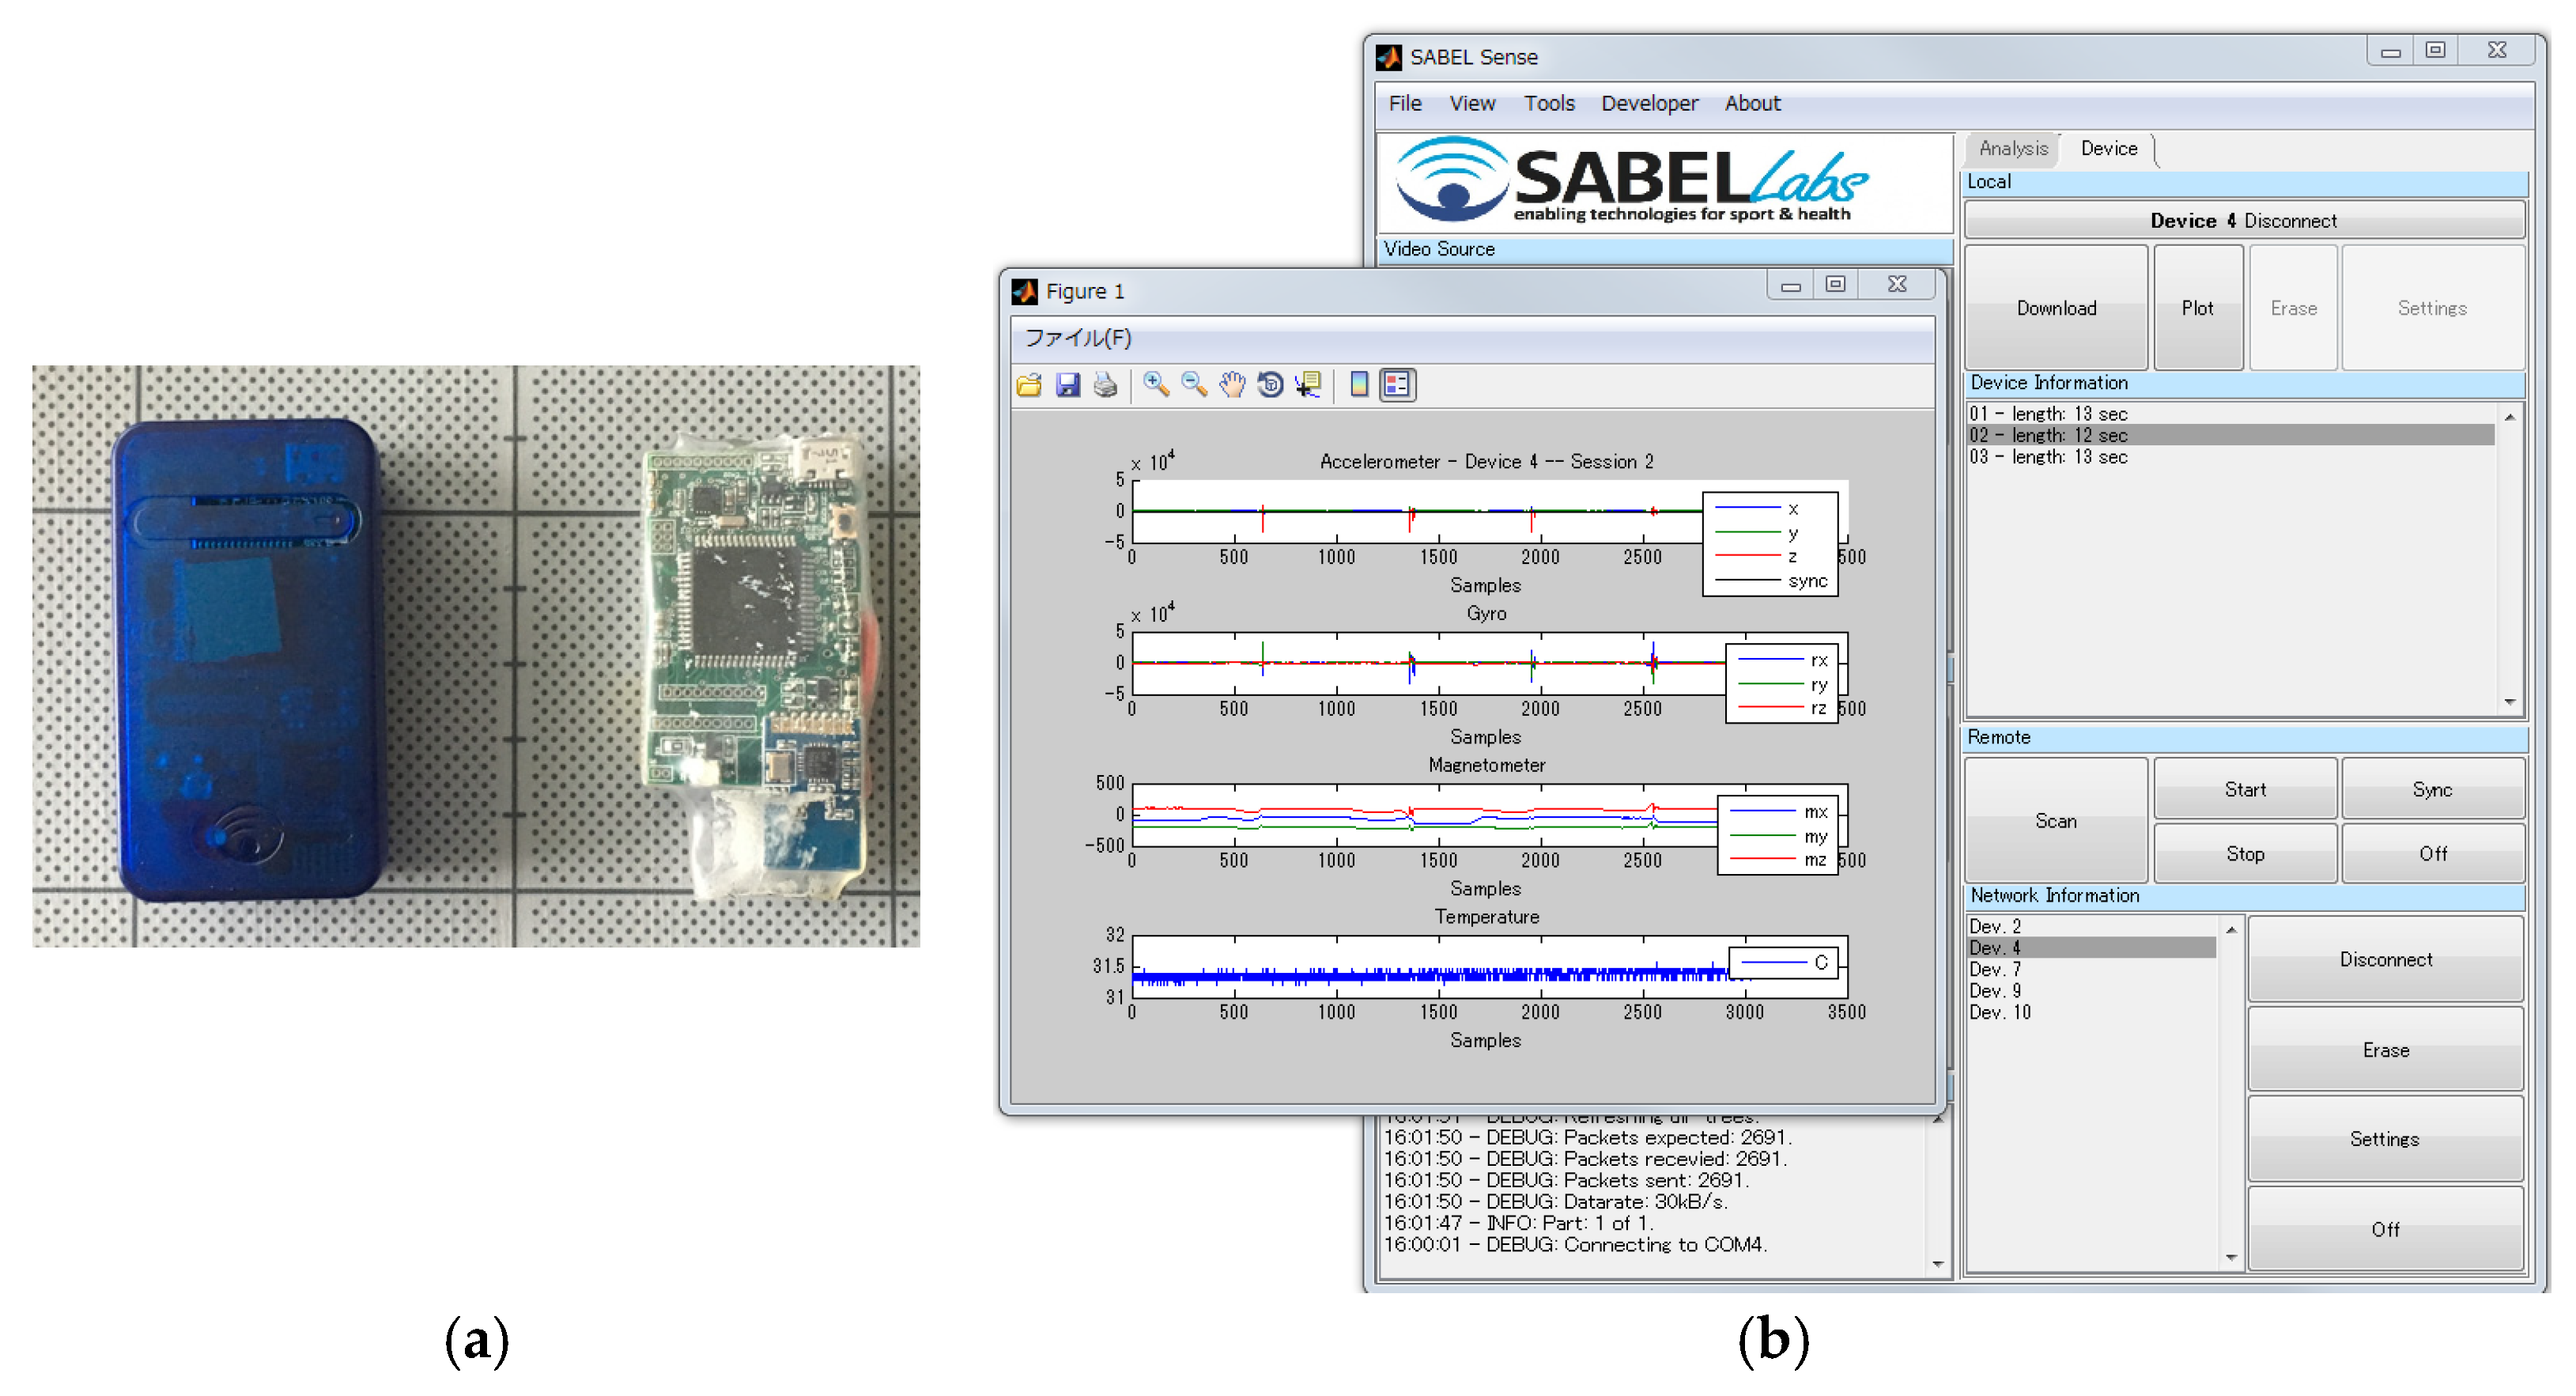
During the research, we adopted the in-house 9DoF inertial-magnetic sensor units [5]. The sensors encompass digital MEMS sensors, i.e., an accelerometer, a gyroscope and a digital magnetometer with data storage and a battery. The sensors can be controlled wirelessly with the comprehensive toolkit developed with MATLAB. The dimensions of the sensor unit are 57 mm × 32 mm × 15 mm with a weight of 23 g including plastic case (Figure 2a). The comprehensive toolkit for the sensor is also available (Figure 2b). A more detailed explanation has been reported previously [6,7].
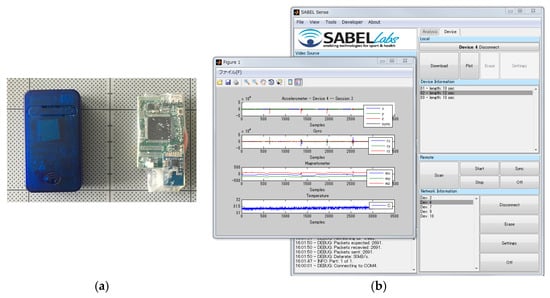
Figure 2.
Sabel Sense Wireless MEMS Inertial Sensor (a) Sensor units (in a plastic case (left) and in a heat shrink tube); (b) The comprehensive toolkit for wireless control, sensor calibration, real-time streaming, etc.
2. Visualisation of the 3D Orientation
A gyroscope in a sensor unit measures angular velocity. The angular velocity can be used to estimate a change in orientation of the sensor. However this integration approach will lead to a non-negligible accumulating error. An accelerometer measures the earth’s gravitational acceleration and a magnetic sensor measures the magnetic orientation so these provide an absolute reference of orientation and can be used for compensation of the error. Attitude and heading reference system (AHRS) is one of the sensor fusion techniques used to obtain orientation from inertial or inertial-magnetic sensors. In this research, we adopted an algorithm proposed by Madwick et al. [8]. This algorithm is relatively simple and light compared to other proposed algorithms, and also available as an open source resources [9].
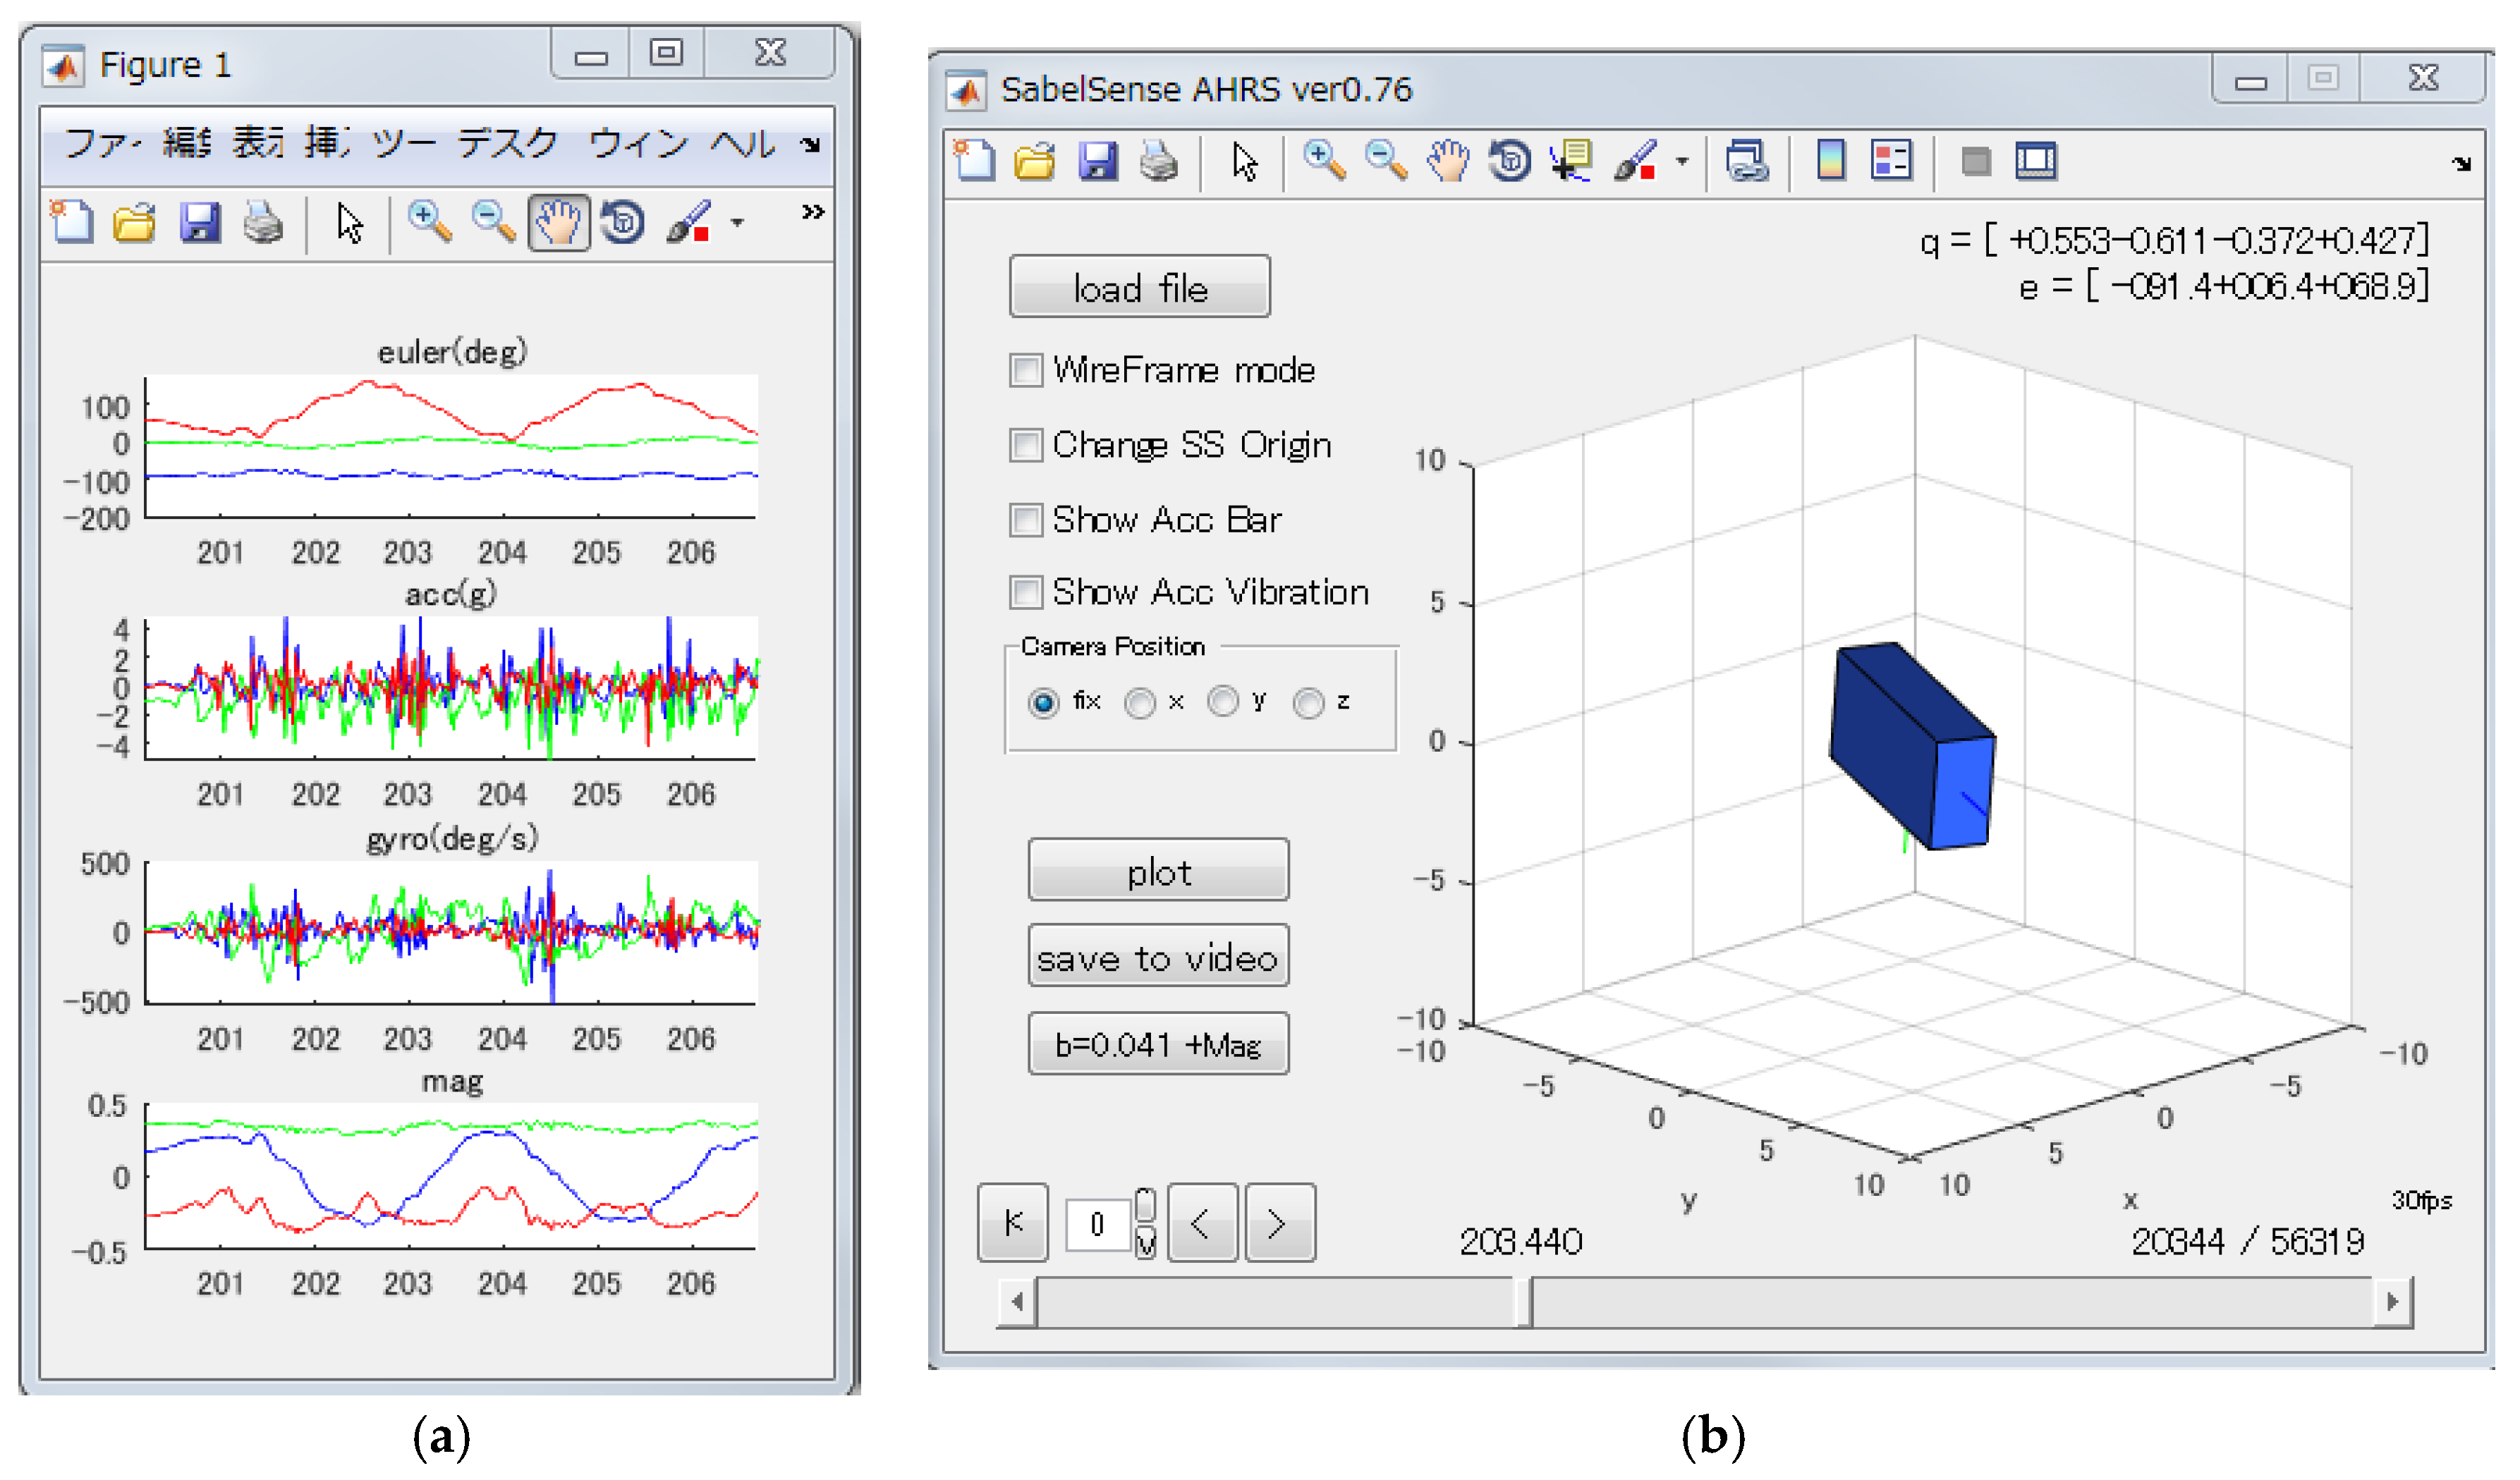
The AHRS algorithm uses quaternions to represents three dimensional orientations. Quaternions simplify computation and avoid the problem of Gimbal lock. A quaternion is a set of four values and it is impossible for a human to comprehend the sensor orientation from the quaternion values. Therefore, an animation display tool was developed, and quaternions were converted to the Euler representation, i.e., pitch, roll and yaw (heading) degrees and then displayed in a graph (Figure 3). In the animated display a blue box represents the orientation of the sensor and replays how the orientation changed. In a graph the orientation change is shown with the Euler representation. The red line at the Euler plot in Figure 3 clearly shows four times of directional changing at cutting run.
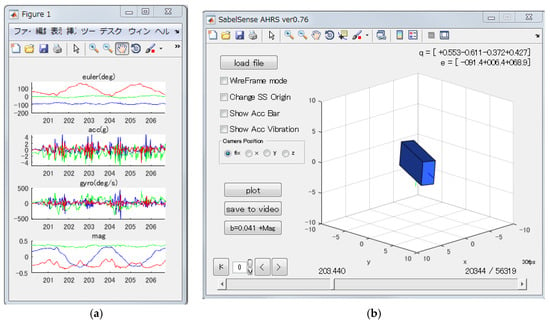
Figure 3.
A screenshot of the developed tool. (a) The top graph shows orientation changes with the Euler representation. The lines colored as pitch: blue, roll: green and yaw: red in the Euler expression. Another graphs are accelerometer, gyroscope and magnetometer. (b) The animated display of the 3D orientation.
3. Visualisation of the 3D Acceleration
Information from a sensor unit especially from a gyroscope and a magnetometer can be expressed in the 3D animation as orientation changes. However information from the accelerometer does not directly appear in the animation.
The data from an accelerometer alone is relatively difficult to interpret. The data is based on the sensor local coordinate system not global coordinate system and hence, it is difficult to determine the direction of acceleration in the real world. Furthermore the acceleration contains four separate components such as the gravitational, translational, centrifugal and tangential accelerations and it is virtually impossible to decompose all of them [10]. However, with AHRS algorithm the orientation of the sensor can be calculated, thus it becomes possible to subtract gravitational acceleration from sensor data. Moreover, if the magnitude and direction of the remaining acceleration can be expressed in the 3D animation, it helps to observe substantial acceleration in the global coordinate system.
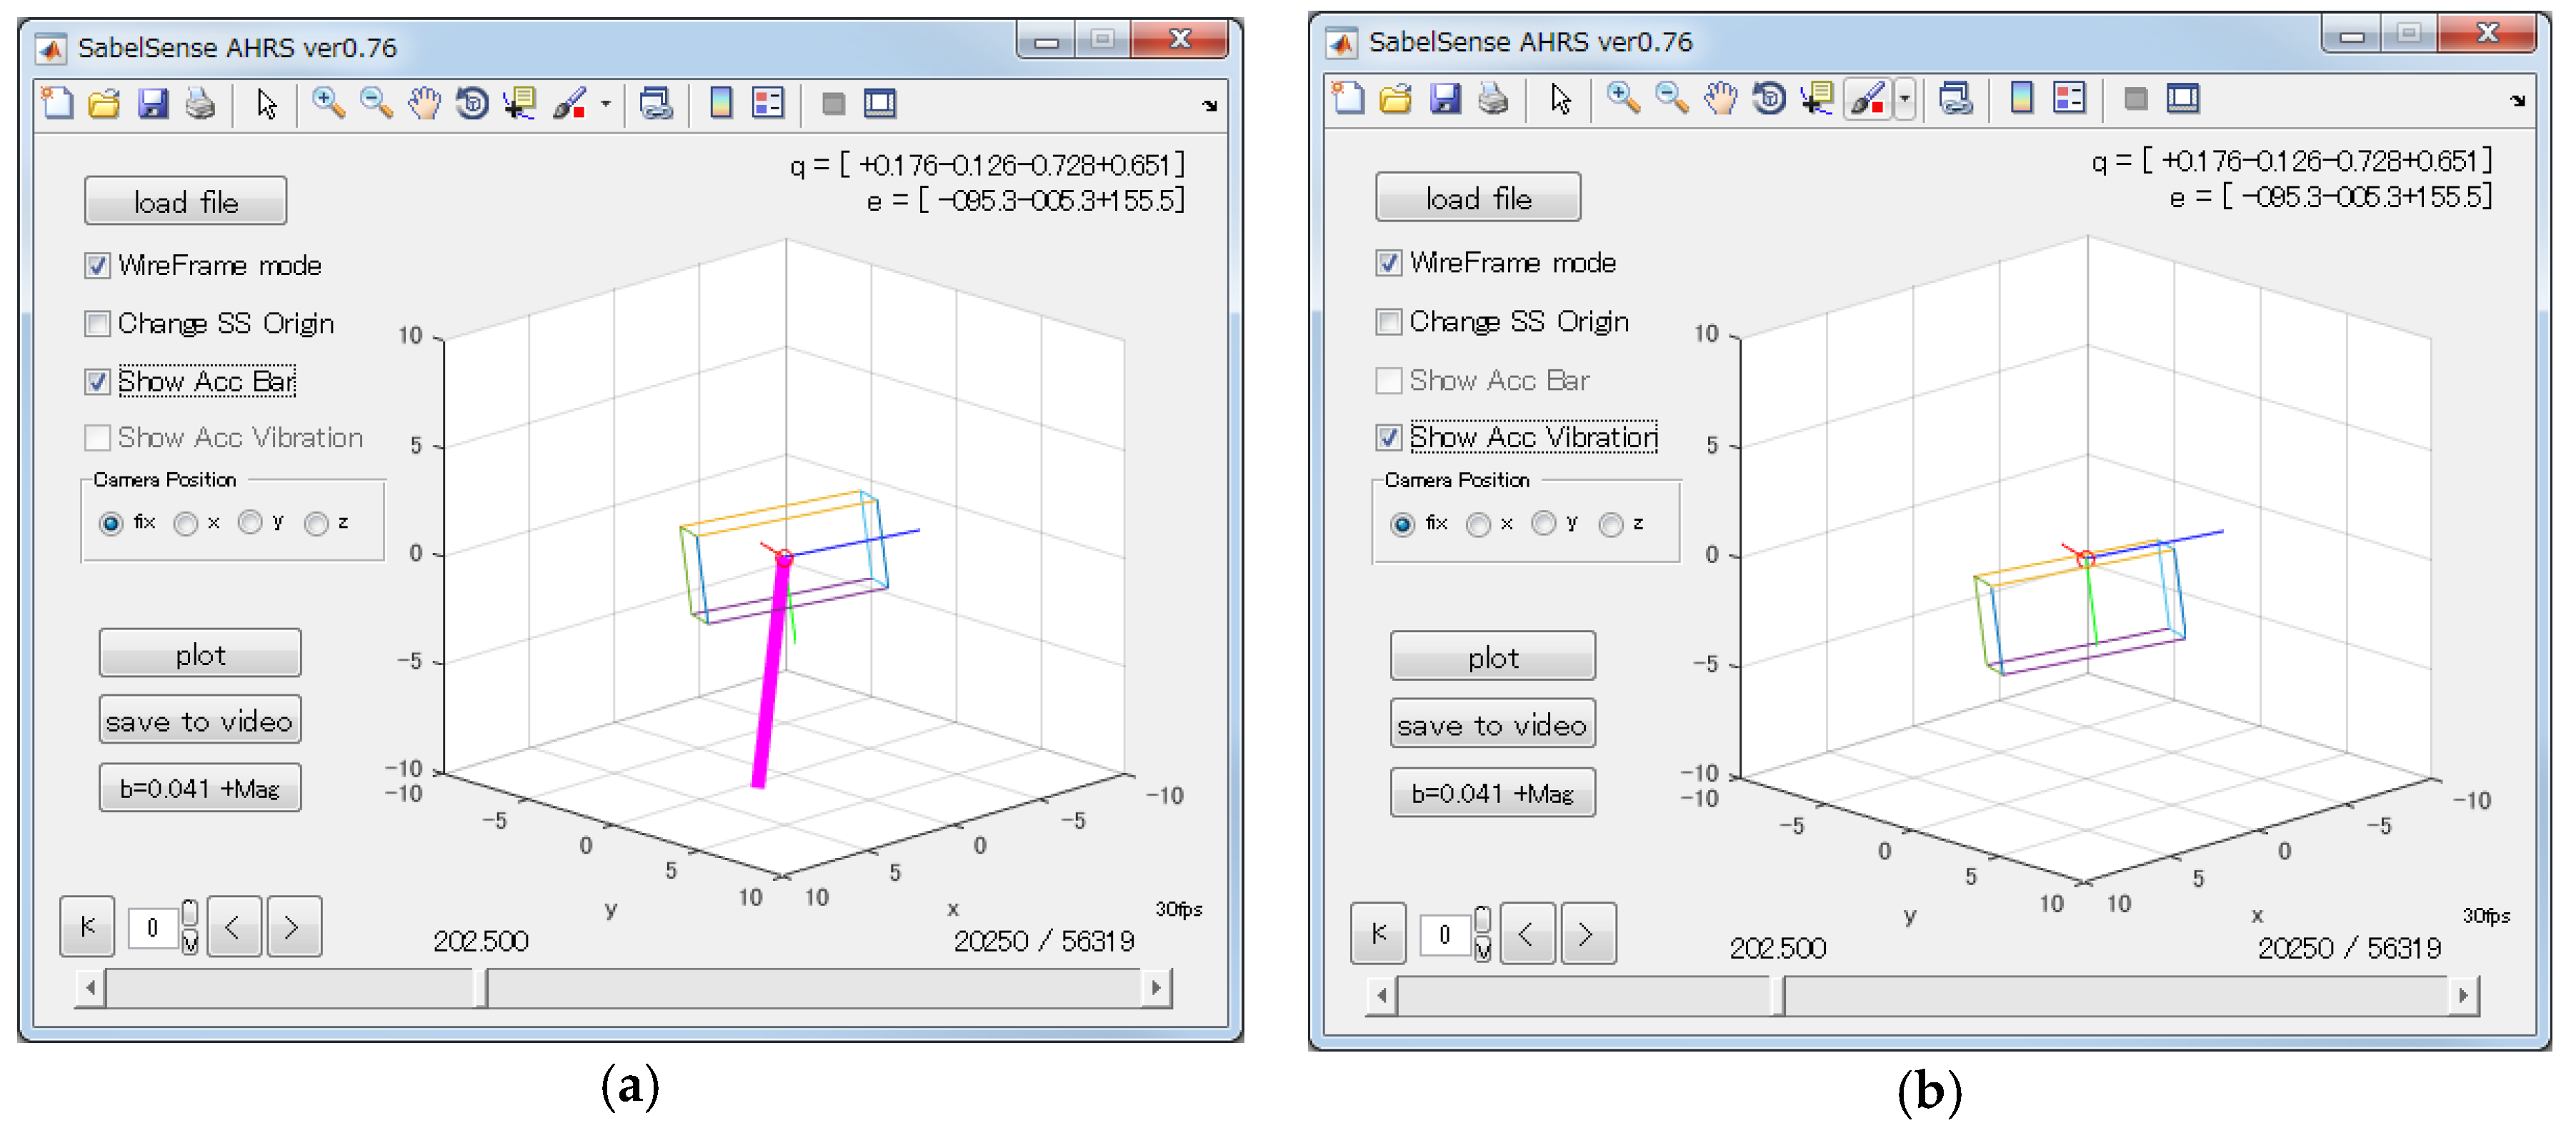
Initially, we tried to express the magnitude and direction of the acceleration with a bar (Figure 4a). In this overlaid animation, the pink bar displays a vector by showing the direction of the sensors acceleration, while its length shows the magnitude. This method works well and it can be used to display information from the accelerometer. However, generally the direction of the acceleration changes frequently. For example, if an athlete mounts a sensor on his/her sacrum and runs, positive and negative vertical accelerations appear repeatedly synchronised with steps. Because of this frequent directional change, it was difficult to observe the acceleration with a bar in the animation.
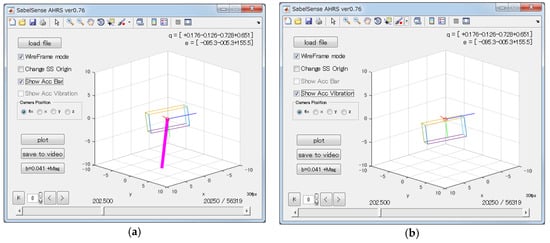
Figure 4.
Screenshots of acceleration visualisation. (a) Visualised acceleration with a bar; (b) Visualised acceleration with a displacement from the origin. Note that the sensor was written by wireframe, and with a bar method the length of a bar is 10 times longer than displacement length of shake method for the visibility.
Secondly, a novel method was implemented to supplement the shortcomings of the bar method. In the novel method, the box which expresses the orientation of the sensor was drawn not at the origin of the drawing coordinate system but displaced in accordance with magnitude and direction of acceleration (Figure 4b). As a result, the animation looks like the sensor is being shaken due to the accompanying acceleration.
The 3D acceleration vector in global coordination is defined by Equation (1). The quaternion product is denoted by . In the equation, the sensor local acceleration is rotated with quaternion obtained by AHRS and its quaternion conjugate , and then the gravity of the earth (1 g) is subtracted to remove gravitational force from the presentation. is an acceleration vector along with sensor local axis which calibrated and converted into the unit of g. As the first element of each acceleration vector, 0 is inserted to make 4 element vectors.
4. Soccer Simulation Circuit Tests
To check the validity of the developed tool, data from soccer simulation circuit tests were visualised and compared with the actual video taken during the tests. The circuit test consisted of several different trials including jog, run, sprint, turn, cutting maneuvers both with and without a ball. The 9DoF inertial-magnetic sensor was mounted at the sacral region (L5-S1 of the vertebra) with a fabric band with x-right, y-down, z-forward direction.
The 3D animation produced by the tool provided a straightforward way to understand the orientation of the sensor. The yaw angle in the animation clearly showed changes of direction along with turns of the athletes. Anterior tilts during acceleration and posterior tilts during deceleration in run and sprint were also easily confirmed by pitch angles of the sensor in the animation.
With the acceleration visualisation function, the magnitude and direction of acceleration can be confirmed with the animation. The run cycles during jogs were easily found with the animation because large vertical acceleration appeared repeatedly synchronised with foot contacts. The intensity of the run affected both vertical and horizontal accelerations and it was visually recognised as the displacement length from the origin in the animation (Figure 5). Therefore supporting what is known about running i.e., as velocity increases, anterior force increases more than vertical force which affecting the vertical centre of mass displacement. Dribbling a ball did not overly affect to the acceleration, however, a large acceleration was confirmed as a large displacement at hard instep kicks.
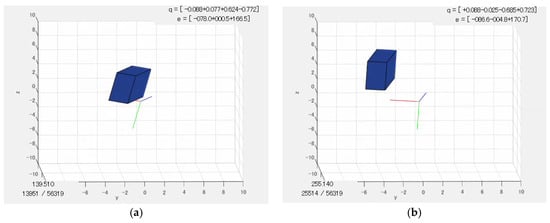
Figure 5.
The typical sample of an acceleration at left foot contacts during jog (a) and sprint (b). The displacement direction from origin shows direction of acceleration (up-forward) and its displacement length shows magnitude of acceleration measured by the sacrum mount sensor. In these tests, a participant move from right to left side on the screen.
5. Conclusions
We have developed an effective visualisation tool for inertial/magnetic wearable sensors. It creates a 3D animation of a sensor to observe direction and/or acceleration measured by the sensor. Sacrum mounted sensor data was visualised with the developed tool to verify its effectiveness. It clearly portrayed athlete posture and a heading direction and simultaneously demonstrated magnitude and direction of accelerations in the animation. This novel presentation method allows non-experts to read the data in more intuitive and user-friendly way. These tools may expand the range of utilisation of sensors in sporting activities. Future work will be to seamlessly integrate this method into the comprehensive toolkit.
Acknowledgments
This work was supported by JSPS KAKENHI Grant Number JP17K01675.
Conflicts of Interest
The authors declare no conflict of interest.
References
- Chambers, R.; Gabbett, T.J.; Cole, M.H.; Beard, A. The Use of Wearable Microsensors to Quantify Sport-Specific Movements. Sports Med. 2015, 45, 1065–1081. [Google Scholar] [CrossRef] [PubMed]
- Camomilla, V.; Bergamini, E.; Fantozzi, S.; Vannozzi, G. In-Field Use of Wearable Magneto-Inertial Sensors for Sports Performance Evaluation. In Proceedings of the 33rd International Conference on Biomechanics in Sports, Poitiers, France, 29 June–3 July 2015; pp. 1425–1428. [Google Scholar]
- Lee, J.B.; Mellifont, R.B.; Burkett, B.J. The use of a single inertial sensor to identify stride, step, and stance durations of running gait. J. Sci. Med. Sport 2010, 13, 270–273. [Google Scholar] [CrossRef] [PubMed]
- Lee, J.; Leadbetter, R.; Ohgi, Y.; Thiel, D.; Burkett, B.; James, D.A. Quantifying and assessing biomechanical differences in swim turn using wearable sensors. Sports Technol. 2011, 4, 128–133. [Google Scholar] [CrossRef]
- SABEL Sense|SABEL Labs. Available online: https://sabellabs.com/sense/ (accessed on 15 September 2017).
- James, D.A.; Leadbetter, R.I.; Neeli, M.R.; Burkett, J.; Thiel, D.V.; Lee, J.B. An integrated swimming monitoring system for the biomechanical analysis of swimming strokes. Sports Technol. 2011, 4, 141–150. [Google Scholar] [CrossRef]
- Leadbetter, R.; James, D. Platform technologies and Visual analytics for inertial sensors. J. Fit. Res. 2016, 5, 4–6. [Google Scholar]
- Madgwick, S.O.H.; Harrison, A.J.L.; Vaidyanathan, R. Estimation of IMU and MARG orientation using a gradient descent algorithm. In Proceedings of the 2011 IEEE International Conference on Rehabilitation Robotics (ICORR), Zurich, Switzerland, 29 June–1 July 2011. [Google Scholar] [CrossRef]
- X-io Technologies—Wireless IMU and I/O devices. Available online: http://x-io.co.uk/ (accessed on 15 September 2017).
- Ohgi, Y. MEMS Sensor Application for the Motion Analysis in Sport Sensors. In Proceedings of the 18th International Congress of Mechanical Engineering (ICME), 3–4 November 2006; Volume 2, pp. 501–508. [Google Scholar]

Publisher’s Note: MDPI stays neutral with regard to jurisdictional claims in published maps and institutional affiliations. |
© 2018 by the authors. Licensee MDPI, Basel, Switzerland. This article is an open access article distributed under the terms and conditions of the Creative Commons Attribution (CC BY) license (https://creativecommons.org/licenses/by/4.0/).