Abstract
The determination of evapotranspiration (ET) using ground-based meteorological data does not adequately capture the spatial patterns of mass and energy fluxes in mountainous areas. In this work, we evaluate the daily spatial distribution of ET over a mountainous watershed in southeastern Brazil by coupling Surface Energy Balance Algorithms for Land (SEBAL), a global solar radiation (GSR) model, and a gridded weather dataset (GWD). To estimate daily tilted GSR, we use the relation between terrain and sun angles over a 24-h integration time. Tests were performed in summer/wet (12 January 2015) and winter/dry (25 September 2015) periods to evaluate the seasonal differences in ET over tilted surfaces. The results indicated different spatial patterns of daily ET on the watershed in each period. In summer, ET was 9.8% higher on slopes facing South, while in winter, ET was 10.6% higher on slopes facing North and East. A high variability in daily ET was found on steeper slopes (above 45°) in both periods. The notable ET spatial heterogeneity indicates the complex partitioning of mass and energy fluxes from different terrain angles, which may influence hydroecological processes at the local scale. The presented approach allowed a more detailed capture of the spatial variability of ET in a mountainous watershed with scarce ground-based data.
1. Introduction
On mountainous and heterogeneous landscapes, evapotranspiration (ET) estimations using remote sensing becomes more complex, due mainly to the difficulties with estimating net radiation in different slopes and terrain azimuths, and the uncertainties regarding energy and mass transfer processes, such advection and local wind flow.
Some authors have developed techniques to evaluate the influence of topography on actual ET estimate by remote sensing [1], as well as on reference ET [2] and surface energy fluxes [3]. In these applications, the correted net radiation for tilted surfaces was obtained from parameterizations using global solar radiation (GSR) modeling, considering different slopes and azimuths of terrain.
At the watershed scale, the ET estimate using ground meterological stations does not adequately capture the spatial patterns of mass and energy fluxes. The required ground-based meteorological data of the most used remote sensing models for ET retrieval may affect the spatial accuracy, especially in areas with high weather/environmental variability. This issue was addressed by [4] in an approach using raster meteorological data as input to the Surface Energy Balance Algorithms for Land (SEBAL) model.
With the availability of gridded weather datasets (GWD) based on atmospheric reanalysis and numerical weather forecasts, it became feasible to incorporate the spatialized meteorological information into evapotranspiration models in areas with scarcity ground data. The Global Land Data Assimilation System (GLDAS) represents the state-of-the-art of GWD built using advanced land surface modeling and data assimilation techniques that support several water resource applications [5].
In this work, we evaluate the daily spatial distribution of ET over a mountainous watershed in southeastern Brazil in summer/wet and winter/dry periods, by coupling Surface Energy Balance Algorithms for Land (SEBAL) and global solar radiation (GSR) models, which we adapt for tilted surfaces, using the gridded dataset from GLDAS as meteorological input.
2. Experiments
2.1. Study Area
This study area was the Paraibuna watershed in the southeastern region of Brazil (Figure 1).
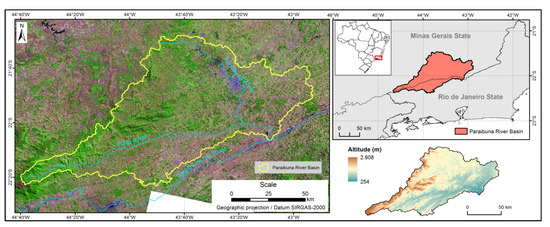
Figure 1.
Location of the Paraibuna watershed.
This watershed is a tributary of the Paraiba do Sul River, and covers an area of approximately 8500 km2, of which 64% is covered by pasture and croplands, 34% is covered by forests, and only 1.2% is covered by urban areas [6]. The regional climate is mild-mesothermic, with an annual average temperature of 21° Celsius, and a total annual rainfall ranging from 1000 mm to 2000 mm. Rugged terrain (slope >25°) occurs in 14% of the basin, and altimetric amplitude is about 2300 m, with minimum and maximum altitudes of 254 m and 2608 m, respectively.
2.2. Materials and Methods
2.2.1. Datasets
Since the studied watershed covers two Landsat-8 satellite scenes, the images were selected from four dates, on 12 January 2015 (summer) and 25 September 2015 (close to winter) of path/row 217/75, and 19 January 2015 (summer) and 31 August 2015 (winter) of path/row 218/75. Surface reflectance and thermal data was obtained from Landsat Collection Level-1 and Level-2 products, respectively, through the EarthExplorer website (https://earthexplorer.usgs.gov/). These scenes were selected because of the low cloud cover, which was less than 5%.
The input data set used in this study is summarized in Table 1.

Table 1.
General characteristics of input datasets used in the study.
2.2.2. GLDAS Data Preparation
The three-hourly GLDAS data were downloaded from the GES DISC (Goddard Earth Sciences Data and Information Services Center) website (https://disc.sci.gsfc.nasa.gov/), covering the same dates as the Landsat-8 images. The GLDAS data preparation strategy was composed of three main tasks: (1) temporal fit to Landsat overpass; (2) daily aggregation; and (3) spatial resample to 30-m resolution.
The temporal fit to Landsat overpass time (aproximately 13 Coordinated Universal Time—UTC) was performed through a linear interpolation of the GLDAS data at 12 h and 15 h UTC.
Daily aggregation was performed by simple averaging the three-hourly GLDAS files per day (eight files) for each variable. The method used for spatial resampling to 30-m resolution was the bilinear interpolation. For simplification purposes, spatial downscaling methods were not used.
2.2.3. Solar Radiation Model
To estimate daily tilted GSR (GSRT), the HDKR (Hay, Davies, Klucher, and Reindl) solar radiation model was applied for instantaneous calculations, assuming clear sky conditions, according to [7,8]. To estimated the 24 h average of GSRT, the instantaneous values computed from 9 h to 21 h UTC were numerically integrated.
2.2.4. SEBAL Model Adaptations for Tilted Surfaces
The implementation of SEBAL, which was adapted for tilted surfaces, was performed basically by modifications in the surface albedo (α), incoming shortwave radiation (RS↓), and surface temperature (Ts), as described next. These parameters are critical inputs in energy balance formulations. Details about theoretical and operational steps to compute each component of energy balance equation in the SEBAL model can be found in [9].
The surface albedo (α) was computed through the integration of OLI/Landsat-8 surface reflectance bands using the approach described in [10]. This approach was applied over the terrain-corrected OLI bands by the SCS+C algorithm [11] to derive the topographically-corrected surface albedo (αT).
The incoming shortwave radiation (RS↓) used in the SEBAL model was the instantaneous tilted GSR computed by the HDKR model instead of the general equation that was presented in [9].
The surface temperature from TIRS/Landsat-8 thermal data (band 10) was corrected, due to the temperature gradient caused by elevation, using a lapse rate coefficient derived by a linear regression between the surface temperature (Ts) and the pixel altitude.
The 24-h actual evapotranspiration (ET24) was calculated using a reference ET fraction (ETrF) at the time of the Landsat overpass to extrapolate the instantaneous estimates of ET by the SEBAL model to values for daily periods. The ETrF and ET24 were computed by Equations (1) and (2):
where ETinst is the hourly ET estimated by the SEBAL method, ET0 and ET0 24 are the hourly and daily alfafa reference evapotranspiration computed by the American Society of Civil Engineers (ASCE) Penman-Monteith equation [12], respectively. Both the ET0 and ET0 24 computations used meteorological data from GLDAS and solar radiation from the tilted GSR model.
ETrF = ETinst/ET0,
ET24 = ETrF × ET0 24,
3. Results
3.1. Spatial Distribution of GSRT 24 and ET24 over the Terrain Angles
In the Paraibuna watershed, the average value of GSRT24 obtained from the solar radiation model was 313.6 W·m−2 in summer, ranging from 78.9 W·m−2 to 346 W·m−2. In winter, the average value was 264.4 W·m−2, ranging from 31.7 W·m−2 to 306 W·m−2. The average ET24 obtained from the modified SEBAL model, in summer and winter, were 4.98 mm·day−1 and 4.07 mm·day−1, whereas the maximum average values were 5.48 mm·day−1 and 5.10 mm·day−1, respectively.
Table 2 and Table 3 shows the distribution of the mean and coefficient of variation (CV) of ET24 taking into account the different slopes and azimuths of terrain in the two evaluated periods.
Table 2.
Mean and coefficient of variation (CV) of ET24 on different terrain slopes over the Paraibuna watershed.
Table 3.
Mean and CV of ET24 on different terrain azimuths over the Paraibuna watershed.
Steeper slopes (above 45°) a higher variability (higher CV) of ET24 was found, with a CV of about 25% in summer and 43.6% in winter. In contrast, these areas showed the lowest mean values of ET24 with 2.7 mm.day−1 and 2.4 mm.day−1 in summer and winter, respectively.
According to Figure 2 below, the GSRT 24 and ET24 spatial distribution on the watershed showed differences between the two periods, especially in areas with slopes above 45°. In summer, the GSRT 24 and ET24 distributions were more homogeneous, with slightly higher values on the southern slopes, with differences of 9.8% for ET24. In contrast, in winter, the highest ET24 values occurred on the slopes facing North and East, while the lowest ET24 values occurred on the slopes facing South and West, with average differences of about 10.6% and 11.9%, respectively.
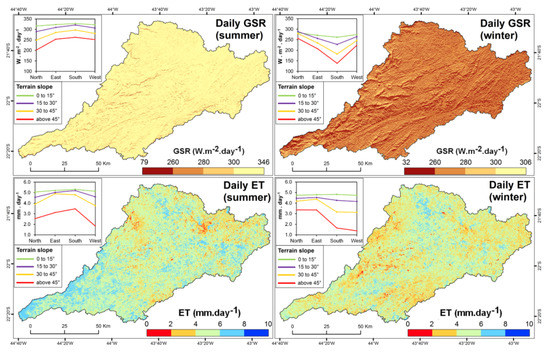
Figure 2.
Global solar radiation (GSRT 24) and evapotranspiration (ET24) maps in summer (Left) and winter (Right) on the Paraibuna watershed.
3.2. Statistical Relations between Terrain Angles, GSRT 24, and ET24
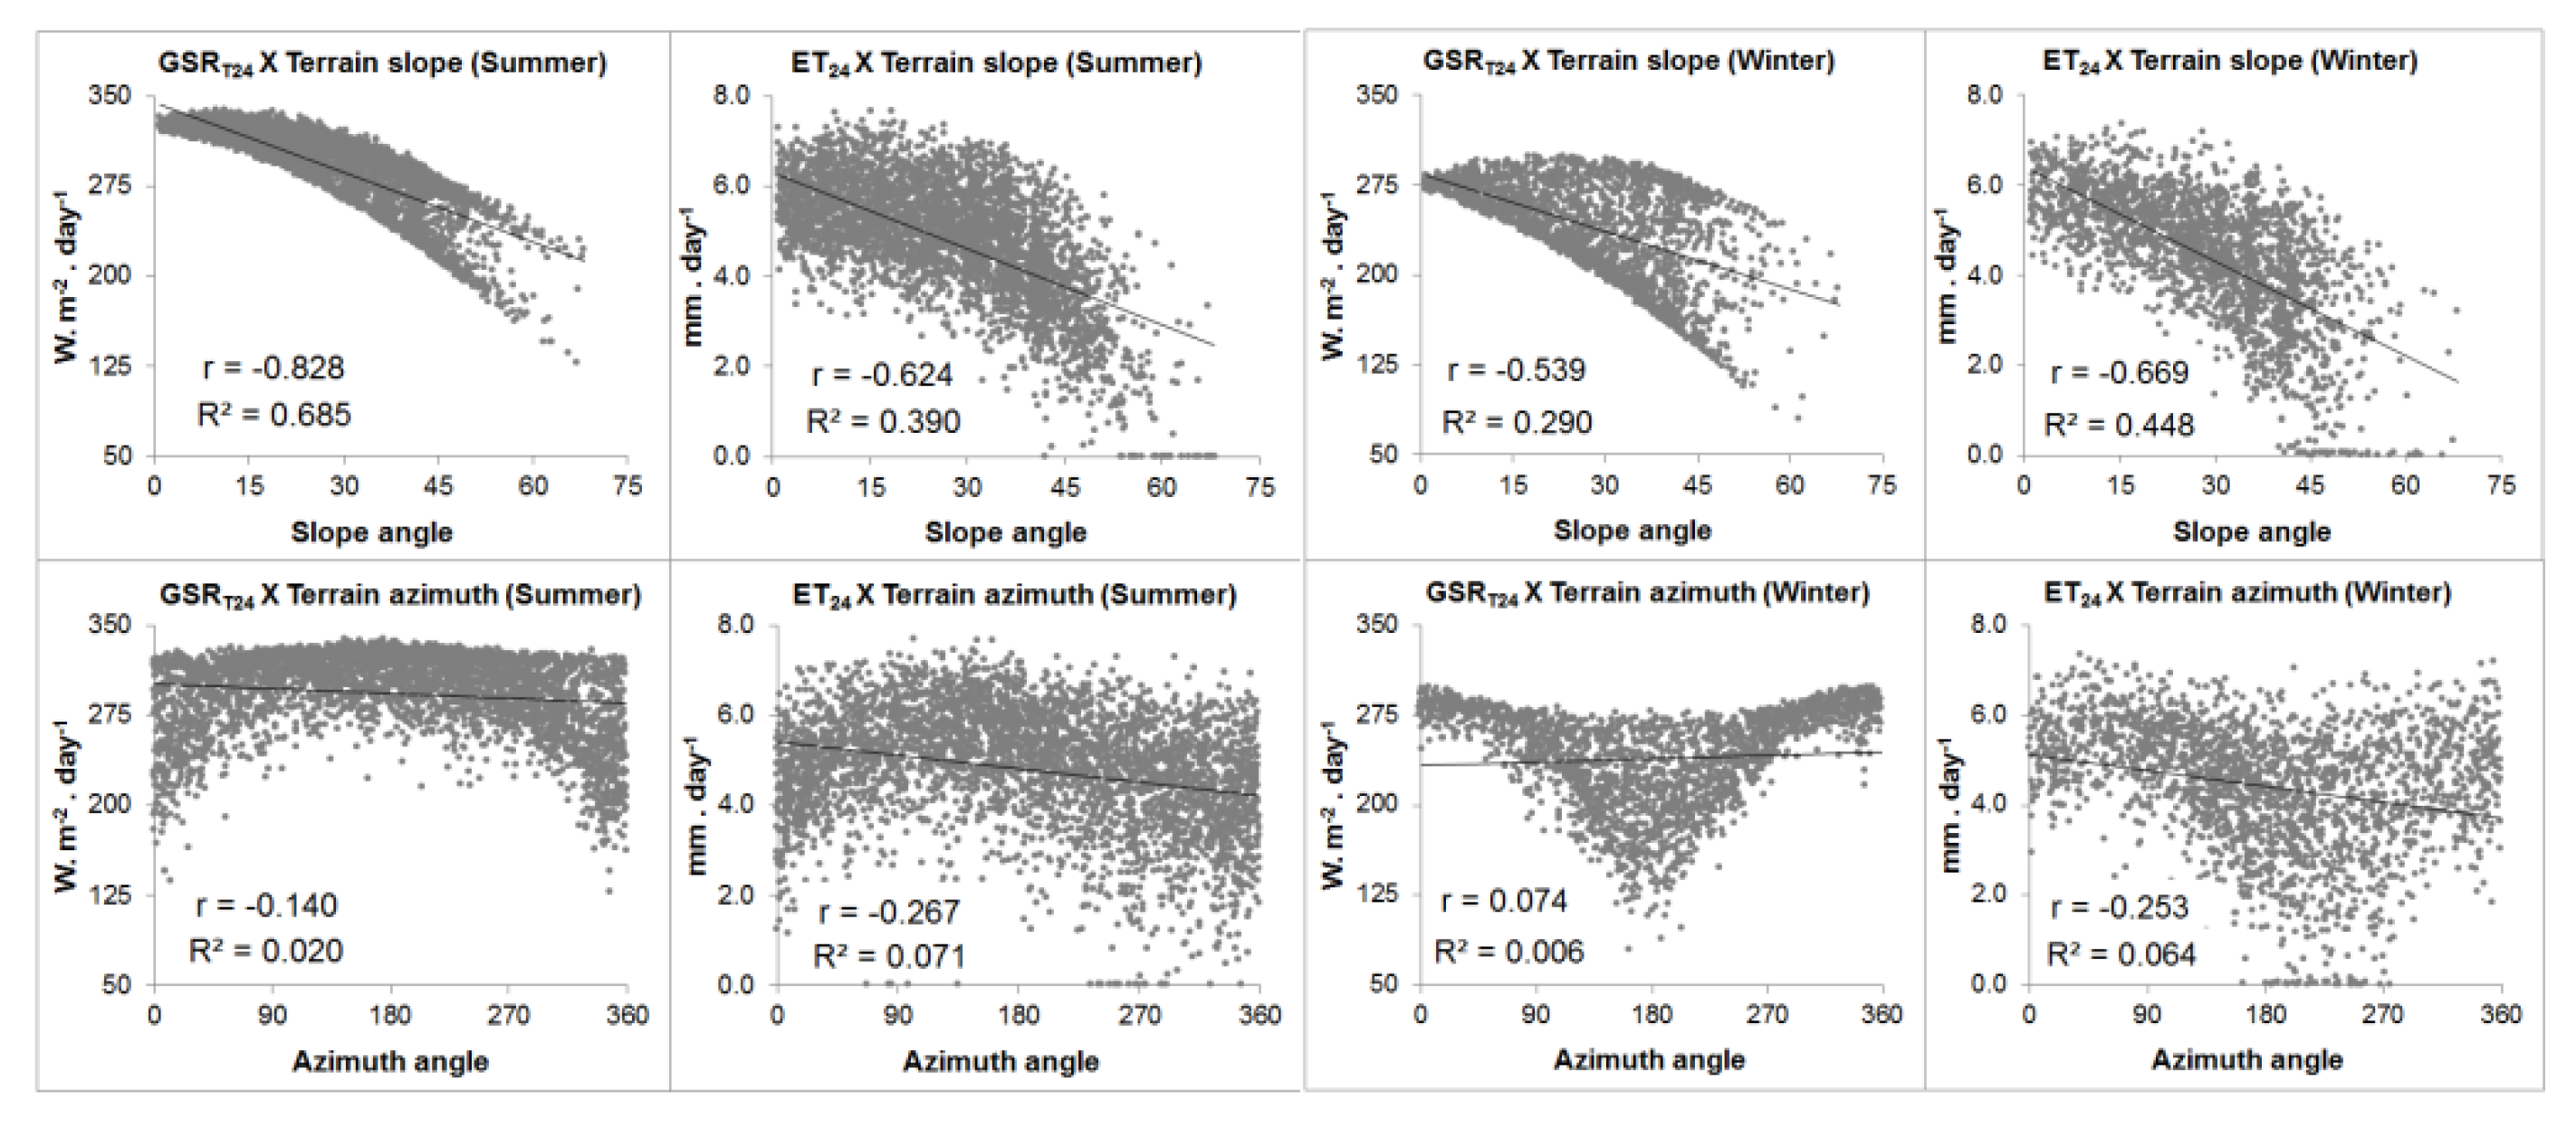
As shown in the plots of Figure 3 below, both GSRT 24 and ET24 values showed higher relationships with the terrain slope values, with negative correlation coeficients (r) of −0.82 (R2 0.68) and −0.62 (R2 0.39) in summer, and −0.54 (R2 0.29) and −0.67 (R2 0.45) in winter, respectively. In contrast, the correlation coeficient between GSRT 24 and ET24 with the terrain azimuth values were weaker in both periods, with a R2 less than 0.1. In these selected areas, we found a significant relation between GSRT 24 and ET24 values, with a correlation coeficient of 0.68 (R2 0.47) in summer and 0.65 (R2 0.42) in winter.
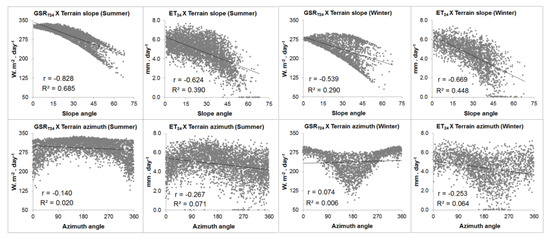
Figure 3.
Distribution plot of GSRT 24 and ET24 in relation to the slope (Top) and azimuth (Bottom), in non-flat forested areas (Slope > 1° and NDVI > 0.7).
4. Discussion
The notable spatial difference in GSRT 24 and ET24 between the two evaluated periods can be explained in a way by the significant influence of topography, mainly the slope angle, as shown by the high coefficients of variation in slopes above 45°, and the R2 of the distribution plots. In general, ET values followed the spatial distribution of the GSR. However, the average ET of slopes facing West was inconsistent with the average GSR values, especially in winter. This can occur due to some limitations in extrapolating from instantaneous to daily values using the reference ET fraction (ETrF) at the times of Landsat overpass in mountainous areas. Another source of uncertainties is the relationship between the terrain angles and the land surface temperature (LST). Future research should also investigate the impact of topography on remotely-sensed LST and ETrF, and their influence on ET estimation over this watershed. In addition, future field validation campaigns may better evaluate the preliminary results of this study.
5. Conclusions
In this work, the SEBAL adaptations for mountainous areas and the integration with a solar radiation model for tilted surfaces and the GLDAS meteorological dataset allowed a detailed capture of the spatial variability of ET in the Paraibuna watershed without the use of ground data. The analysis takes into account different slopes and azimuths of terrain, which can improve ET analysis in a mountainous basin with scarce ground-based data.
Conflicts of Interest
The authors declare no conflict of interest.
References
- Gao, Y.C.; Long, D.; Li, Z.L. Estimation of daily actual evapotranspiration from remotely sensed data under complex terrain over the upper Chao river basin in North China. Int. J. Remote Sens. 2008, 29, 3295–3315. [Google Scholar] [CrossRef]
- Aguilar, C.; Herrero, J.; Polo, M.J. Topographic effects on solar radiation distribution in mountainous watersheds and their influence on reference evapotranspiration estimates at watershed scale. Hydrol. Earth Syst. Sci. 2010, 14, 2479–2494. [Google Scholar] [CrossRef]
- Chen, X.; Su, Z.; Ma, Y.; Yang, K.; Wang, B. Estimation of surface energy fluxes under complex terrain of Mt. Qomolangma over the Tibetan Plateau. Hydrol. Earth Syst. Sci. 2013, 17, 1607–1618. [Google Scholar] [CrossRef]
- Elhaddad, A.; Garcia, L.A. ReSET-Raster: Surface Energy Balance Model for Calculating Evapotranspiration Using a Raster Approach. J. Irrig. Drain. Eng. 2011, 137, 203–210. [Google Scholar] [CrossRef]
- NASA. LDAS Land Data Assimilation Systems. Available online: https://ldas.gsfc.nasa.gov/gldas/ (accessed on 12 December 2017).
- MAPBIOMAS. Project MapBiomas—Collection 2 of Brazilian Land Cover & Use Map Series. Available online: http://mapbiomas.org/ (accessed on 12 December 2017).
- Duffie, J.A.; Beckman, W.A. Solar Engineering of Thermal Processes, 4th ed.; John Wiley & Sons: Hoboken, NJ, USA, 2013; 910p. [Google Scholar]
- Wong, L.T.; Chow, W.K. Solar radiation model. Appl. Energy 2001, 69, 191–224. [Google Scholar] [CrossRef]
- Waters, R.; Allen, R.G.; Tasumi, M.; Trezza, R. Surface Energy Balance Algorithms for Land; Idaho Implementation; Advance Training and Users Manual, Version 1.0; Idaho Department of Water Resources: Boise, ID, USA, 2002; p. 98. [Google Scholar]
- Tasumi, M.; Allen, R.G.; Trezza, R. At-surface reflectance and Albedo from satellite for operational calculation of land surface energy balance. J. Hydrol. Eng. 2008, 13, 51–63. [Google Scholar] [CrossRef]
- Soenen, S.A.; Peddle, D.R.; Coburn, C.A. SCS + C: A modified Sun-Canopy Sensor topographic correction in forested terrain. IEEE Trans. Geosci. Remote Sens. 2005, 43, 2148–2159. [Google Scholar] [CrossRef]
- ASCE–EWRI. The ASCE Standardized Reference Evapotranspiration Equation; Report 0-7844-0805-X; ASCE Task Committee on Standardization of Reference Evapotranspiration; American Society of Civil Engineers: Reston, VA, USA, 2005; p. 70. [Google Scholar]

Publisher’s Note: MDPI stays neutral with regard to jurisdictional claims in published maps and institutional affiliations. |
© 2018 by the authors. Licensee MDPI, Basel, Switzerland. This article is an open access article distributed under the terms and conditions of the Creative Commons Attribution (CC BY) license (https://creativecommons.org/licenses/by/4.0/).