1. Introduction
Oral squamous cell carcinoma (OSCC) is often preceded by “oral potentially malignant disorders” (OPMDs), “morphological alterations amongst which some may have an increased potential for malignant transformation”, including leukoplakia, erythroplakia, oral submucous fibrosis, oral lichen planus, and actinic keratosis [1]. OSCC pathogenesis is a multistep process in which multiple genetic events occur that alter the normal functions of oncogenes and tumor suppressor genes [2]. Recently, tissues autofluorescence (AF) has demonstrated a better efficiency in detection of oral mucosa alterations. However, few studies providing the molecular validation of this application are available. The aim of this study was to analyze the gene expression of 45 genes using RNA sequencing evaluating the accuracy of AF imaging compared to white light for determination of bioptic margins in OPMDs and OSCC.
2. Material and Methods
The study population was represented by 7 patients with suspicion of OPMD or OSCC. After medical anamnesis, the lesions were evaluated under white light and then with VELscope ™ (Figure 1). Bioptic specimens were taken at 3 different sites for each lesion: centre (L), white light margin (MC) and AF visualized margin (MF) (Figure 2). Custom-made TaqMan arrays containing 45 were used to perform gene expression analysis. Data were analyzed by Multiple t test considering significant a p value < 0.05. Gene Ontology was used to biological pathway analysis. Analyzed genes were involved in important growth pathways such as support of cell proliferation, cell adhesion and angiogenesis [3].

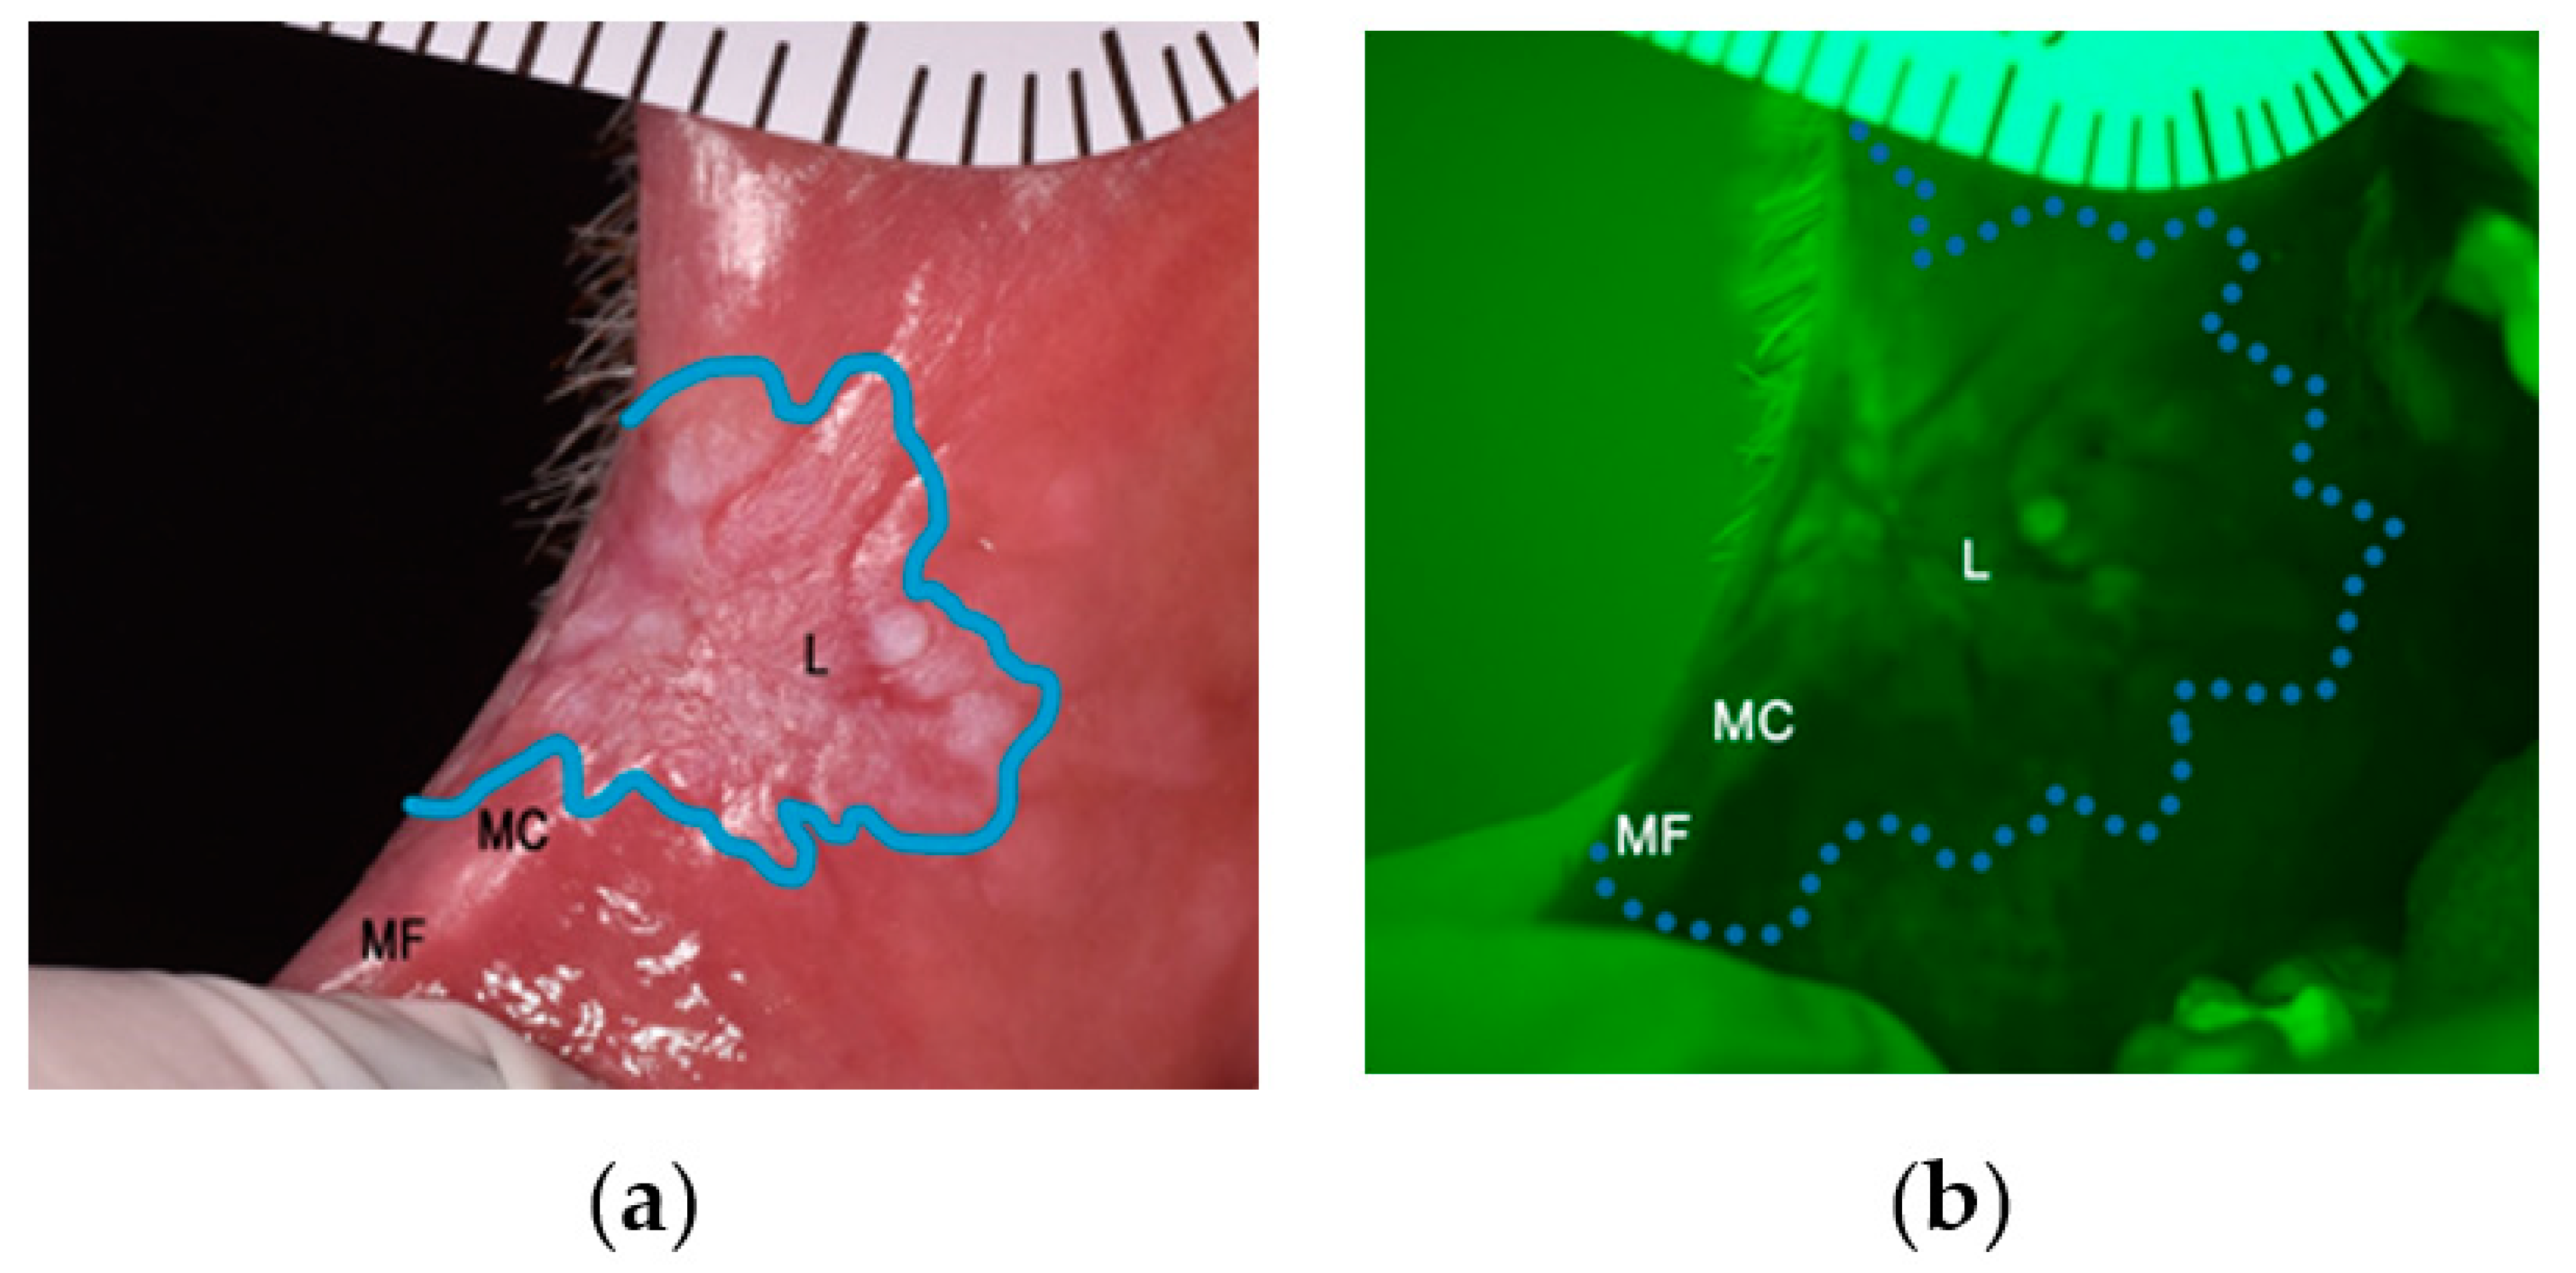
Figure 1.
(a) Example of an OPMD (leukoplakia) on the right cheek viewed under white light; (b) Leukoplakia displaying loss of autofluorescence when visualised using VELscope.
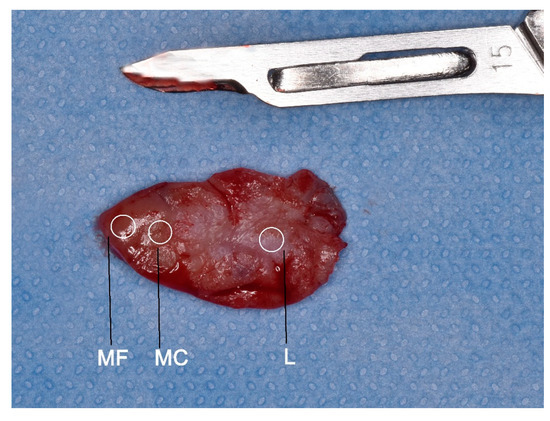
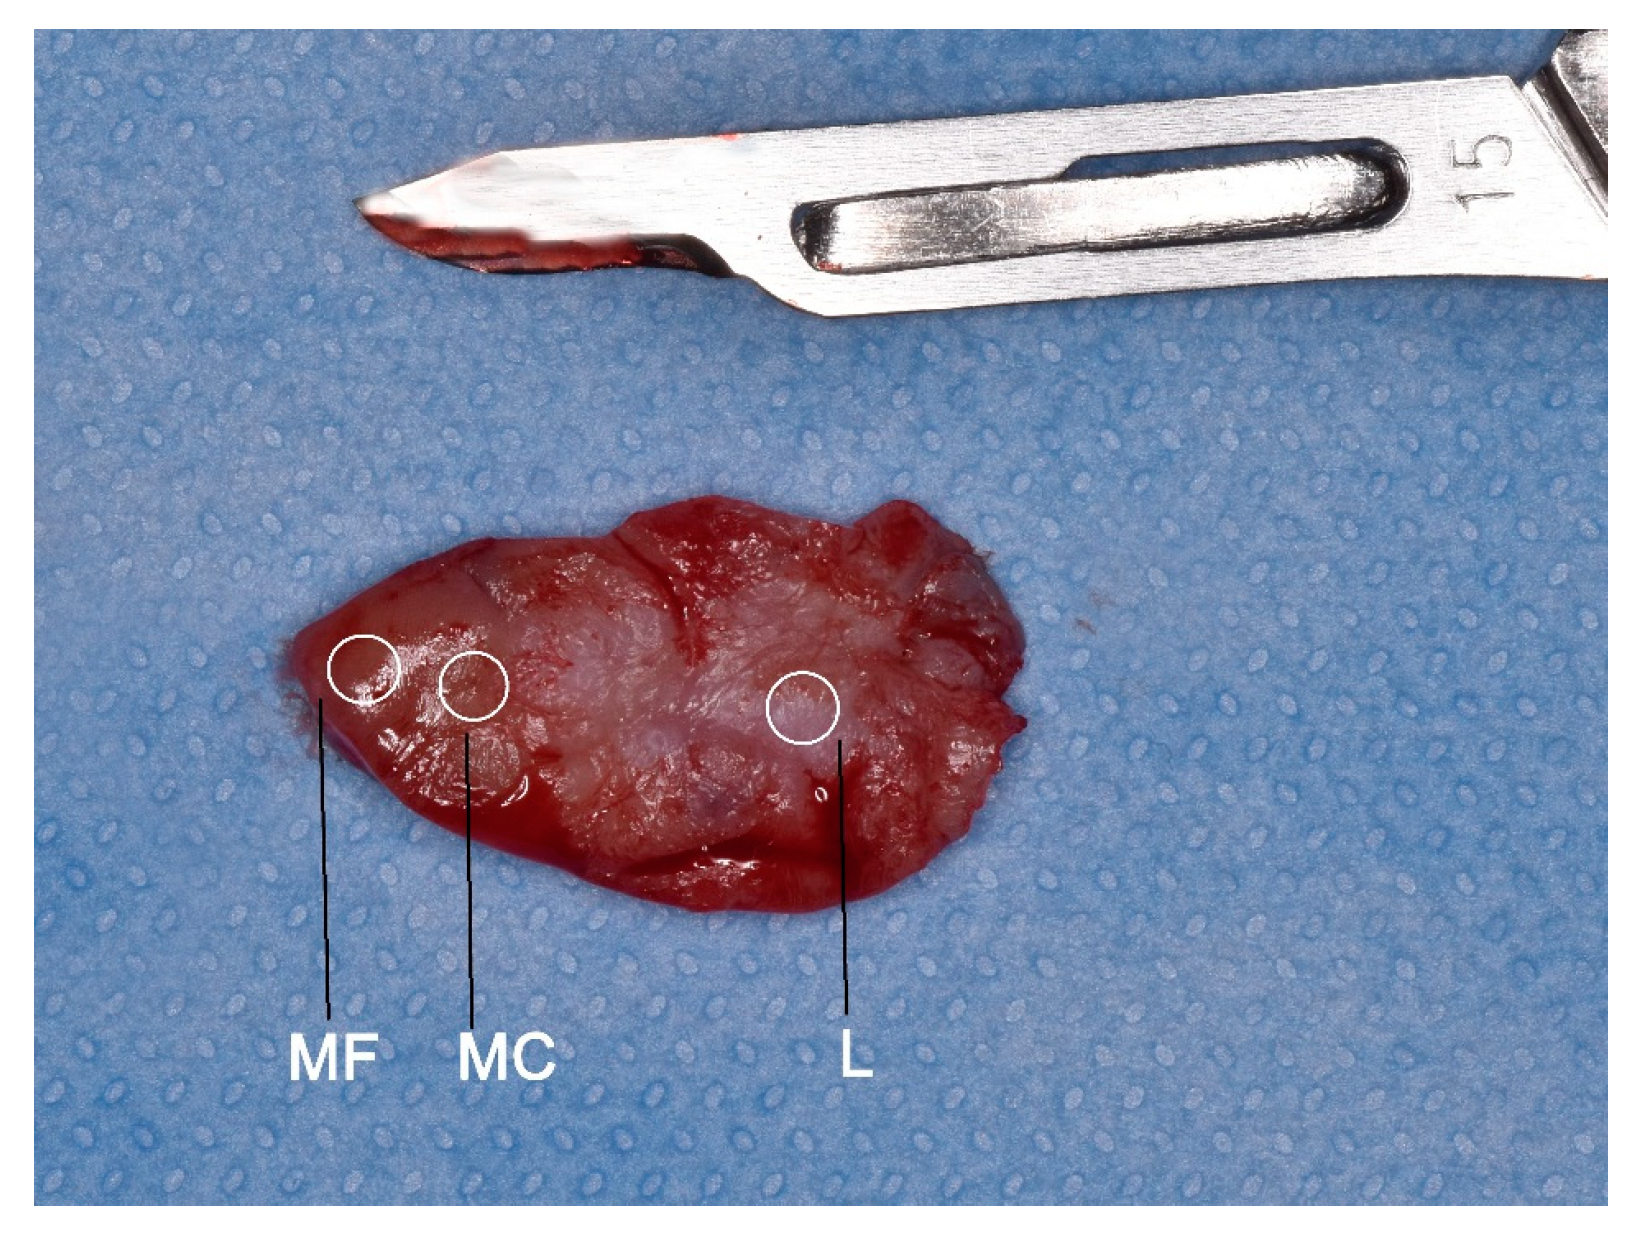
Figure 2.
The regions where three biopsies were taken: at the centre of the lesion (L), clinical margin (MC), and autofluorescence margin (MF).
3. Results
The analysis was carried out on a total of 21 samples. Multiple comparisons were performed between the samples. An overview of the statistically significant DEGs across the all samples analyzed, provided in Table 1, shows a greater molecular difference between the L vs MC or L vs MF margins in comparison with MC vs MF margins, in both groups. However, the existence of DEGs between the MC and MF margins supports the importance of the molecular distinction between these two bioptic margins (Table 1). In patients with leukoplakia, up- and down-regulated genes in MC margin were involved in the mechanisms of regulation of apoptosis, cell motility, collagen metabolism and the immune response. In patients with OSCC the MC margin has showed a partially overlapping molecular profile with the L sample. The molecular divergence between MC and MF margins is the most important finding of our study.

Table 1.
Number of DE genes in the whole set of samples analyzed.
4. Conclusions
The present study portrays a molecular dysregulation decreasing from the centre to the different detected margins of lesions. Our results suggest that a “partially transformed” cell population exists in MC and support the accuracy of AF, with respect to the white light alone, in the margin identification during the OPMDs or OSCC biopsy.
References
- Farah, C.S.; Kordbacheh, F.; John, K.; Bennett, N.; Fox, S.A. Molecular classification of autofluorescence excision margins in oral potentially malignant disorders. Oral Diseases 2018, 24, 732–740. [Google Scholar] [CrossRef] [PubMed]
- Kordbacheh, F.; Bhatia, N.; Farah, C. Patterns of differentially expressed genes in oral mucosal lesions visualised under autofluorescence (VELscope™). Oral Diseases 2016, 22, 285–296. [Google Scholar] [CrossRef] [PubMed]
- Hanahan, D.; Weinberg, R.A. Hallmarks of Cancer: The Next Generation. Cell 2011, 144, 646–674. [Google Scholar] [CrossRef] [PubMed]
© 2019 by the authors. Licensee MDPI, Basel, Switzerland. This article is an open access article distributed under the terms and conditions of the Creative Commons Attribution (CC BY) license (http://creativecommons.org/licenses/by/4.0/).