Affinity and Selectivity of Cardiac Versus Skeletal Troponin I Towards Cardiac Troponin I Antibody: A Computational Study †


Abstract
:1. Introduction
2. Materials and Methods
2.1. Materials
2.1.1. Molecules Structures
2.1.2. FTSite and FTMap
2.1.3. FTDock and pyDock
2.2. Methods
3. Results and Discussion
4. Conclusions
Acknowledgments
Conflicts of Interest
References
- World Health Organization (WHO). Global Status Report on Non-Communicable Diseases; WHO: Geneva, Switzerland, 2010; Volume 176, pp. 9–11. ISBN 978 92 4 068645 8. [Google Scholar]
- Gomes, A.V.; Potter, J.D.; Szczesna-Cordary, D. The role of Troponin in muscle contraction. Life 2002, 54, 323–333. [Google Scholar] [CrossRef] [PubMed]
- Yang, Z.; Yamazaki, M.; Shen, Q.W.; Swartz, D.R. Differences between cardiac and skeletal troponin interaction with the thin filament probed by troponin exchange in skeletal myofibrils. Biophys. J. 2009, 7, 183–194. [Google Scholar] [CrossRef] [PubMed]
- Eriksson, S.; Junikka, M.; Laitinen, P.; Majamaa-Voltti, K.; Alfthan, H.; Pettersson, K. Negative Interference in Cardiac Troponin I Immunoassays from a Frequently Occurring Serum and Plasma Component. Clin. Chem. 2003, 49, 1095–1104. [Google Scholar] [CrossRef] [PubMed]
- Park, K.C.; David, C.G.; Collinson, P.O.; Marber, M.S. Cardiac troponins: From myocardial infarction to chronic disease. Cardiovasc. Res. 2017, 113, 1708–1718. [Google Scholar] [CrossRef] [PubMed]
- Gordon, A.M.; Homsher, E.; Regnier, M. Regulation of contraction in striated muscle. Physiol. Rev. 2000, 80, 853–924. [Google Scholar] [CrossRef] [PubMed]
- Collinson, P.O.; Gaze, D.; Goodacre, S. The clinical and diagnostic performance characteristics of the high sensitivity abbott cardiac troponin I assay. Clin. Biochem. 2015, 48, 275–281. [Google Scholar] [CrossRef]
- Apple, F.S.; Ranka, L.; Murakami, M.M. Determination of 19 Cardiac Troponin I and T Assay 99th Percentile Values from a Common Presumably Healthy Population. Clin. Chem. 2012, 58, 1574–1581. [Google Scholar] [CrossRef] [PubMed]
- Yuan, Y.; Pei, J.; Lai, L. Binding site detection and druggability prediction of protein targets for structure-based drug design. Curr. Pharm. Des. 2016, 19, 2326–2333. [Google Scholar] [CrossRef]
- Cai, F.; Li, M.; Pineda-Sanabria, S.E.; Gelozia, S.; Lindert, S.; West, F.; Sykes, D.; Hwang, M. Structures reveal details of small molecule binding to cardiac troponin. J. Mol. Cell. Cardiol. 2016, 101, 134–144. [Google Scholar] [CrossRef] [PubMed]
- Rayan, B.; Kazakov, D.; Chuang, G.; Beglov, D.; Hall, D.R.; Landon, M.; Mattos, C.; Vajdal, S. Fragment based identification of druggable hot spots of proteins using fourrier domain correlation technique. Bioinformatics 2009, 1, 621–627. [Google Scholar] [CrossRef]
- Cheng, M.; Blundell, L.; Fernandez-Recio, J. pyDock: Electrostatics and desolvation for effective scoring of rigid-body protein-protein docking. Proteins 2007, 68, 503–515. [Google Scholar] [CrossRef] [PubMed]
- Katchalski-Katzir, E.; Shariv, I.; Eisenstein, M.; Friesem, A.; Aftalo, C.; Vakser, A. Molecular surface recognition: Determination of geometric fit between proteins and their ligands by correlation techniques. Proc. Natl. Acad. Sci. USA 1992, 89, 2195–2199. [Google Scholar] [CrossRef] [PubMed]
- Jimenez Garcia, B.; Pons, C.; Fernandez-Recio, J. pyDock web: A web server for rigid-body protein-protein docking using electrostatics and desolvation. Bioinformatics 2013, 1, 1698–1699. [Google Scholar] [CrossRef] [PubMed]


| Molecule | cTnI | sTnI | αcTnI |
|---|---|---|---|
| Binding sites sequences | RAQPPLELLLLRVV | MRAKQGLR | GRYYKESADDNPQGTDSDGYGGS |
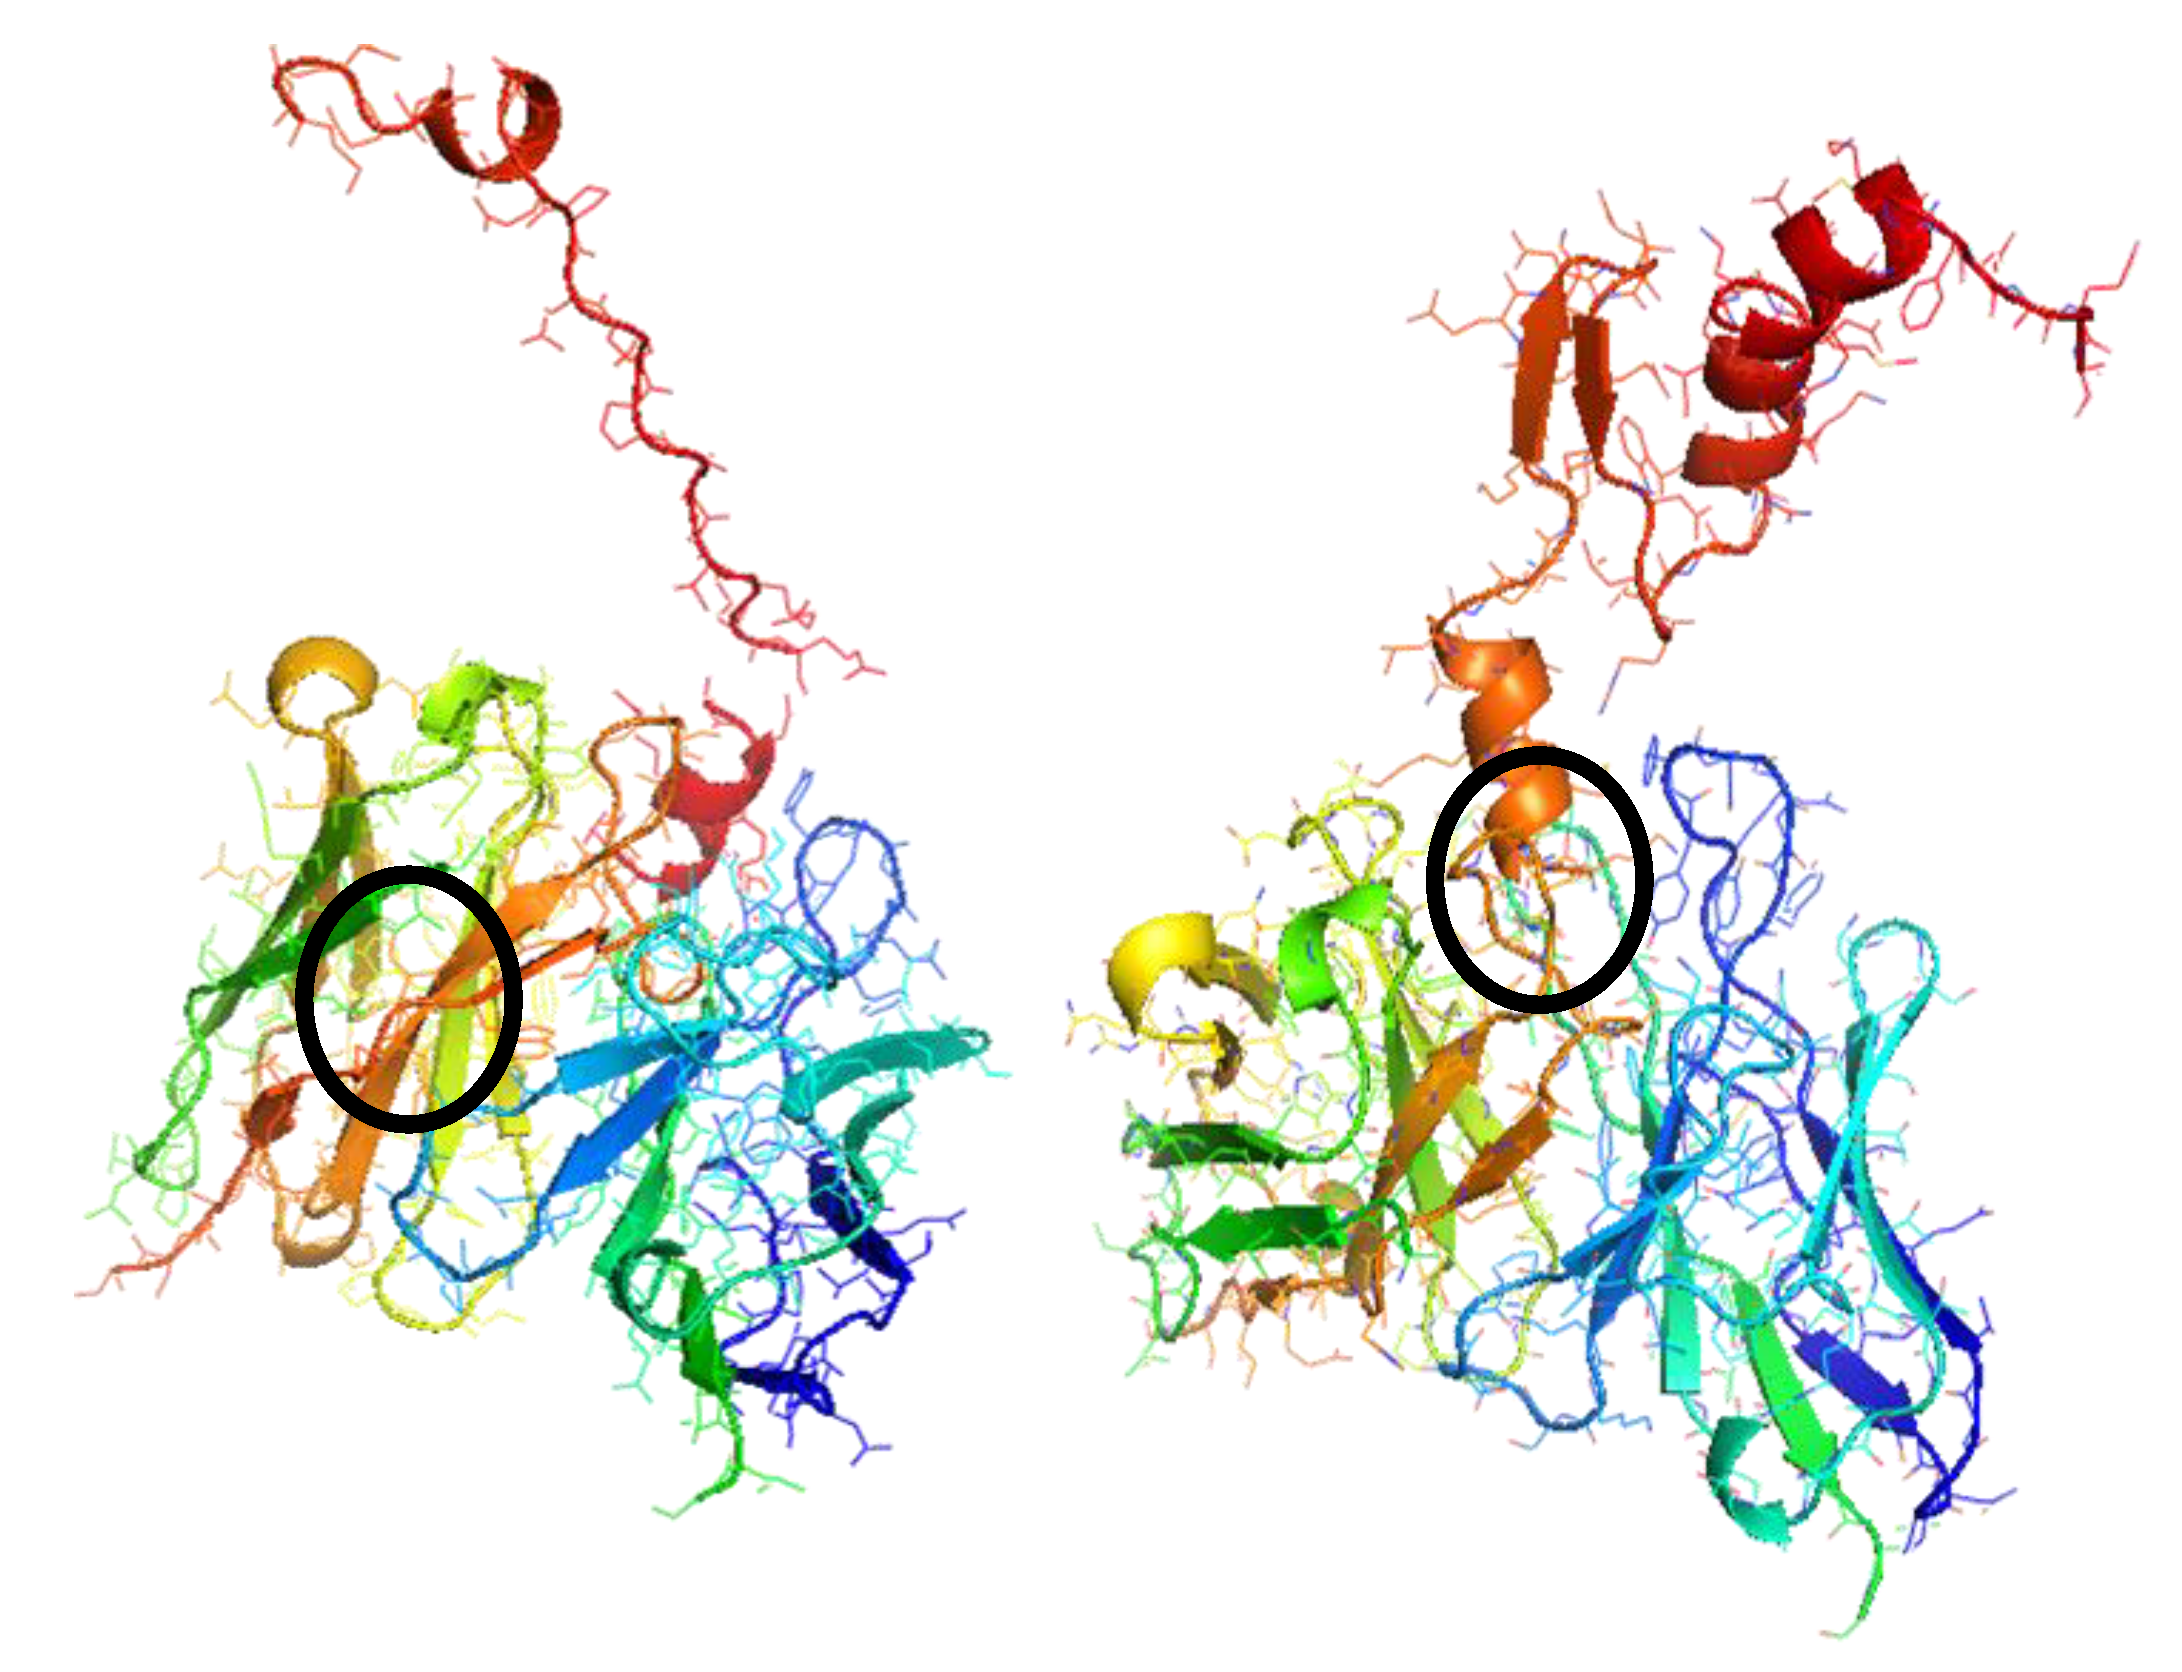
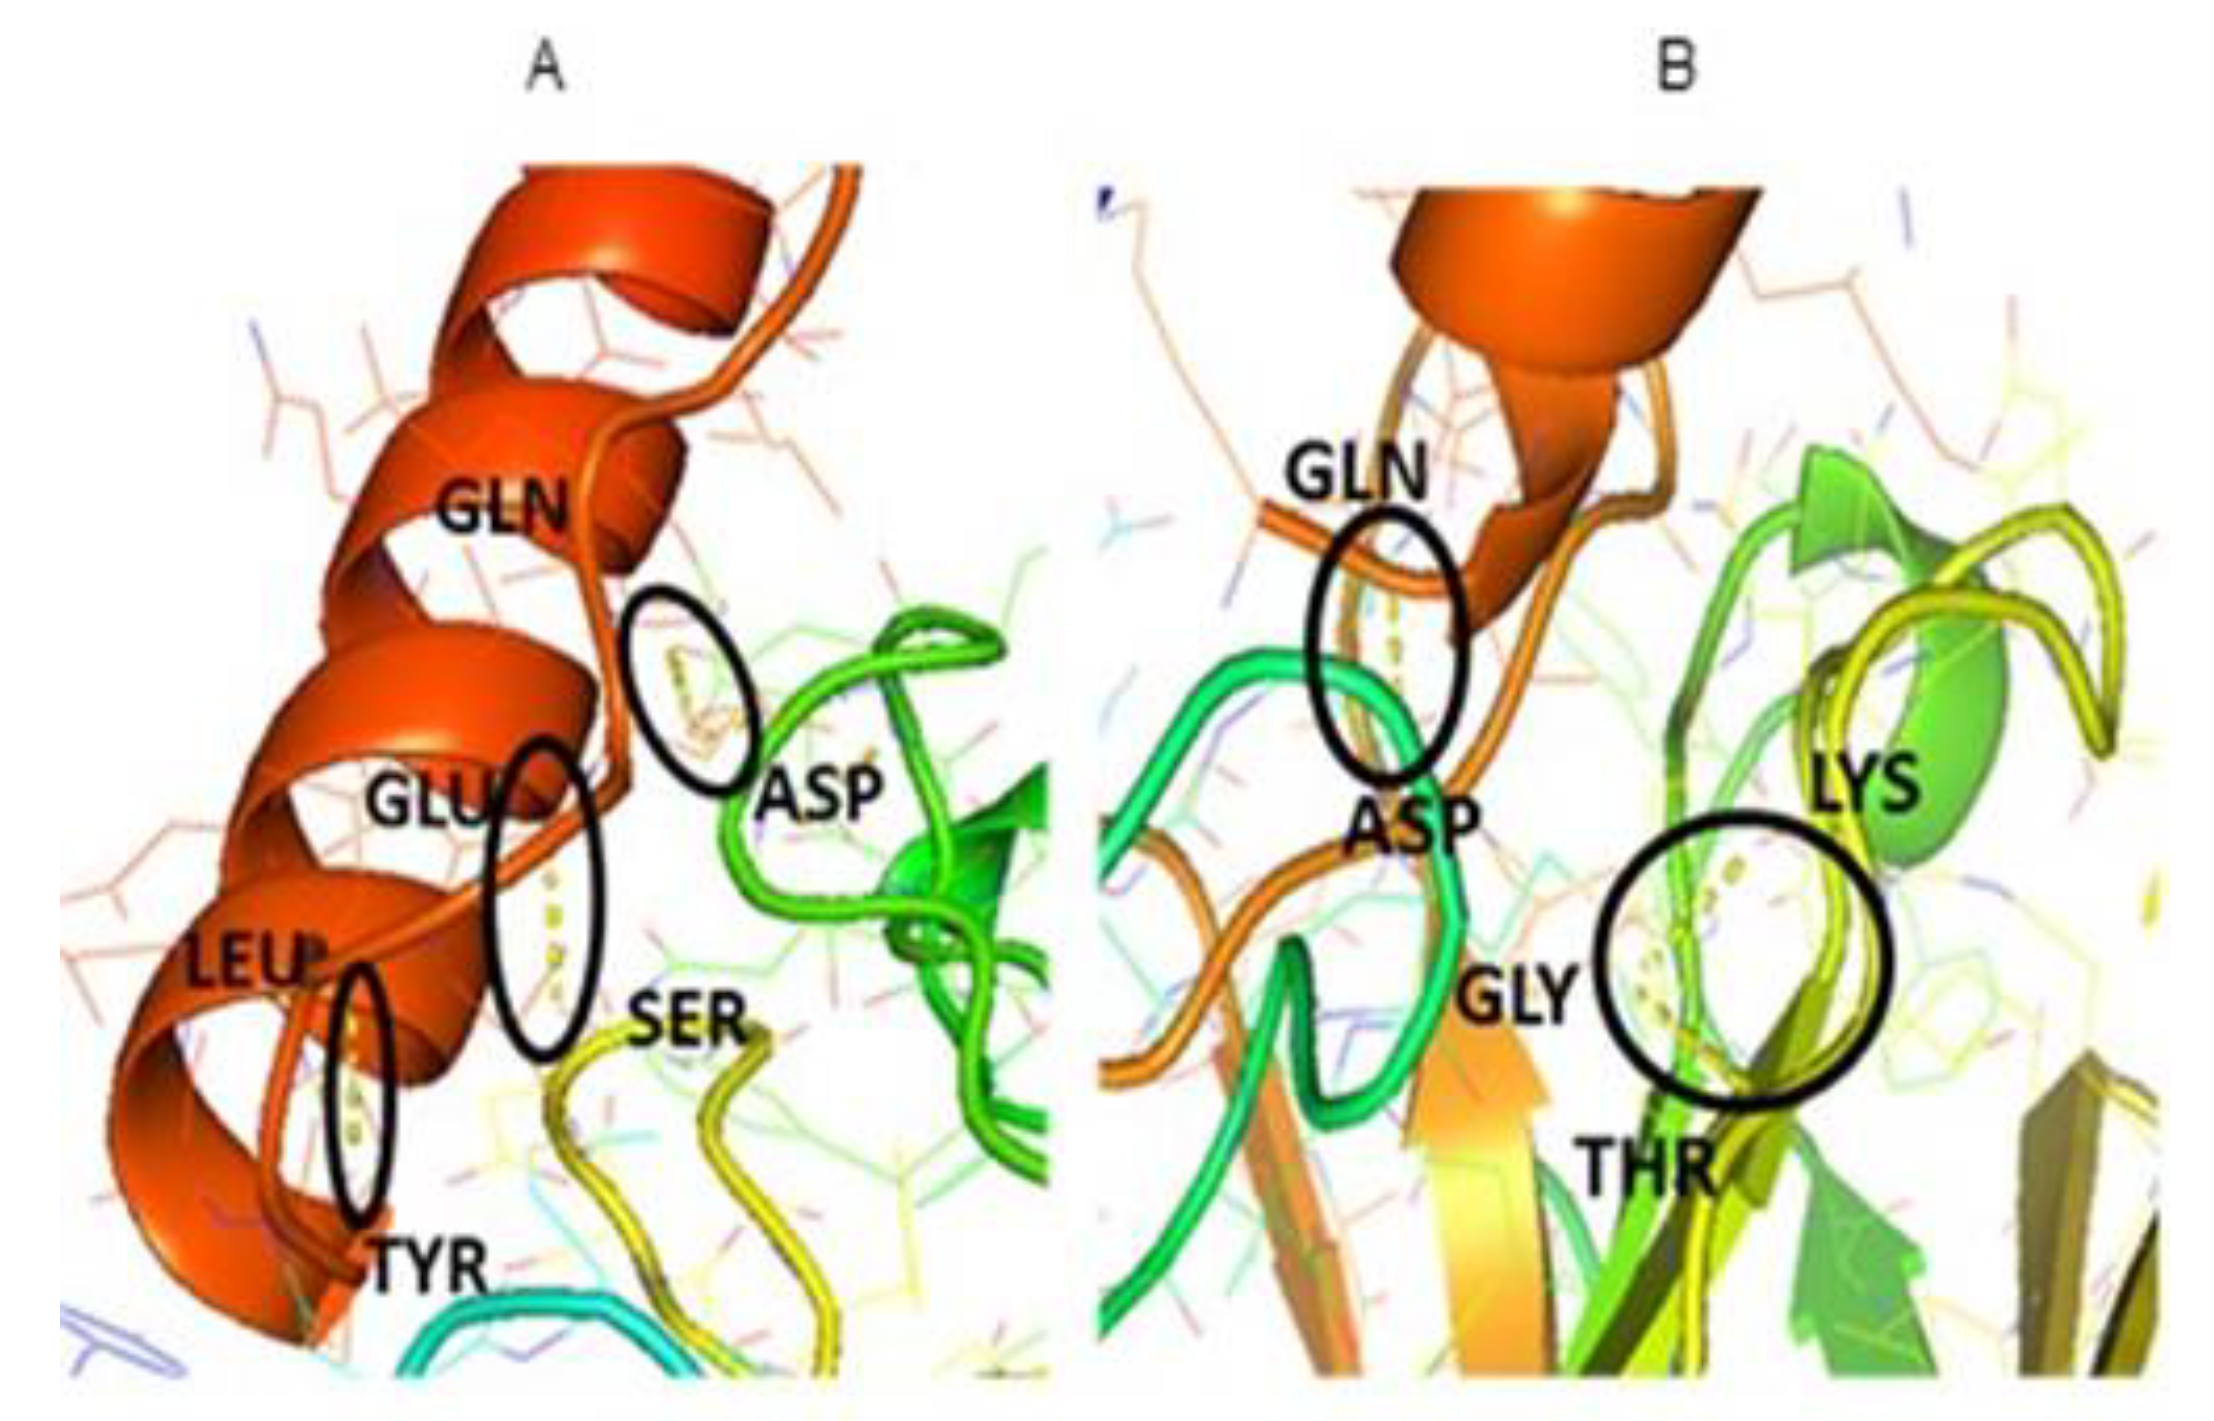
| Complex | cTnI-αcTnT | sTnI-αcTnT |
|---|---|---|
| H-Bonds | LEU-TYR | GLN-ASP |
| GLN-ASP | GLY-THR | |
| GLU-SER | GLY-LYS |
| Complexes | Ele. | Desolv. | VDW | Total |
|---|---|---|---|---|
| sTnI-αcTnI | −29.635 | −3.683 | 72.809 | −26.037 |
| cTnI-αcTnI | −11.866 | −20.190 | 28.475 | −29.208 |
| Complexes | SC Score | ES Ratio | Coordinates | Angles | ||||
|---|---|---|---|---|---|---|---|---|
| sTnI-αcTnI | 177 | 8.516 | −5 | 16 | −48 | 0 | 72 | 24 |
| cTnI-αcTnI | 175 | 9.768 | −23 | 63 | 1 | 168 | 72 | 204 |
© 2019 by the authors. Licensee MDPI, Basel, Switzerland. This article is an open access article distributed under the terms and conditions of the Creative Commons Attribution (CC BY) license (https://creativecommons.org/licenses/by/4.0/).
Share and Cite
Sabek, J.; Martínez-Pérez, P.; García-Rupérez, J. Affinity and Selectivity of Cardiac Versus Skeletal Troponin I Towards Cardiac Troponin I Antibody: A Computational Study. Proceedings 2019, 4, 41. https://doi.org/10.3390/ecsa-5-05719
Sabek J, Martínez-Pérez P, García-Rupérez J. Affinity and Selectivity of Cardiac Versus Skeletal Troponin I Towards Cardiac Troponin I Antibody: A Computational Study. Proceedings. 2019; 4(1):41. https://doi.org/10.3390/ecsa-5-05719
Chicago/Turabian StyleSabek, Jad, Paula Martínez-Pérez, and Jaime García-Rupérez. 2019. "Affinity and Selectivity of Cardiac Versus Skeletal Troponin I Towards Cardiac Troponin I Antibody: A Computational Study" Proceedings 4, no. 1: 41. https://doi.org/10.3390/ecsa-5-05719