Abstract
Quality represents all the characteristics and features of a product or service that satisfies individual requirements. In other words, quality is measured by the degree of customer satisfaction regarding a product or service. The implementation of the control diagram is studied at the distribution store reception of Metaxa cognac orders. The delivery was performed in boxes of six bottles. The control charts follow the degree of filling of the bottles. The volume of filling was measured on a batch of 36 bottles to establish reliable control limits. The studied sample comprised 36 bottles distributed in six boxes.
1. Introduction
Usually, the control chart allows us to assess how a process changes over time, considered one of the basic quality tools [1,2] . If we consider the cognac industry, there are some common variations in production, but there are also non-aleatory causes that could be assignable [3]. In order to keep the final part of the cognac production under control, namely the reception by the customer, different control charts were set-up, including the lower and upper control limits.
2. Experimental
The control chart (Shewhart chart) was derived from the normal distribution curve. On the y-axis, the quality characteristic was recorded—the volume of cognac, which is controlled. On the x-axis, the sample number was represented. The obtained centerline is the average of the value of the volume, indicating the nominal value. There are two limits: the lower boundary represents the lower control limit (LIC), and the other upper line stands for the upper control limit (LSC). The obtained experimental data were plotted, and then, the chart was interpreted.
In the presented study the degree of filling of the cognac bottle was measured, with a volume of 700 mL. The considered sample had 36 bottles distributed in six boxes. The implementation of the control diagram was performed at the reception of Metaxa cognac orders in boxes of six bottles at a distribution store.
3. Results and Discussions
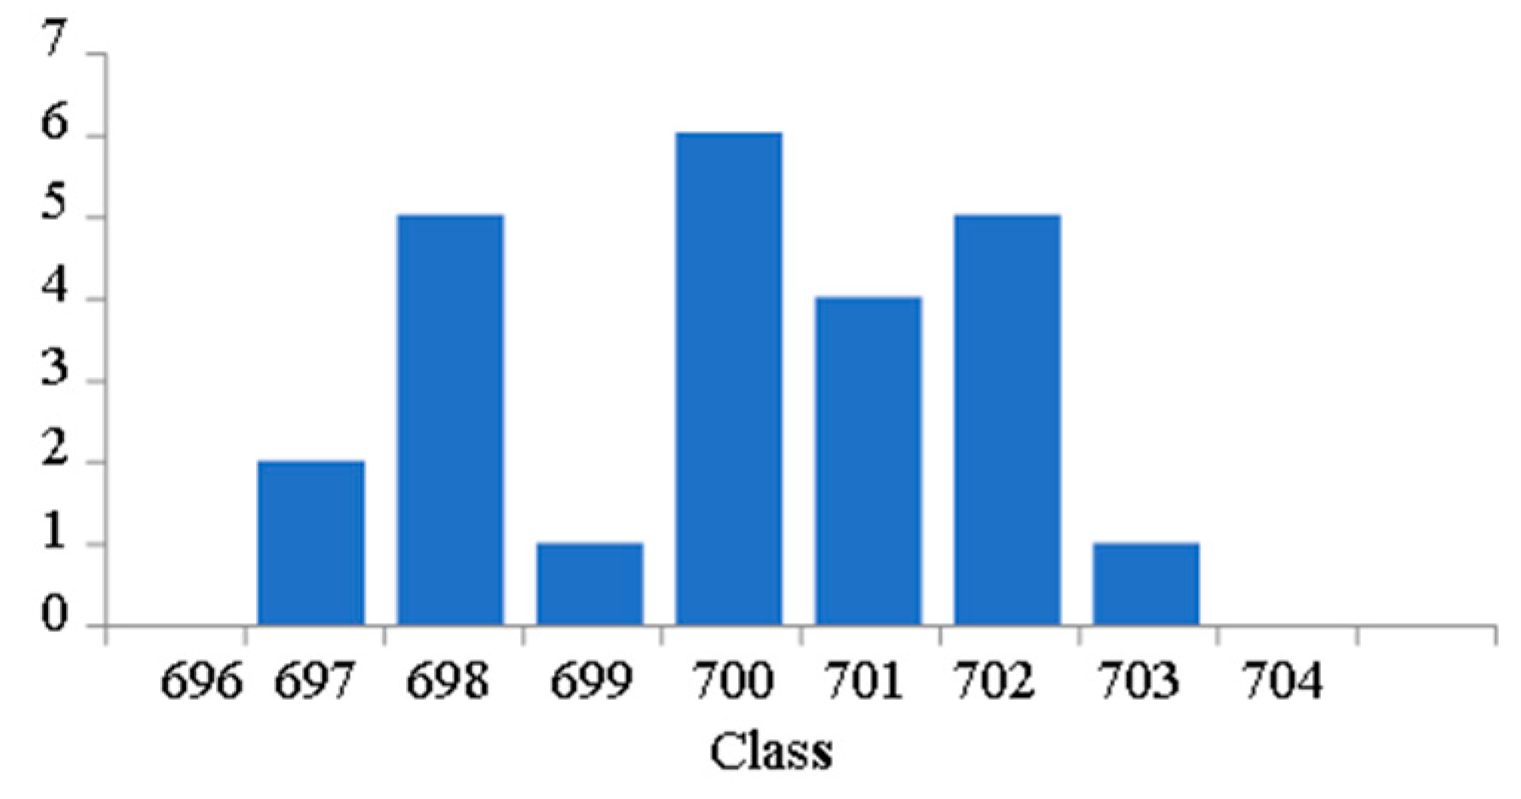
It was checked whether the filling volume data are distributed normally, thus setting the control limits. As presented in Figure 1, the shape of the histogram is not relevant to determine whether the sample data are normally distributed. This situation, when the obtained histogram is not conclusive, might be due to the presence of a few data in the sample.

Figure 1.
Histogram of the selected sample.
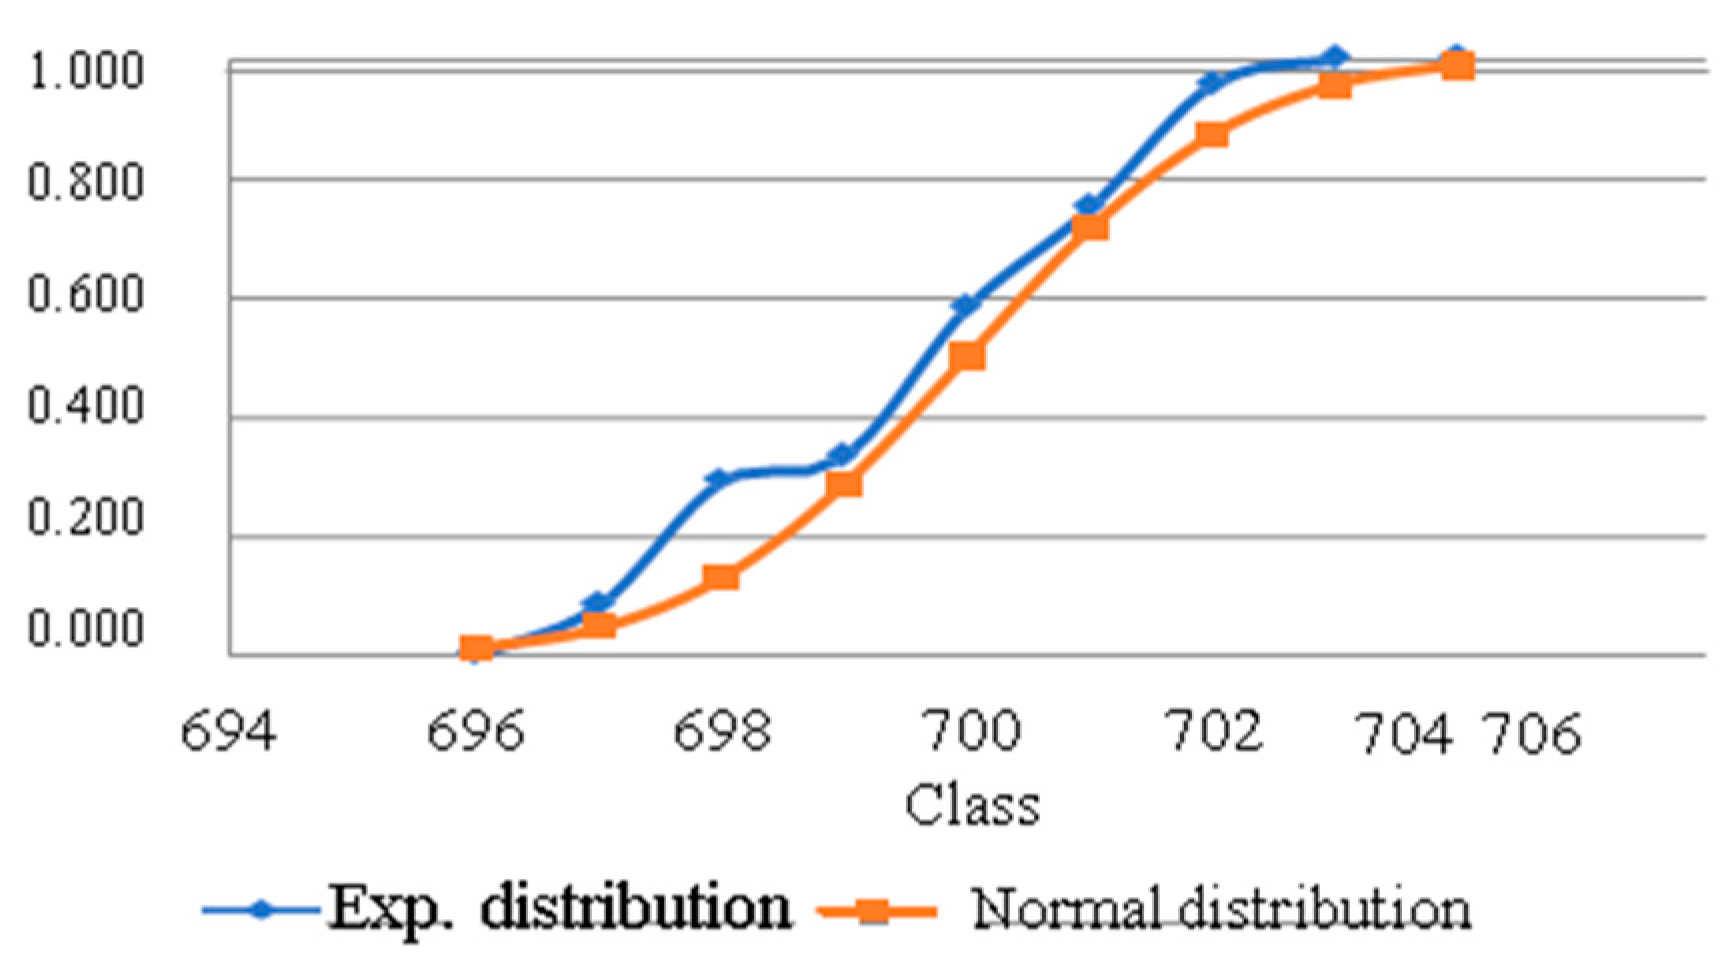
Figure 2 highlights that the distribution of experimental data is not described accurately by the normal distribution.
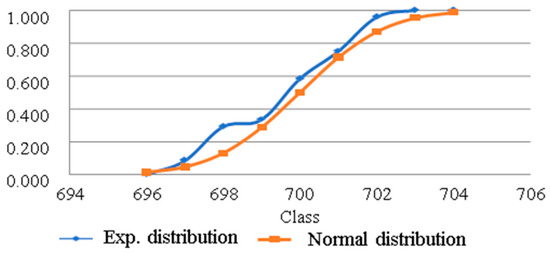
Figure 2.
The normal and experimental data distribution.
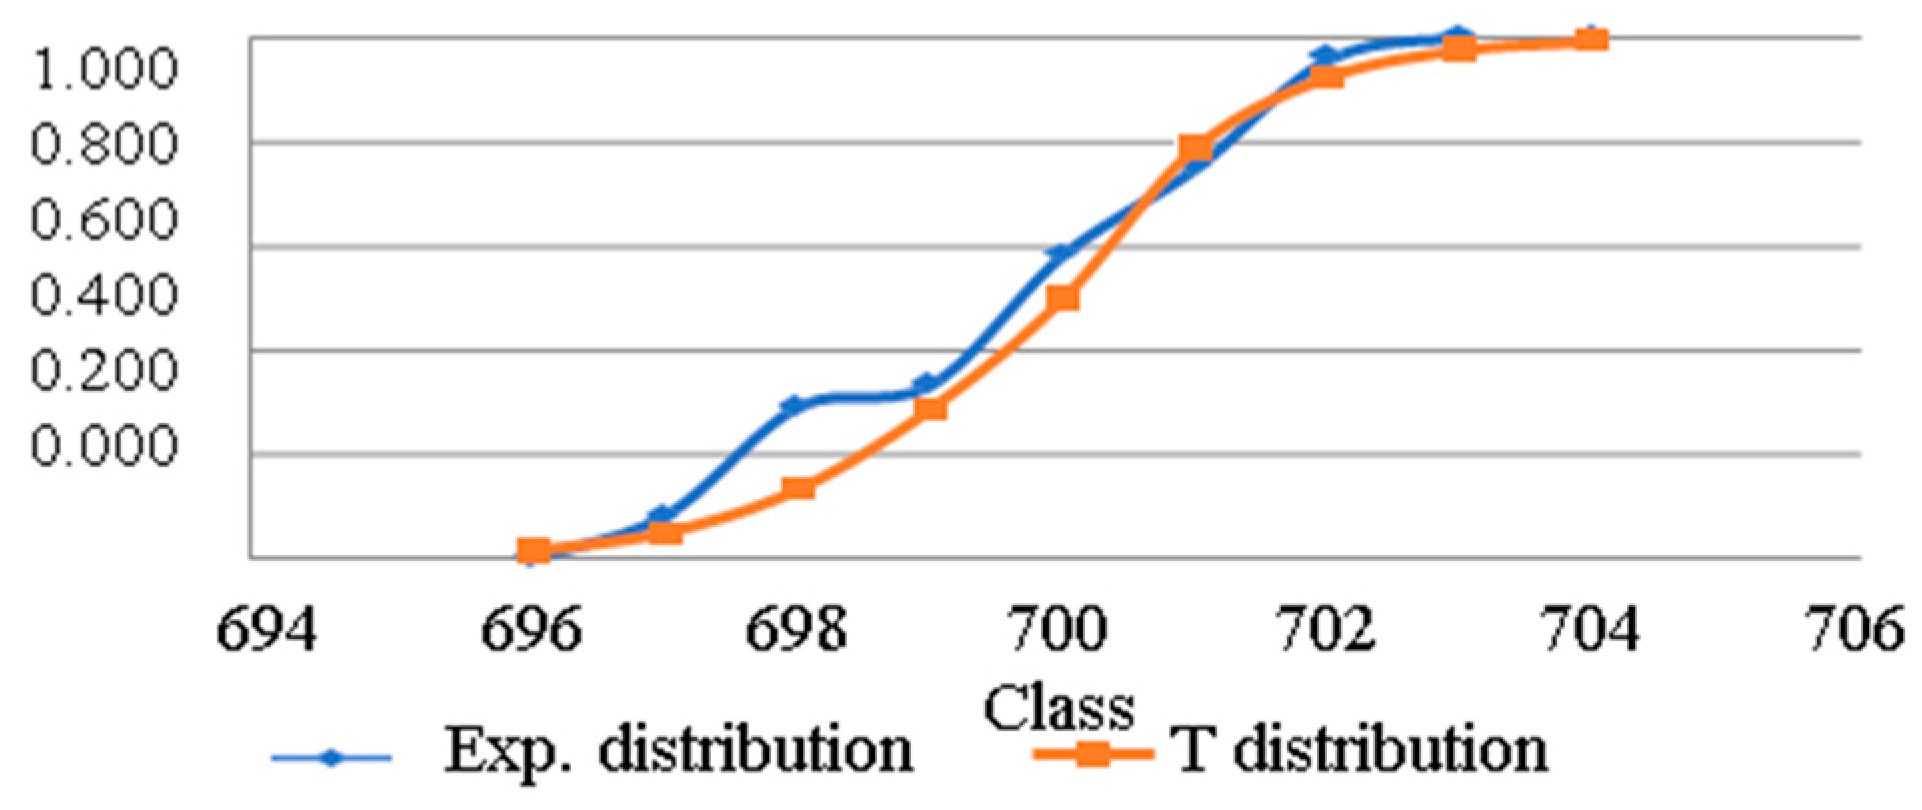
The main parameter considered here is the size of the sample. As observed from the data distribution in Figure 3, smaller errors are recorded compared to the normal distribution when the sample had 23 elements.
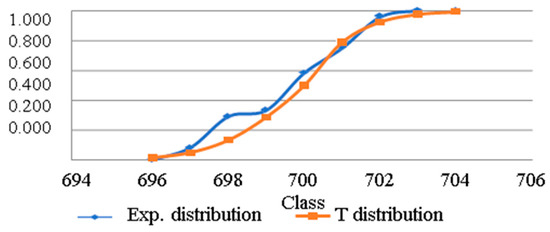
Figure 3.
The normal and experimental data distribution for the sample with 23 elements.
The noted deviations (Figure 2 and Figure 3) between the experimental and normal distributions decreased when the sample had a higher number of elements, namely 36. This behavior could be followed up in Figure 4.
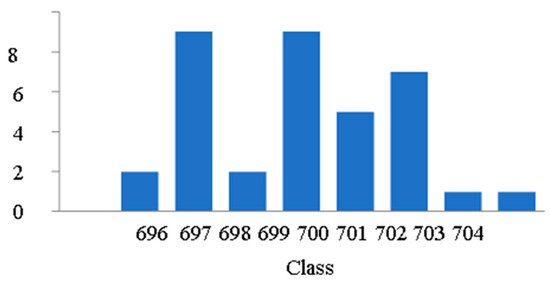
Figure 4.
Histogram for a sample with 36 elements.
Based on the experimental data, as presented in Figure 5, the limits of the control diagram were established to 700 ± 1.00 mL.

Figure 5.
Control charts for a sample with 36 elements.
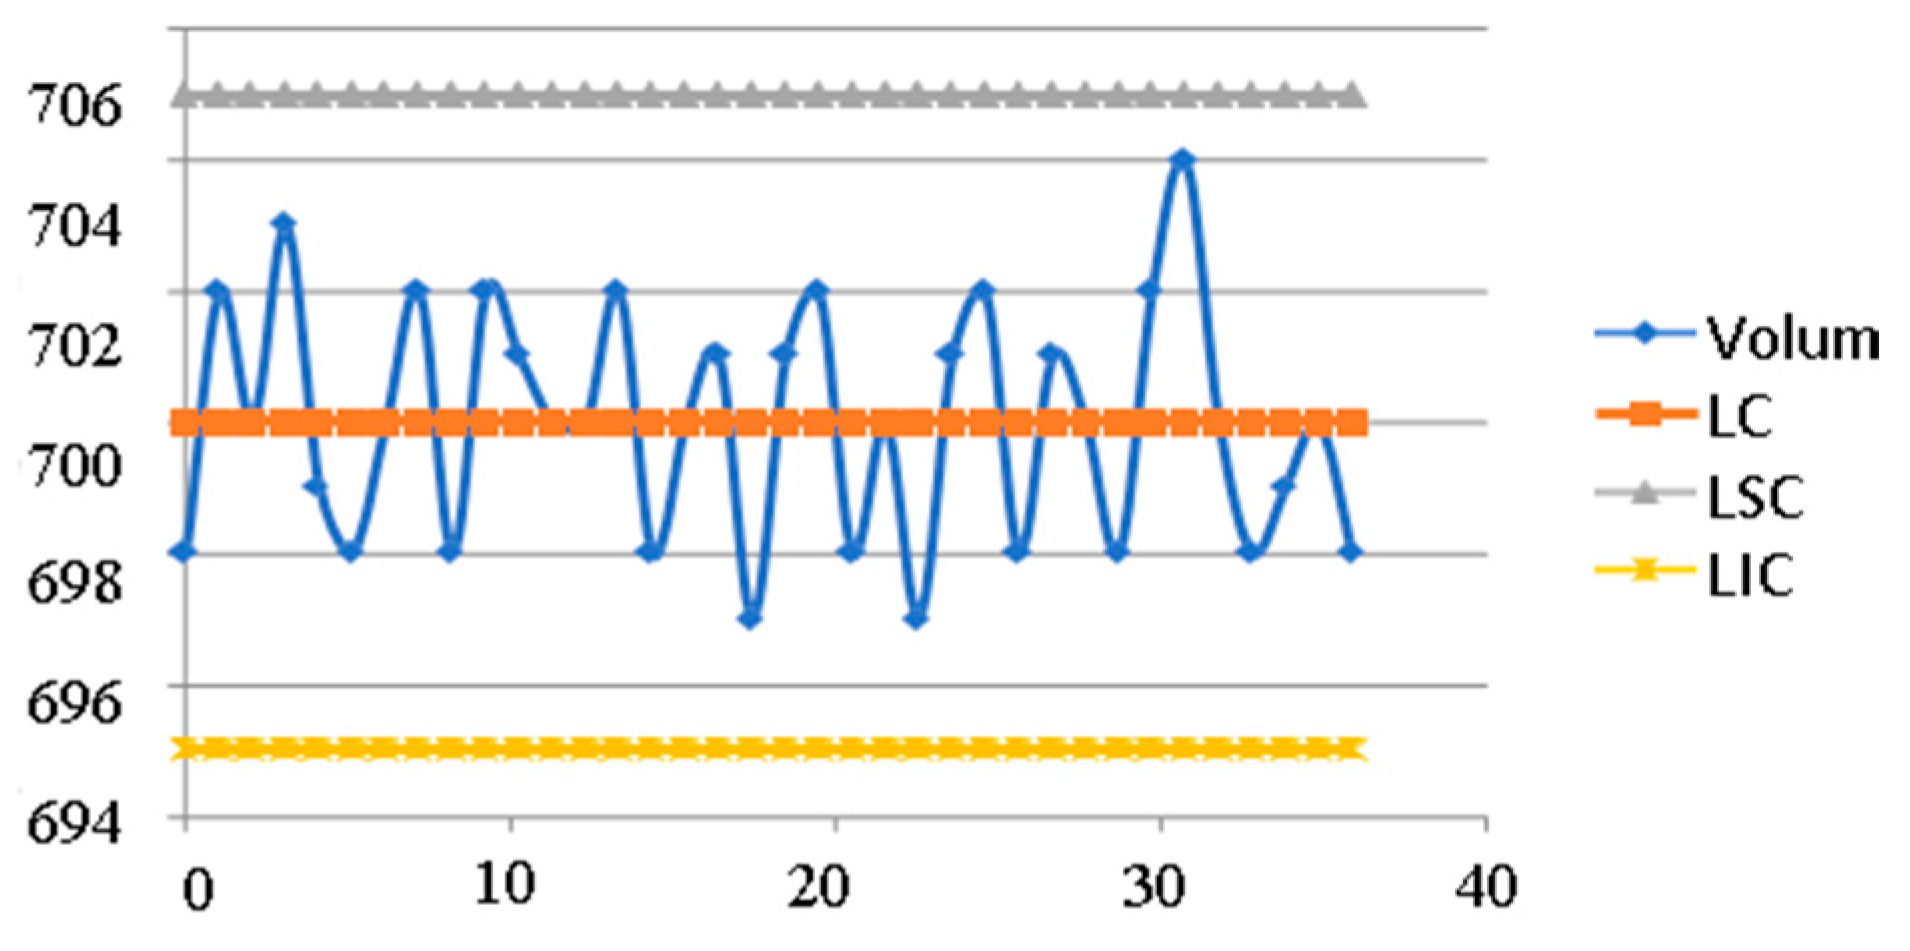
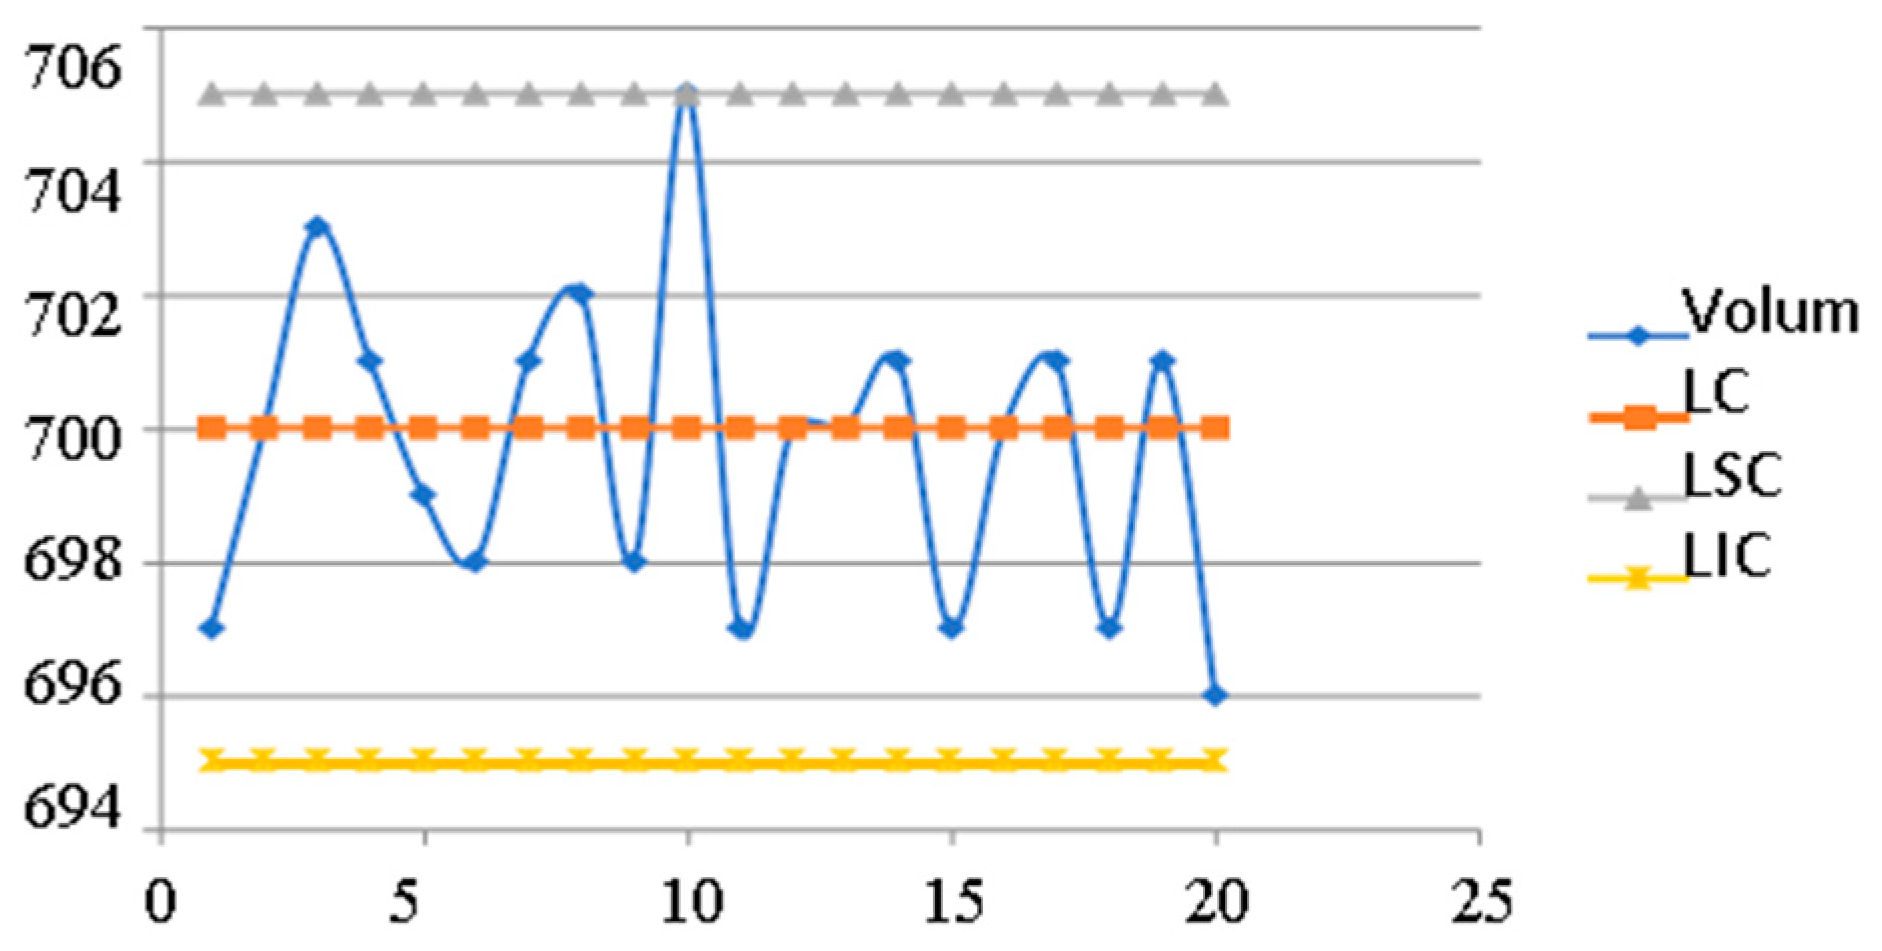
According to the control charts presented in Figure 6 and Figure 7, it was possible to conclude that all samples fall within the previously established control limits.
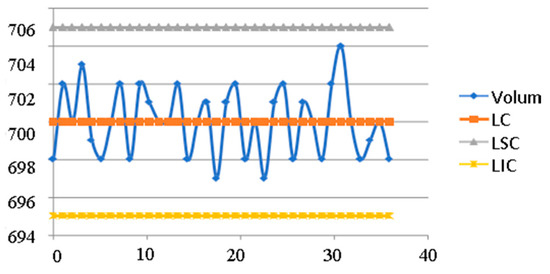
Figure 6.
Control diagram for the filling degree of Metaxa bottles. V = 700 mL.
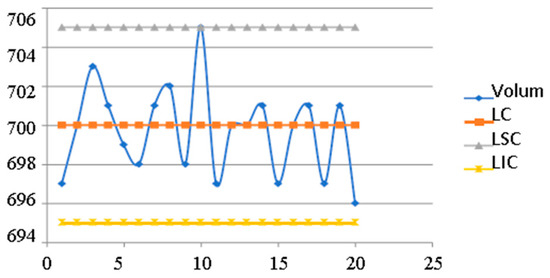
Figure 7.
Control chart for the filling degree of Metaxa bottles. V = 700 mL. n = 20 elements.
4. Conclusions
There are seven main quality assessment tools, namely fishbone diagrams, flow diagrams, histograms, check sheets, Pareto diagrams, scatter plots, and control charts. The information provided by the control charts is useful in assisting the producer in taking corrective actions, thus enhancing the quality. The presented work provides both qualitative and quantitative approaches to the application of the control charts at the reception of Metaxa cognac at a distribution store by measuring the degree of the filling of the bottles. The study shows that all samples fall within the established control limits.
Author Contributions
Conceptualization, M.E.C. and A.D.; methodology, M.E.C.; software, M.M.; validation, M.E.C., M.M. and A.D.; formal analysis, M.M.; investigation, G.N.; data curation, M.E.C.; writing—original draft preparation, A.D.; writing—review and editing, M.E.C. and G.N.
Conflicts of Interest
The authors declare no conflict of interest.
References
- Lablanquie, O.; Snakkers, G.; Cantagrel, R.; Ferrar, G. Characterisation of young Cognac spirit aromatic quality. Anal. Chim. Acta 2002, 458, 191–196. [Google Scholar] [CrossRef]
- Lurton, L.; Ferarri, G.; Snakkers, G. Cognac: Production and aromatic characteristics. In Alcoholic Beverages Sensory Evaluation and Consumer Research; Piggott, J., Ed.; Woodhead Publishing Series in Food Science; Technology and Nutrition: Cambridge, UK, 2012; pp. 242–266. [Google Scholar]
- Lambrechts, M.; Van Velden, D.; Loue, P.; Van Rensburg, P. Brandy and Cognac: Consumption, Sensory and Health Effects. Encycl. Food Health 2016, 456–461. [Google Scholar] [CrossRef]


Publisher’s Note: MDPI stays neutral with regard to jurisdictional claims in published maps and institutional affiliations. |
© 2020 by the authors. Licensee MDPI, Basel, Switzerland. This article is an open access article distributed under the terms and conditions of the Creative Commons Attribution (CC BY) license (https://creativecommons.org/licenses/by/4.0/).