Proceeding Paper

Spatial Archaeology: Remote Sensing for the Study and Preservation of Cultural Heritage through Open Data and FLOSS Tools †

by
Giuseppe Guarino
1,* and
Alessia Brucato
2
1
Department of History and Cultures, Alma Mater Studiorum, University of Bologna, 40124 Bologna, Italy
2
Department of Humanistic Research and Innovation, University of Bari Aldo Moro, 70122 Bari, Italy
*
Author to whom correspondence should be addressed.
Presented at the Una Quantum 2022: Open Source Technologies for Cultural Heritage, Cultural Activities and Tourism, Rome, Italy, 15–16 December 2022.
Proceedings 2024, 96(1), 1; https://doi.org/10.3390/proceedings2024096001
Published: 1 March 2024

Abstract

:
This paper focuses on a preliminary space-based detection protocol to identify proxy indicators useful to assess a specific threat to the archaeological heritage: quarry development. This research used diverse open-access satellite repositories offered by space programs such as Copernicus and, as case studies, analyzed two inland highland sites in Sicily (Italy). All images were processed with filters, algorithms, and routines in free Open-Source software such as QGIS 3.34.0 and cloud computing platforms like Google Earth Engine. The results of the classification were validated with statistical accuracy techniques.

1. Introduction

Due to its great geological variety, mining activities in Italy are widespread and represent a valuable source of economy and development for the entire country. From 2016, ISTAT data recorded more than 5000 active and inactive quarries and 136 mines, from which about 167.8 million tons of non-energy minerals have been extracted. However, the lack of adequate legislation in Italy, the landmark of which still dates back to Regio Decreto No. 1443 of 1927, combined with the decentralization of administrative functions to individual regions in the 1970s, caused inadequate land protection, and, in the worst cases, the destruction of local ecosystems and archaeological sites.
This situation is also aggravated by the many illicit mining activities. Thankfully, in recent years, the growing interest in the natural and anthropic landscape from local communities and institutions, together with the diffusion of Earth Observation (EO) data and technologies, is leading to efficient monitoring tools and more protective legislation.
Today, it is possible to predict or mitigate the risk resulting from natural disasters or human actions, which are the leading causes of the destruction and irreversible loss of our cultural heritage, thanks to the many available remote sensing diagnostic techniques for the Earth’s surface.
Indeed, this study aims to present a workflow to identify and classify the archaeological risk (threats and disturbances) derived from quarry extraction processes in Central Sicily (Italy) by applying Feature and Change Detection techniques to Open Access multispectral satellite imagery.
The basic concept of this study was inspired by the Endangered Archaeology in the Middle East and North Africa (EAMENA) project, launched in 2015, to respond to the growing menaces to archaeological sites in MENA countries [1].
Central Sicily presents a territory already heavily anthropized in prehistoric and protohistoric times by indigenous peoples, such as the Sicans and Elymians, and at the beginning of the 8th century B.C., also by Greek and Phoenician settlers with whom the native inhabitants came in contact [2,3]. Our focus is on the interior historical urban centers present at high positions, especially the ones on top of the hills and at the valley bottoms. The privileged position of such highland sites was chosen not only for the convenient dominance of the surrounding territories but also for the abundance of limestone and calcarenite lithotypes, which these populations extracted to build settlements and fortification walls [4]. Thanks to the variety of lithic sources, such as limestone, tuff, and marble, the stone quarries have been a significant part of the island’s history since the earliest times (with some variations depending on the period and the cultural influences). This is the case of sites like Balza d’Areddula, upstream from Alimena, in the province of Palermo.
In the early 20th century, socio-economic development, and the need to improve the road infrastructures for goods transport led to the opening of new stone quarries, which often hosted ancient settlements on their tops. Landscape and cultural heritage protection measures were absent in the past, but despite the introduction of mining regulations in recent years that aimed at protecting the environmental and archaeological landscape, the enforcement of such laws has often been insufficient.
What the resolution of this problem is lacking at the grassroot level is the timely monitoring of the areas at risk, which could not be achieved until today with the aid of remote sensing techniques. In particular, during the last 50 years, satellite imagery (Landsat, MSS, TM, Spot, or declassified spy satellites like Corona and Hexagon) has been used in many military, economic, and scientific fields. The images obtained from the many orbital sensors vary in typology (optical, multispectral, hyperspectral, radar sensors), resolution (30 m–0.2 m), and timeframe (1956–today) and have been used in almost every possible field of research dependent on data obtained from the atmospheric and Earth surface survey.
In recent decades, even archaeological investigations started to include this dataset to study the ancient landscape or detect new sites, or assess the archaeological risk derived by wars, calamitous events, illegal looting [5,6], and expansion of the range of modern human activities (urban areas, intensive agricultural and industrial production, mines and quarries, dams and artificial water reservoirs, etc.).
This study aims to delineate a preliminary protocol for the identification of proxy indicators for stone mining activities in Central Sicily through multitemporal and multispectral satellite imagery. The analysis was applied to open-access satellite data provided by space programs such as Copernicus, with particular attention to the inland areas of Sicily and the known archaeological sites. Specifically, the province of Palermo. The images are processed with filters and enhanced by applying algorithms and routines from free and open-source software such as QGIS and Google Earth Engine (hereafter GEE). The use of open satellite data provided broad spatial coverage and a range of information useful for identifying stone quarries.

2. Materials and Methods

2.1. Materials

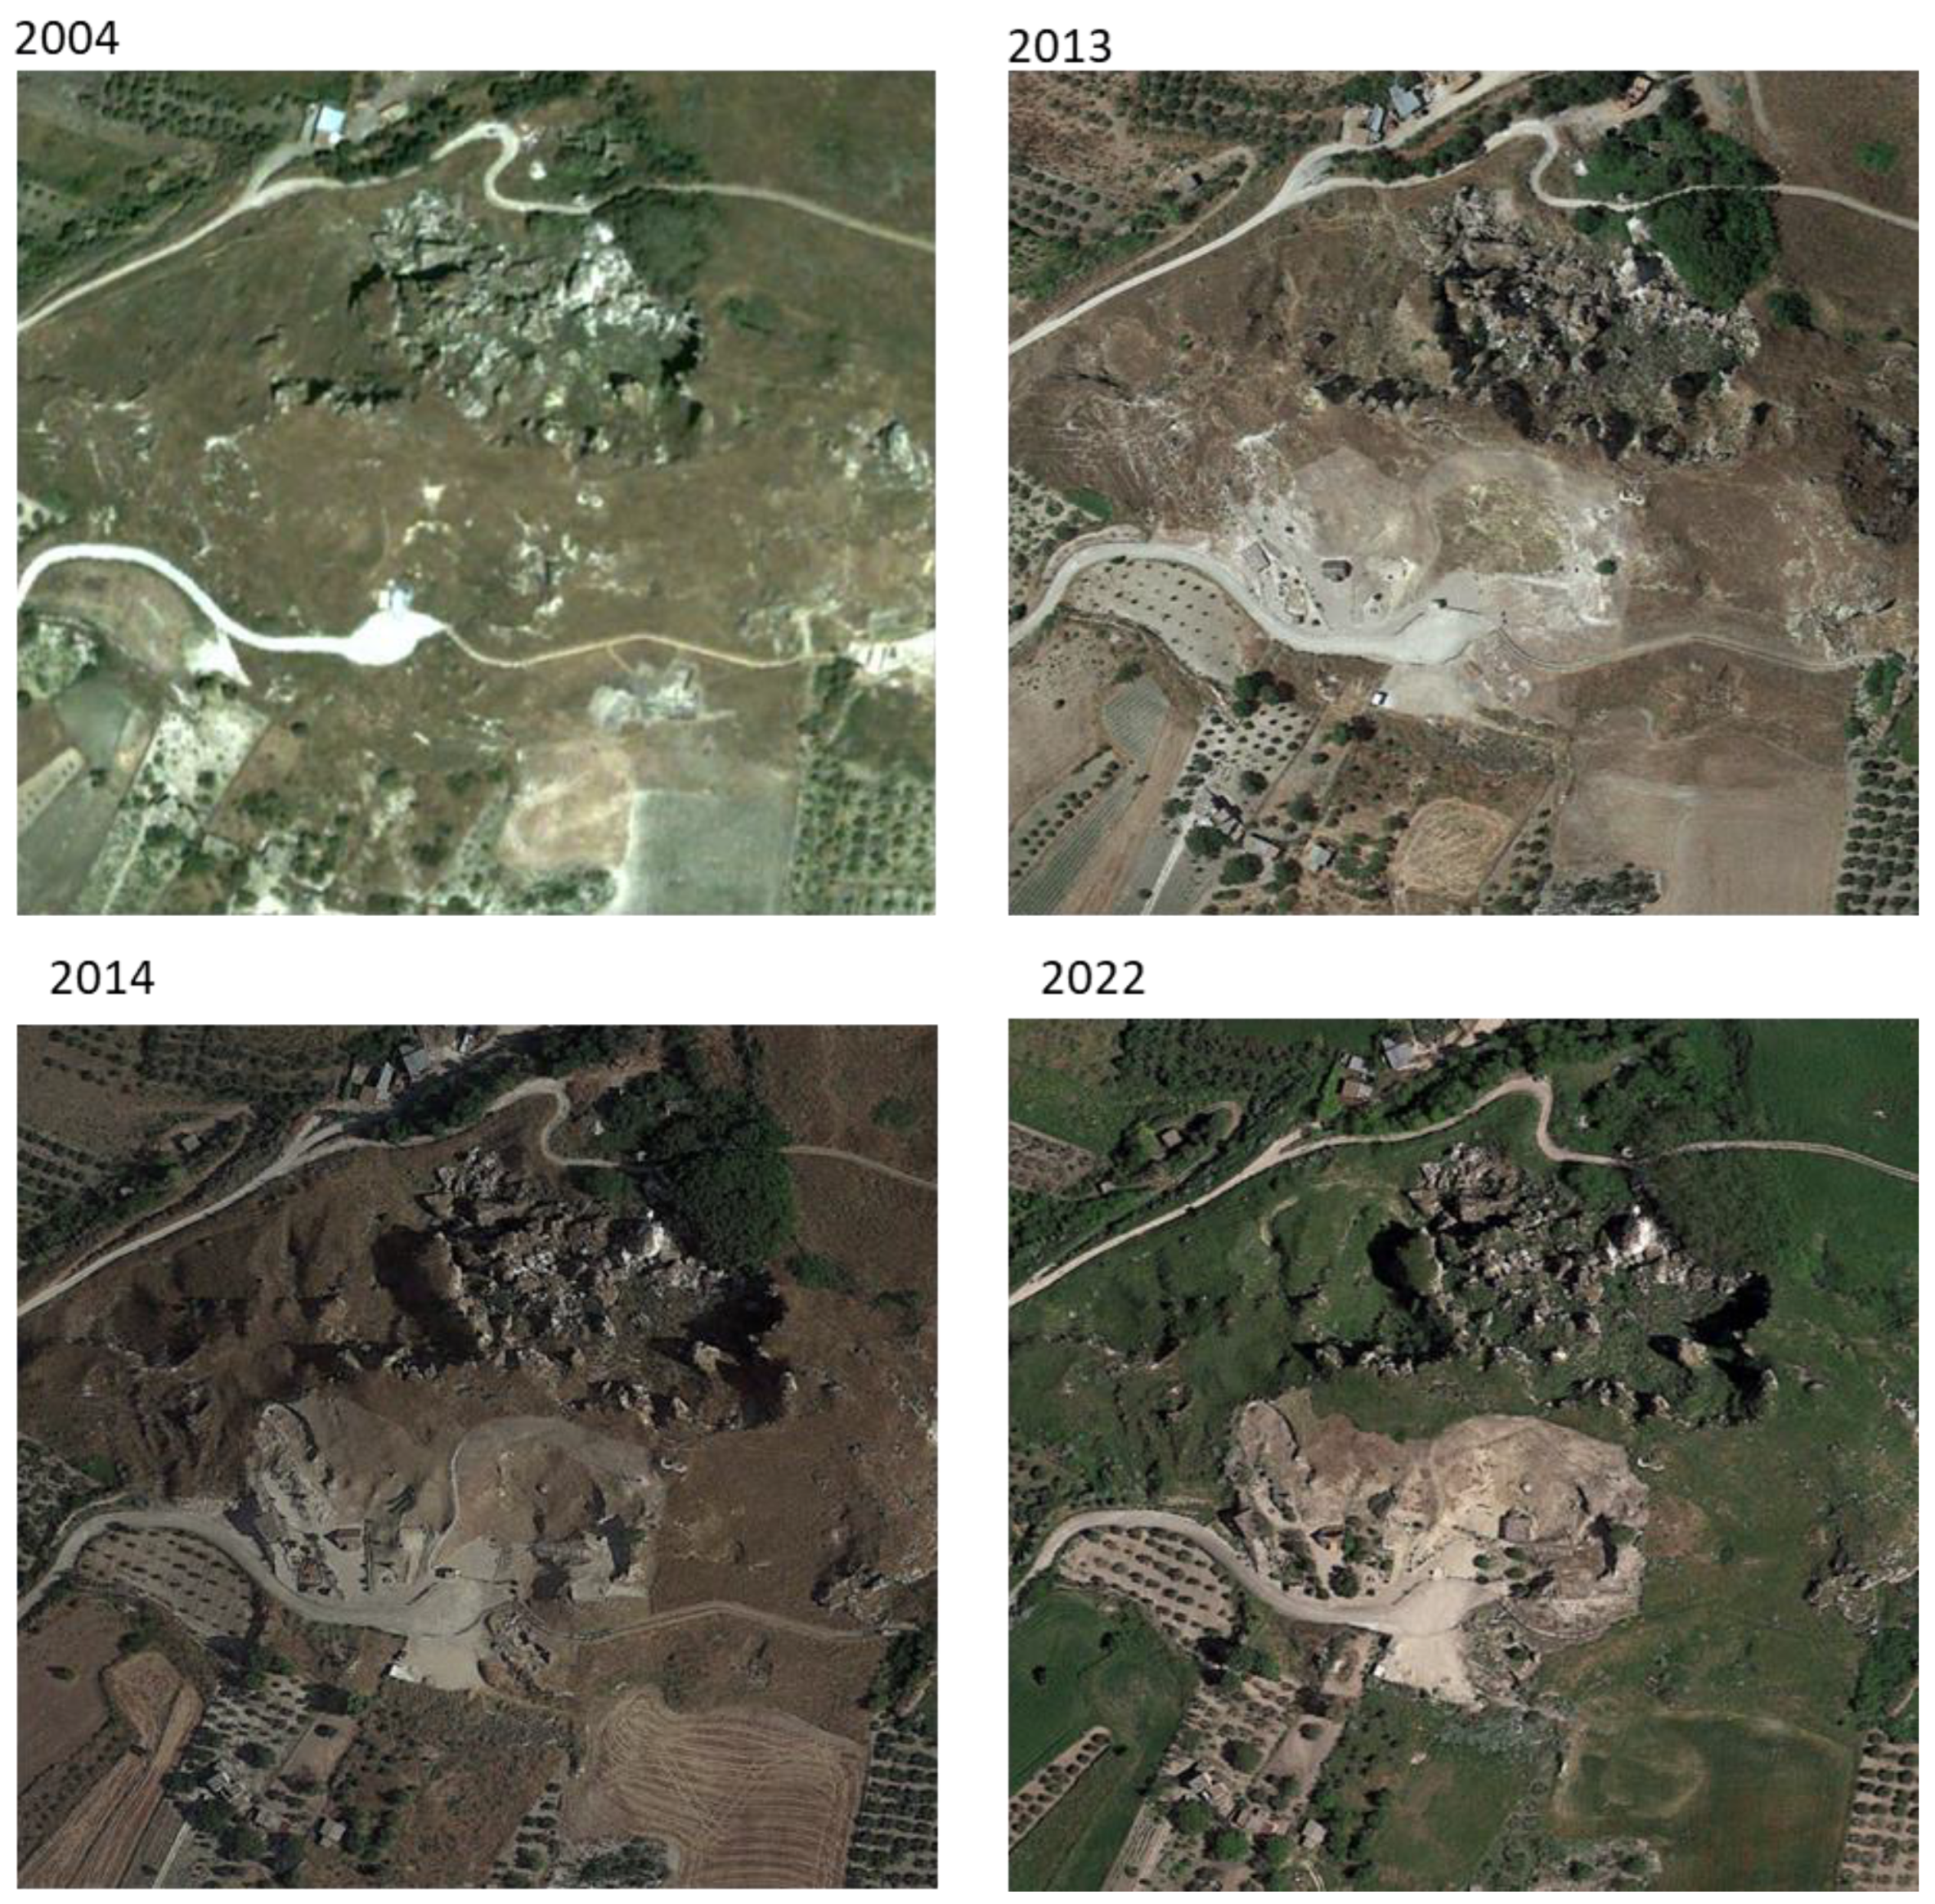
2.1.1. Mining Activities: The Use of Google Earth

Identifying quarries and tracing their spatial development over the years can involve a combination of analyses, from field surveys to satellite imagery analysis [7]. The study of satellite imagery allows us to quickly cover a wide area and identify potential quarry sites, although the resolution of satellite imagery can limit the ability to identify smaller or older quarries. In addition, multitemporal and regular monitoring via EO sensors allows the tracking of changes and trends in mining activities over time. This possibility inevitably grants advantages to researchers and agencies involved in safeguarding cultural heritage. The deep knowledge of satellite sensors and the resulting imagery, powerful cloud computing platforms, and Geographic Information Systems (GIS) is essential for managing such data. All these technologies provide a cost-effective and efficient way to track Earth surface changes over time, especially in large or remote areas. Indeed, a starting point could be the use of Google Earth because stone quarries can be readily identified using optical imagery, and thanks to the platform’s time-switch tools, it becomes very easy to observe their progression over time. Figure 1 visually portrays the incremental growth of a quarry spanning the years 2004 to 2022, with its expansion approaching an important archaeological site in a concerning manner. This encroachment raises a notable alarm for the preservation of the archaeological site itself, presenting a severe disturbance and probably leading to its complete disappearance in the next few years. Nevertheless, this method does come with certain inherent limitations. The images available on the platform do not provide comprehensive coverage, and there are often gaps in the historical imagery from earlier years.

2.1.2. Satellite Imagery

A more comprehensive approach, given the extensive availability of imagery, involves open-access satellite data provided by Copernicus, the European Union’s space program. Since 2008, the Copernicus program has funded the missions of Sentinel satellites. These missions have generated valuable multisensory and multitemporal data repositories, including Sentinel 1A, 1B, 2A, 2B, 3A, 3B, 5Precursor, and 6A. Furthermore, upcoming Copernicus repositories, such as Sentinel 3C, 3D, 4, and 6B are expected the near future. The primary purpose of these missions is the monitoring of the variability of land surface conditions. Among them, we chose the data provided by Sentinel 2 (hereafter S2), which provides high-quality multispectral imagery.
The swath width of each scan is 290 km; recurrent 5 days at the equator and 2–3 days at mid-latitudes; depending on the band, 10 or 20 m of pixel resolution; 13 spectral bands (with aerosol); and 10 preprocessed packages (ranging from RGB to infrared and including sensors for aerosols and wetness).
In terms of image corrections, Copernicus Sentinel 2 offers three principal datasets:
  • The Top-of-Atmosphere (hereafter TOA) Radiance in sensor geometry, Level-1B;
  • The TOA Reflectance in cartographic geometry, Level-1C;
  • The Bottom-of-Atmosphere Reflectance (hereafter BOA), Level 2A (hereafter L-2A).
Due to the kind of preliminary processing and detection (Spectral Indices and Supervised Classification) we needed to perform on the entire region, thanks to the computing platform GEE, we collected our first dataset from the S2 BOA L-2A during 2019. The reason why we chose a long scanning period (January–December 2019) is that we set up a very low percentage of cloud cover (35%) for a large and marine Italian region: Sicily. Now, we are reducing the analysis to smaller areas and selecting seasonal timeframes.

2.2. Methods

2.2.1. Band Selection and Combination in GEE

The first step of this investigation, after the selection of the proper satellite collection, was the visual analysis of each channel (spectral band) image and then their combination through spectral indices within GEE. Thus, we used JavaScript for GEE to code many of these indices. This enhanced our ability to evaluate the differences between pixel values belonging to the ancient and modern quarries and the surrounding environment.
Thanks to the code editor and visualization panel offered by GEE, we checked all the results of this process, and the most promising channels and spectral indices were the B4 and B8 (Red and NIR) and the OSAVI index.
At this stage, we decided to shift our results into a QGIS project, projected in WGS 84UTM zone 33N (EPSG:32633).

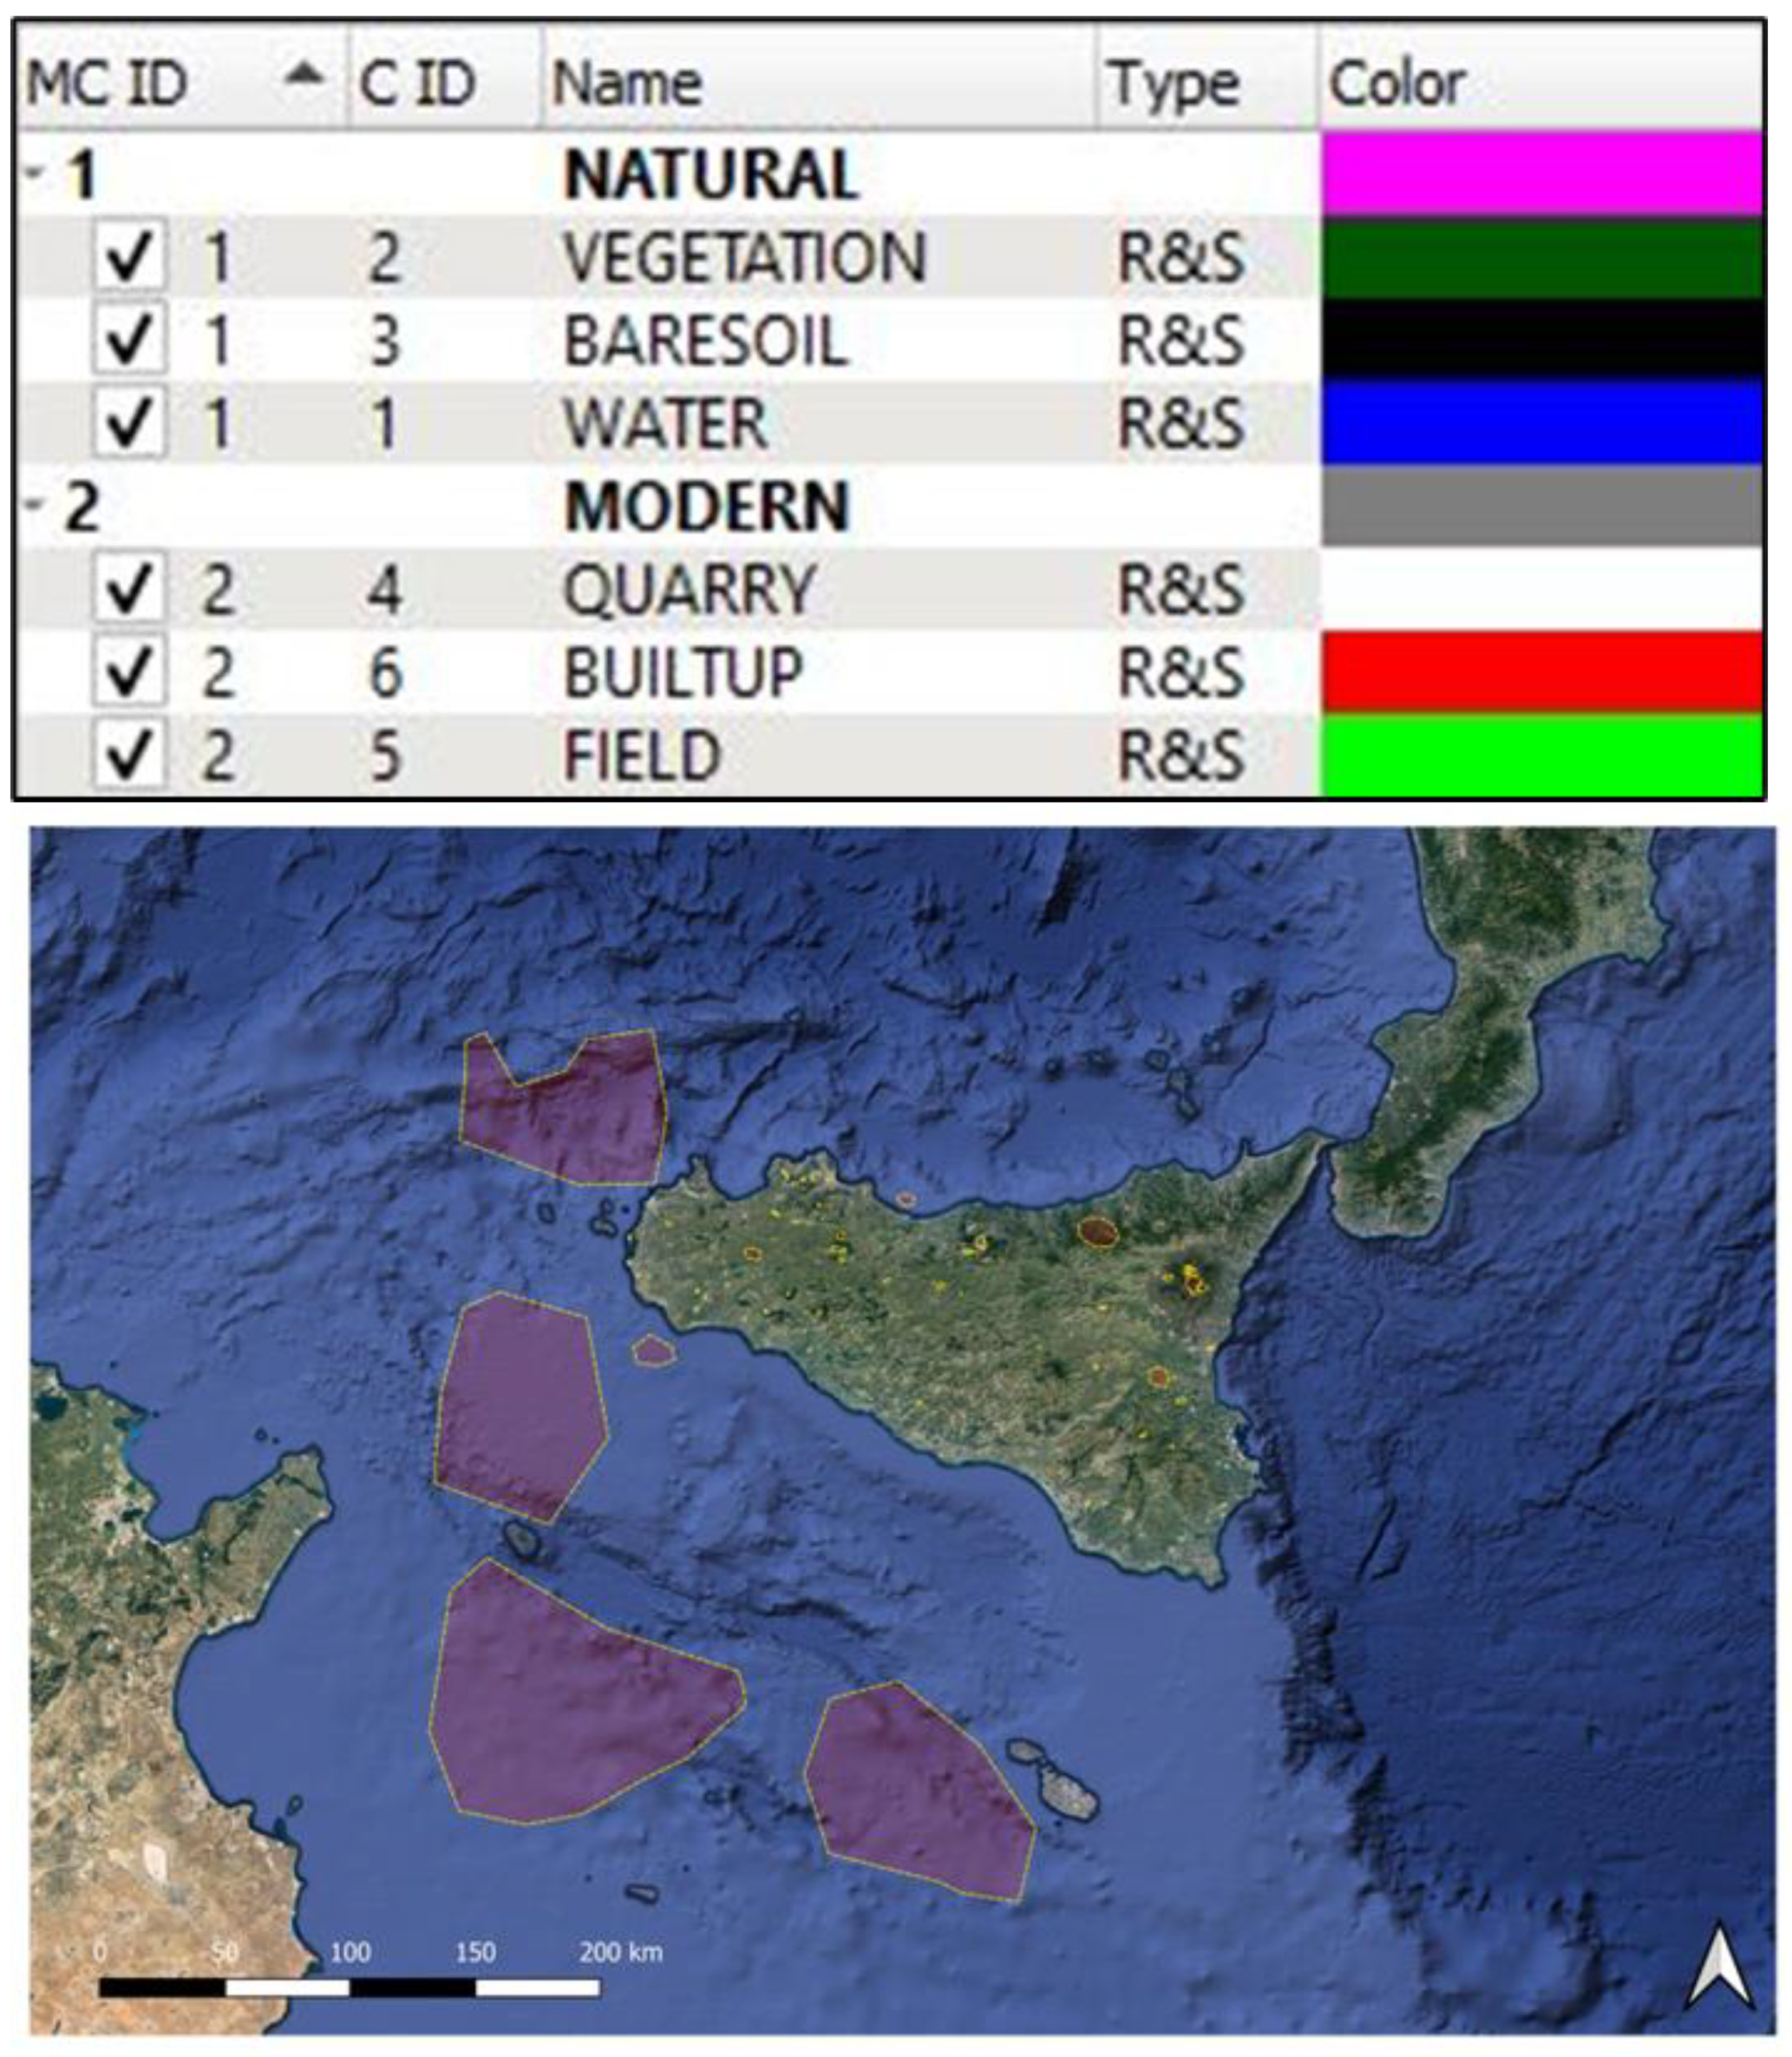
2.2.2. Classification in QGIS

The second step of this study consisted of the classification of the different pixel values within a QGIS project. To perform this classification, we imported the GEE GeoTiff of Sicily, merging it in one multiband image. Then, we worked with the Semi-Automatic Classification Plugin (hereafter SCP) [8]. This plugin allows to perform diverse image processing and some machine learning approaches for image classification. Given the satellite’s perspective revealing the irregular nature of the quarry perimeter, juxtaposed with the visibly distinct pixel value of the exposed minerals in comparison to the surrounding terrain, our strategic choice was to undergo training and subsequent application of a Random Forest classifier (Pixel-Based Supervised Classification; hereafter referred to as RF [9]. Therefore, with the aid of the SCP plugin, we created numerous Regions of Interest (hereafter ROIs), i.e., polygonal vectors, that we grouped into 2 macro classes (natural/Anthropic) and 6 classes (Vegetation, Bare Soil, Water, Quarry, Built Up, Cultivated field) (Figure 2). The RF was set as follows:
  • One band set composed of the NIR and the OSAVI channels;
  • Focused on the 6 classes;
  • Number of training samples: 5000;
  • Number of decision trees: 1000.
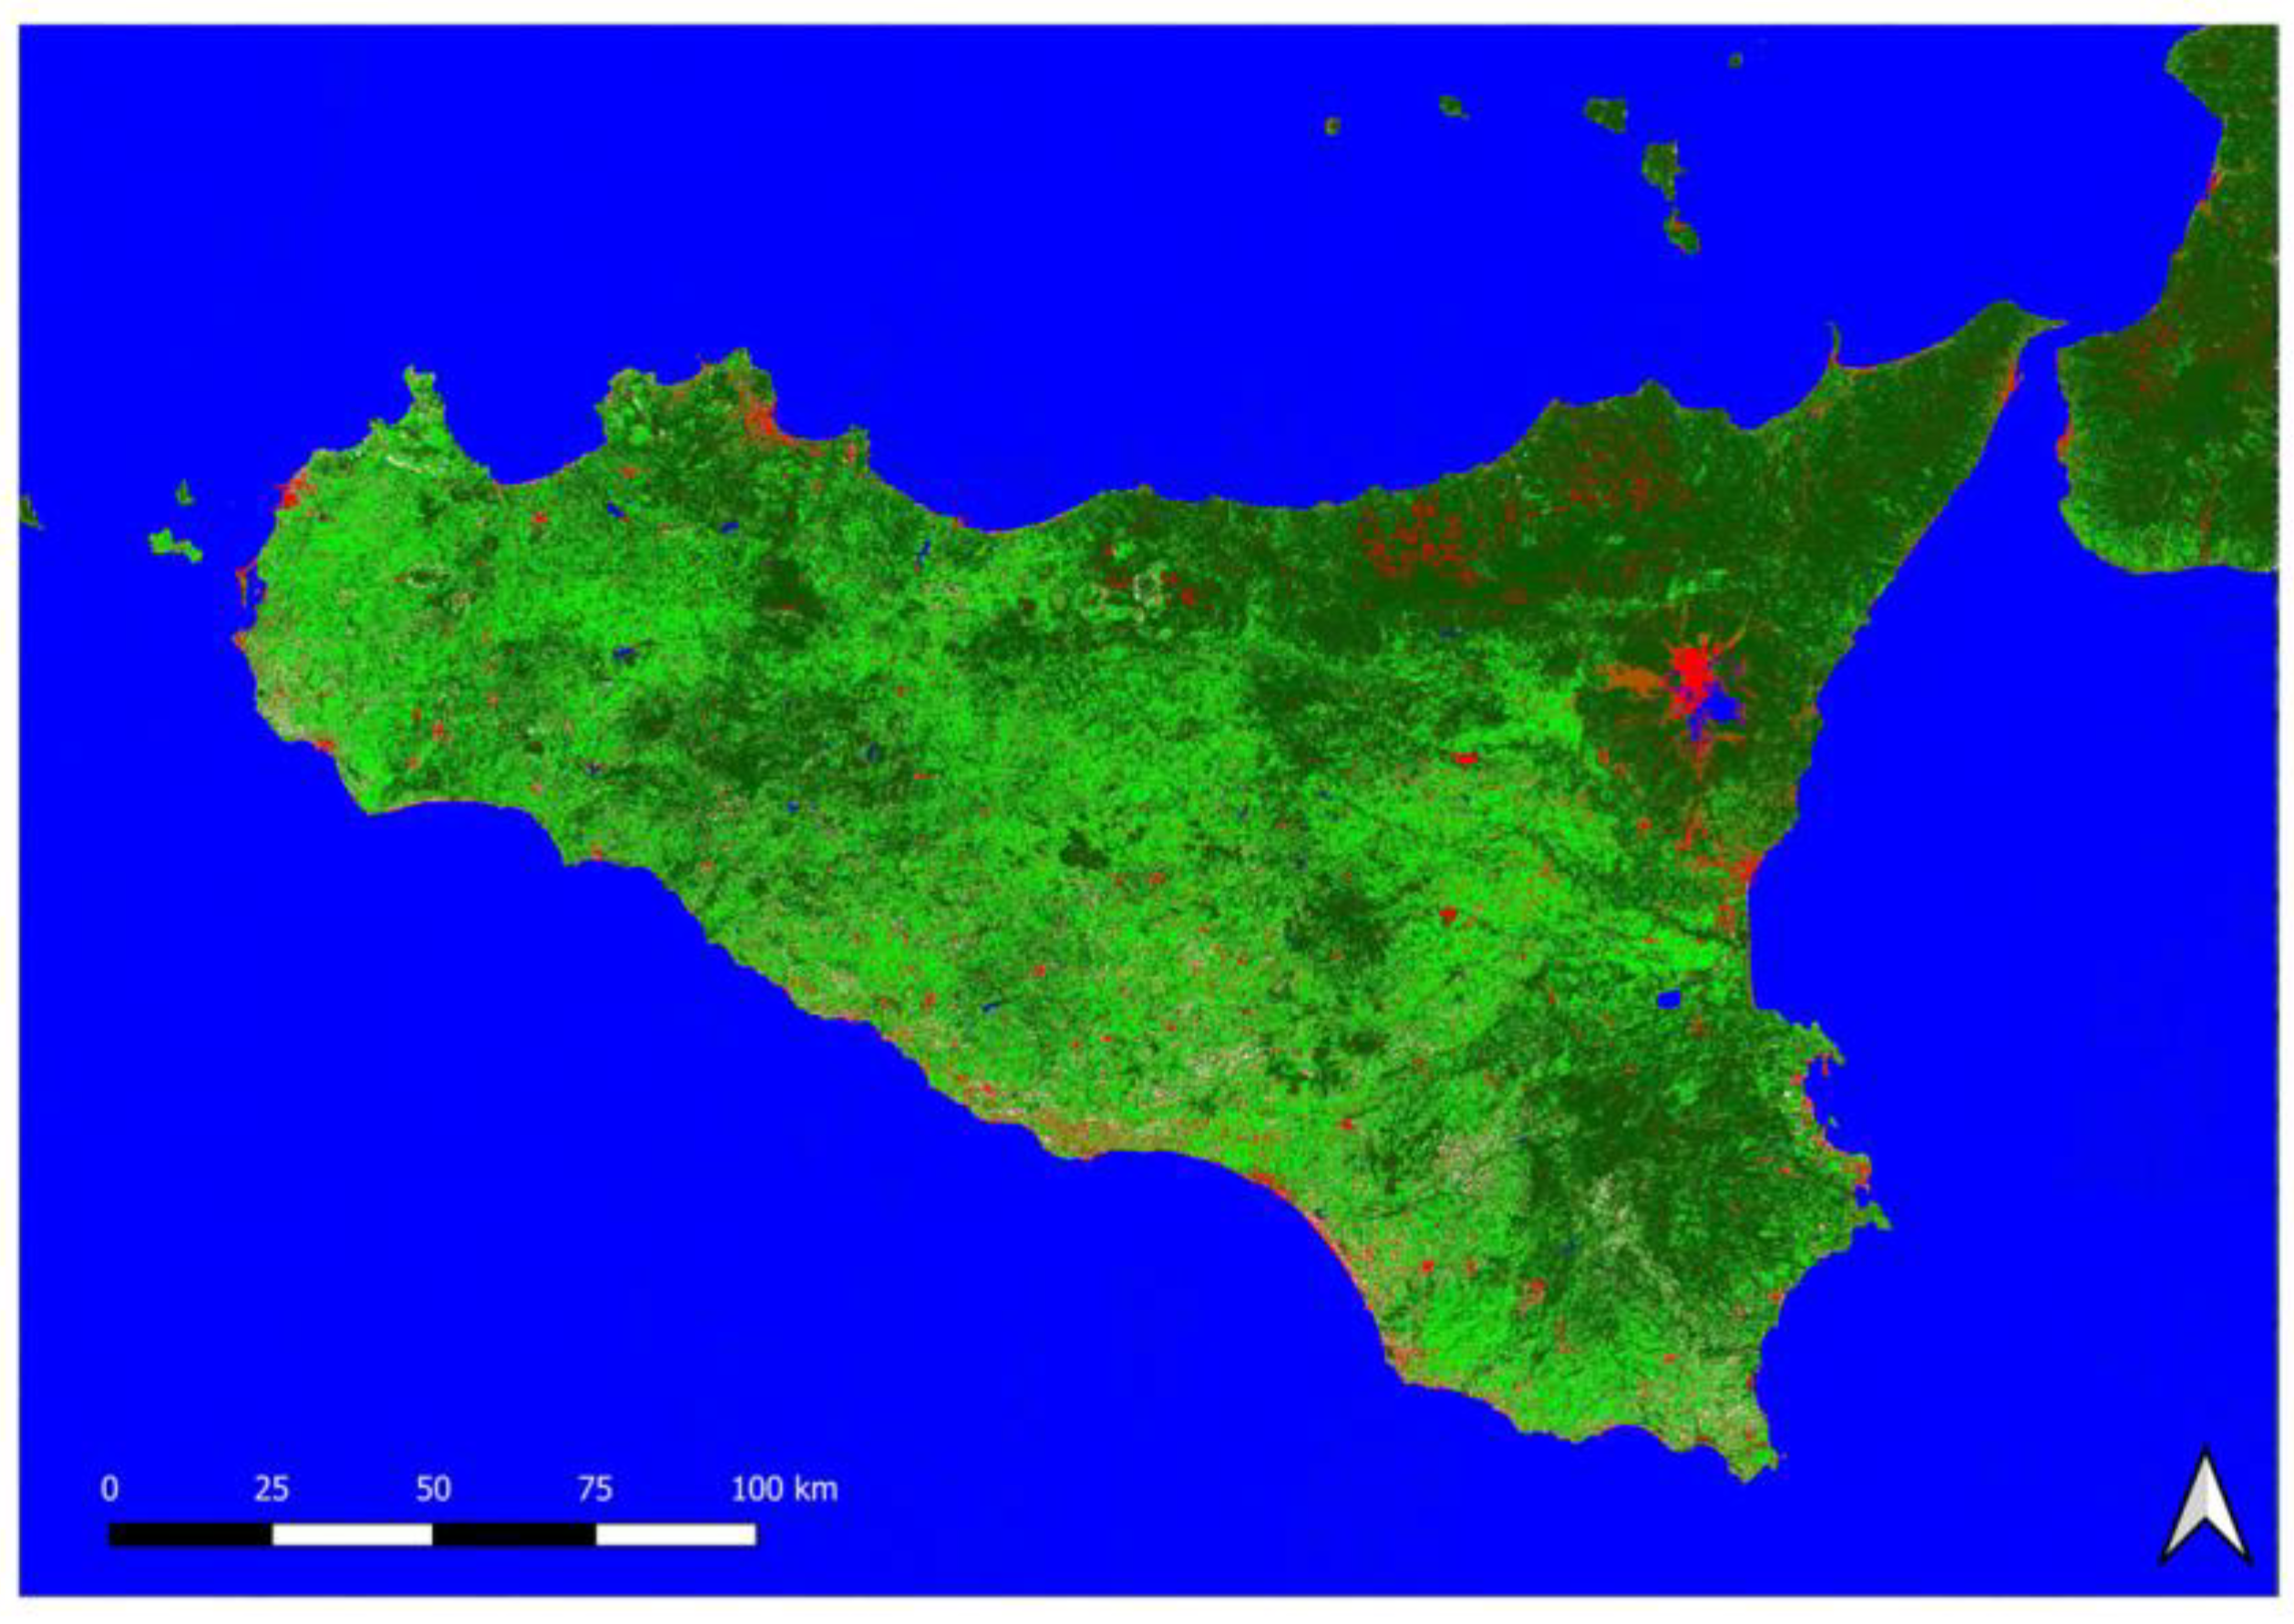
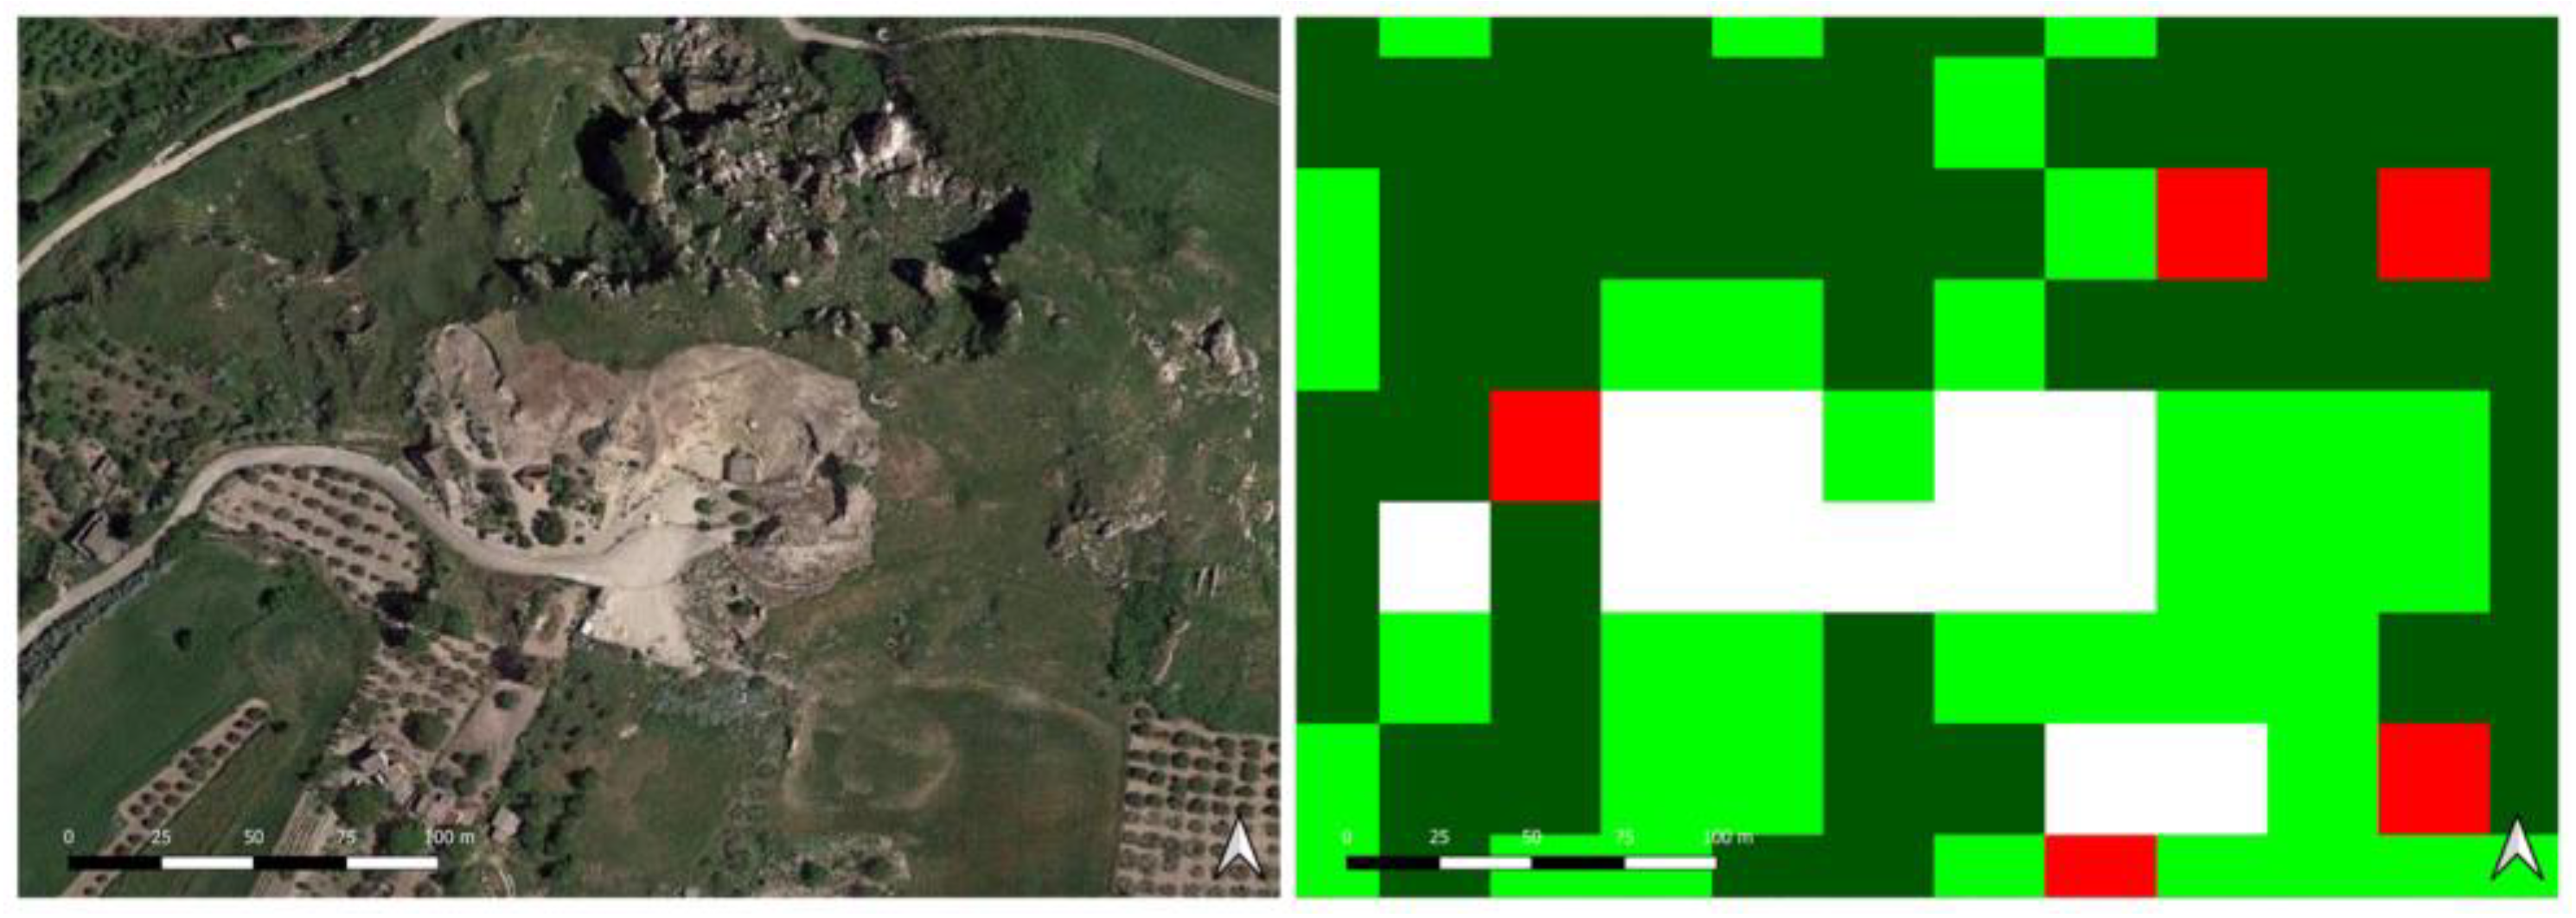
3. Results

The core of the workflow undeniably revolves around the classification of satellite images. In this preliminary phase of our research, it has become evident that the most favorable outcomes were achieved through the classification of the Optimized Soil-Adjusted Vegetation Index (OSAVI; see Table 1).
The Random Forest results showed a preliminary classification of the regional surface with a Confidence Interval between 0.27 and 1 (Figure 3).
The image shows the following features: vegetation in dark green, baresoil in black, water in blue, white quarry, built-up areas in red and fields in light green. However, this classification can lead to errors in classification or interpretation. For example, in the vicinity of the volcano Etna, the reflectance of accumulated snow was recorded as built-up, which demonstrates the limitations of this approach.
As illustrated in Figure 3, the procedure notably spotlighted several quarries that we had not initially incorporated into the machine learning algorithm’s training process.
It is crucial to highlight that the Random Forest machine learning process warrants a more in-depth investigation. Currently, our focus has been exclusively on classifying a specific subset of landscape features, as detailed in the preceding section. Despite these limitations, and even if the pixel resolution was 30 m, the algorithm was able to detect many quarry areas. Nevertheless, the limited number of identified ROIs caused the inclusion of many false positives, including built-up elements and natural rocky outcrops. In light of these limitations, it is noteworthy that the classification process conducted across the entire Sicilian territory effectively detected quarry areas (Figure 4).

4. Discussion and Conclusions

The use of satellite imagery granted us the opportunity to analyze a significant expanse of the Sicilian territory. Thanks to Sentinel 2, we have been able to conduct experiments on environmental monitoring procedures that would have otherwise been impractical if these data had remained inaccessible to the general public.
Based on the results obtained from this preliminary workflow, we realized that it is necessary to delve into smaller areas spanning a few square kilometers, yielding more accurate results in the learning process and significantly speeding up the processing procedure. The reason for this adjustment stems from the finding that the analysis also revealed false positives, which were related to natural and anthropic elements of the landscape that were outside our scope. These classification errors can be attributed to various factors, one of which is the phenomenon of urban reflection in satellite images. Urban areas tend to have unique spectral signatures due to the presence of structures and roads that differ from the surrounding natural landscapes. This distinction in spectral properties can sometimes lead to misclassifications, as the algorithm may erroneously associate these urban signatures with target classes, in this case, quarries. To overcome this problem, we are currently working on a preliminary masking process, refining the classes, and creating many new ROI.
In conclusion, such an approach would enable researchers and organizations involved in the survey to make evidence-based decisions, paving the way for the promotion of proactive measures for risk mitigation. This aspect not only improves the quality of analysis but also represents a significant step toward the implementation of strategies for the conservation and enhancement of cultural heritage, which are fundamental to our historical heritage.

Author Contributions

Conceptualization, G.G. and A.B.; methodology, G.G. and A.B.; software, G.G. and A.B.; validation, G.G. and A.B.; formal analysis, G.G. and A.B.; investigation, G.G. and A.B.; resources, G.G. and A.B.; data curation, G.G. and A.B.; writing—original draft preparation, G.G. and A.B.; writing—review and editing, G.G. and A.B.; visualization, G.G. and A.B.; supervision, G.G. and A.B. All authors have read and agreed to the published version of the manuscript.

Funding

This research received no external funding.

Institutional Review Board Statement

Not applicable.

Informed Consent Statement

Not applicable.

Data Availability Statement

The raw data supporting the conclusions of this article will be made available by the authors on request.

Conflicts of Interest

The authors declare no conflict of interest.

References

  1. Rayne, L.; Bradbury, J.; Mattingly, D.; Philip, G.; Bewley, R.; Wilson, A. From Above and on the Ground: Geospatial Methods for Recording Endangered Archaeology in the Middle East and North Africa. Geosciences 2017, 7, 100. [Google Scholar] [CrossRef]
  2. Belvedere, O. Contatto Culturale e Interrelazioni tra Greci e Indigeni nel Territorio Imerese; Centre Camille Jullian: Aix-en-Provence, France, 2010. [Google Scholar]
  3. Albanese Procelli, R.M.; Allegro, N.; Aquilué, X.; Archibald, Z.H.; Asensio, D.; Baralis, A.; Bats, M.; Belarte, M.C.; Belvedere, O.; Berlingò, I.; et al. Grecs et Indigènes de la Catalogne à la mer Noire: Actes des Rencontres du Programme Européen Ramses2 (2006–2008); Publications du Centre Camille Jullian, Éditions Errance: Aix-en-Provence, France, 2020; ISBN 978-2-9571557-2-9. [Google Scholar]
  4. Torella, G. Le Fortificazioni Indigene della Sicilia Centro-Meridionale: L’area di Influenza Geloa; Göttinger Studien zur Mediterranen Archäologie; M. Leidorf GmbH: Rahden, Germany, 2014; ISBN 978-3-86757-505-8. [Google Scholar]
  5. Lasaponara, R.; Danese, M.; Masini, N. Satellite-Based Monitoring of Archaeological Looting in Peru. In Satellite Remote Sensing; Lasaponara, R., Masini, N., Eds.; Remote Sensing and Digital Image Processing; Springer: Dordrecht, The Netherlands, 2012; Volume 16, pp. 177–193. ISBN 978-90-481-8800-0. [Google Scholar]
  6. Zhao, H.; Ma, Y.; Chen, F.; Liu, J.; Jiang, L.; Yao, W.; Yang, J. Monitoring Quarry Area with Landsat Long Time-Series for Socioeconomic Study. Remote Sens. 2018, 10, 517. [Google Scholar] [CrossRef]
  7. Parcak, S.H. Satellite Remote Sensing for Archaeology; Routledge: London, UK, 2009; 320p, ISBN 9780415448789. [Google Scholar]
  8. Congedo, L. Semi-Automatic Classification Plugin: A Python tool for the download and processing of remote sensing images in QGIS. J. Open Source Softw. 2021, 6, 3172. [Google Scholar] [CrossRef]
  9. Orengo, H.A.; Conesa, F.C.; Garcia-Molsosa, A.; Lobo, A.; Green, A.S.; Madella, M.; Petrie, C.A. Automated Detection of Archaeological Mounds Using Machine-Learning Classification of Multisensor and Multitemporal Satellite Data. Proc. Natl. Acad. Sci. USA 2020, 117, 18240–18250. [Google Scholar] [CrossRef] [PubMed]
Figure 1. Expansion of a quarry visible in Google Earth satellite images of years 2004, 2013, 2014, and 2022.
Proceedings 96 00001 g001
Figure 2. Creation of the ROI in SCP plugin for QGIS.
Proceedings 96 00001 g002
Figure 3. The result of classification.
Proceedings 96 00001 g003
Figure 4. Detail of the quarry identification. The image provided a classification of the area, identifying the quarry in white, built-up areas in red, vegetation in dark green, and fields in light green. To improve accuracy, further analysis and refinement of the classification algorithm may be necessary. However, some land with a specific reflectance was incorrectly identified as built-up areas, similar to the issue observed with Etna.
Proceedings 96 00001 g004
Table 1. Selection of applied spectral indices, a table by Alessia Brucato.
Spectral IndexAcronymFormula
Difference Vegetation IndexDVINIR-Red
Disease Water Stress IndexDWSI[NIR + GREEN]/[SWIR2 + RED]
Disease Water Stress IndexDWSI1NIR/SWIR2
Disease Water Stress IndexDWSI5[NIR − GREEN]/[SWIR2 + RED]
Enhanced Vegetation IndexEVI[NIR − RED]/[NIR + 6 × RED − 7.5 × BLUE + 1]
Normalized Difference Moisture IndexNDMI[NIR − SWIR1]/[NIR + SWIR1]
Normalized Difference Vegetation IndexNDVI(NIR − Red)/(NIR + Red)
Normalized Difference Water IndexNDWI[GREEN × NIR]/[GREEN + NIR]
Optimized Soil Adjusted Vegetation IndexOSAVI1.5 × (NIR − Red)/(NIR + Red + 0.16)
Soil Adjusted Vegetation IndexSAVI[1.5 × (NIR − RED)]/[NIR + RED + 0.5]
Disclaimer/Publisher’s Note: The statements, opinions and data contained in all publications are solely those of the individual author(s) and contributor(s) and not of MDPI and/or the editor(s). MDPI and/or the editor(s) disclaim responsibility for any injury to people or property resulting from any ideas, methods, instructions or products referred to in the content.

