Abstract

Self-Diagnostic Method for Resistive Displacement Sensors †

1
Department of Information Engineering, University of Brescia, Via Branze 38, 25123 Brescia, Italy
2
Research and Development, Gefran SpA, Via Cave 11, 25050 Provaglio d’Iseo, Italy
*
Author to whom correspondence should be addressed.
Presented at the XXXV EUROSENSORS Conference, Lecce, Italy, 10–13 September 2023.
Proceedings 2024, 97(1), 164; https://doi.org/10.3390/proceedings2024097164
Published: 8 April 2024

Abstract

:
Displacement sensors play a key role in the control of dynamic processes. Such sensors can be endowed with self-diagnostic capabilities to identify both the degradation of their conditions and the possible process anomalies that caused them, thus allowing researchers to monitor the process efficiency and therefore its sustainability. Within this scope, a self-diagnostic method is proposed to infer the conditions of a resistive displacement sensor by estimating its model parameters online during operation. Experimental results confirm the effectiveness of the presented method.

1. Introduction

The industrial world is constantly seeking sensors with increasing intelligence and robust measurement methods. In particular, a crucial demand regards the development of sensors with self-diagnostic capabilities to provide information on the sensor health status besides data on the measurand. Such diagnostic information can be exploited by suitable predictive maintenance techniques in order to improve service scheduling and minimize plant downtime [1]. Monitoring sensor conditions also allows researchers to derive information on process efficiency, which is useful in controlling and reducing material waste toward sustainable manufacturing. In this context, this work proposes a self-diagnostic method to infer the conditions of a resistive displacement sensor online during operation, i.e., without requiring the sensor disconnection from the ongoing dynamic process or specific test procedures. The method has been designed in order to meet the computational performances of typical microprocessors so that it can advantageously lead to implementation embedded in the sensor.

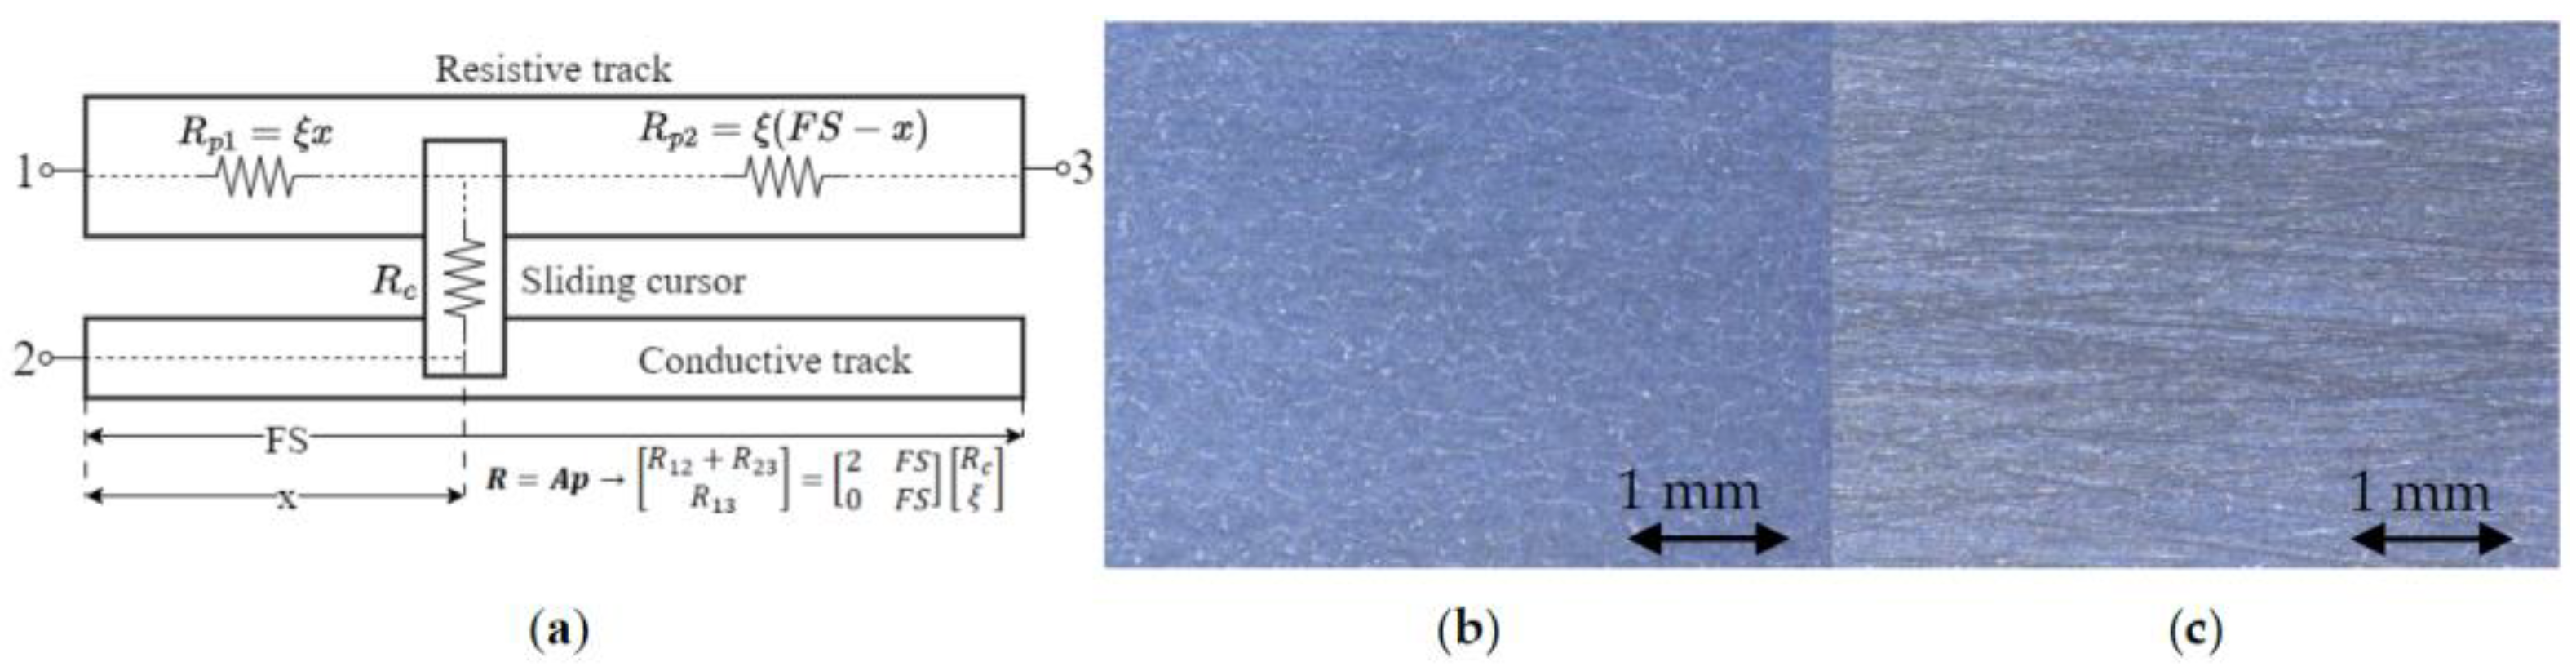
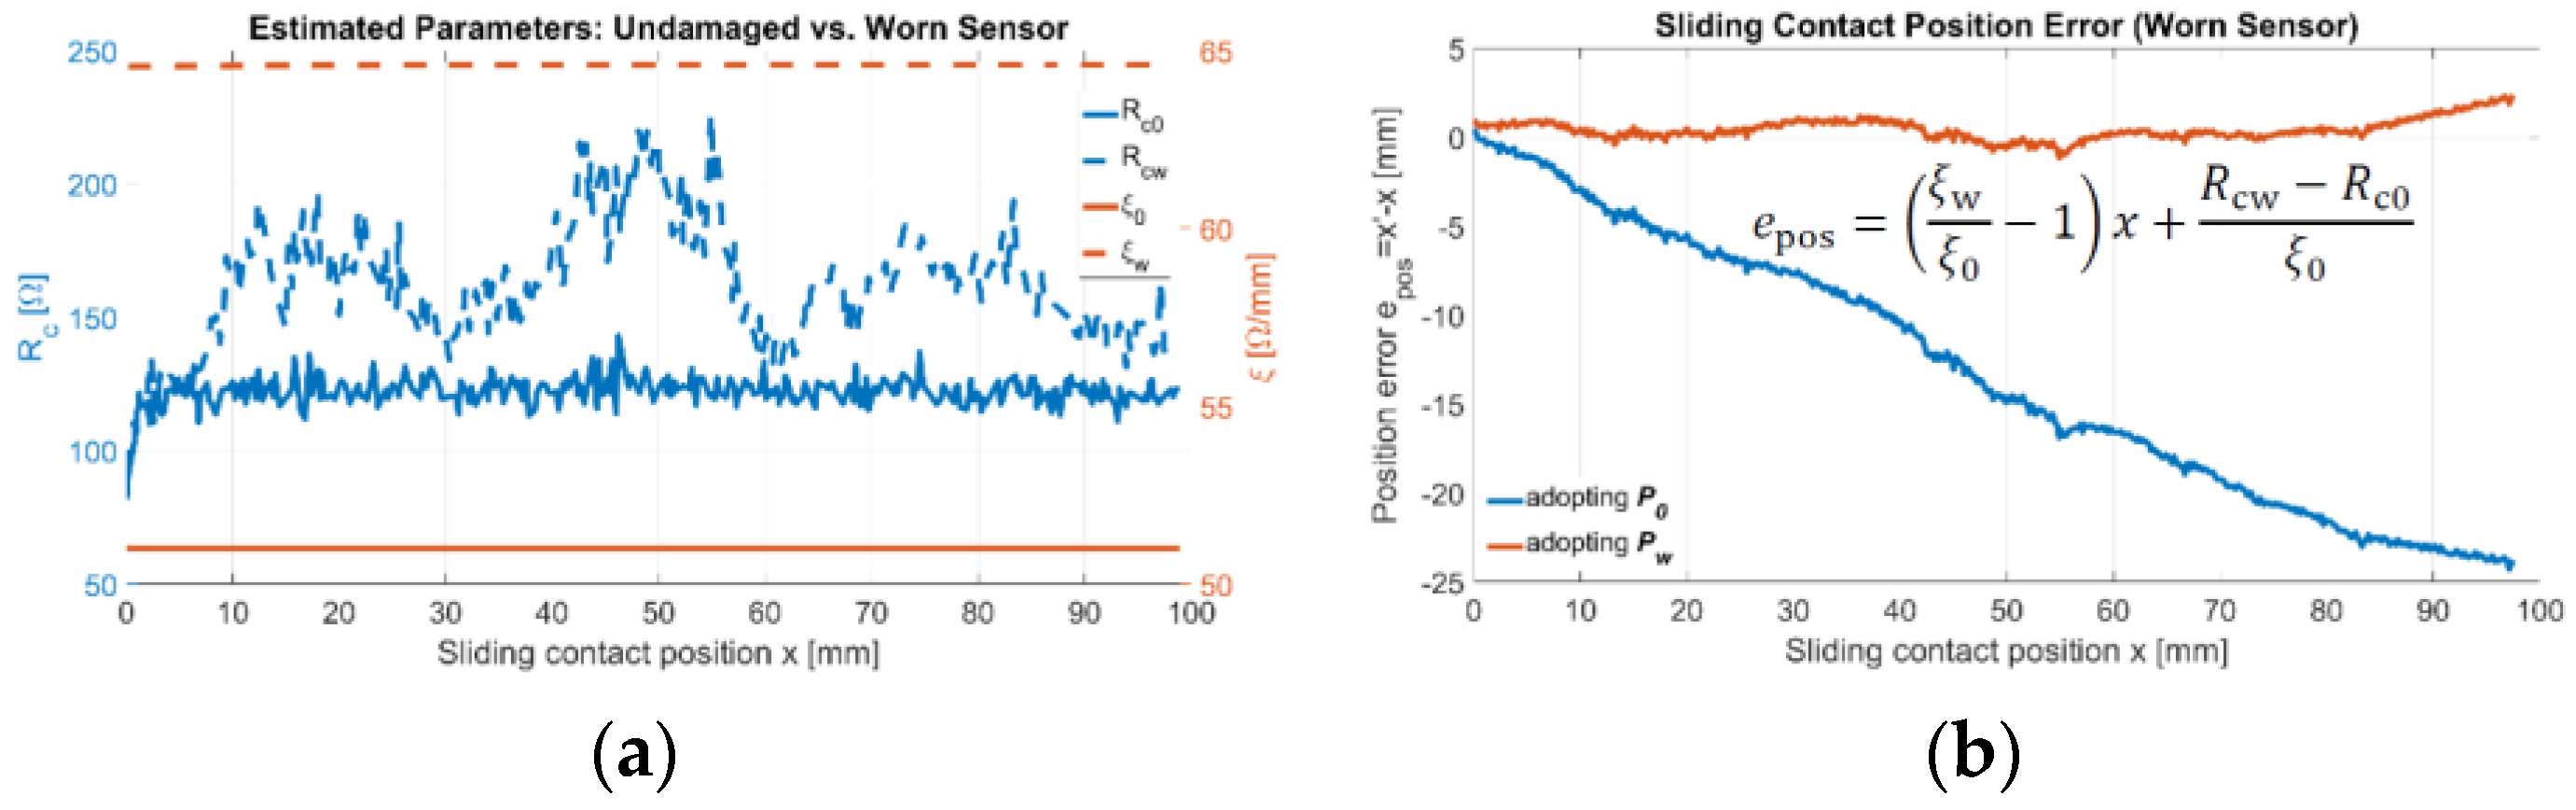
2. Materials and Methods

The sensitive element of a generic resistive displacement sensor is typically composed of a resistive track and a sliding cursor, and their failures are the primary fault modes of resistive displacement sensors [2]. The sensor of linear displacement x is modeled by the resistive circuit of Figure 1a, which comprises two parameters. Namely, Rc represents the contact resistance between the sliding cursor and the resistive track while ξ represents the resistive track resistance per unit length. The sensor conditions can be inferred from such parameters, since, for example, an excessive contact force between the sliding cursor and the resistive track causes the reduction of its thickness, implying ξ to increase. Furthermore, the sliding cursor wear is reflected into a variation of Rc. The proposed self-diagnostic method estimates online the model parameters vector p = [Rc, ξ] by solving the matrix system R = Ap reported in Figure 1a. The term R comprises the resistances between sensor terminal pairs (1;2), (2;3) and (1;3), which are named R12, R23 and R13, respectively. The square matrix A depends on the sensor’s useful electrical stroke length FS for x.
The experimental setup adopted to test the self-diagnostic method consists of a thick film, linear resistive displacement sensor with FS = 100 mm (Gefran PK, Provaglio d’Iseo, Italy), a 6.5-digit digital multimeter (Keithley DAQ6510, Solon, USA) and a precision linear positioning stage (Physik Instruments LS-270, Eschbach, Germany) used to move the sensor sliding cursor in n = 500 different random positions. Assuming a constant temperature, firstly, the resistances R12k, R23k, and R13k have been measured at each position k from 1 to n. Thus, the initial sensor parameters p0 = [Rc0; ξ0] have been estimated by solving the system R0 = Ap0. Subsequently, the sensor has been operated by moving the sliding cursor throughout the whole stroke back and forth 106 times, causing wear. Figure 1b,c illustrate the undamaged and worn resistive track, respectively. Then, the worn sensor parameters pw = [Rcw; ξw] have been estimated by following the same procedure adopted for p0. The n values of the parameters p0 and pw versus the corresponding cursor positions are reported in Figure 2a.

3. Discussion

The mean value P0 of p0 over the n estimations is taken as the reference for an undamaged sensor. The proposed method detects the sensor conditions alteration by evaluating the difference vector ∆ = [∆Rc, ∆ξ] = pwP0. A fault condition is detected whenever ∆Rc or ∆ξ are larger than specific alarm thresholds. Thresholds can be set by considering the impact of the individual parameters Rc and ξ on the sensor metrological performances compared with the requirements of the process under monitoring. From the sensor model, an updated estimation of the cursor position x′ can be obtained as x′ = (R12Rc)/ξ. The mean value Pw of pw over the n cursor positions is calculated. The components of Pw are then used to estimate x′, realizing a self-calibration of the sensor characteristic. Figure 2b plots the position error epos = x′ − x measured on the worn sensor obtained by using both Pw and P0 to estimate x′. The reference cursor position x is obtained through the linear positioning stage. Consistently with the expectations, a larger error is successfully detected in the latter case. As an ongoing work, it is expected that fault typologies can be classified by using a machine learning algorithm trained on vectors ∆ obtained from different sensor wear conditions.

Author Contributions

Conceptualization, D.A. and V.F.; Investigation, F.M.; Methodology, F.M., D.A. and V.F.; Supervision, D.A. and V.F.; Visualization, F.M.; Writing—original draft, F.M.; Writing—review & editing, D.A. and V.F. All authors have read and agreed to the published version of the manuscript.

Funding

This research received no external funding.

Institutional Review Board Statement

Not applicable.

Informed Consent Statement

Not applicable.

Data Availability Statement

Data presented in this article are available on request from the corresponding author.

Conflicts of Interest

D.A. is employed by Gefran SpA. The authors declare that the research was conducted in the absence of any commercial or financial relationships that could be construed as potential conflicts of interest.

References

  1. Çınar, Z.M.; Abdussalam Nuhu, A.; Zeeshan, Q.; Korhan, O.; Asmael, M.; Safaei, B. Machine Learning in Predictive Maintenance towards Sustainable Smart Manufacturing in Industry 4.0. Sustainability 2020, 12, 8211. [Google Scholar] [CrossRef]
  2. Hattangadi, A.A. Failure Prevention of Plant and Machinery; McGraw-Hill Education: New York City, NY, USA, 2004; ISBN 0-07-048309-4. [Google Scholar]
Figure 1. Circuit model of a generic resistive displacement sensor (a). Images obtained with digital microscopy system (Leica DMS300, Wetzlar, Germany) of the sensor resistive track in undamaged (b) and worn (c) conditions.
Proceedings 97 00164 g001
Figure 2. Estimated values of the parameters p0 = [Rc0; ξ0] and pw = [Rcw; ξw] obtained from resistances R12k, R23k and R13k measured at n = 500 different random positions in the initial and worn conditions (a). Position errors epos of the worn sensor versus cursor position derived with reference to both P0 and Pw (b).
Proceedings 97 00164 g002
Disclaimer/Publisher’s Note: The statements, opinions and data contained in all publications are solely those of the individual author(s) and contributor(s) and not of MDPI and/or the editor(s). MDPI and/or the editor(s) disclaim responsibility for any injury to people or property resulting from any ideas, methods, instructions or products referred to in the content.

