Abstract
Energy consumption is a critical parameter in the development of helicopter Unmanned Aerial Vehicles (UAVs). Today, helicopter UAVs are playing an increasingly pivotal role in various applications, from surveillance and reconnaissance to package delivery and search and rescue missions. However, their energy efficiency remains a pressing issue, as it directly impacts their operational duration and payload capacity. One of the key challenges in optimizing energy consumption is the existence of excess power during flight, arising from the intricate interplay between helicopter aerodynamic behavior and safety design. Typically, this excess energy is dissipated, resulting in a suboptimal performance and efficiency. This study investigated the behavior of excess power in a helicopter Unmanned Aerial Vehicle (UAV). Typically, this excess energy is wasted in conventional helicopters and helicopter UAVs. A dual-method approach, encompassing numerical and experimental methodologies, was employed to provide comprehensive insights into the helicopter UAV’s performance under various conditions. Computational fluid dynamics (CFD) simulations were performed to analyze the UAV’s aerodynamics. The simulations were validated by comparing the lift force with wind tunnel experimental data, resulting in acceptable deviations. The experimental analysis was conducted using a wind tunnel and a small-sized helicopter UAV. The experiments were designed to examine the excess power behavior of the UAV under two distinct flight conditions: hover and forward flight. The power output from the generator and power input from the battery were measured under various angular velocities and pitch angles. The results revealed a maximum excess power of 6.84% for hover conditions and 9.83% for forward flight conditions. This indicates that the maximum excess power percentage attributable to the helicopter UAV’s safety measure is 6.84% and that resulting from aerodynamics is 2.99%. The findings of this study contribute valuable knowledge to the optimization of helicopter UAV performance and the potential for harnessing excess power during flight operations. When this excess energy is harnessed, it can contribute significantly to the overall performance and efficiency of the UAV, potentially extending its flight duration or accommodating additional payload capacity that could potentially pave the way for the development of hybrid helicopter UAV models in the future.
1. Introduction
Helicopter Unmanned Aerial Vehicles (UAVs) have gained significant attention in recent years due to their versatility and ability to perform a variety of tasks, ranging from surveillance to rescue operations [1,2]. Their performance is strongly influenced by aerodynamic characteristics, primarily determined by the rotor design and operating conditions. As helicopters are predominantly characterized by their low-speed, low-altitude, and short-range flight capabilities, optimizing their efficiency, endurance, range, forward speed, and service ceiling is a key area of focus in helicopter design [3,4,5]. To enhance the efficiency and endurance of helicopter UAVs, it is crucial to understand their complex aerodynamics [6,7,8]. Generally, a helicopter’s power consumption can be attributed to its main rotor induced power, main rotor profile power, tail rotor power, and fuselage parasite power. Efforts to enhance the performance of helicopter UAVs through a reduction in flight energy consumption are significant in the ongoing development of helicopter UAV technology. Hence, the investigation of strategies aimed at reducing the loss of energy that remains unutilized in helicopter UAV operations becomes crucial.
One technique that has been studied to reduce energy consumption in helicopter UAVs involves the reduction in main rotor speed during cruise flights. The concept of a variable rotor speed has been investigated as a means of enhancing helicopter performance under specific flight conditions. When the rotor speed is decreased, it can lead to a reduction in rotor power while cruising at low altitudes and with lighter loads, primarily due to a decrease in rotor profile power [9]. However, the benefits of a reduced rotor power become less significant as altitude or gross weight increases or when flying at low speeds, where rotor induced power has a greater influence on the total helicopter power [10]. In forward flight, the need for increased angles of attack to generate sufficient thrust can result from a reduced rotor speed, potentially exacerbating stall areas and limiting power reduction capabilities [11]. Additionally, a varying rotor speed during flight may lead to dynamic issues, such as increased blade loads and vibration problems, especially at lower rotor speeds and higher forward speeds [12,13]. Wind tunnel tests involving a variable-speed model rotor have demonstrated an increase in root bending moments and higher harmonic pitch link loads as rotor speed is reduced [14]. Although decreasing rotor speed can result in significant rotor power reductions, it is crucial to consider the potential negative effects, especially during high forward flight [15].
Another approach, in addition to the reduction in rotor speed, involves the modification of the rotor blade’s design. In the pursuit of an enhanced helicopter performance, active twist rotors have emerged as a promising technology. By altering the blade twist distribution according to the helicopter’s flight state, performance improvements can be achieved [16]. Increased blade twist in hover and reduced blade twist in high forward flight have been recognized as beneficial in helicopter rotor design. Wind tunnel tests have confirmed that highly twisted rotors exhibit a better hover performance but also lead to higher forward flight blade loads and vibratory fixed-frame hub loads [17]. Hover and forward flight wind tunnel tests were carried out on model rotors featuring individual blade twist control through the incorporation of piezoceramic materials. The outcomes of these tests revealed that the achieved tip twist amplitudes were around 0.5 degrees, falling short of the desired range of 1 to 2 degrees [18]. The potential for using a two-per-revolution input to decrease rotor power was also underscored [19]. Furthermore, research has demonstrated the effectiveness of shear-induced piezoceramic actuation in modifying rotor blade twist, which contributes to vibration reduction, flow separation delay, and dynamic stall mitigation. Studies employing weak fluid–structure coupling to examine the advantages of active twist rotors unequivocally demonstrated that active twist control implementation could concurrently minimize rotor vibrations and power consumption [20,21]. In a coupled computational fluid dynamics and computational structural dynamics analysis of a full-scale helicopter rotor, a four-degree dynamic twist in high forward flight led to a 7.3% increase in the rotor lift-to-effective drag ratio and a 3.3% reduction in the corresponding power [22]. However, a rotor blade with more twist might also be more complex and expensive to manufacture, and it could potentially be less durable or require more maintenance. These factors could offset the potential benefits in terms of power consumption.
This study was inspired by the concept that helicopters inherently possess excess power due to their aerodynamic characteristics and safety design. This excess power allows helicopters to effectively respond to unforeseen circumstances, such as encounters with crosswinds or tailwinds, by maintaining the necessary power reserves so that it can secure an equilibrium immediately [23]. For this reason, this study focused on investigating the possibility of recovering excess power from a helicopter UAV which constitutes the energy surplus from the helicopter’s safety measures and its aerodynamic behavior during forward flight. Typically, this excess energy is wasted in conventional helicopters and helicopter UAVs. This research will employ both computational and experimental approaches, utilizing computational fluid dynamics (CFD) simulations and wind tunnel testing to characterize the helicopter UAV’s energy consumption behavior under various operating conditions. The results of this study will provide valuable insights into the potential for capturing excess power from helicopter UAVs and contribute to the development of more efficient and sustainable aerial vehicles.
2. Modeling and Methods
This research consists of two primary components: a numerical approach and an experimental approach. The numerical approach was employed to validate the hypothesis that excess energy could be harnessed from the aerodynamic characteristics of the helicopter UAV by examining whether the rotor lift generated during forward flight exceeded that generated during hovering. This methodology facilitated a thorough investigation of the UAV’s aerodynamic properties under varying conditions. Conversely, the experimental approach focused on analyzing and scrutinizing the UAV’s excess power behavior. By integrating these two methodologies, this study aimed to offer an in-depth analysis of the helicopter UAV’s performance and valuable insights into its operation under diverse conditions. Table 1 provides the main design parameters of the UAV’s rotor, including the main rotor radius and blade chord length.

Table 1.
Main Rotor Parameter.
2.1. Numerical Approach
2.1.1. Numerical Model
CFD has emerged as a powerful tool for examining the aerodynamics of various rotating machines, including helicopter rotors, propellers, and wind turbines. In this investigation, incompressible Unsteady Reynolds-Averaged Navier–Stokes (URANS) equations were solved using a finite volume method on a unstructured grid. The mesh for the geometry was generated using ANSYS Meshing, and the ANSYS Fluent solver was employed for flow simulation. The model employed in this research encompassed two distinct scenarios: the hover case and the forward case. For each scenario, three rotational speeds, 2000, 3000, and 4000 rpm, were considered. Moreover, three pitch angles were assessed: 6.8, 10.3, and 13.3 degrees.
2.1.2. Numerical Method
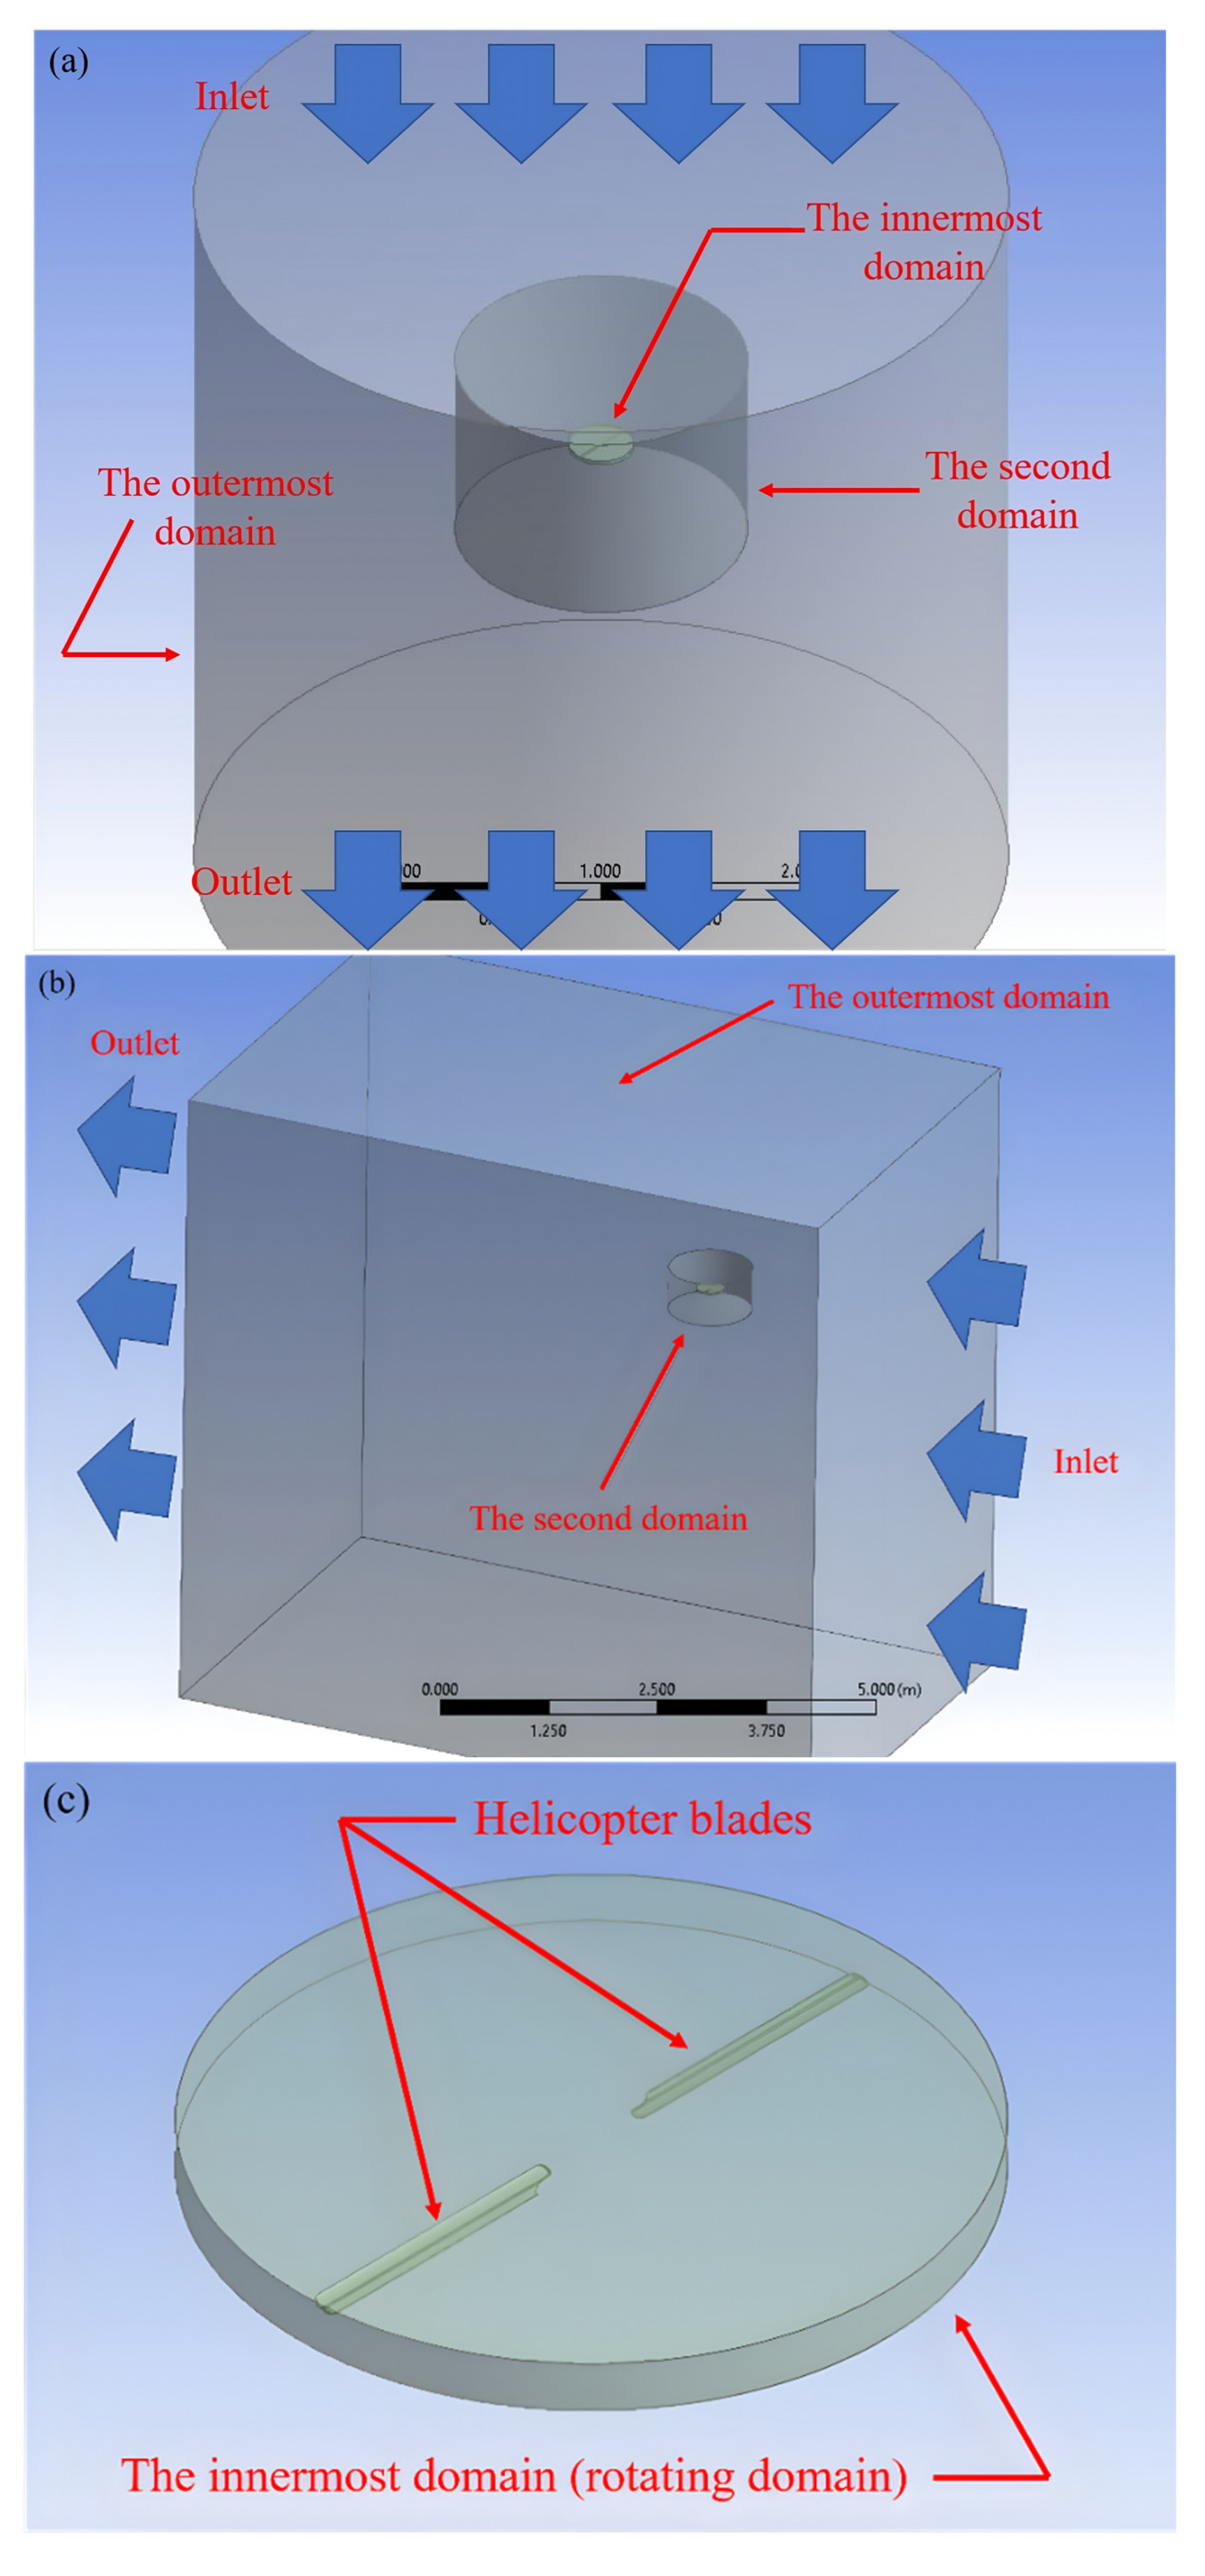
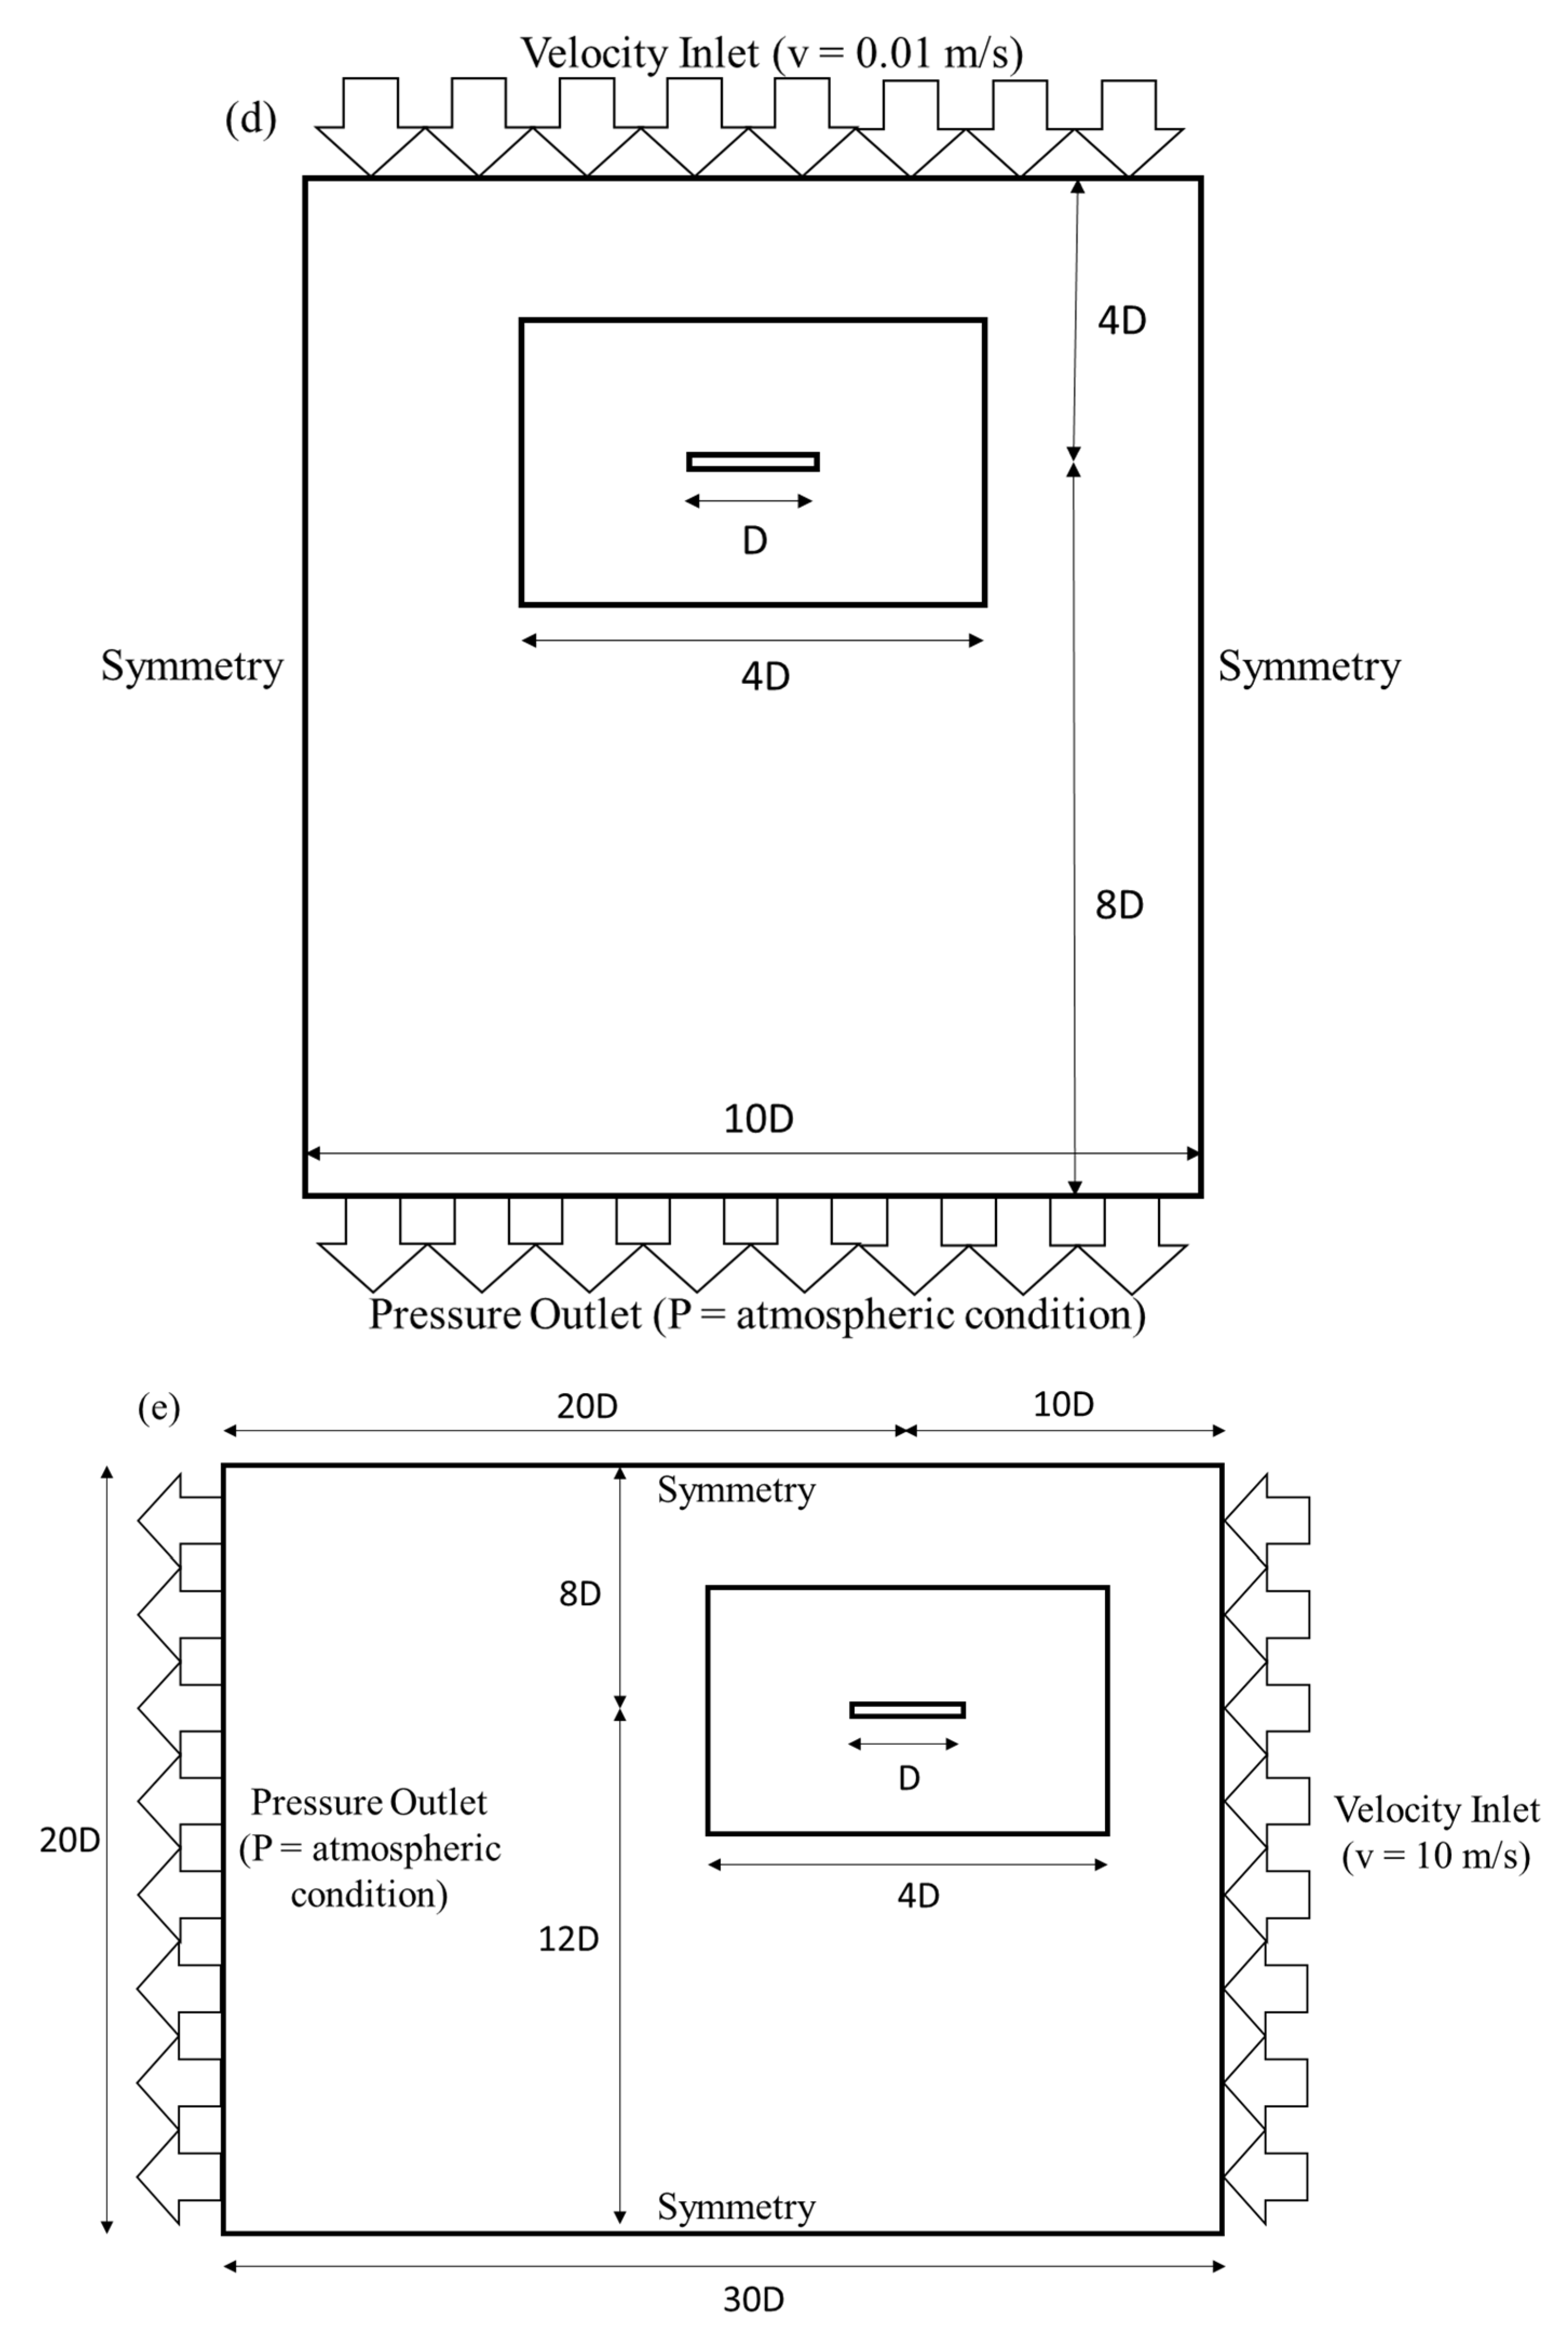
The computational mesh employed for simulating the flow around the rotor comprised three distinct domains. The outermost domain remained static, adopting a cylindrical shape for the hover case and a rectangular shape for the forward case. The second domain, also static and cylindrical, was implemented to streamline the mesh size. The innermost domain was a cylindrical region containing the rotor geometry, rotating at the same speed as the rotor depicted in Figure 1a–c. The dimensions of the computational domain are shown in Figure 1d,e. A sliding mesh cell zone condition and mesh interfaces were applied at the interface to simulate the interaction between the rotating and static domains [24,25]. The considered range of the Reynolds number, based on blade chord length, around the helicopter blade was 12,000–14,000.
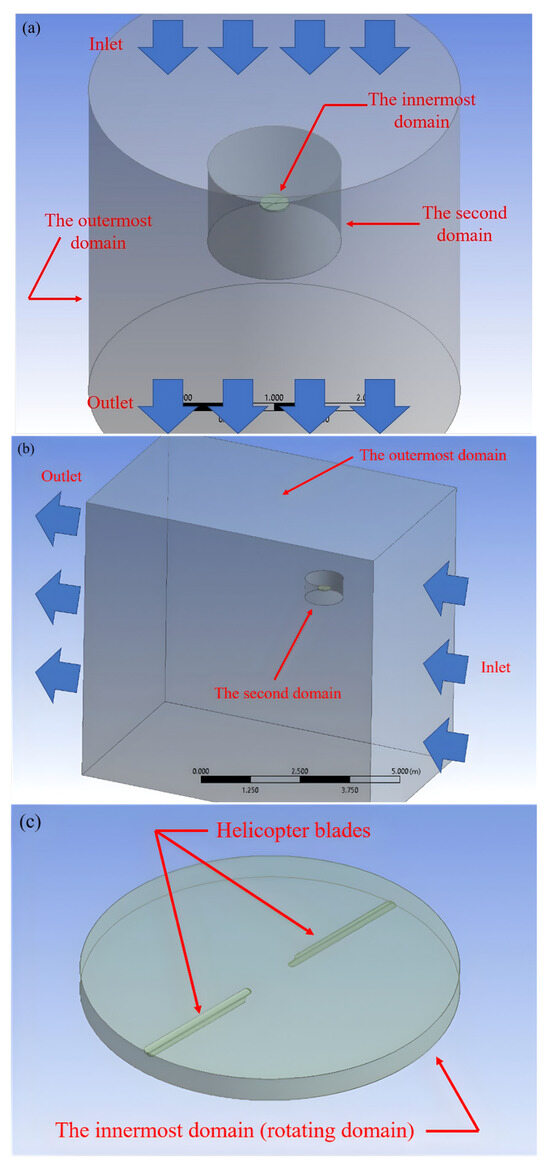
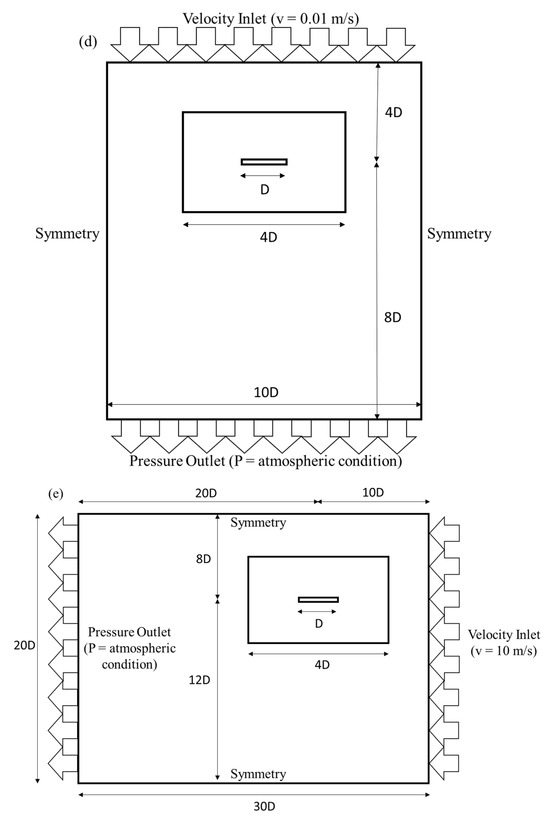
Figure 1.
CAD model and mesh model for CFD simulation. (a) Hover flight CAD model. (b) Forward flight CAD model. (c) The rotor CAD model domain. (d) Computational domain for hover flight conditions. (e) Computational domain for forward flight conditions.
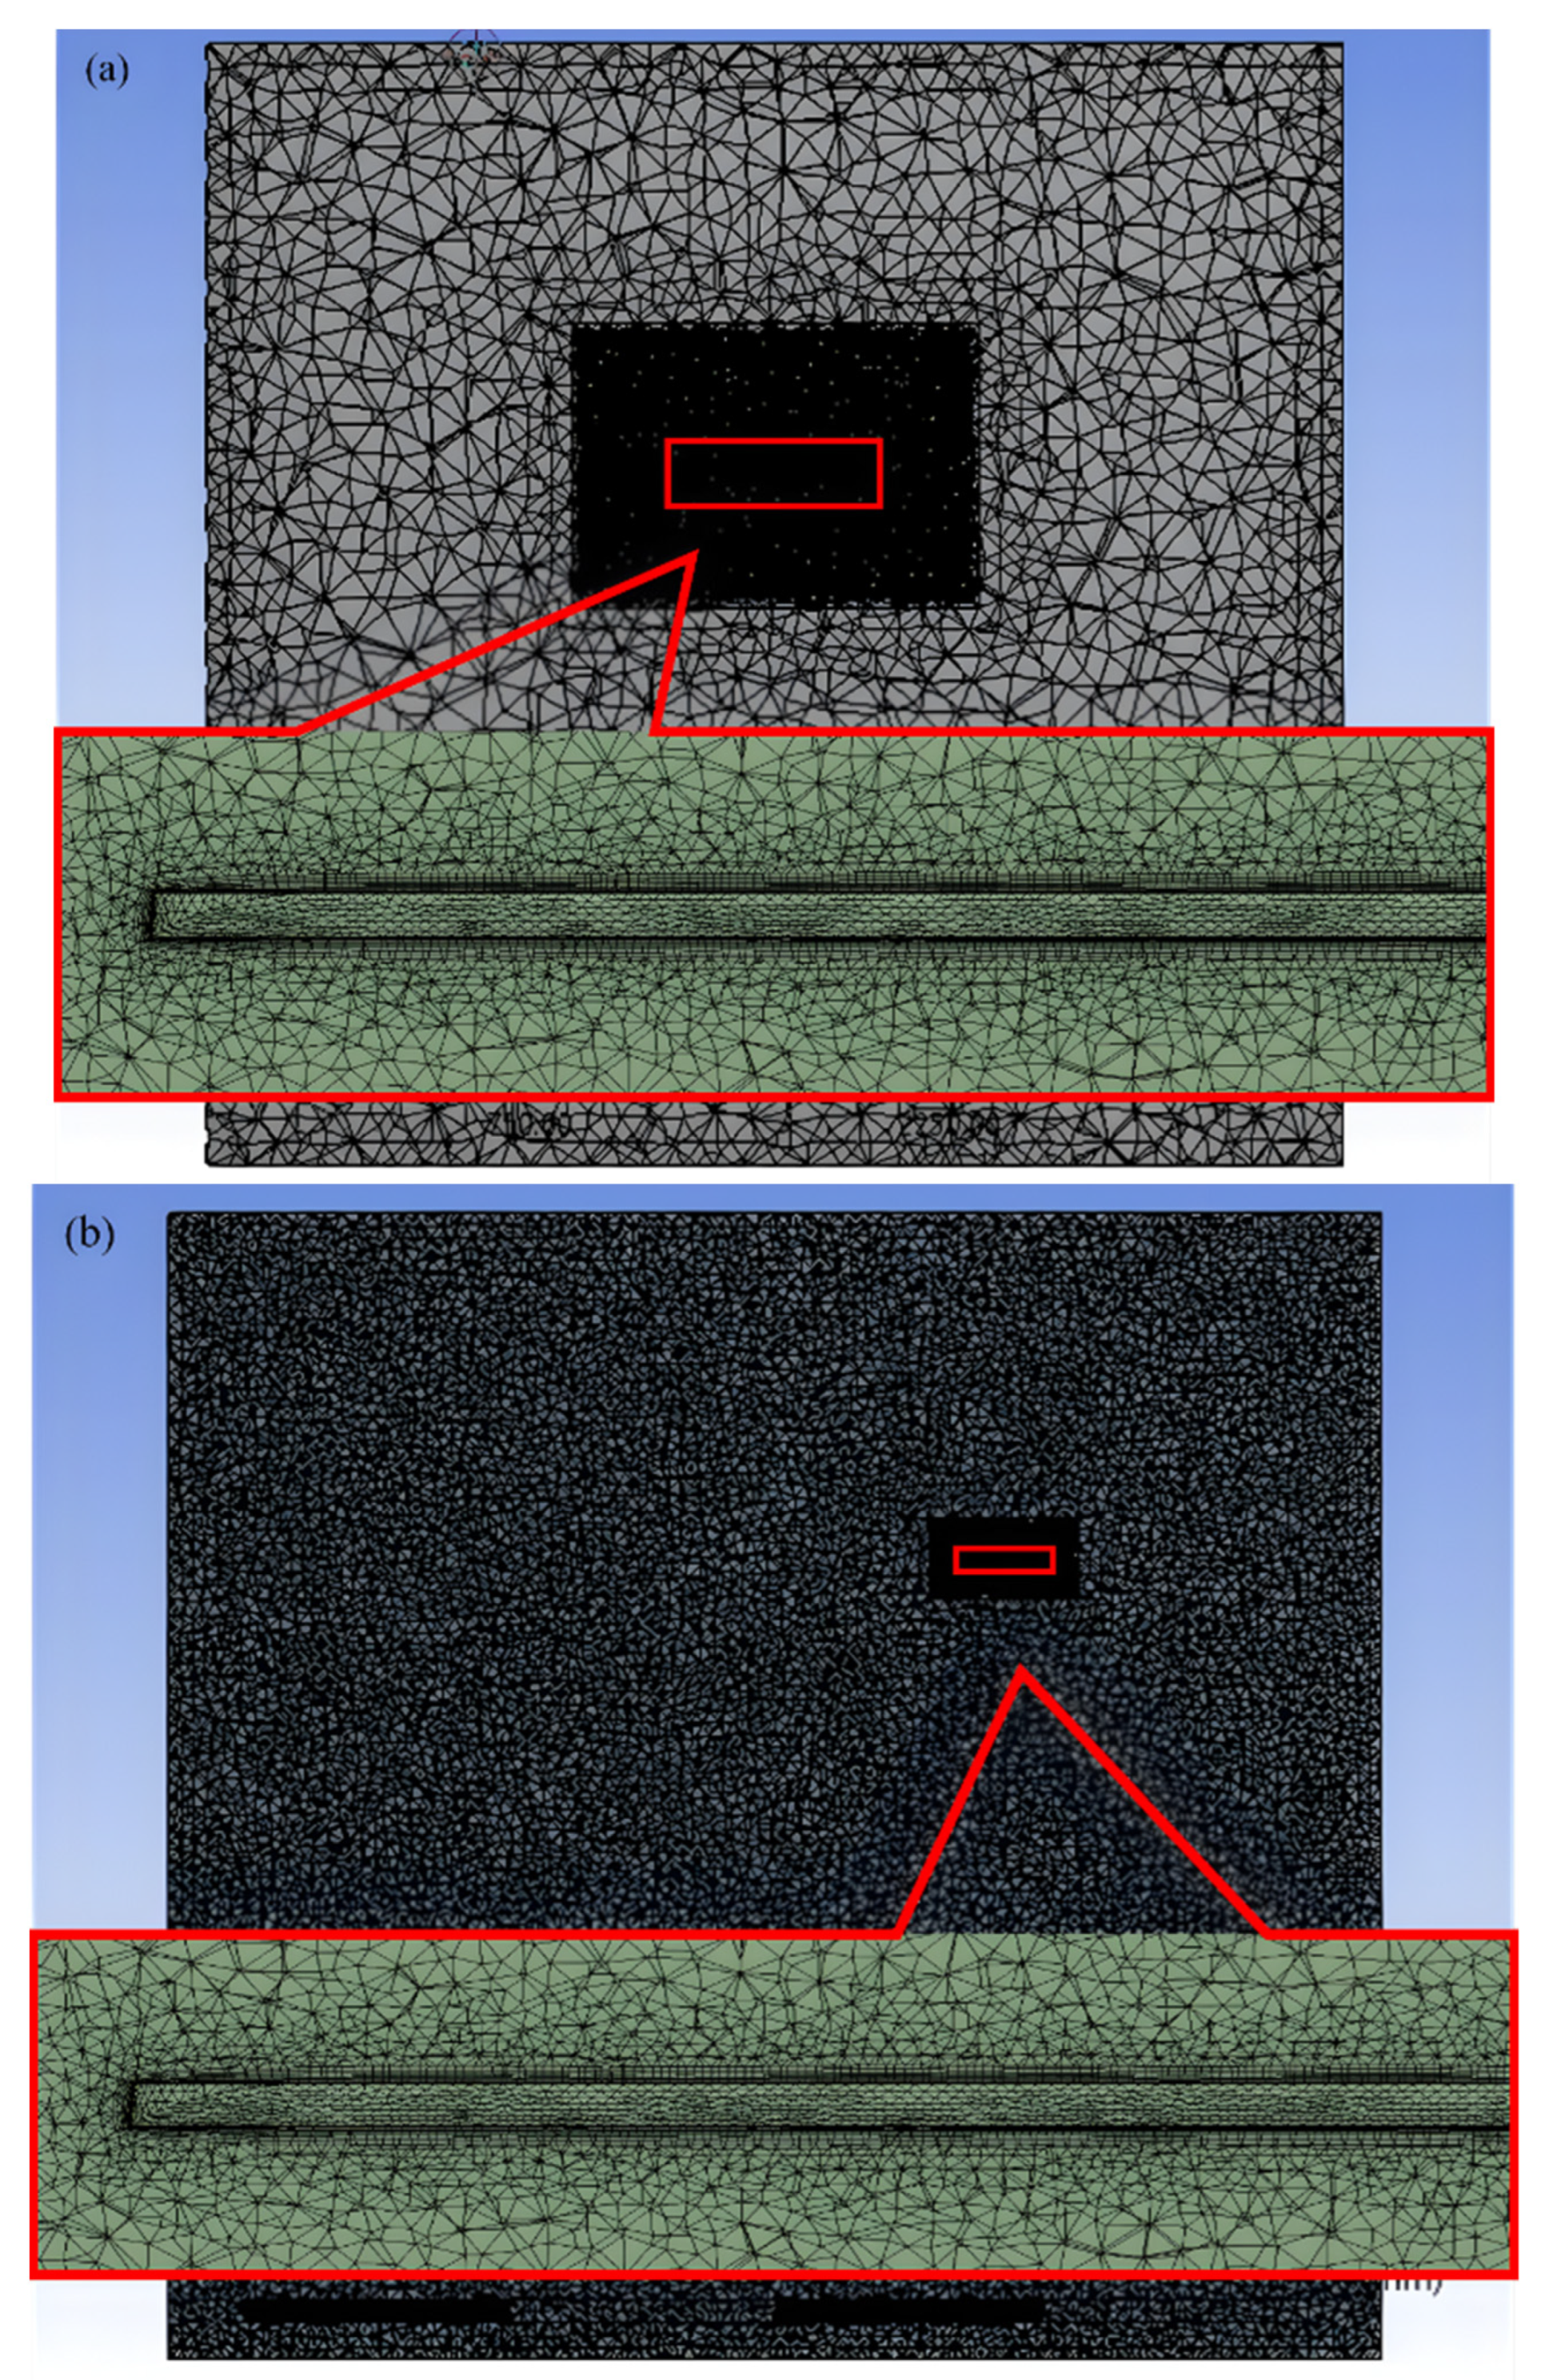
In this research, the tetrahedron method with patch-conforming algorithm meshes were employed to obtain a better mesh quality, thereby enhancing the accuracy of the simulations. The mesh configuration comprised two integral parts: the background mesh and the component mesh adjacent to the wall, as shown in Figure 2, with these two aspects intersecting. This intersection enabled the independent modeling of the background mesh and the component mesh, facilitating easy data exchange between them. Inflation layers were incorporated to augment the accuracy of the numerical results. The k-ω SST turbulence model utilized in this study facilitated the close monitoring of the non-dimensional wall distance (y+), which was maintained at approximately 1 on the bluff body’s wall. This measure was undertaken to ensure that the resolution of the near-wall mesh surrounding the helicopter rotor model was sufficiently high. The k-ω SST turbulence model was selected because it is known to provide a better accuracy in predicting turbulent flows compared to simpler models like the laminar model or the Spalart–Allmaras model. Moreover, the k-ω SST turbulence model includes modifications to account for near-wall behavior, which is important when studying the aerodynamics of helicopters, as the rotor blades generate strong vortices that interact with the ground or other surfaces, leading to complex near-wall flow phenomena. The mesh and mesh quality are shown in detail in Table 2. Such a resolution is essential in order to accurately capture and represent the behavior of the flow in close proximity to the wall.
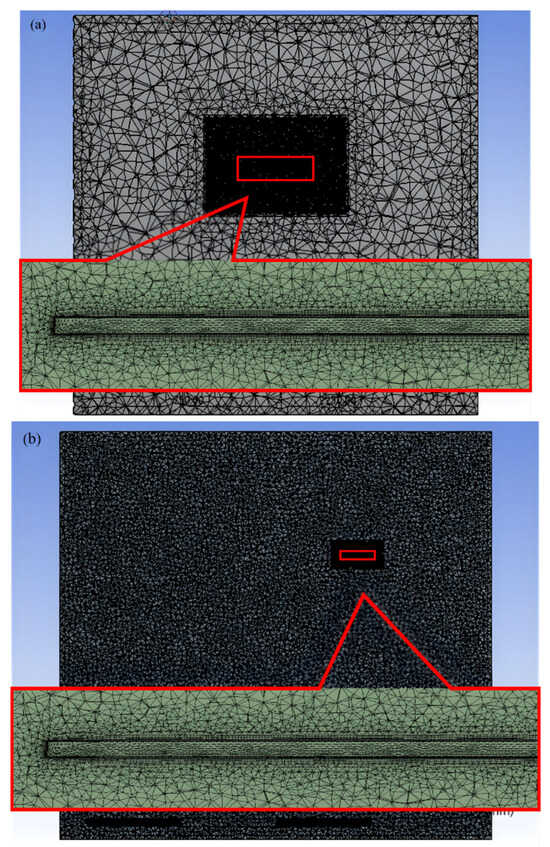
Figure 2.
Mesh in (a) hover flight conditions and (b) forward flight conditions (from side view).

Table 2.
Mesh and Mesh Quality.
To simulate the flow around the rotor, a pressure-based solver was utilized in this study. The fluid was modeled as incompressible, and a time-step of one degree was employed, corresponding to the rotational speed of the innermost domain. The solver employed the SIMPLE algorithm, and the inlet velocity was set to 0.01 m/s for the hover flight condition [26]. It is noted that the inlet velocity is set to a very small number equal 0.01 m/s to prevent computational divergence. The inlet velocity was set to 10 m/s for forward flight condition to align with the conditions in a wind tunnel experiment. First-order implicit transient formulation and a least square cell-based method were used for this work, and the time step size was 1 × 10⁻⁵ s. The turbulence model was the SST k-ω model [27,28]. The governing equations were as follows:
where ui indicates the fluid velocity, p represents pressure, xi indicates the Cartesian coordinate, ρ represents the fluid density, μ indicates the dynamic viscosity, Rij represents the Reynolds stress tensor, and t indicates time.
Original k-ω model:
where μt represents the turbulent eddy viscosity, k indicates the turbulent kinetic energy, ω represents the specific dissipation rate, τij indicates the shear stress, and ν represents the kinematic viscosity. β is 0.09, σk is 0.85, σω is 0.5, and γ indicates the specific constant coefficients.
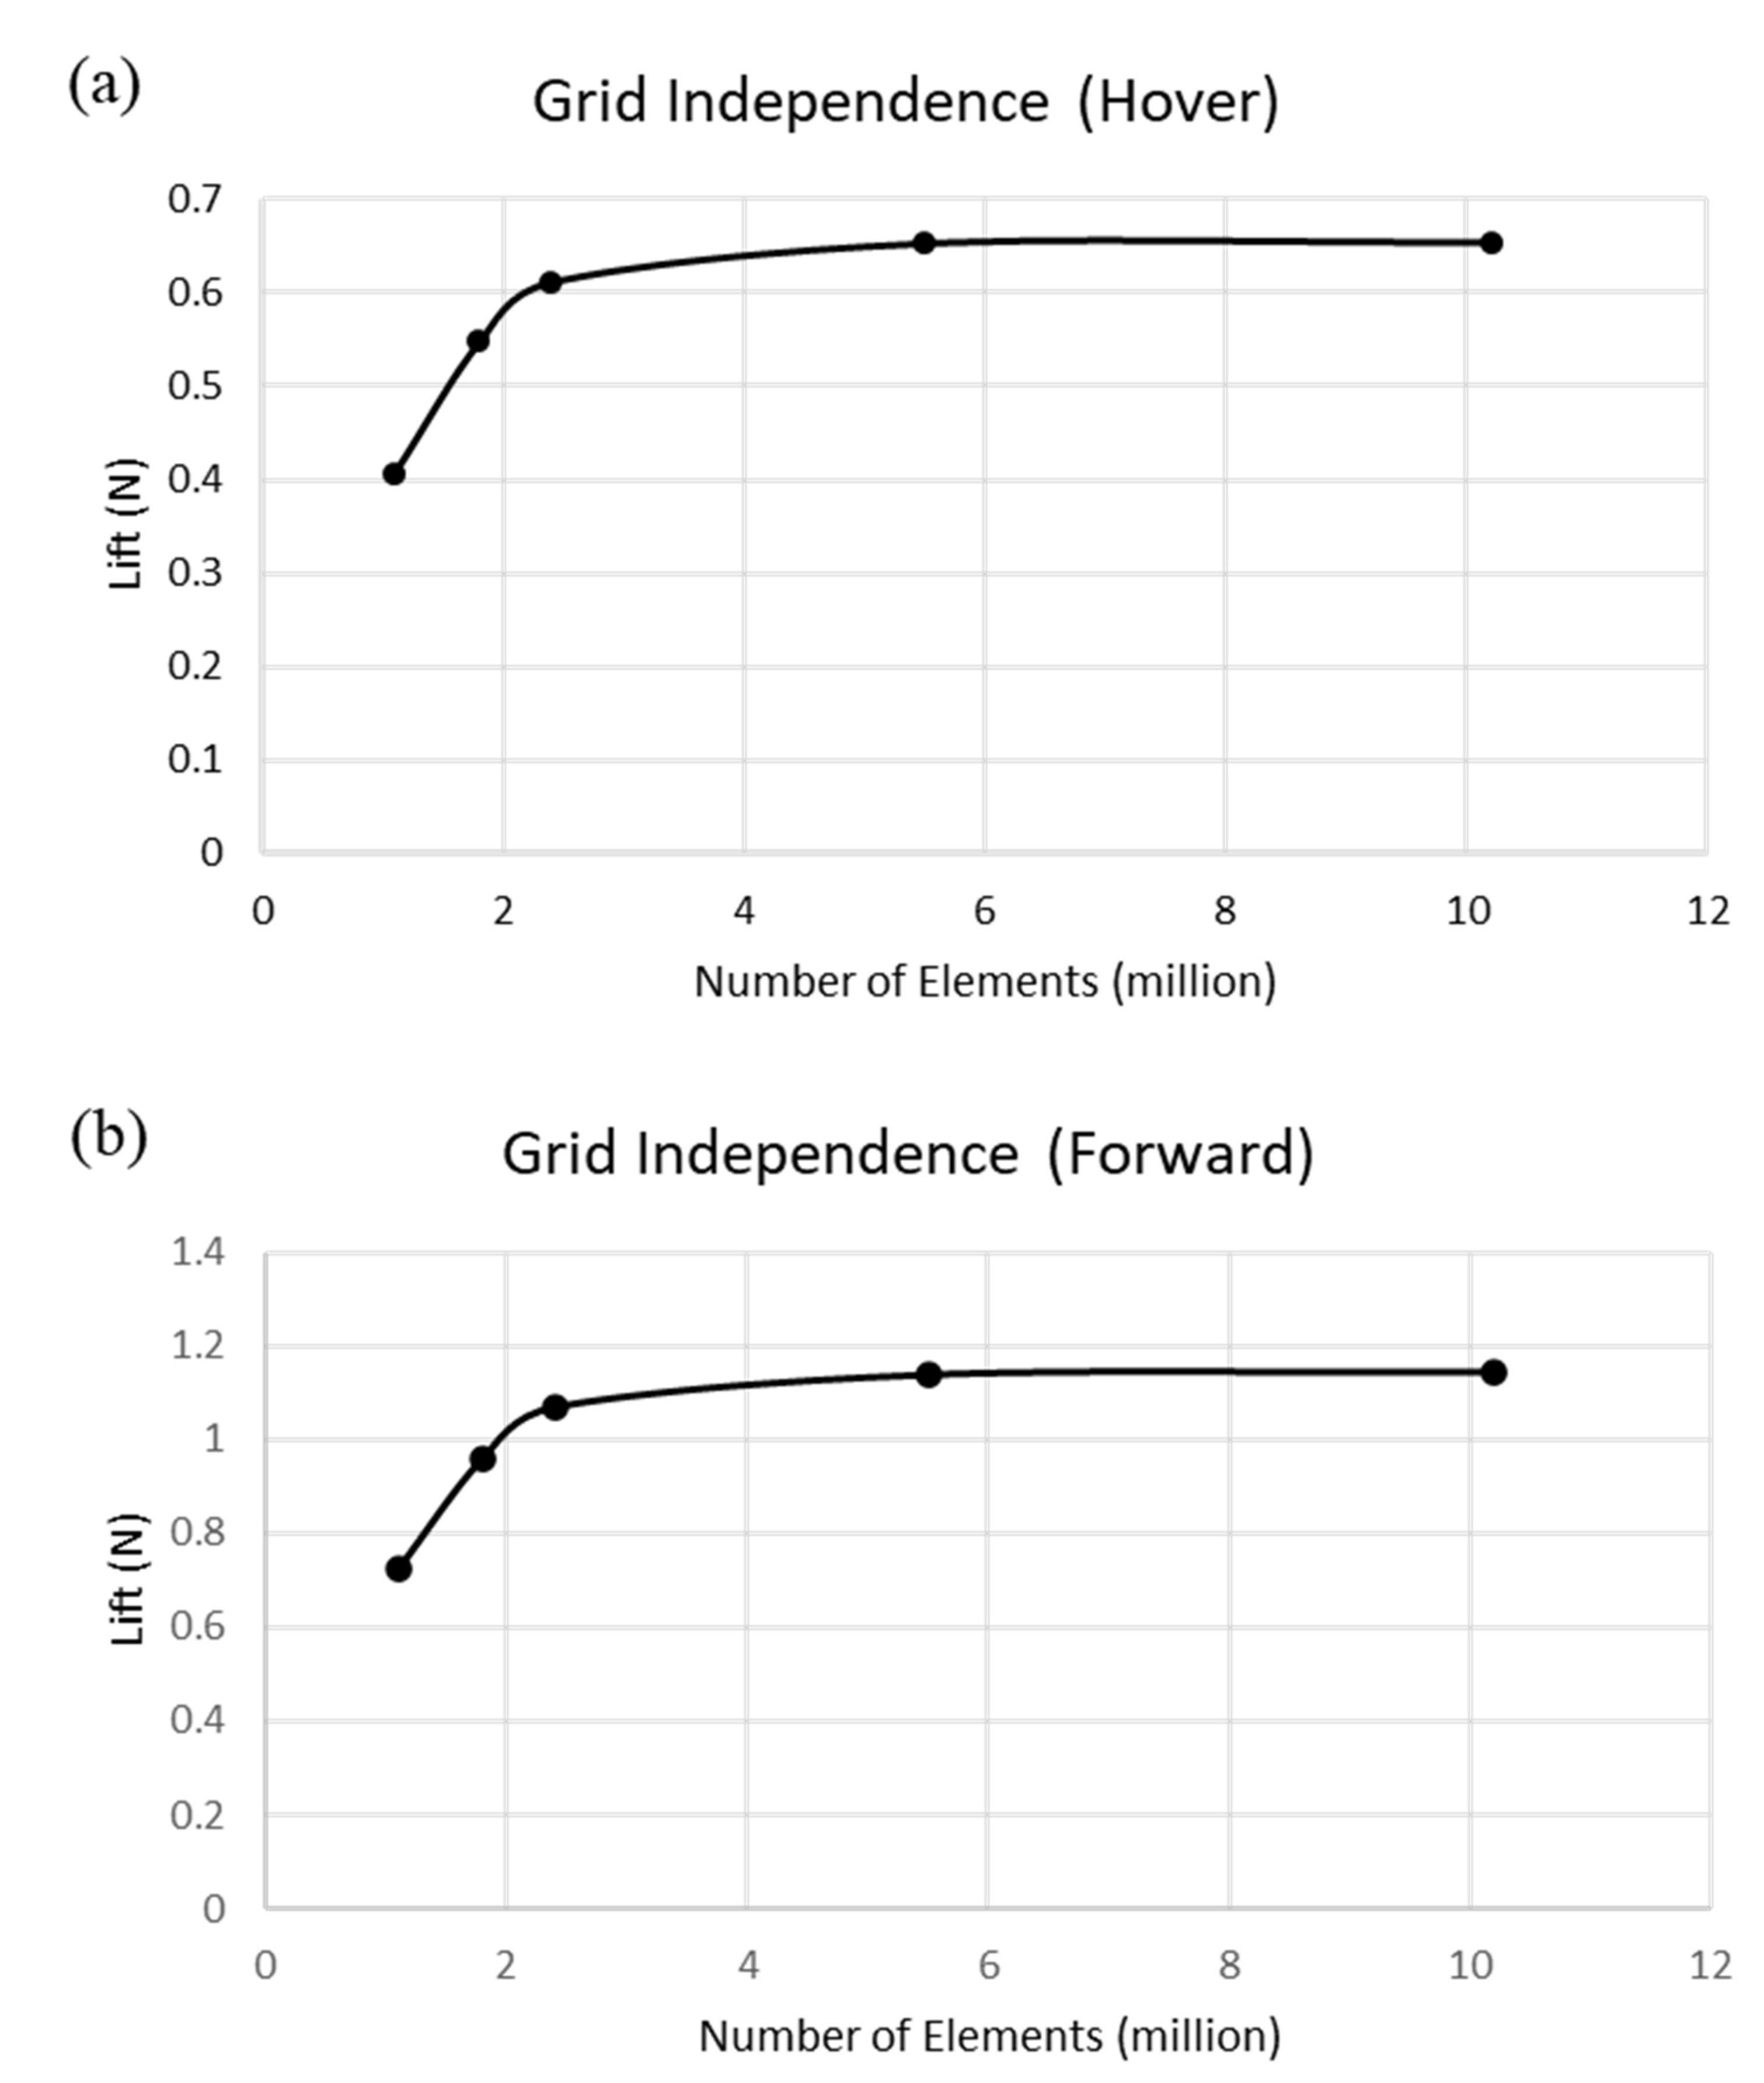
A grid independence test was conducted on 6.8-degree pitch angle and 2000 RPM condition of both hover and forward cases in order to obtain the correct result for verification. Figure 3 confirms the independence of the results based on the mesh number. Approximately 5.5 million meshes were selected for the numerical calculations in this study because their probability of error stands at less than 3% and because they have a much lower running time consumption compared with 10 million meshes.
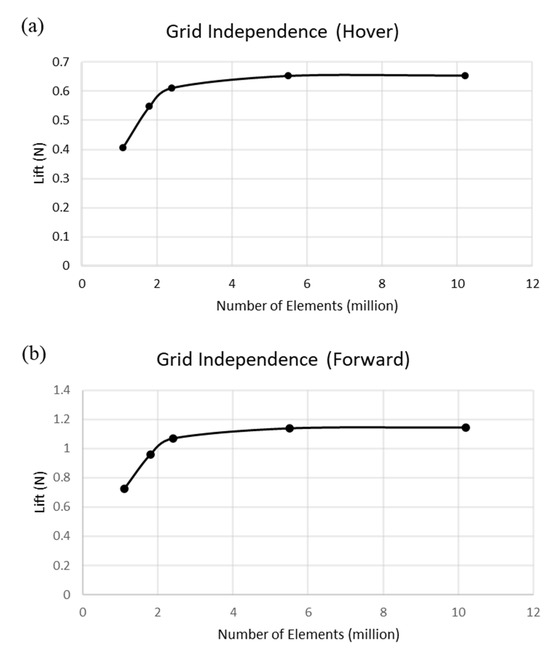
Figure 3.
Grid independence (a) in hover flight conditions and (b) forward flight conditions.
The simulation was conducted using high-performance computing (HPC) with 90 core processing until convergence was achieved. For this purpose, the continuity value had to be less than 1 × 10⁻⁴, and the monitor plot, which was the lift plot, had to repeat its pattern. The forces were averaged over a full revolution to obtain the time-averaged load.
2.2. Experimental Approach
2.2.1. Experimental Model
In this study, an experimental approach was employed to examine the excess power behavior of a helicopter UAV. To this end, a wind tunnel and a small-sized helicopter UAV were used to conduct experiments and collect data on the excess power behavior of the UAV [29,30].
The wind tunnel featured a main test section with dimensions of 0.5 m × 0.5 m and a development length of 0.6 m. The mainstream wind velocity could be adjusted within a range of 0 to 25 m/s, allowing for precise control of the experimental conditions. To measure the velocity distribution deviation of the wind tunnel, a pitot tube was installed in the wind tunnel and calibrated by adjusting the flow rate.
A small-sized helicopter UAV was employed in the experimental investigation, in which we analyzed and characterized its excess power behavior. Table 3 provides the main design parameters of the UAV’s components, including batteries, motor, and generator used in the experiments.

Table 3.
Helicopter’s Main Design Parameter.
2.2.2. Experimental Method
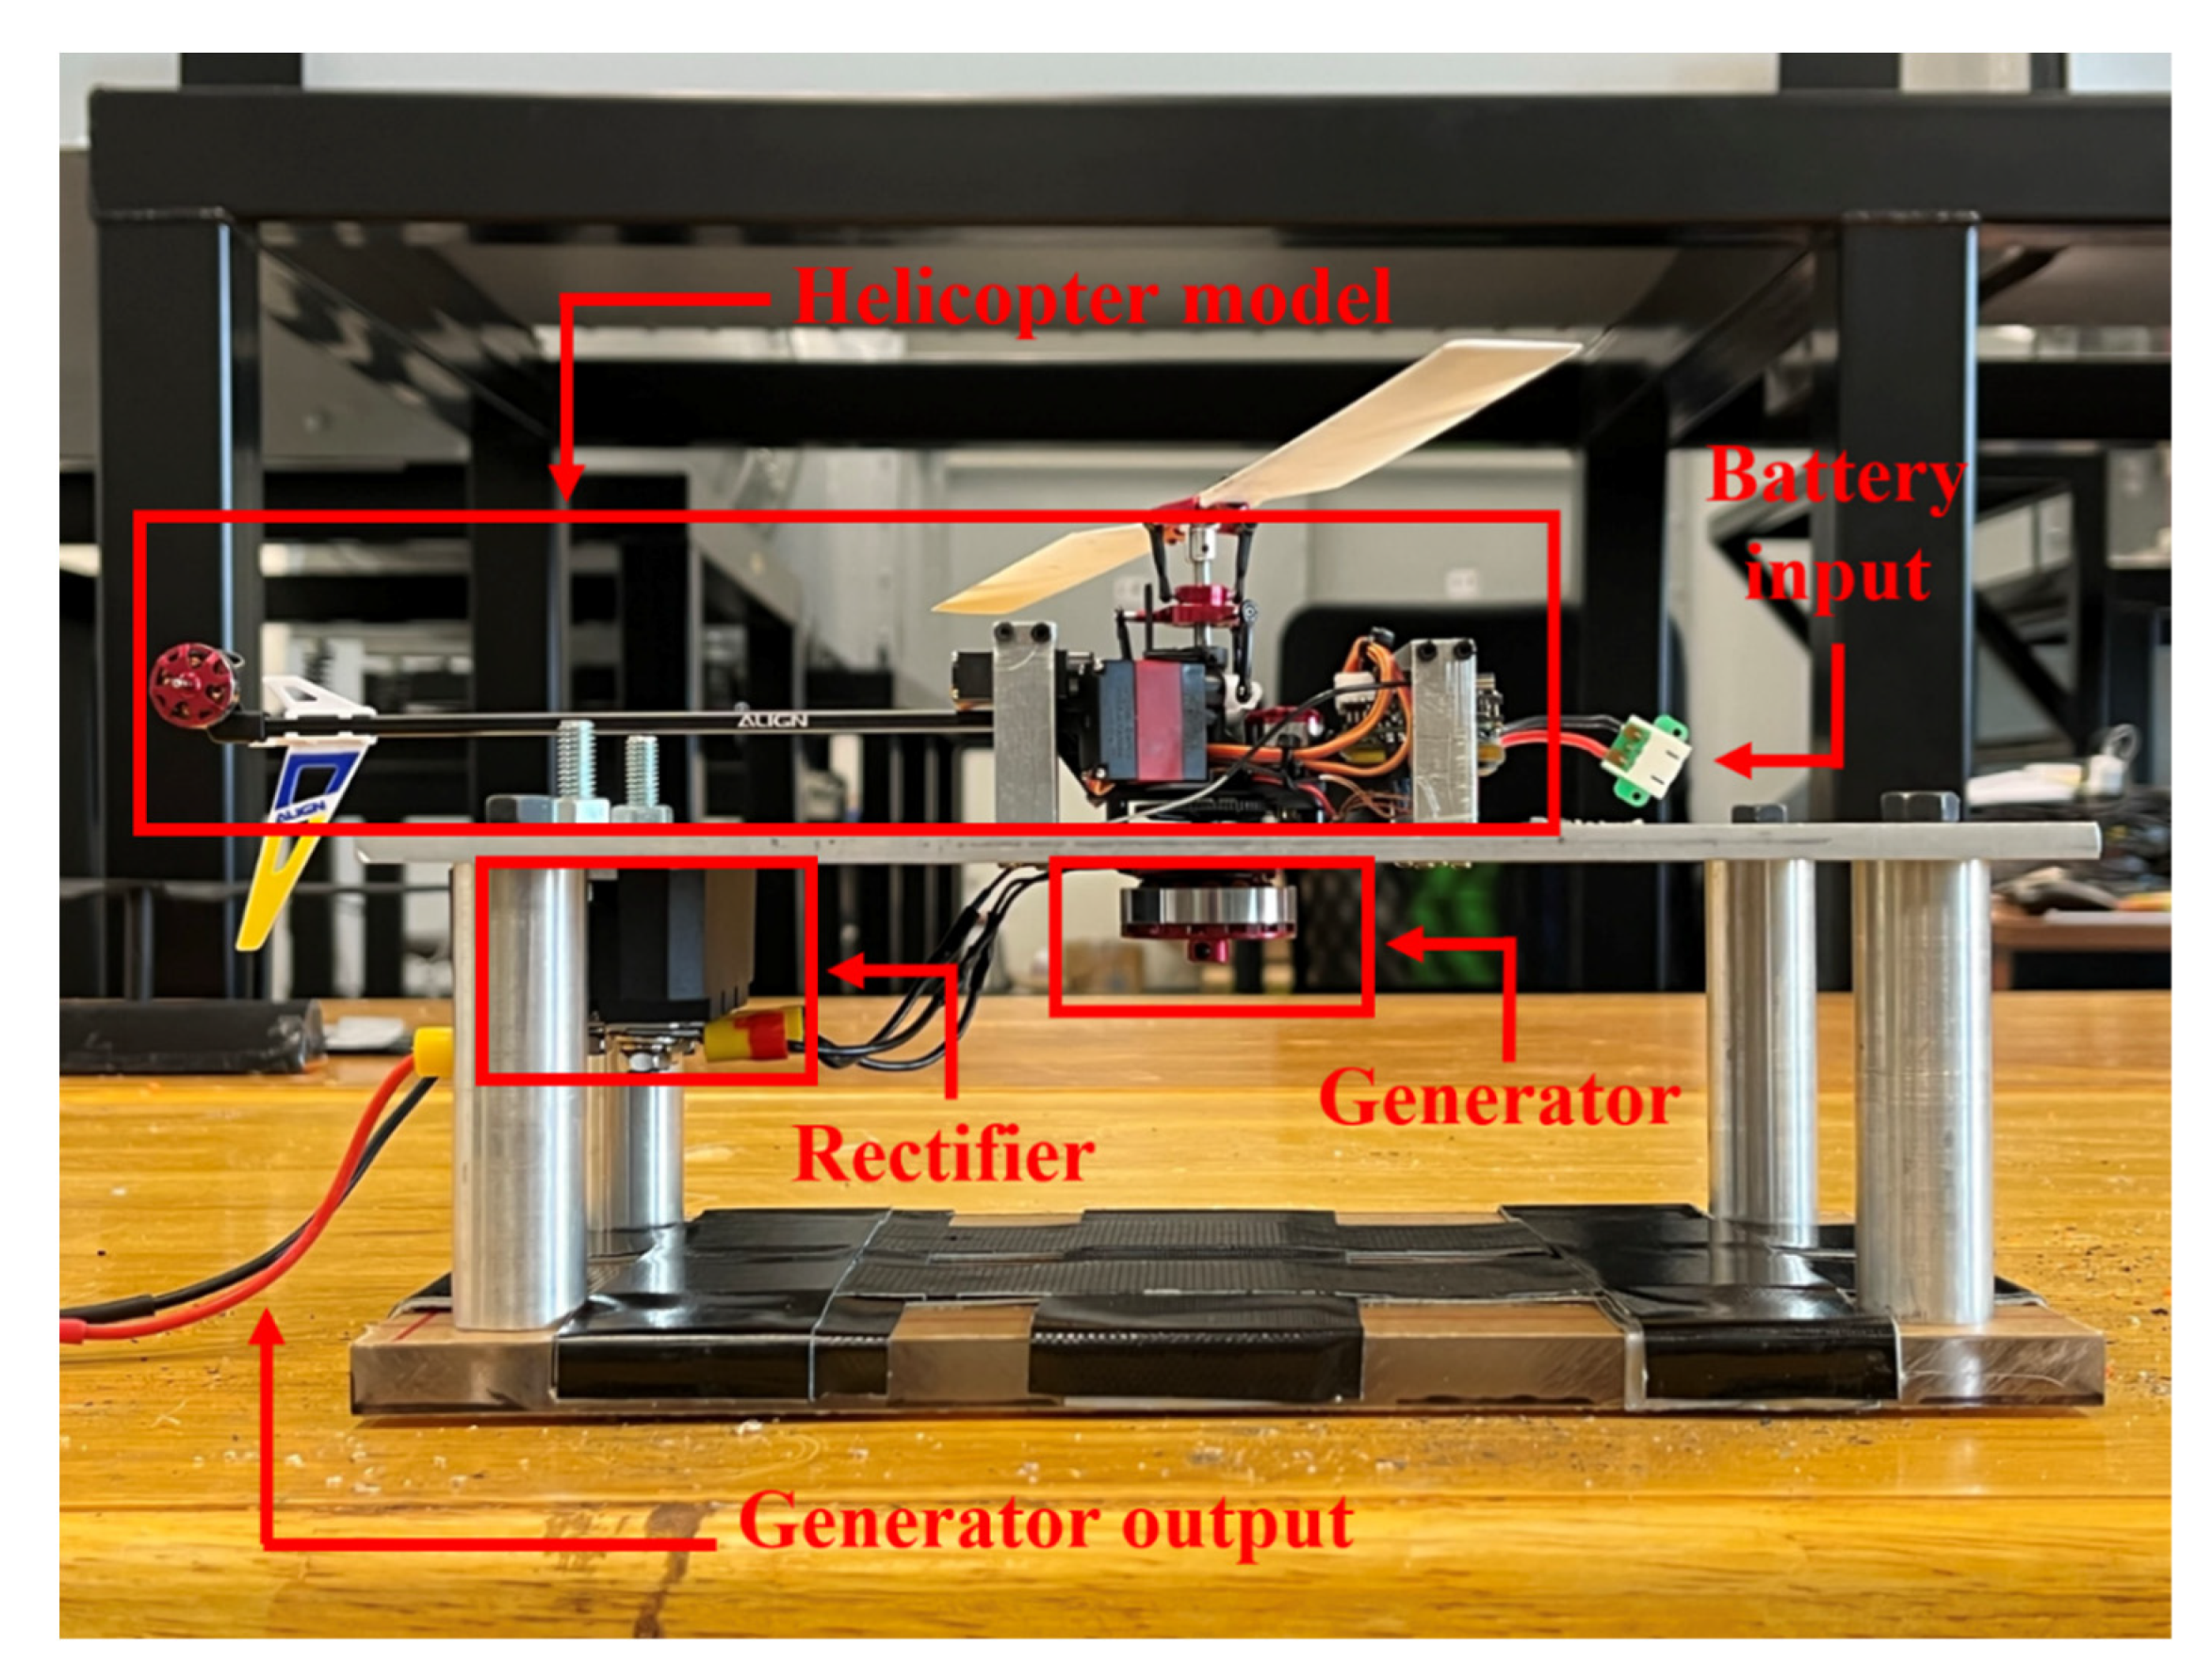
In this study, the experimental investigations were carried out in a closed-loop wind tunnel located in the Faculty of Engineering at Kasetsart University, Bangkok. The ambient conditions during the experiments were 26.5 degrees Celsius and a 102 kPa pressure. The small-sized helicopter UAV was secured to a stand that was connected to a generator. The experimental setup entailed the establishment of a connection between the helicopter within the wind tunnel and the external battery input via an input power wire. Concurrently, an output wire was strategically placed to link the helicopter to the measurement equipment situated outside the wind tunnel. This arrangement ensured that the measuring apparatus did not interfere with the wind flow within the tunnel. Therefore, the electrical parameters, both the input from the battery and the output of the generator, were carefully logged and archived via a data logger, which had a sampling rate of 200 ms and a resolution of two decimal places, for subsequent analysis, as depicted in Figure 4. The reported experimental conditions were repeated three times in order to ensure the reliability and precision of the results. The experimental uncertainties in the measurements primarily resulted from the data logger and clamp meter. The maximum uncertainties of the important parameters are summarized in Table 4.
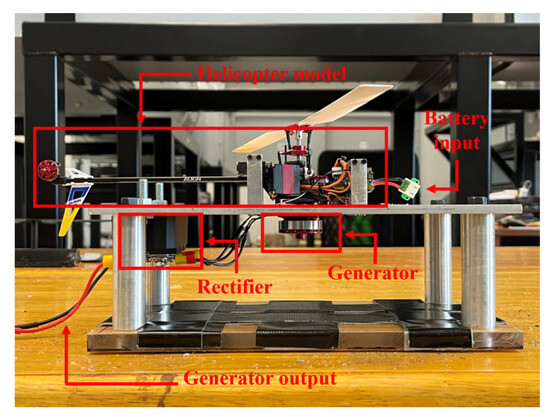
Figure 4.
Helicopter test model (from side view).

Table 4.
Uncertainty.
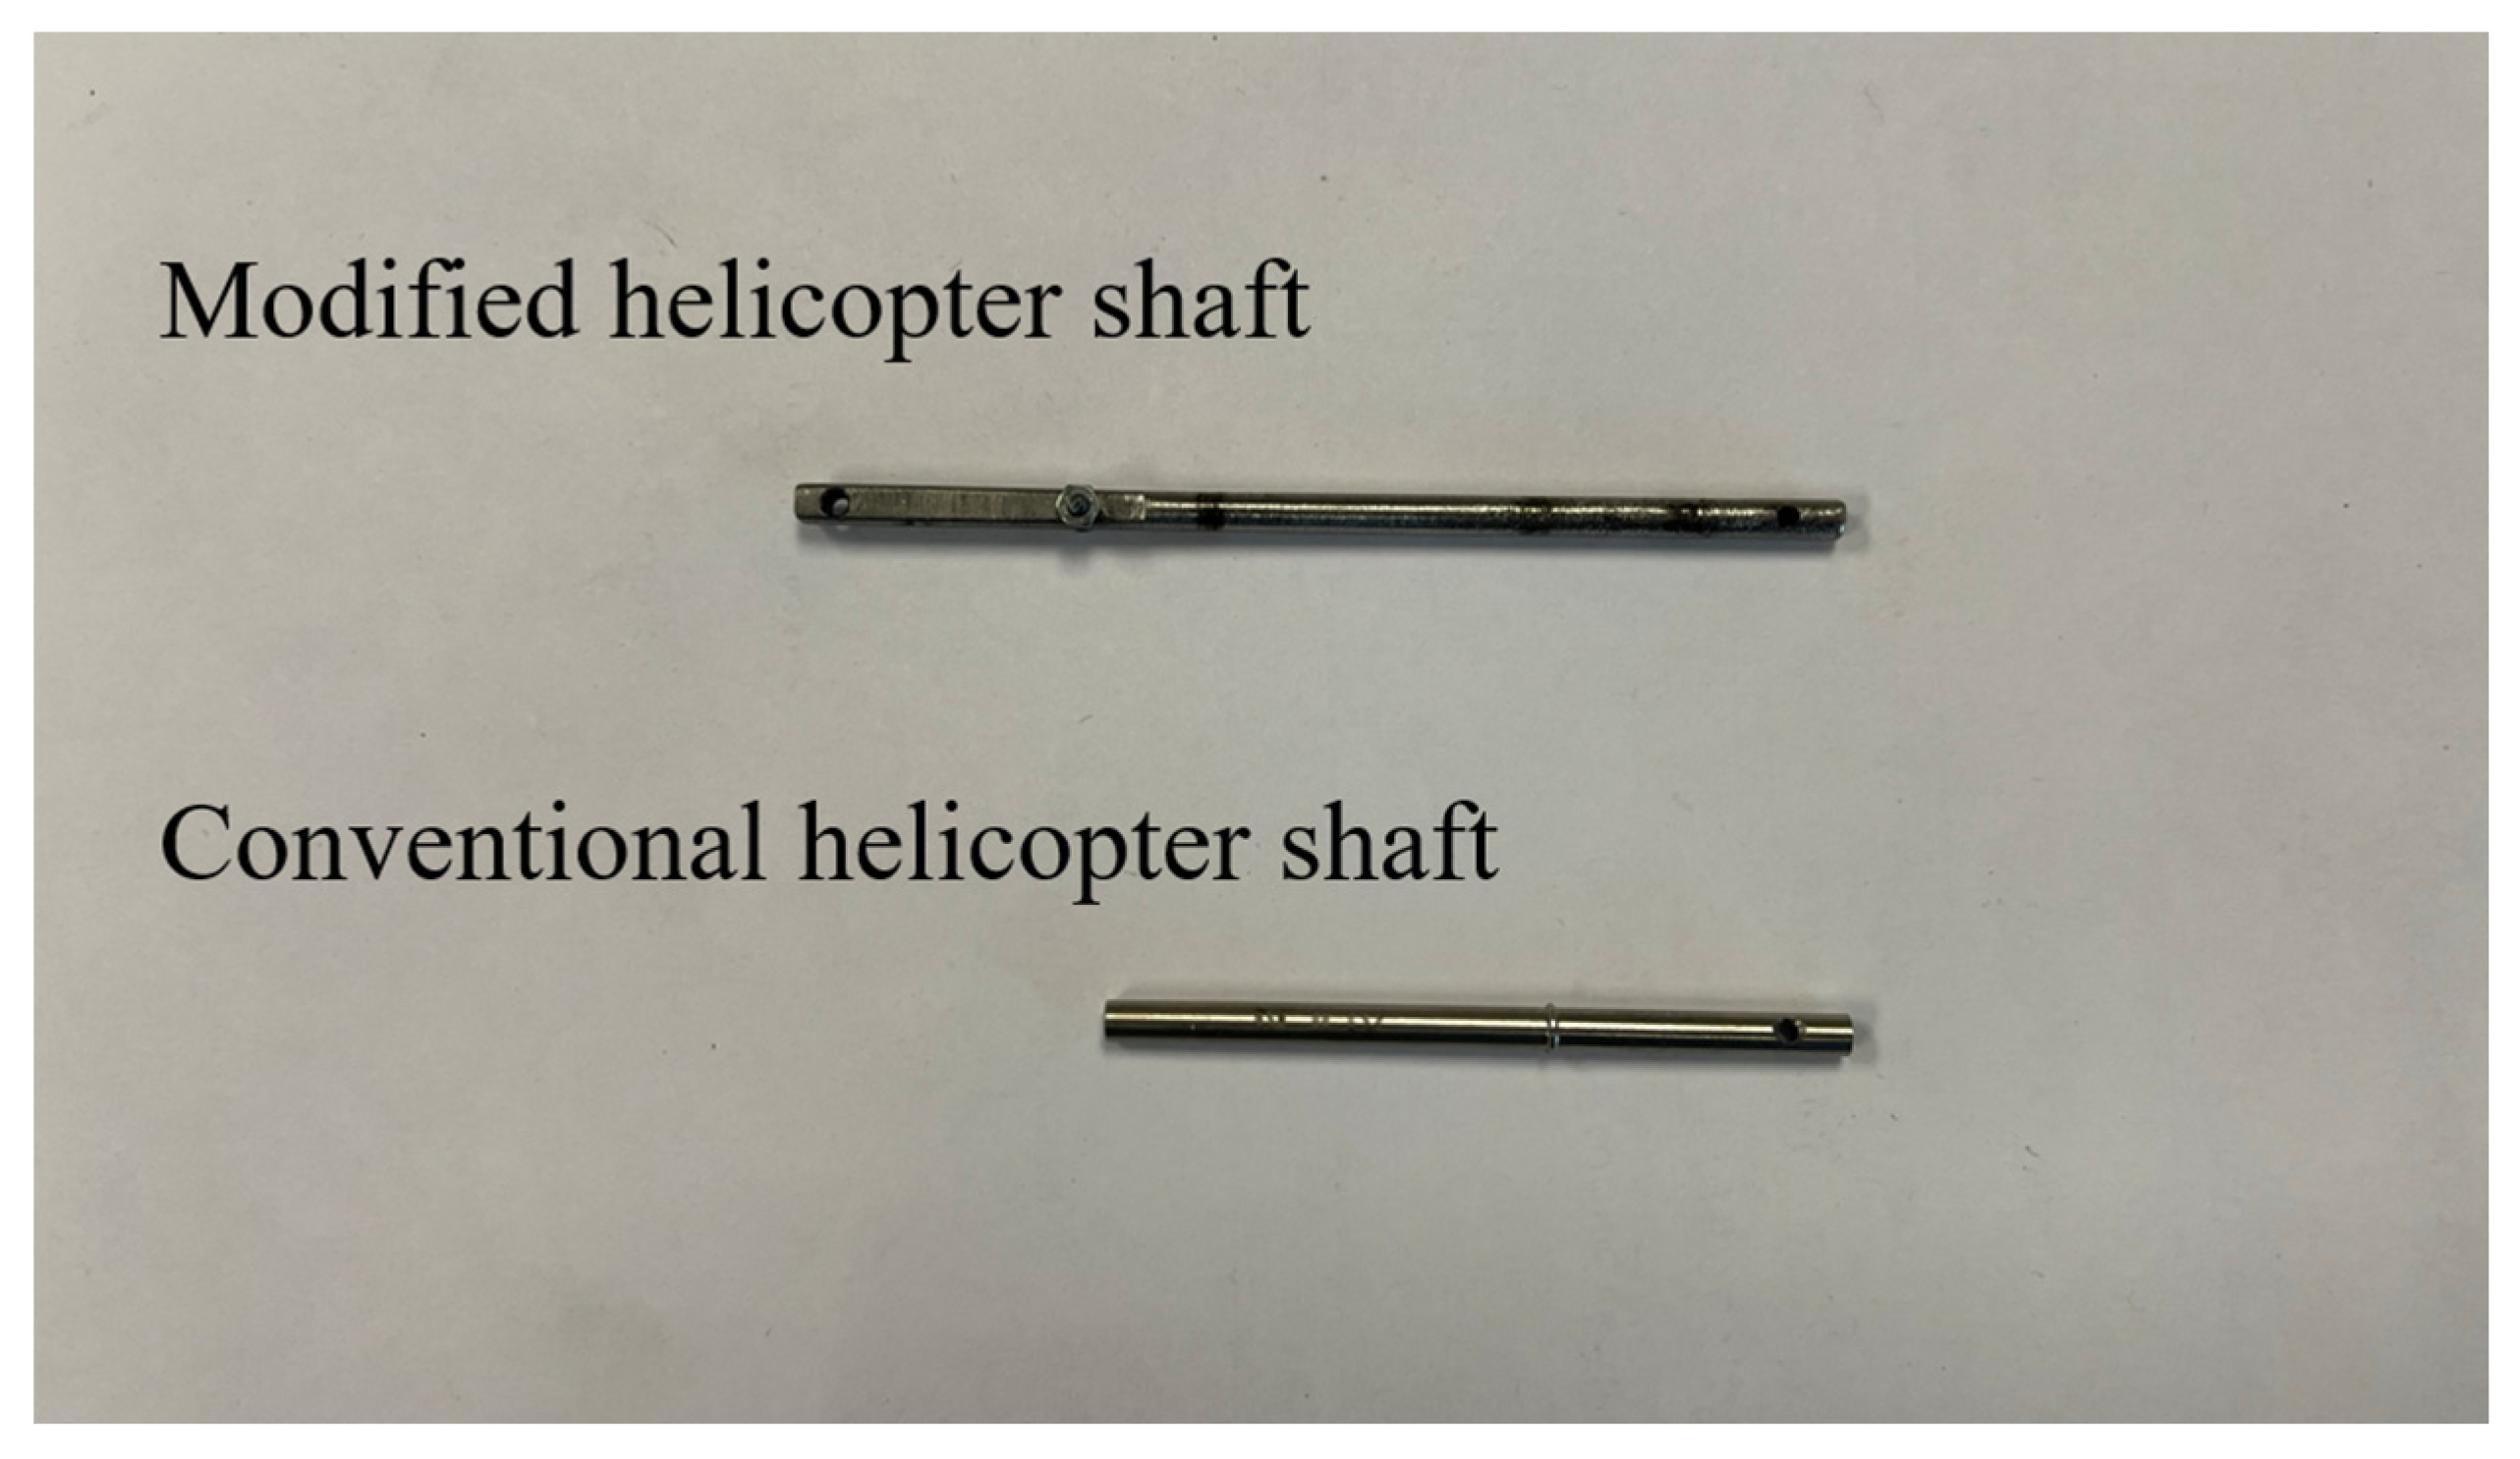
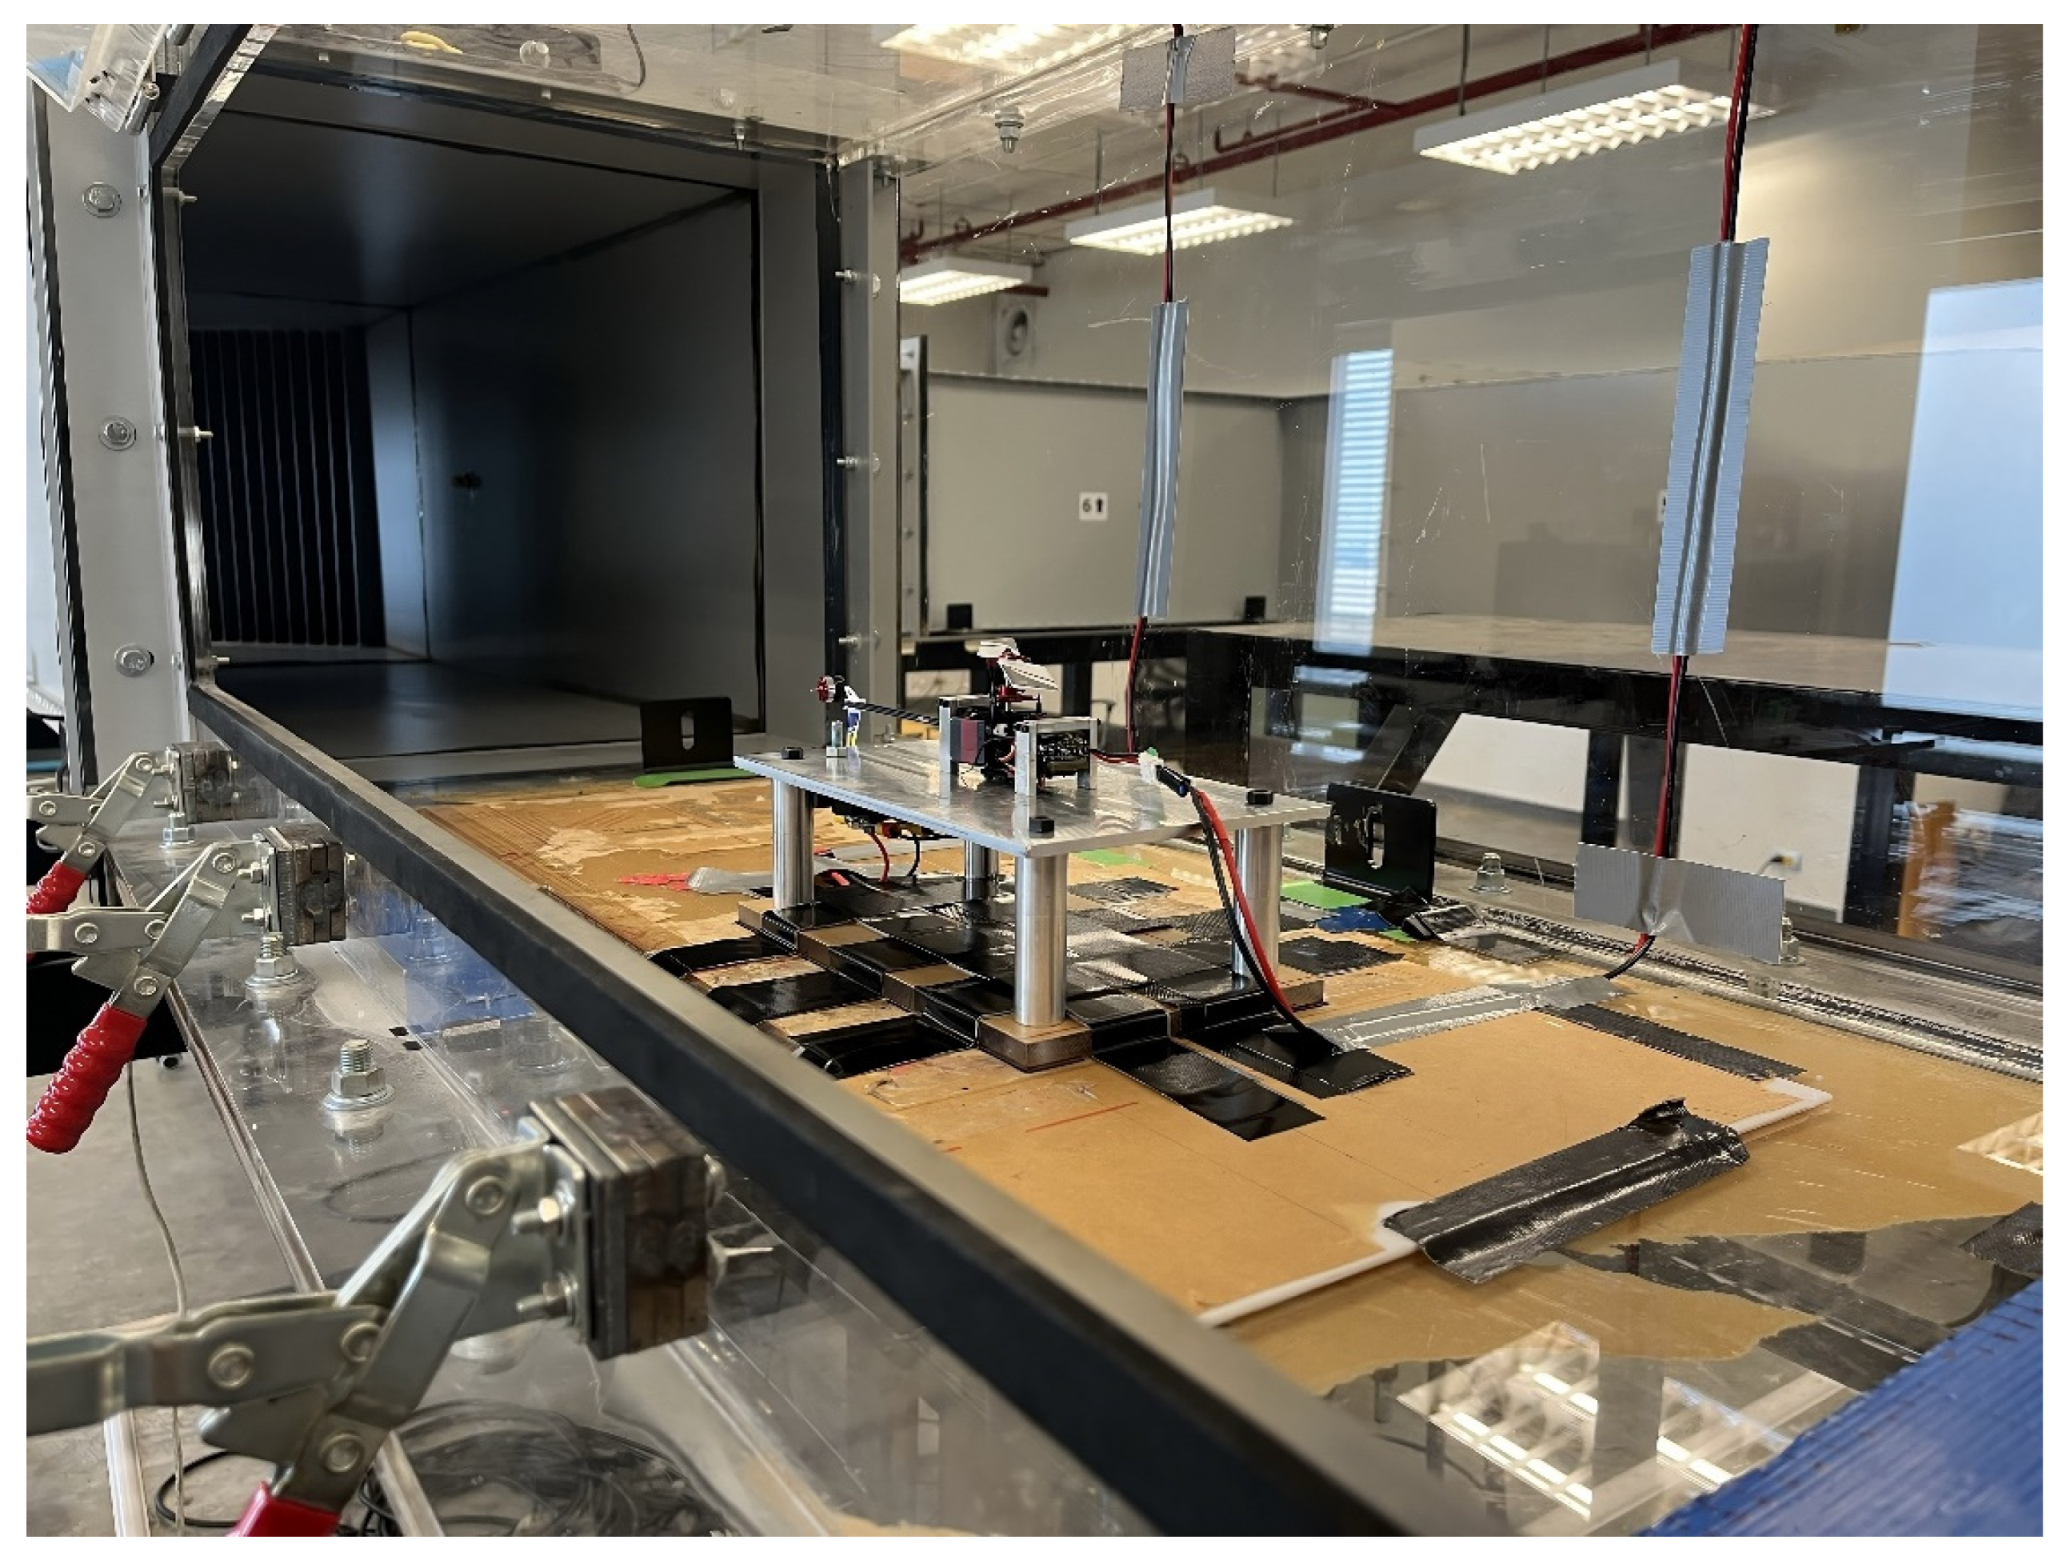
The experiment was conducted in two parts. The first part aimed to verify that the battery power was used exclusively to support the main rotor load and was not diverted to the generator load. This was achieved by comparing the input power and helicopter flight time of two cases: one where the main rotor shaft was connected to the generator and another where it was not. The input power in these two cases had to be equal, and the flight time, determined by the time taken for the battery to deplete, also had to be identical. For the generator case, a modified helicopter main shaft was connected to the generator, which generated electric power from the excess power. The modified main shaft is illustrated in Figure 5. To accomplish this, three main rotor angular velocities of 2000, 3000, and 4000 rpm were used in variation, along with three pitch angle values of 6.8, 10.3, and 13.3 degrees. The input current and voltage from the battery were measured, and the flight time was determined, as shown in Figure 6.
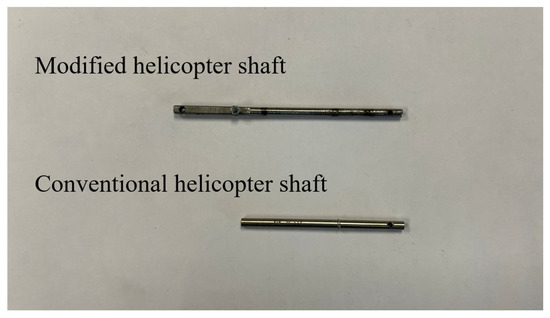
Figure 5.
Modified and conventional helicopter shaft.
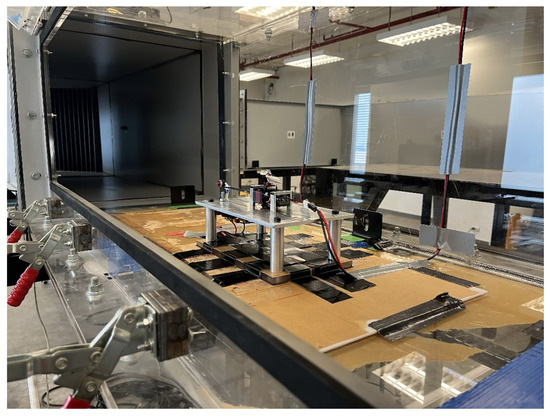
Figure 6.
Experimental setup in the wind tunnel.
The latter part of the experiment aimed to analyze and determine the excess power behavior of the helicopter UAV under two different flight conditions: hover and forward flight. Specifically, for the forward flight condition, an inlet velocity of 10 m/s was set in the wind tunnel. The experiment involved varying six main rotor angular velocities, which were 2000, 4000, 8000, 12,000, 16,000, and 20,000 rpm, and three pitch angles, which were 6.8, 10.3, and 13.3 degrees, for both the hover and forward flight conditions. The input and output currents and voltages of the battery were measured, as shown in Figure 7. These measurements could be used to calculate the electrical power using Equation (6). The excess power was then calculated based on the electrical power output from the generator [31]:
where P indicates the electrical power, I is the electric current, and V indicates the electrical voltage. As for additional experimental setup please refer to the videos in the Supplementary Materials.
P = I·V

Figure 7.
Experimental diagram.
3. Validation of the Numerical Approach and Experimental Approach
The results of CFD simulations were compared with the experimental data obtained from the wind tunnel experiment. The experimental validation of this study was conducted using a small-sized helicopter Unmanned Aerial Vehicle (UAV) equipped with a rotor identical to the model used in CFD simulations. The UAV was attached to a test stand fitted with a beam-type load cell to measure the lift force. Subsequently, the lift force data were collected and visualized using an Arduino board that interfaced directly with the load cell. Serving as a robust and precise instrument for data acquisition and visualization, the board relayed the information to a visual screen for analysis. The entire experimental setup was subjected to calibration with standard weights to maintain and ensure the accuracy of the force measurements.
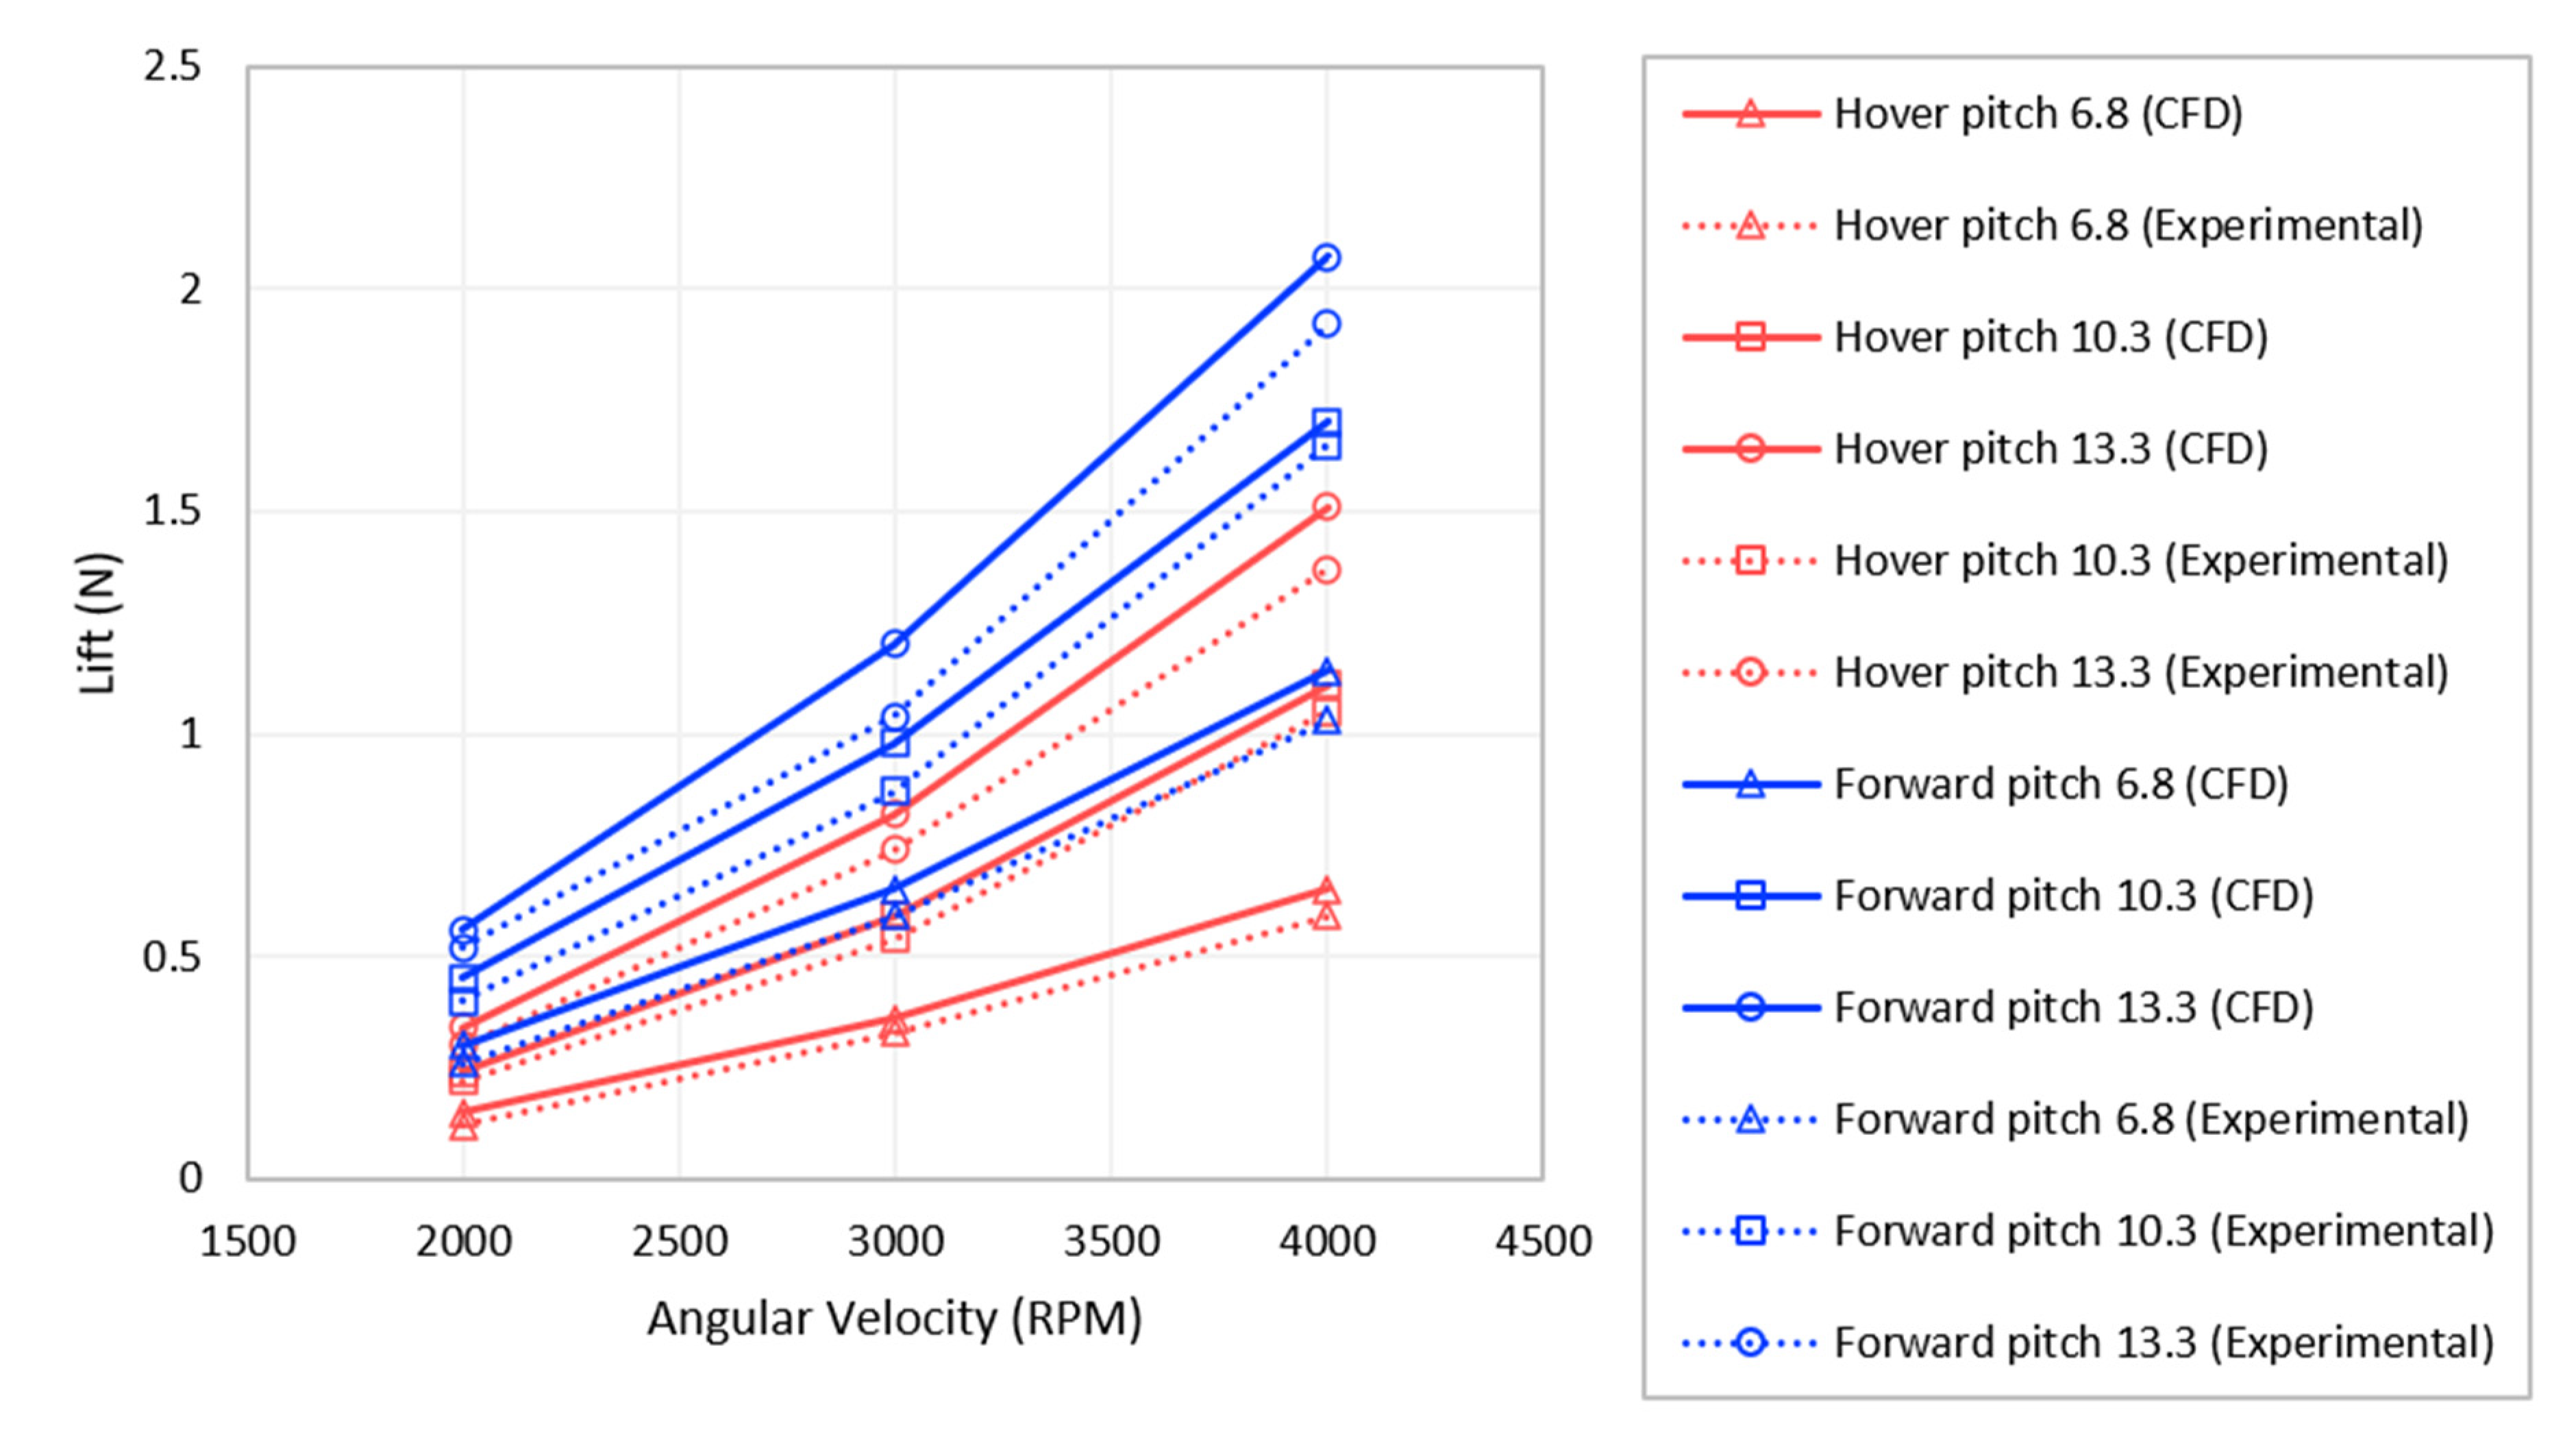
The comparison was focused solely on the lift force. Figure 8 illustrates the comparison between the experimental and CFD results. The analysis showed that the CFD results slightly overestimated the experimental data obtained from the wind tunnel, with an average error of 10%. However, based on the criteria recommended in [32], it was deemed that the validation of the CFD modeling study was acceptable.
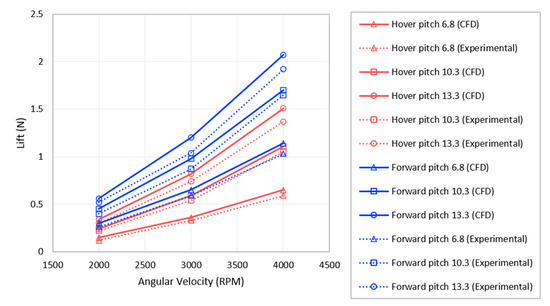
Figure 8.
Validation of numerical approach and experimental approach.
4. Results and Discussion
4.1. Numerical Approach
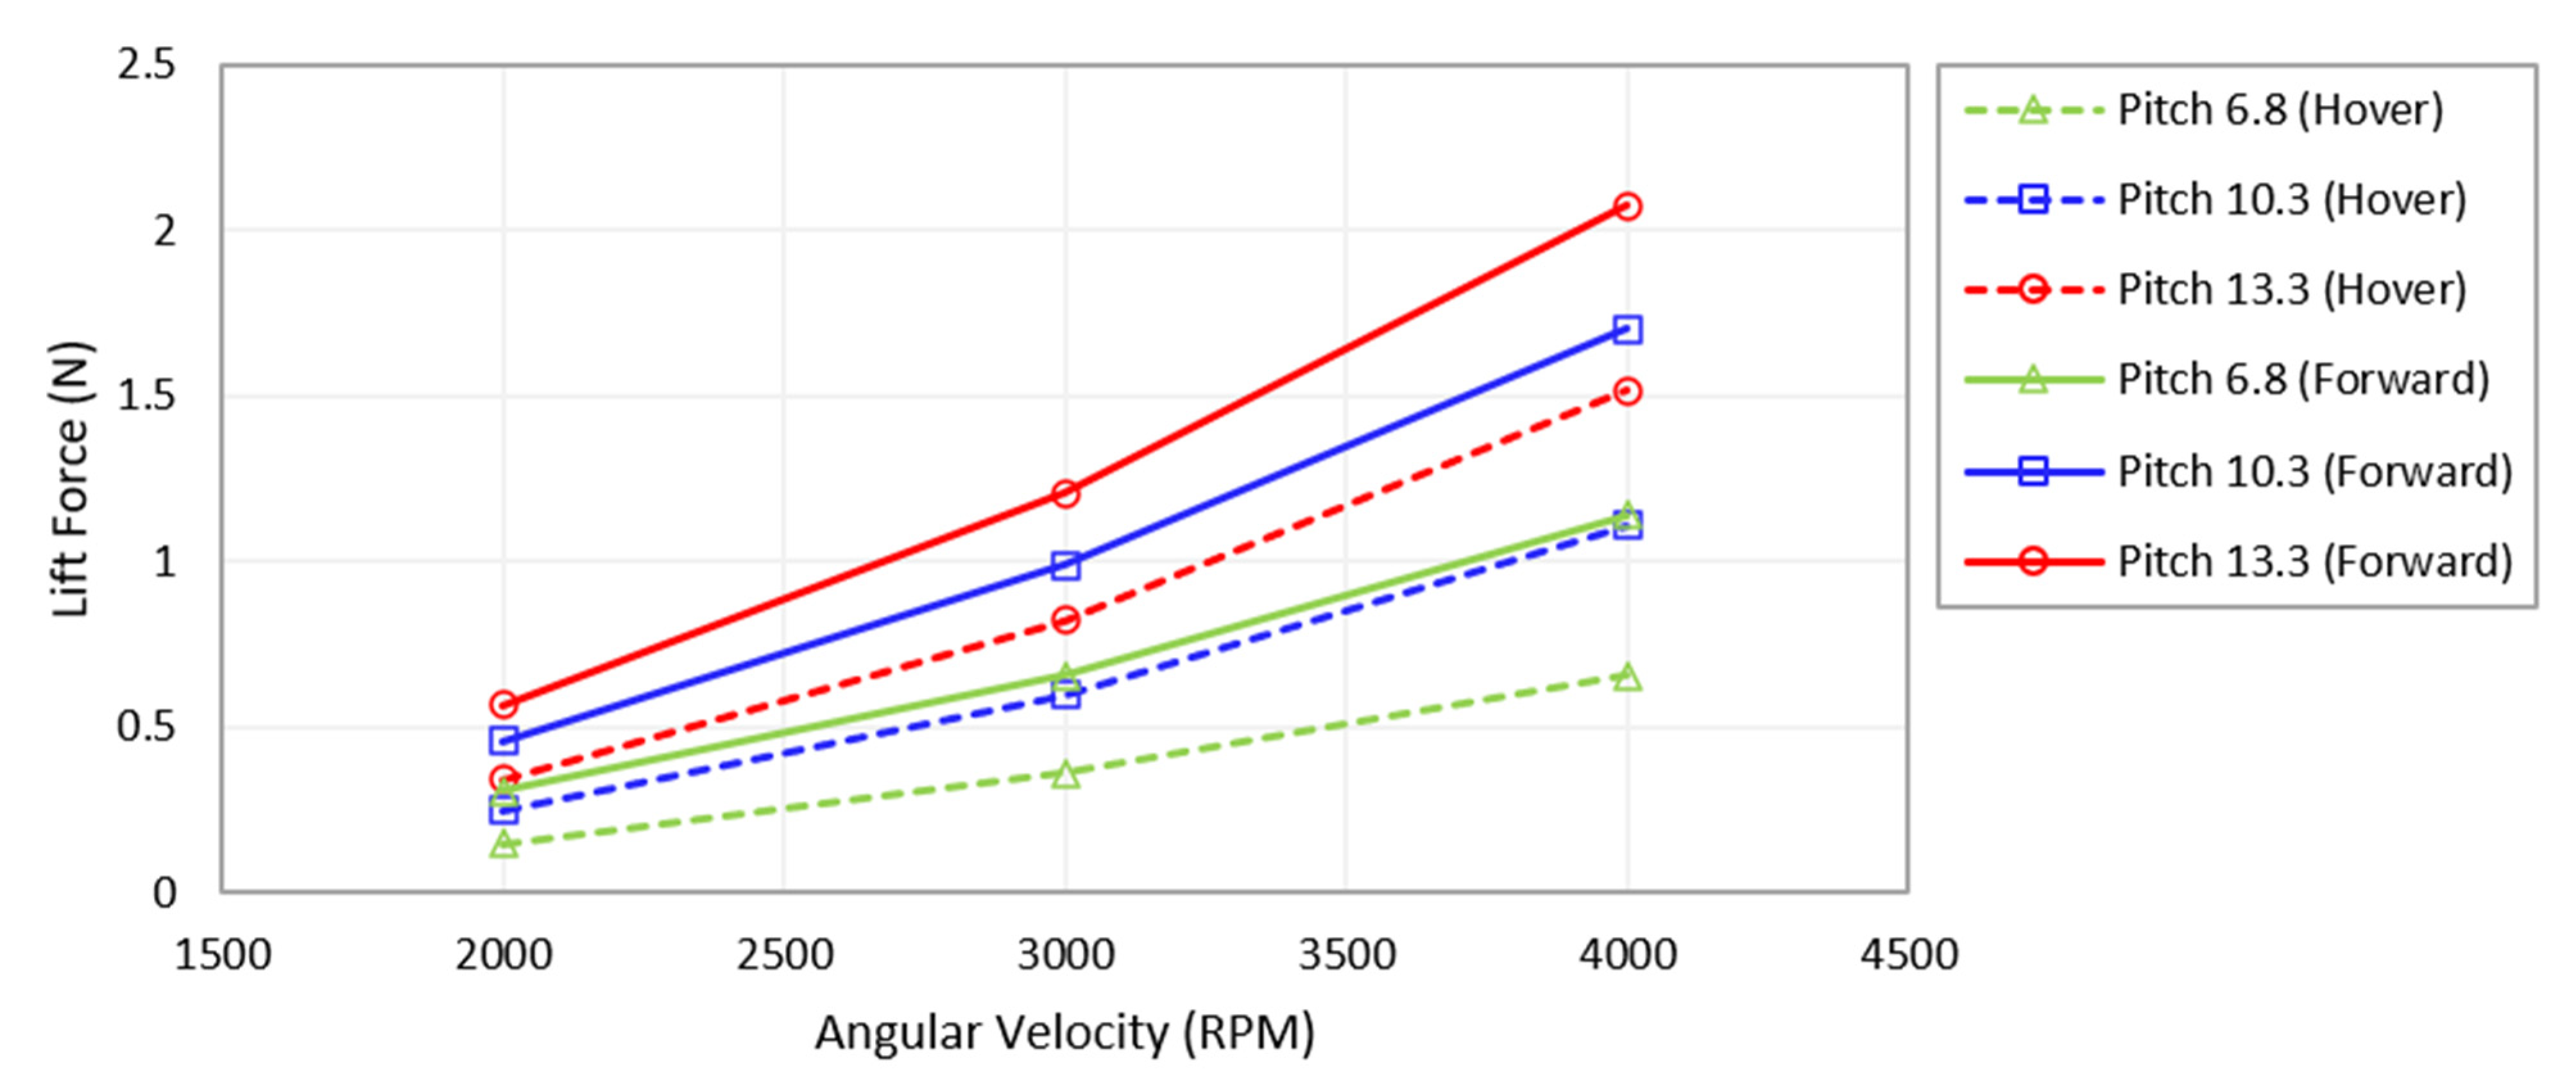
Figure 9 displays a comparison between the lift force of the hover flight and forward flight of the helicopter UAV at the different angular velocities of 2000, 3000 and 4000 rpm. The numerical approach employed in this study validates that forward flight conditions create a scenario where the lift force appreciably surpasses that in hover cases by an average of 39.9%. This can be explained by the aerodynamic principles of helicopter flight. As the helicopter commences forward motion, the lift-generating mechanism transitions from being predominantly vertically oriented to incorporating a significant horizontal component. In this state, the main rotor behaves like an airfoil. An airfoil, by design, generates lift through the creation of a pressure differential between its upper and lower surfaces, with a higher pressure underneath and a lower pressure on top. As the helicopter advances, the air flowing over the rotor blades creates this necessary pressure differential, similar to the action on an airfoil. This further amplifies the overall lift during forward flight [33]. In a conventional approach, the additional lift generated by the forward motion needs to be counterbalanced to maintain equilibrium and controlled flight. This is achieved by utilizing the helicopter’s cyclic control system. The cyclic control allows pilots to adjust the pitch angle of individual rotor blades throughout their rotation cycle. In response to the increased lift during forward flight, the pilot can use the cyclic control to decrease the blade pitch when the rotor is advancing, thus reducing the lift generated. Conversely, the pitch can be increased when the rotor is retreating, boosting the lift on that side. These continuous adjustments help to maintain an even distribution of lift across the rotor disk, thereby preserving the balance and stability of the helicopter [34].
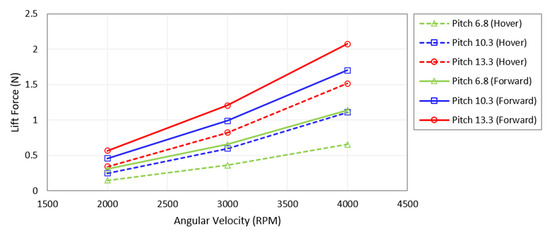
Figure 9.
Comparison of lift force between hover case and forward case.
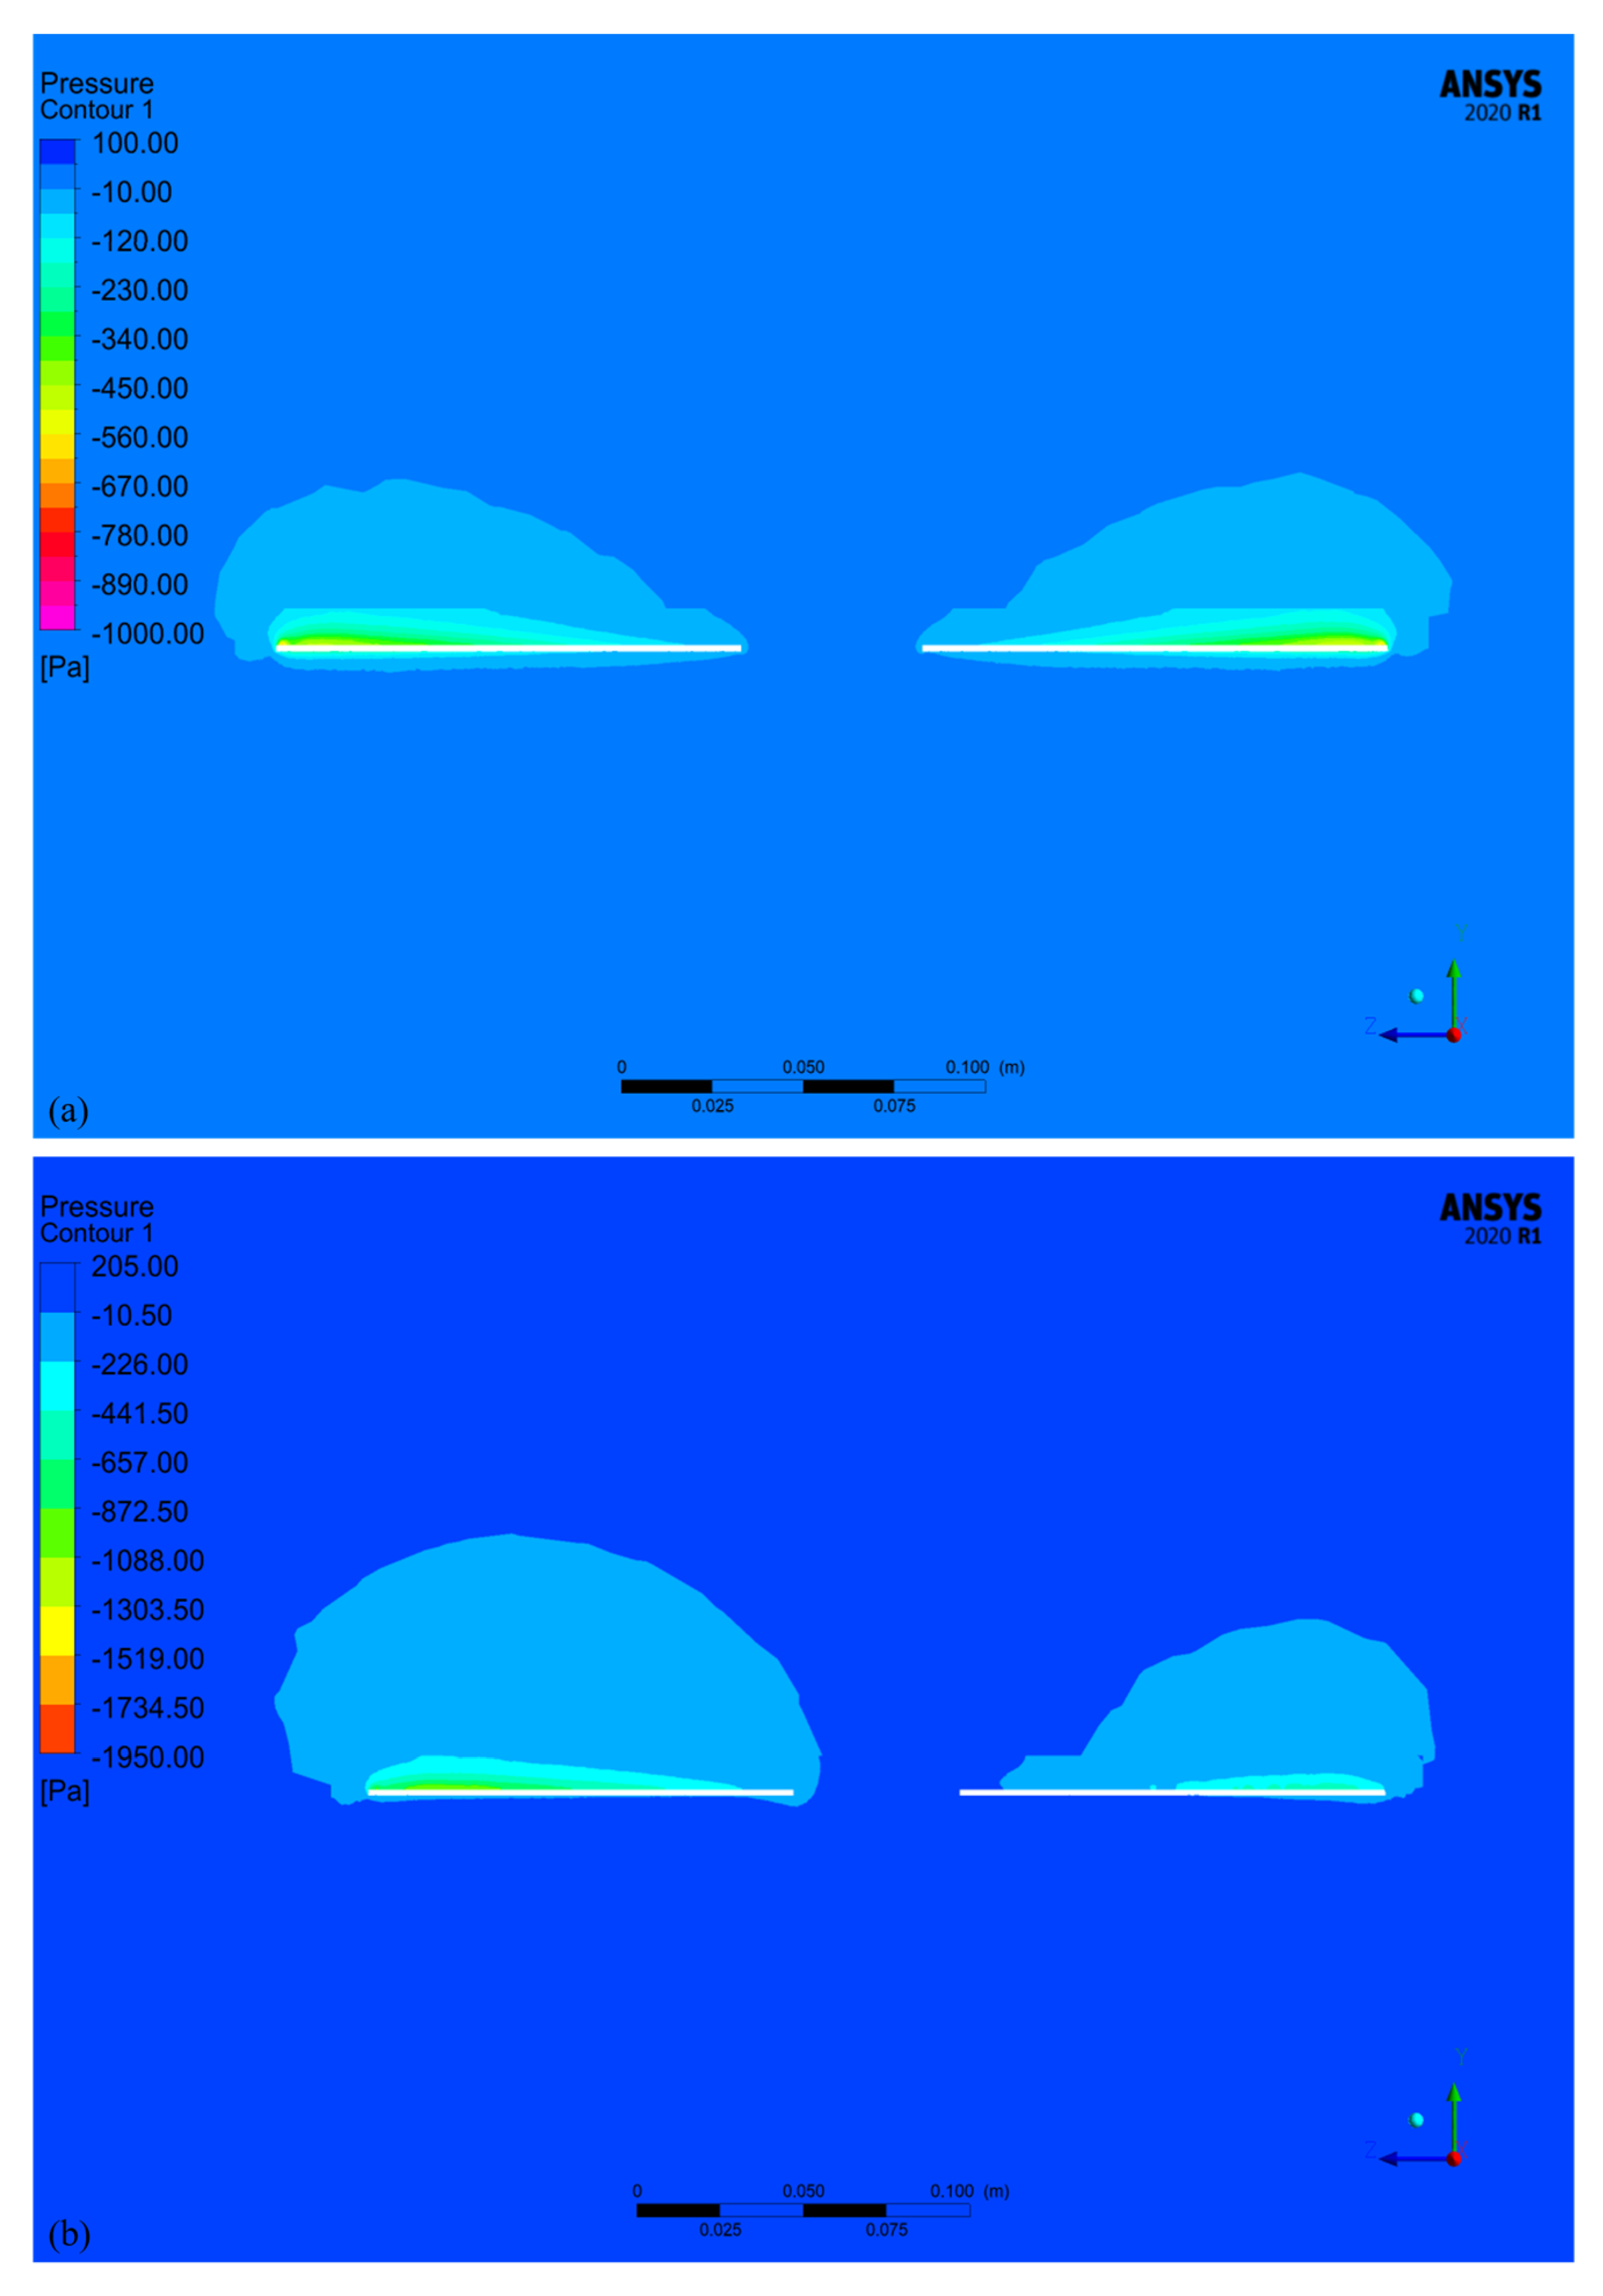
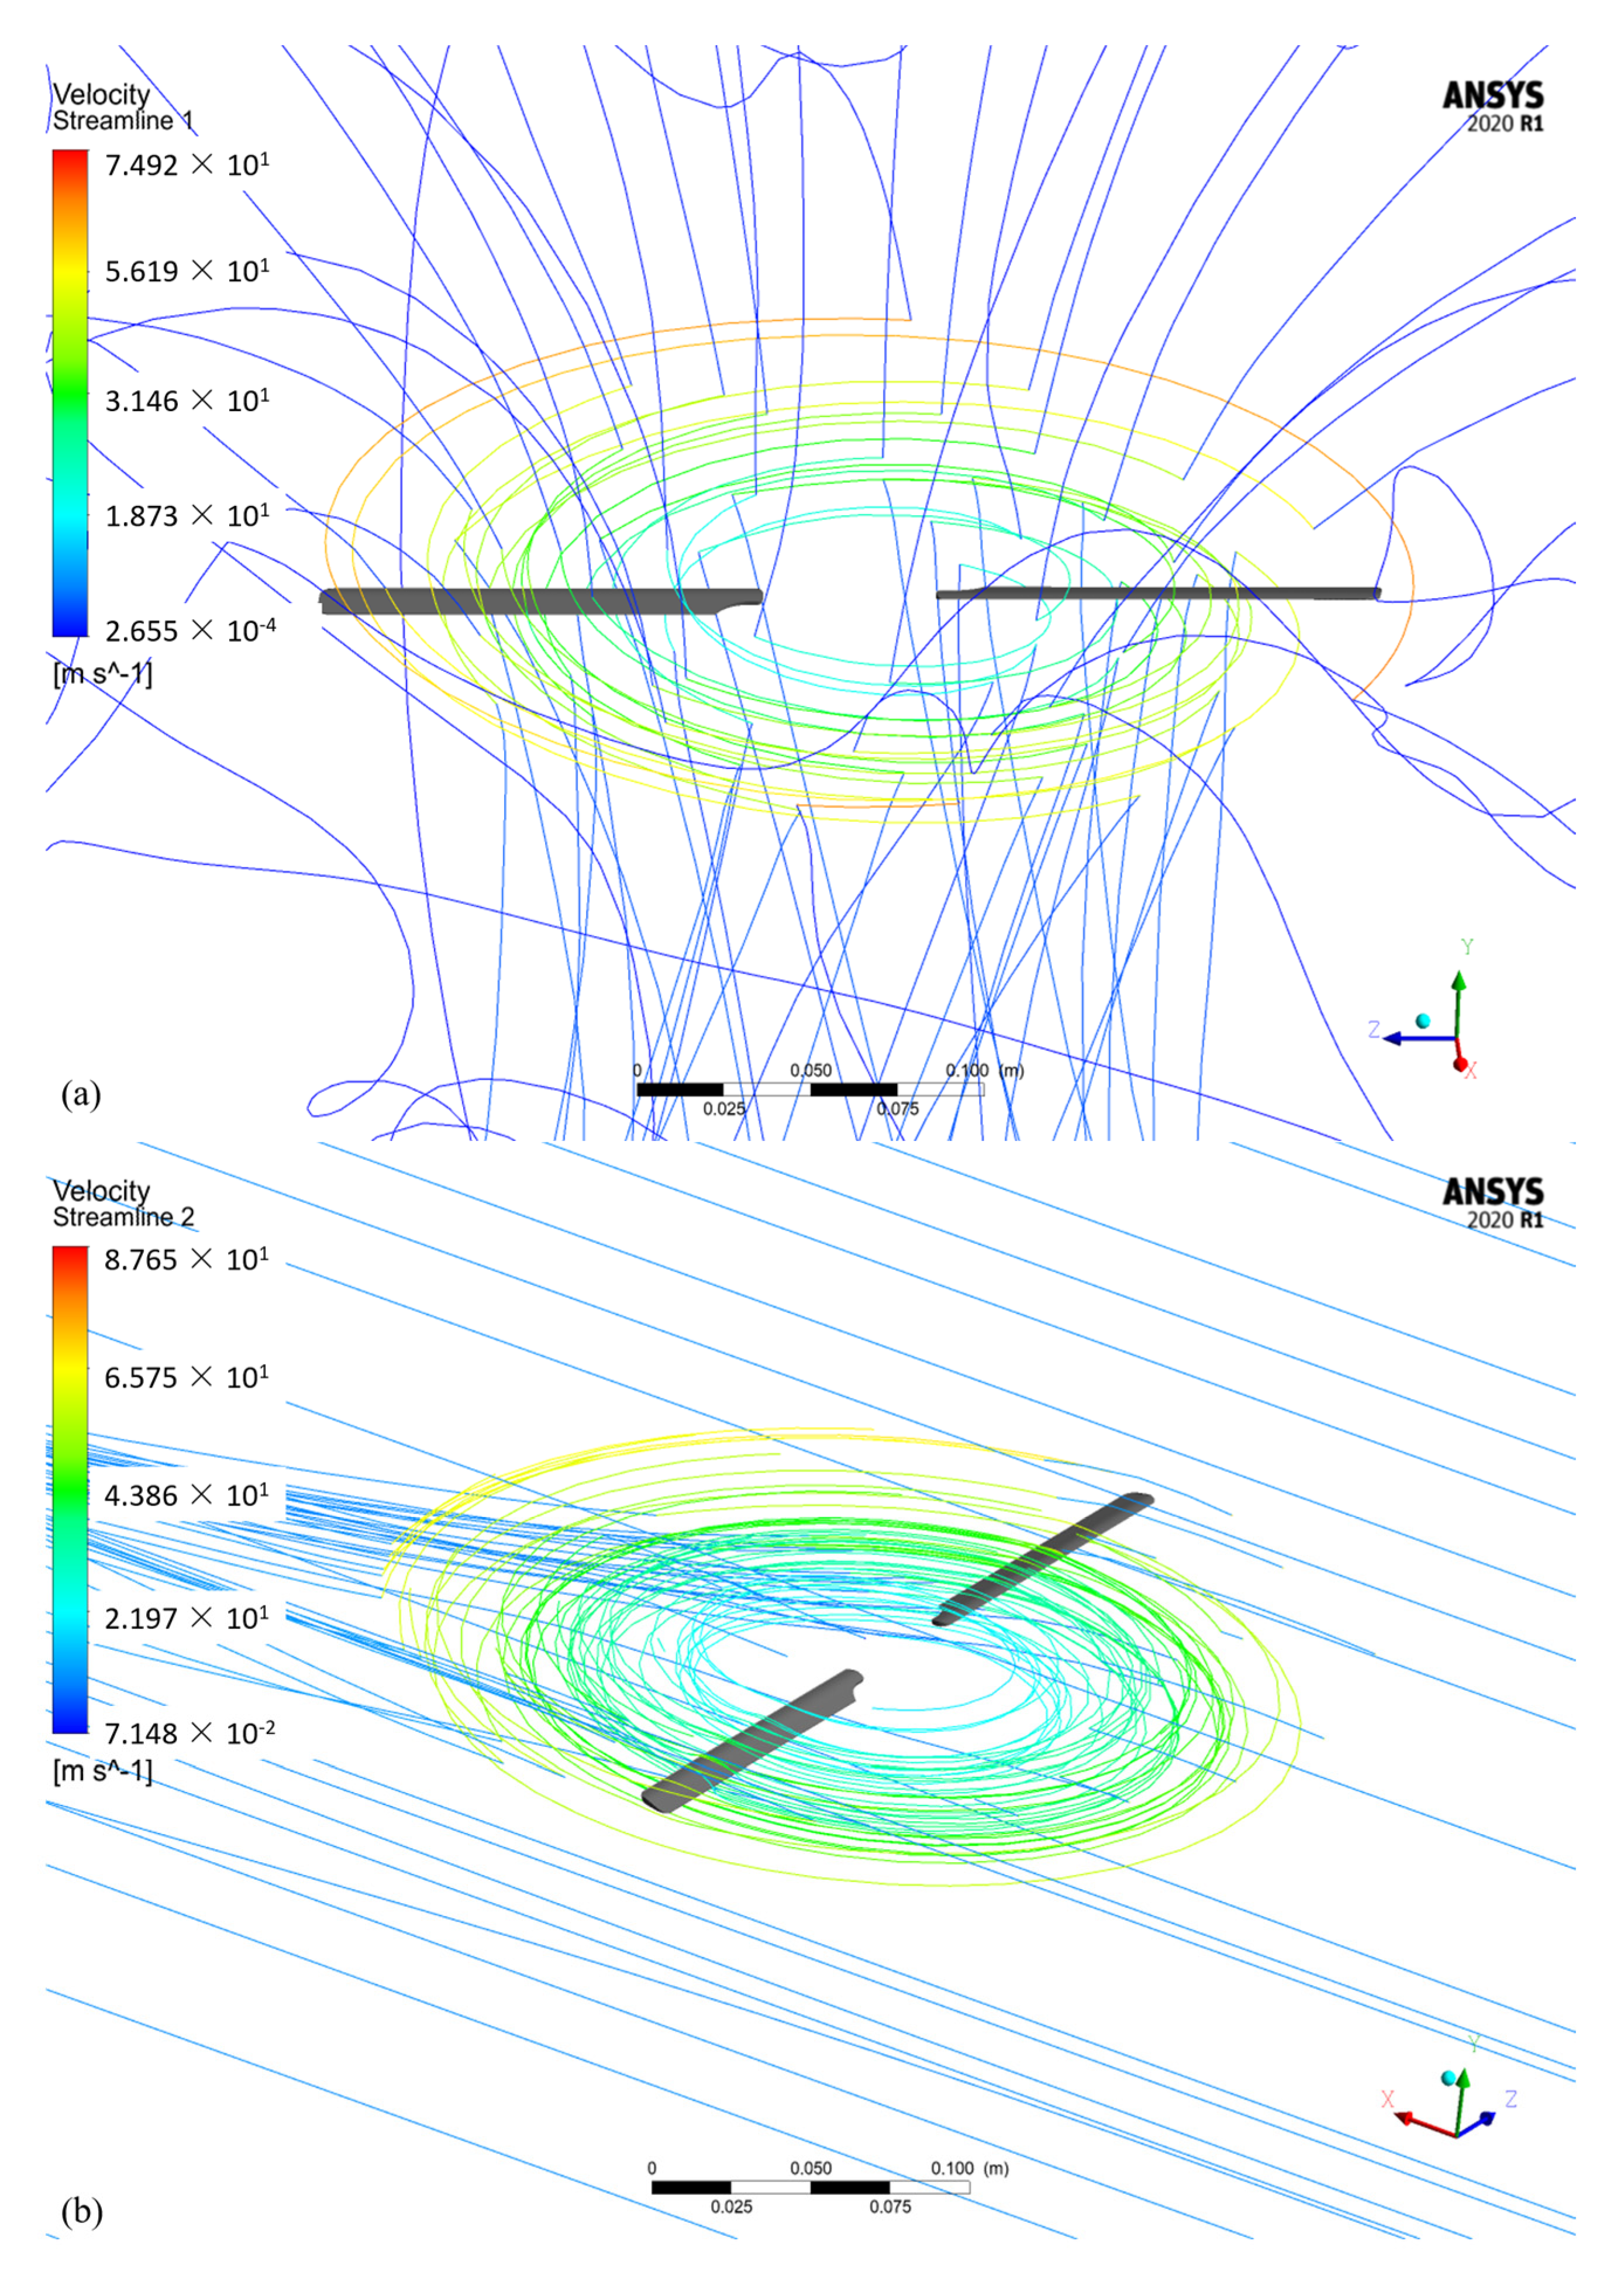
Figure 10a,b present the pressure contours for the hover flight and forward flight cases, respectively. The comparison between these two figures reveals a more substantial pressure gradient in the forward flight case. This difference causes an increased lift force during forward flight at the same rotor parameter settings, which can be rationalized using Bernoulli’s principle [35]. Furthermore, Figure 10b indicates that the left-side blade is subjected to higher pressure than the right-side blade. This variation is due to the contrasting wind encounters; the left side, being the advancing side, works against the wind direction, while the right side, as the retreating side, follows the wind direction, as evidenced by the streamline representation in Figure 11. According to aerodynamic principles, the advancing blade side, which counters the wind, will exhibit a greater pressure disparity than the retreating blade side. This discrepancy causes a directional roll movement in the helicopter, necessitating the presence of a gyro to maintain equilibrium.
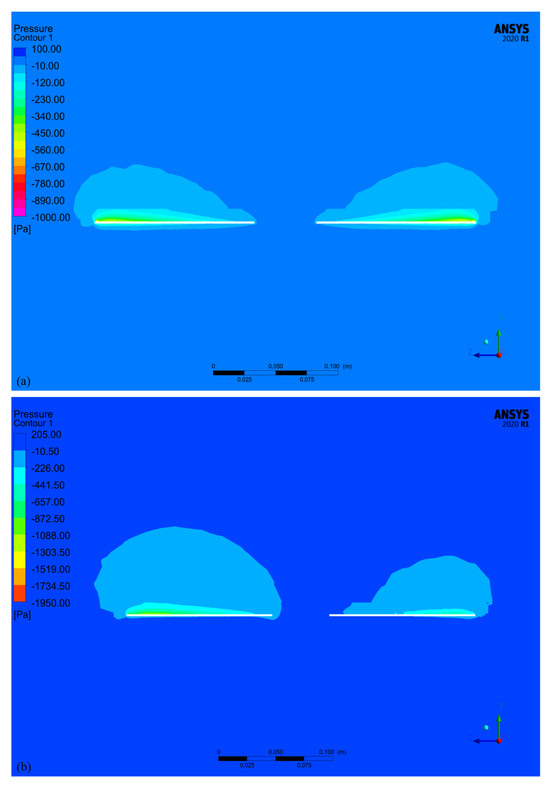
Figure 10.
Pressure contour in (a) hover flight conditions and (b) forward flight conditions.
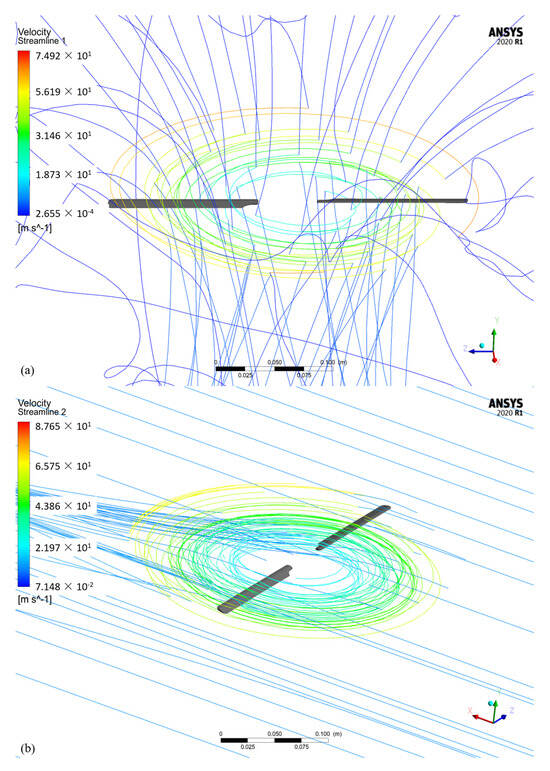
Figure 11.
Streamline in (a) hover flight conditions and (b) forward flight conditions.
4.2. Experimental Approach
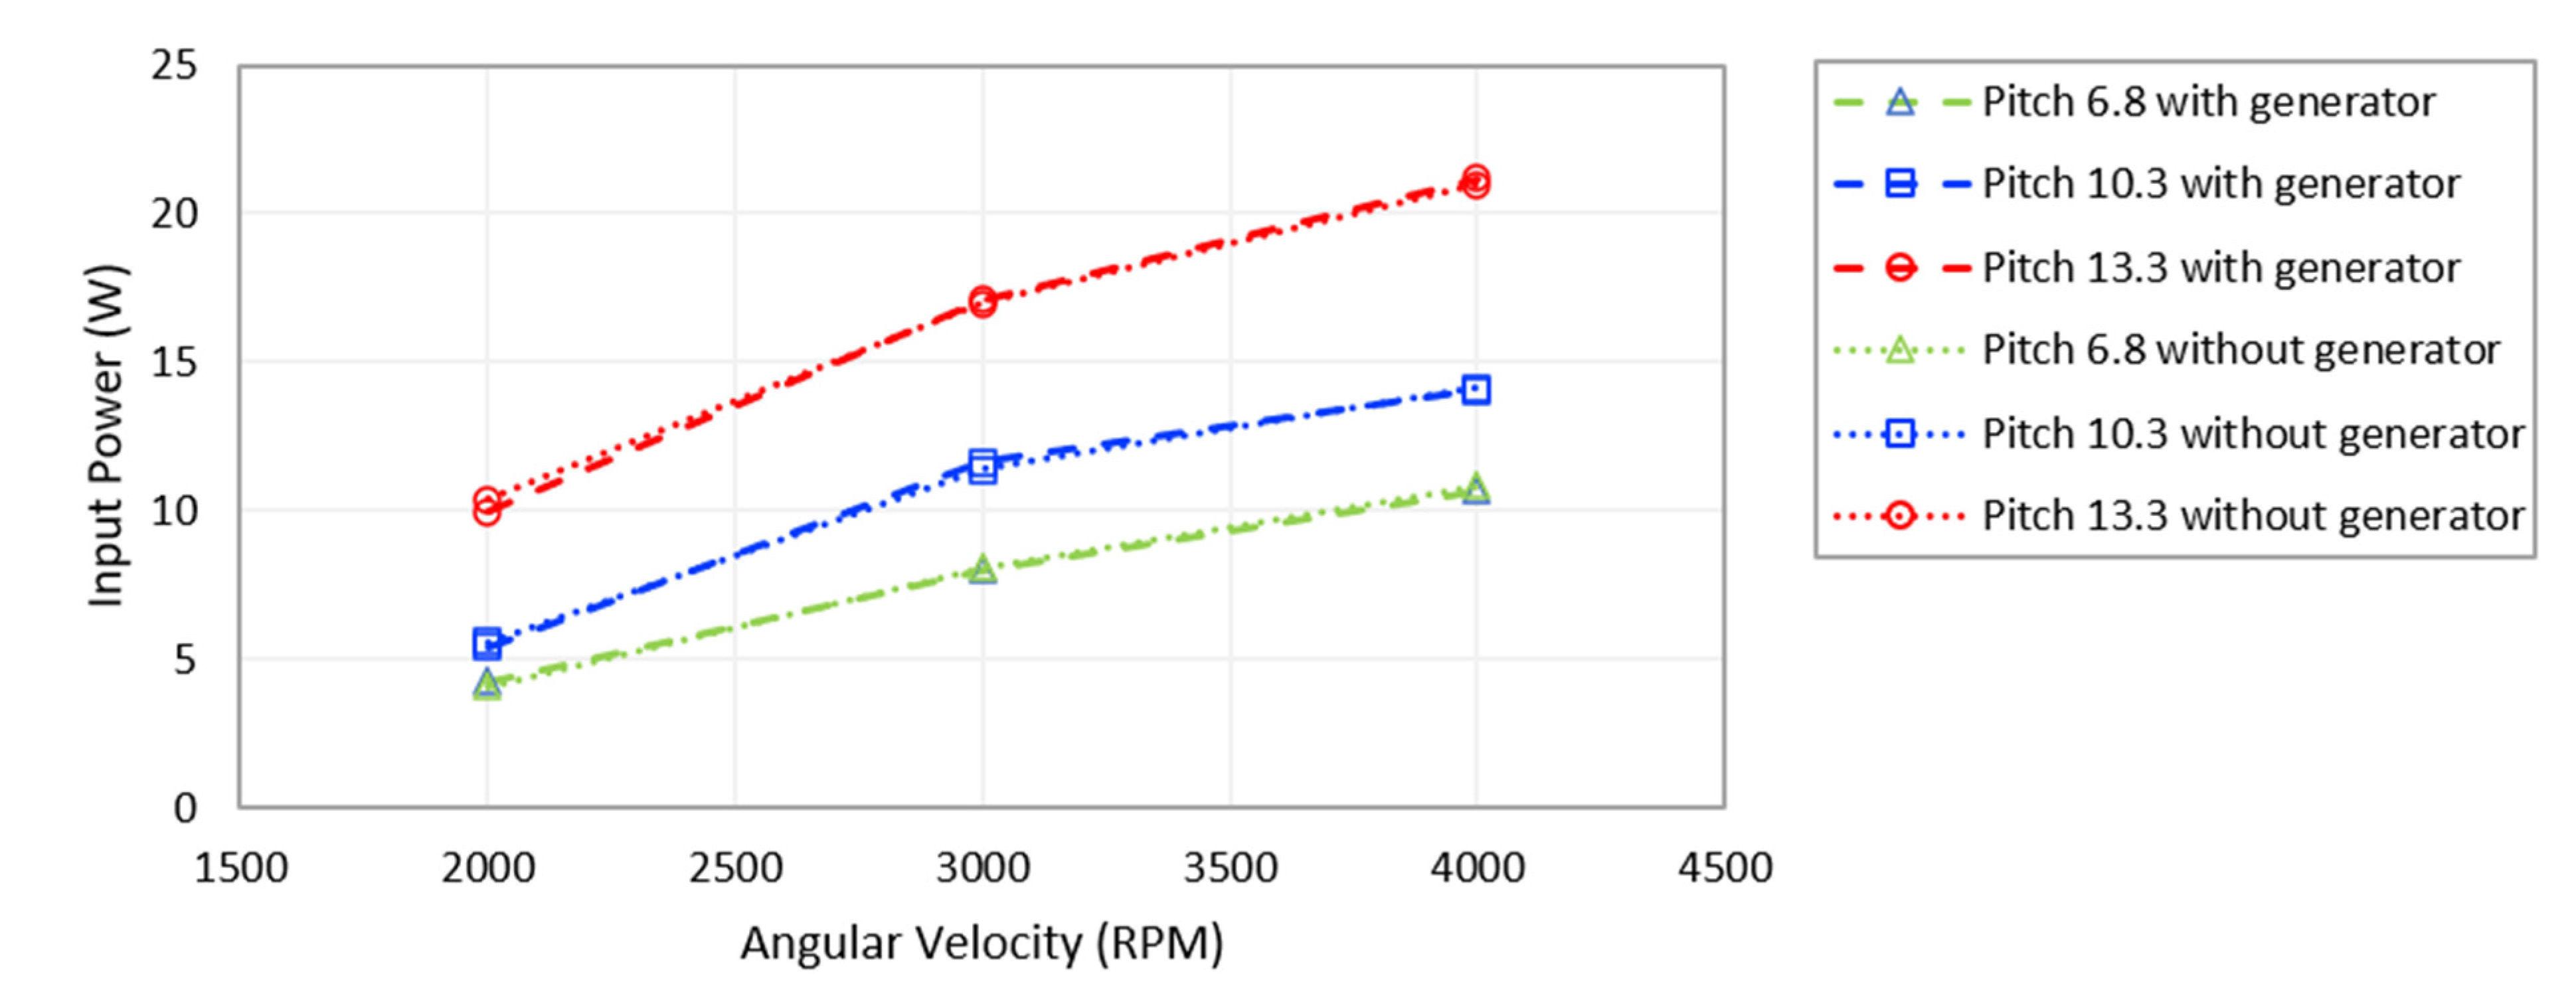
Figure 12 depicts the input electrical power of the helicopter UAV in the generator case and non-generator case at the different angular velocities of 2000, 3000, and 4000 rpm. Additionally, the flight, which represents the point where helicopter UAV was inclined upward, is shown in Table 5. Both the figure and Table 5 indicate that the input electrical power of the helicopter UAV is identical in both cases, with a 0.4% average difference. The similarity in the input electrical power of the helicopter UAV in both the generator and non-generator cases is in accordance with the principle of energy conservation. The main rotor of the helicopter UAV requires a certain amount of power to maintain its operation, regardless of whether a generator was present or not. This power, which is mainly used to overcome the forces of drag and gravity, ensuring a stable flight, ensured that the energy regeneration system used in this research was able to operate without reducing the power available to the main rotor. These results support the assumption that the input electrical power was primarily utilized to sustain the helicopter’s main rotor functions.
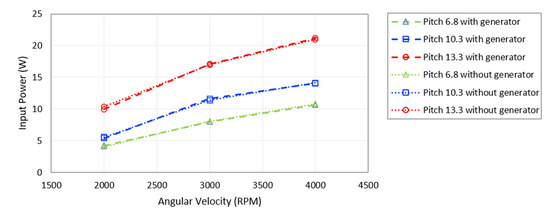
Figure 12.
Comparison of input power between generator case and non-generator case.

Table 5.
Generator and non-generator flight times.
4.3. Hover Flight Condition
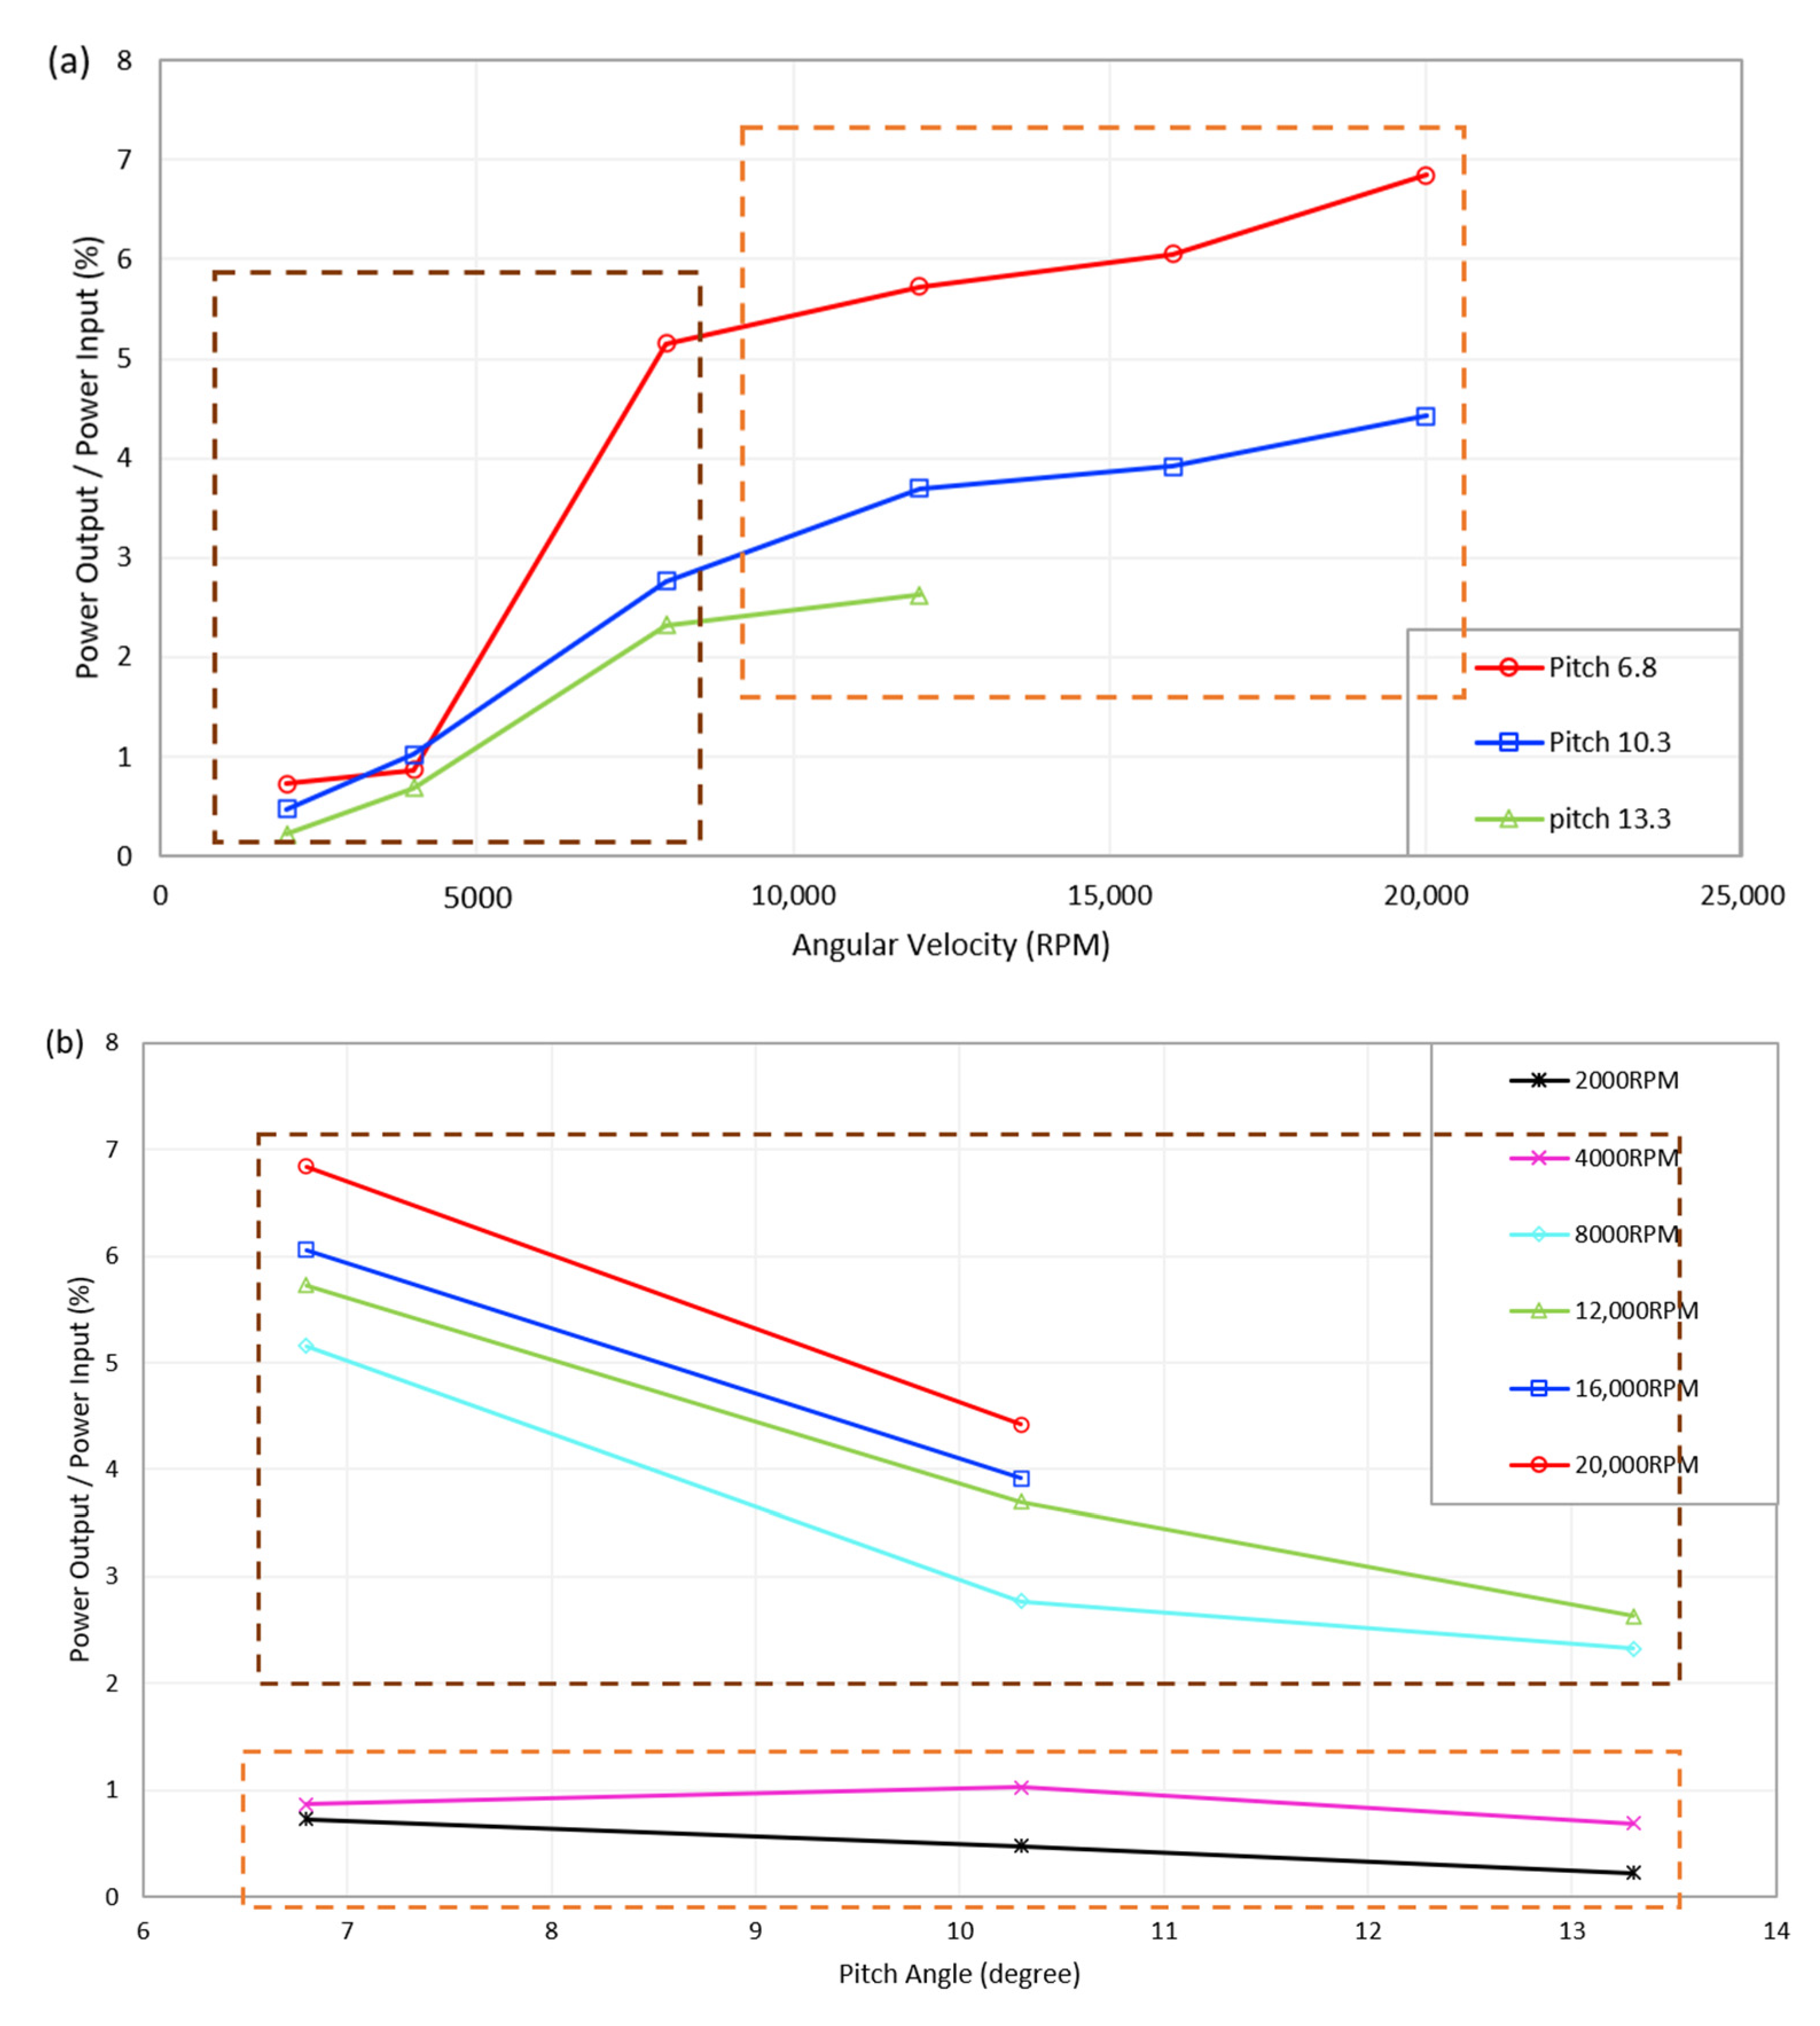
Figure 13a presents the ratio of power output from the generator to the power input from the battery, illustrating the percentage of excess power for the helicopter UAV in hover conditions at the different angular velocities of 2000, 4000, 8000, 12,000, 16,000, and 20,000 rpm. Figure 13b displays the percentage of the helicopter UAV’s excess power at varying pitch angles of 6.8, 10.3, and 13.3 degrees. As shown in the figure, the maximum percentage of excess power is 6.84%. The maximum excess power percentage of 6.84% during hover conditions can be explained by the aerodynamic principles of helicopter flight. In hover conditions, the main rotor of the helicopter UAV generates lift equal to the weight of the aircraft, allowing it to remain stationary in the air. The excess power generated in this state is likely due to the efficiency of the rotor safety design and the power system of the UAV. This excess power, when harnessed, can contribute to the overall performance and efficiency of the UAV, potentially extending its flight time or allowing for additional payload capacity. Consequently, it can be inferred that the maximum value for the excess power percentage, considering the helicopter UAV’s safety design, was 6.84%. Furthermore, Figure 13a,b show a notable change in the graph’s gradient, revealing the correlating rotor speed and power consumption. The observed escalation in the slope of the graph, correlating with the rotor speed and power consumption, was considered to be due to an increase in rotor friction. This was discerned from the substantial rise in both noise and vibration during the course of the experiment, this being particularly noticeable when the rotor speed increased from 10,000 to 20,000 RPM, a 100% increase. This was concurrent with a marked change in the graph’s gradient, as shown in the dashed boxes in Figure 13b. Rotor friction is a critical factor that impacts a helicopter’s performance. It primarily arises from the interaction between the rotor blades and the air, creating a resistance that the blades must overcome to continue their motion. This friction can cause energy loss, as the work achieved to overcome friction is typically dissipated as heat. As the rotor’s speed increases, this friction also escalates due to the increased velocity of the blades against the air. The work required to counteract these frictional forces results in energy losses, which, in turn, can boost the power required to maintain the rotor’s speed. This increased aerodynamic drag precipitates energy losses, as work against these frictional forces is required. Consequently, increased power is required to sustain the rotor speed. In essence, this rotor friction can engender energy losses, potentially reflected in the power requisites for the rotor to maintain certain conditions [36]. The manifestation of this dynamic is evident in the steeper gradient observed in the power consumption graph.
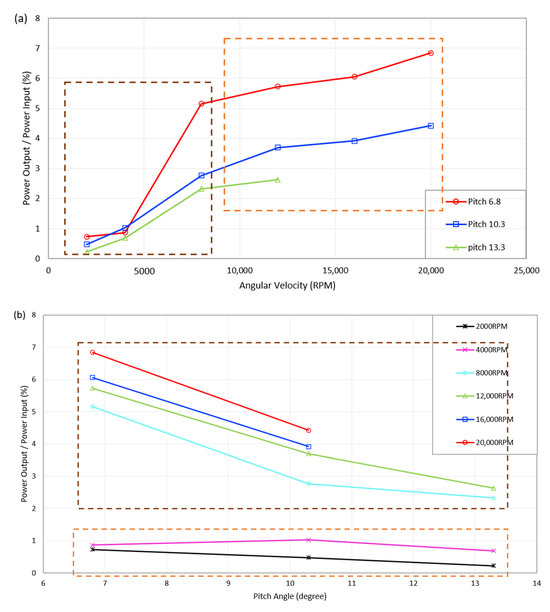
Figure 13.
Relationship of the percentage of excess power from hover flight (a) with the rotor speed and (b) with the pitch angle.
Pitch angle, along with rotor speed, is a critical factor influencing rotor friction, as presented in Figure 13a. This figure shows a remarkable transition in the gradient of the graph, showing the correlation between the pitch angle and power consumption. This change is especially noticeable at a pitch angle of 10.3, which correlates with a significant escalation in the gradient of the graph. The rotor blades’ pitch angle, a crucial parameter, considerably affects this interaction. An increased pitch angle results in a more substantial angle of attack for the blades, leading them to interact more forcefully with the air. While this dynamic increases lift, it simultaneously amplifies air resistance, thereby intensifying rotor friction. As a result, a steeper pitch angle could potentially lead to increased power consumption. This is because more energy is needed to counter the amplified friction and maintain the same rotor speed. This phenomenon manifests in the steeper gradient observed in the power consumption graph, showing a clear link between rotor friction, pitch angle, and power consumption.
4.4. Forward Flight Condition
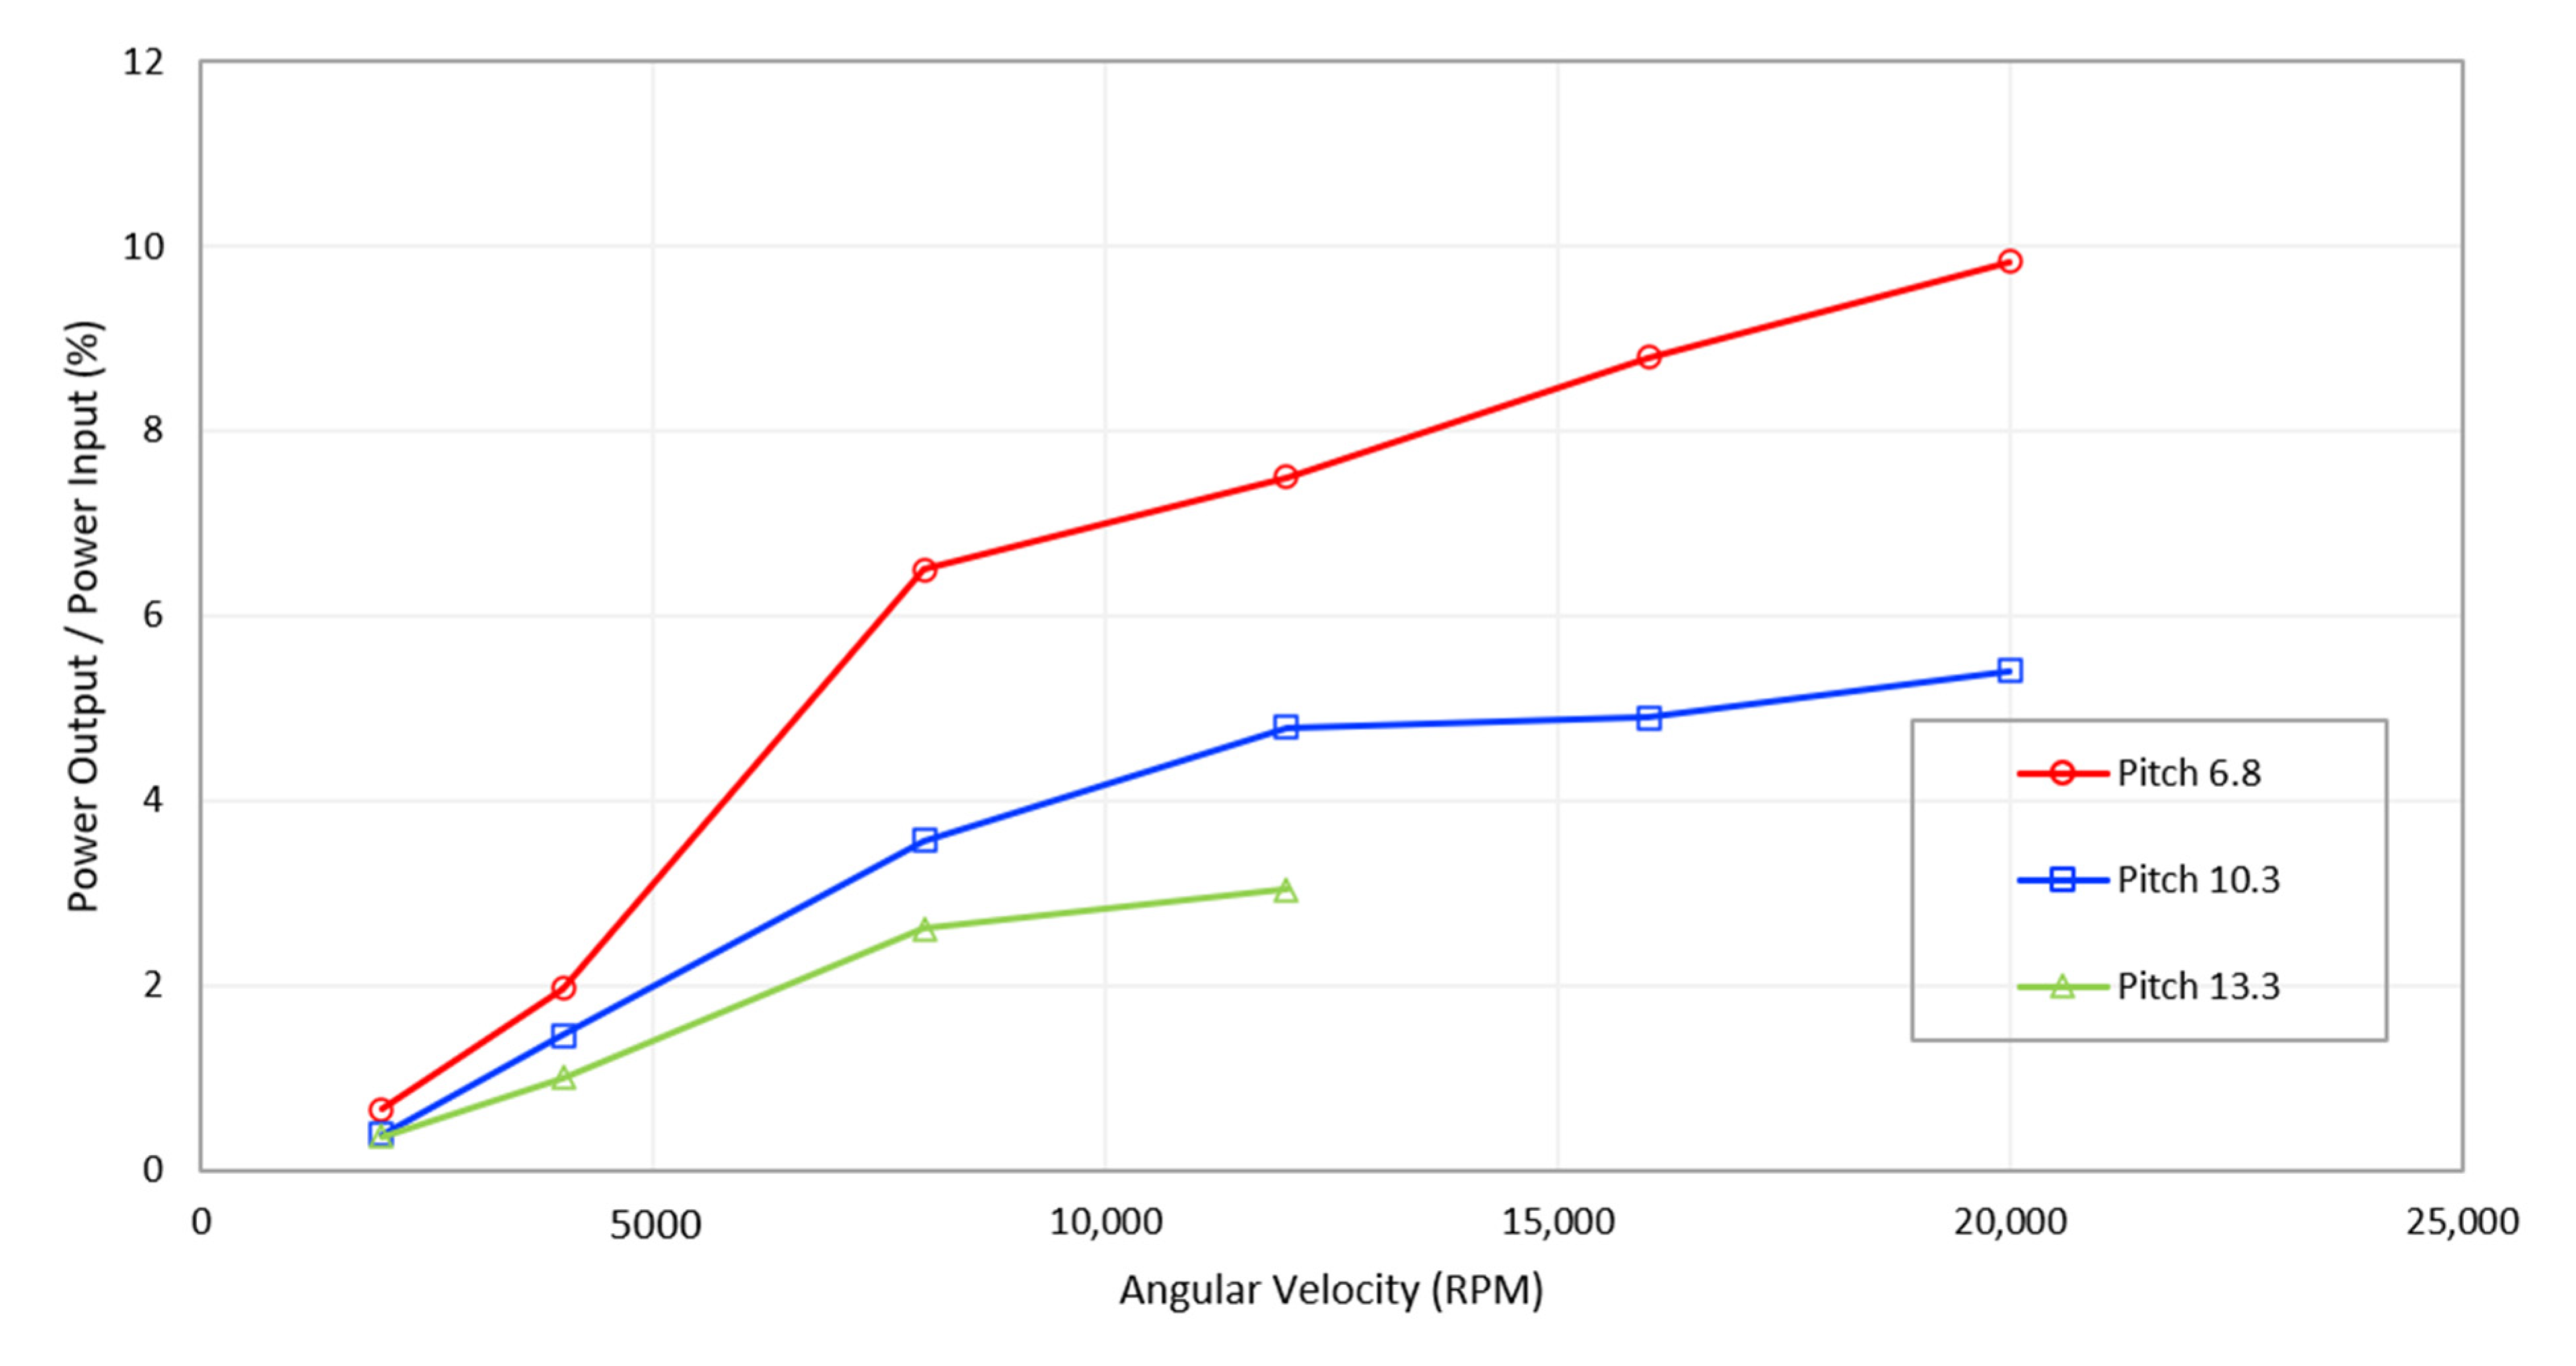
Figure 14 depicts the ratio of power output from the generator to the power input from the battery, representing the percentage of excess power for the helicopter UAV in forward flight conditions at different angular velocities of 2000, 4000, 8000, 12,000, 16,000, and 20,000 rpm. According to the figure, the maximum percentage of excess power was 9.83%. The higher maximum excess power percentage of 9.83% during forward flight conditions can be attributed to the aerodynamic benefits of forward flight. The validity of this observation is confirmed through the numerical approach employed within this study. This efficiency can result in the generation of excess power. Based on this result, it can be inferred that the maximum value for the excess power percentage, attributed to the helicopter UAV’s aerodynamics, was 2.99%. Figure 14 exhibits a significant alteration in the gradient of the graph, demonstrating the interrelationship between rotor speed and power consumption. This notable change can also be attributed to an escalated level of rotor friction.
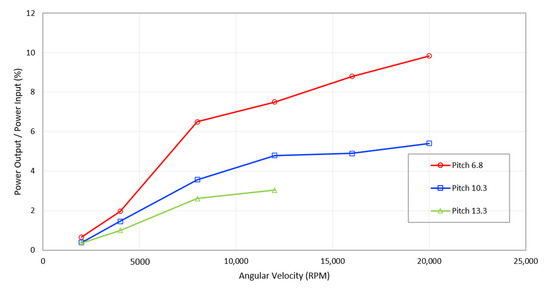
Figure 14.
Relationship between the percentage of excess power from forward flight with the rotor speed and with the pitch angle.
5. Conclusions
In conclusion, this study investigated the potential for recuperating excess power generated during the operation of helicopter Unmanned Aerial Vehicles (UAVs). The analysis of excess power under different flight conditions, such as hover and forward flight, provides valuable insights into both the safety factor associated with power supply and the complex aerodynamics involved in helicopter UAV performance. The analyses of excess power led to the following key findings:
- Our estimations indicated that the rotor lift produced during forward flight surpassed that generated during hover flight, as determined using the numerical approach. These findings are in close alignment with the wind tunnel experimental data, thus validating the application of these methodologies in assessing helicopter performance.
- By adjusting the main rotor angular velocity and pitch angle, the percentage of excess power can reach up to 6.84% in hover conditions and 9.83% in forward flight conditions.
- Based on the results of the hover and forward flight experiments, it can be deduced that the maximum value for the excess power percentage, attributed to the helicopter UAV’s safety design, is 6.84%, and that attributed to the helicopter UAV’s aerodynamics is 2.99%.
- This study supports the concept that helicopter performance can be enhanced by harnessing the excess power generated during flight operations. When this excess energy is harnessed, it can contribute significantly to the overall performance and efficiency of the UAV, potentially extending its flight duration or accommodating additional payload capacity.
Finally, it is important to recognize that this study was primarily focused on the hover and forward flights of helicopter UAVs due to the limitations of the available wind tunnel resources. However, we suspect that a helicopter UAV also possesses excess power during roll and yaw movements. To investigate this characteristic, the utilization of User-Defined Functions (UDFs) to adjust the motion parameters in CFD simulations is essential along with the requirement for access to a larger wind tunnel for experimental validation. Future research should focus on addressing these limitations and exploring other excess energy-regenerative methods to further advance the performance and capabilities of helicopter UAVs that could potentially pave the way for the development of hybrid helicopter UAV models in the future.
Supplementary Materials
The following supporting information can be downloaded at: https://www.mdpi.com/article/10.3390/drones7100643/s1.
Author Contributions
Conceptualization, C.K. (Chindanai Kodchaniphahong); methodology, C.K. (Chindanai Kodchaniphahong); validation, C.K. (Chindanai Kodchaniphahong); formal analysis, C.K. (Chindanai Kodchaniphahong) and J.-t.P.; investigation, C.K. (Chindanai Kodchaniphahong); resources, C.K. (Chindanai Kodchaniphahong); data curation, C.K. (Chindanai Kodchaniphahong); writing—original draft preparation, C.K. (Chindanai Kodchaniphahong) and J.-t.P.; writing—review and editing, C.K. (Chindanai Kodchaniphahong), J.-t.P. and C.K. (Chaiwat Klumpol); visualization, C.K. (Chindanai Kodchaniphahong); supervision, J.-t.P.; project administration, C.K. (Chindanai Kodchaniphahong). All authors have read and agreed to the published version of the manuscript.
Funding
This research received no external funding.
Acknowledgments
This research was supported by the Faculty of Engineering, Kasetsart University (Bangkok, Thailand), which provided essential research equipment, including a wind tunnel and measuring tools. The authors would also like to thank Kasetsart University’s Research and Development Institute for their support in proofreading the manuscript.
Conflicts of Interest
The authors declare that they have no known competing financial interests or personal relationships that could have appeared to influence the work reported in this paper.
References
- Leishman, G.J. Principles of Helicopter Aerodynamics with CD Extra; Cambridge University Press: Cambridge, UK, 2006. [Google Scholar]
- Padfield, G.D.J.I. Helicopter Flight Dynamics: The Theory and Application of Flying Qualities and Simulation Modeling; American Institute of Aeronautics and Astronautics: Washington, DC, USA, 2007. [Google Scholar]
- Sikorsky, I.A. Aerodynamic parameters selection in helicopter design. J. Am. Helicopter Soc. 1960, 5, 41–60. [Google Scholar] [CrossRef]
- Pavel, M.D.; van Holten, T. Rotary Wing Vehicles. Encycl. Aerosp. Eng. 2010. [Google Scholar] [CrossRef]
- Filippone, A. Flight Performance of Fixed and Rotary Wing Aircraft; Elsevier: Amsterdam, The Netherlands, 2006. [Google Scholar]
- Conlisk, A.T. Modern helicopter aerodynamics. Annu. Rev. Fluid Mech. 1997, 29, 515–567. [Google Scholar] [CrossRef]
- Seddon, J.M.; Newman, S. Basic Helicopter Aerodynamics; John Wiley & Sons: Hoboken, NJ, USA, 2011. [Google Scholar]
- Rotaru, C.; Todorov, M. Helicopter flight physics. Flight Phys.-Model. Tech. Technol. 2018, 10, 1948. [Google Scholar]
- Mistry, M.; Gandhi, F.J. Helicopter performance improvement with variable rotor radius and RPM. J. Am. Helicopter Soc. 2014, 59, 17–35. [Google Scholar] [CrossRef]
- Han, D.; Pastrikakis, V.; Barakos, G.N. Helicopter performance improvement by variable rotor speed and variable blade twist. Aerosp. Sci. Technol. 2016, 54, 164–173. [Google Scholar] [CrossRef]
- Han, D.; Wang, J.; Smith, E.C.; Lesieutre, G.A. Transient loads control of a variable speed rotor during lagwise resonance crossing. AIAA J. 2013, 51, 20–29. [Google Scholar] [CrossRef]
- Fenny, C. Mechanism for varying the diameter of rotors using compound differential rotary transmissions. In Annual Forum Proceedings-American Helicopter Society; American Helicopter Society, Inc.: Fairfax, VA, USA, 2005; p. 1359. [Google Scholar]
- Berry, B.; Chopra, I. Wind tunnel testing for performance and vibratory loads of a variable-speed mach-scale rotor. In Proceedings of the American Helicopter Society 67th Annual Forum, Virginia Beach, VA, USA, 3–5 May 2011. [Google Scholar]
- Han, D.; Smith, E.C. Lagwise dynamic analysis of a variable speed rotor. Aerosp. Sci. Technol. 2013, 29, 277–286. [Google Scholar] [CrossRef]
- Datta, A.; Yeo, H.; Norman, T.R. Experimental investigation and fundamental understanding of a slowed UH-60A rotor at high advance ratios. In Proceedings of the AHS 67th Annual Forum and Technology Display, Virtual, 6–8 October 2020. [Google Scholar]
- Kang, H.; Saberi, H.; Gandhi, F. Dynamic blade shape for improved helicopter rotor performance. J. Am. Helicopter Soc. 2010, 55, 32008-32008. [Google Scholar] [CrossRef]
- Brouwers, E.; Zientek, T.; Centolanza, L. Twist Effects on Rotor Performance, Loads and Vibrations. In Proceedings of the 71st Annual Forum of the American Helicopter Society, Beach, VA, USA, 5–7 May 2015. [Google Scholar]
- Chen, P.C.; Chopra, I. Hover testing of smart rotor with induced-strain actuation of blade twist. AIAA J. 1997, 35, 6–16. [Google Scholar] [CrossRef]
- Cheng, R.P.; Celi, R.J. Optimum two-per-revolution inputs for improved rotor performance. J. Aircr. 2005, 42, 1409–1417. [Google Scholar] [CrossRef]
- Thakkar, D.; Ganguli, R. Use of single crystal and soft piezoceramics for alleviation of flow separation induced vibration in a smart helicopter rotor. Smart Mater. Struct. 2006, 15, 331. [Google Scholar] [CrossRef]
- Thakkar, D.; Ganguli, R.J. Induced shear actuation of helicopter rotor blade for active twist control. Thin-Walled Struct. 2007, 45, 111–121. [Google Scholar] [CrossRef]
- Jain, R.; Yeo, H.; Chopra, I. Computational fluid dynamics—Computational structural dynamics analysis of active control of helicopter rotor for performance improvement. J. Am. Helicopter Soc. 2010, 55, 42004. [Google Scholar] [CrossRef]
- Thiemeier, J.; Oehrle, C.; Frey, F.; Keßler, M.; Krämer, E. Aerodynamics and flight mechanics analysis of Airbus Helicopters’ compound helicopter RACER in hover under crosswind conditions. CEAS Aeronaut. J. 2019, 11, 49–66. [Google Scholar] [CrossRef]
- Cerny, M.; Breitsamter, C.J.A. A comparison of isolated and ducted fixed-pitch propellers under non-axial inflow conditions. Aerospace 2020, 7, 112. [Google Scholar] [CrossRef]
- Carreno Ruiz, M.; Scanavino, M.; D’Ambrosio, D.; Guglieri, G.; Vilardi, A. Experimental and numerical analysis of multicopter rotor aerodynamics. In Proceedings of the AIAA Aviation 2021 Forum, Virtual Event, 2–6 August 2021; p. 2539. [Google Scholar]
- Doerffer, P.; Szulc, O. Numerical simulation of model helicopter rotor in hover. Sci. Bull. Acad. Comput. Cent. Gdan. 2008, 12, 227–236. [Google Scholar]
- Wilcox, D.C. Multiscale model for turbulent flows. AIAA J. 1988, 26, 1311–1320. [Google Scholar] [CrossRef]
- Menter, F.R. Two-equation eddy-viscosity turbulence models for engineering applications. AIAA J. 1994, 32, 1598–1605. [Google Scholar] [CrossRef]
- Velte, C.M.; Mikkelsen, R.F.; Sørensen, J.N.; Kaloyanov, T.; Gaunaa, M. Closed loop control of a flap exposed to harmonic aerodynamic actuation. In In Proceedings of the Torque 2012, The science of making torque from wind, Oldenburg, Germany, 9–11 October 2012. [Google Scholar]
- Maeda, T.; Kamada, Y.; Murata, J.; Suzuki, D.; Kaga, N.; Kagisaki, Y. LDV measurement of boundary layer on rotating blade surface in wind tunnel. J. Phys. Conf. Ser. 2014, 555 , 012057. [Google Scholar]
- Beaty, H.W.; Santoso, S. Handbook of Electric Power Calculations; McGraw-Hill Education: New York, NY, USA, 2015. [Google Scholar]
- Hasan, I.; Mukesh, R.; Krishnan, P.R.; Srinath, R.; Babu, D.P.; Gurmu, N.L. Wind Tunnel Testing and Validation of Helicopter Rotor Blades Using Additive Manufacturing. Adv. Mater. Sci. Eng. 2022, 2022, 4052208. [Google Scholar] [CrossRef]
- Federal Aviation Administration, Airman Testing Branch. In Rotorcraft Flying Handbook; FAA-H-8083-21A. 2019; U.S. Department of Transportation: Washington, DC, USA, 2000.
- Prouty, R.W. Helicopter Performance, Stability, and Control; Krieger Publishing: Marlaba, FL, USA, 1995. [Google Scholar]
- Fox, R.W.; McDonald, A.T.; Mitchell, J.W. Fox and McDonald’s Introduction to Fluid Mechanics; John Wiley & Sons: Hoboken, NJ, USA, 2020. [Google Scholar]
- Howell, R.; Qin, N.; Edwards, J.; Durrani, N. Wind tunnel and numerical study of a small vertical axis wind turbine. Renew. Energy 2010, 35, 412–422. [Google Scholar] [CrossRef]
Disclaimer/Publisher’s Note: The statements, opinions and data contained in all publications are solely those of the individual author(s) and contributor(s) and not of MDPI and/or the editor(s). MDPI and/or the editor(s) disclaim responsibility for any injury to people or property resulting from any ideas, methods, instructions or products referred to in the content. |
© 2023 by the authors. Licensee MDPI, Basel, Switzerland. This article is an open access article distributed under the terms and conditions of the Creative Commons Attribution (CC BY) license (https://creativecommons.org/licenses/by/4.0/).

