1. Introduction
Indicator species of grassland degradation play a crucial role in community succession and grassland degradation warning within grassland ecosystems. They are of significant importance in studying the response of grasslands to grazing, human disturbances, and other factors leading to degradation [
1]. As indicators of grassland degradation, monitoring changes in various indicators of these indicator species, such as importance value and dominance, has become essential in assessing degraded grasslands [
2]. These key parameters of grassland degradation indicator species can be utilized to evaluate the health and ecological functionality of grasslands [
3].
Given the role of indicator species in the study of grassland ecosystem degradation, research has identified various grassland degradation indicator species, such as
Iris lactea var. chinensis,
Stipa breviflora,
Convolvulus ammannii,
Artemisia frigida, and others.
Artemisia frigida is a small semi-shrub belonging to the Asteraceae family. It is a facultative clonal plant, resilient to drought, trampling, and soil erosion, with strong regenerative capabilities through rooting and sprouting [
4]. As one of the dominant species in desert grasslands,
Artemisia frigida significantly influences the structure and function of the community. Serving as an important indicator species for grassland degradation, the dynamic changes in
Artemisia frigida to some extent reflect grassland degradation [
5]. Therefore, conducting surveys and monitoring of
Artemisia frigida contributes to understanding the status of grassland degradation. Currently, investigations of degradation indicator species like
Artemisia frigida heavily rely on manual field surveys and records. However, these surveys may be prone to noise due to the influence of staff knowledge and working conditions. Additionally, manual surveys are time-consuming and labor-intensive, making large-scale rapid surveys challenging [
6].
In addition to field surveys, there is also relevant research utilizing remote sensing technology for the classification and identification of degradation species such as
Artemisia frigida. Currently, research primarily focuses on fine plant classification through ground spectral measurements within a small area. Conducting spectral measurements on a larger scale still faces several challenges. For example, Gai et al. [
7] used canopy spectral information to identify plants such as
Artemisia frigida and Lilium brownii. Niu Yalong et al. [
8] measured the spectra of five typical sand vegetation types, including
Artemisia frigida, and analyzed the similarities and differences between them. Unmanned aerial vehicle (UAV) remote sensing offers maneuverability and flexibility, and through carrying multiple sensors, it enables the acquisition of multi-source data. It can provide centimeter-level ultra-high spatial resolution data [
9], which is suitable for fine plant classification and identification. Therefore, UAV remote sensing has found wide applications in grassland plant classification and ecological parameter acquisition [
10,
11]. For instance, Yang et al. [
12] obtained images using a UAV hyperspectral imaging system. They constructed classification features for species in desert grasslands through spectral transformations of vegetation indices. Utilizing a decision tree model, they classified and identified key species such as Stipa breviflora,
Artemisia frigida, and Salsola collina in desert grassland. The above-mentioned research on grassland plant identification and classification using UAVs mainly focuses on the scale of grassland communities, with few studies conducted at the level of plant populations or individuals for recognition.
The high-resolution images obtained by unmanned aerial vehicles (UAVs) provide excellent data support for grassland plant recognition and identification. However, for small and dense objects like
Artemisia frigida, conventional image processing algorithms have limited recognition capabilities, resulting in relatively low identification accuracy [
13]. With the development of deep learning technology, numerous object detection algorithms have been developed. These detection methods, trained on massive datasets and tested on small sample sets, extract deep features from data samples, demonstrating strong learning capabilities and high accuracy in object detection and recognition [
14]. Among these object detection algorithms, YOLO (You Only Look Once) represents a single-stage object detection algorithm [
15]. Compared to two-stage object detection algorithms, its major advantages lie in fast execution speed and high detection accuracy. However, for grassland plants with dense distribution and relatively small size compared to trees or potted plants, detection algorithms face higher demands in recognizing densely packed small targets. Considering this, this study, which is based on UAV images, improves the detection performance of the YOLOv7 model for densely packed small objects. The enhanced model is then applied to the detection of
Artemisia frigida in sample plots. Spatial distribution and density mapping and analysis of
Artemisia frigida in sample plots are conducted, aiming to provide technical references for the investigation of degradation indicator species such as
Artemisia frigida.
2. Materials and Methods
2.1. Study Area
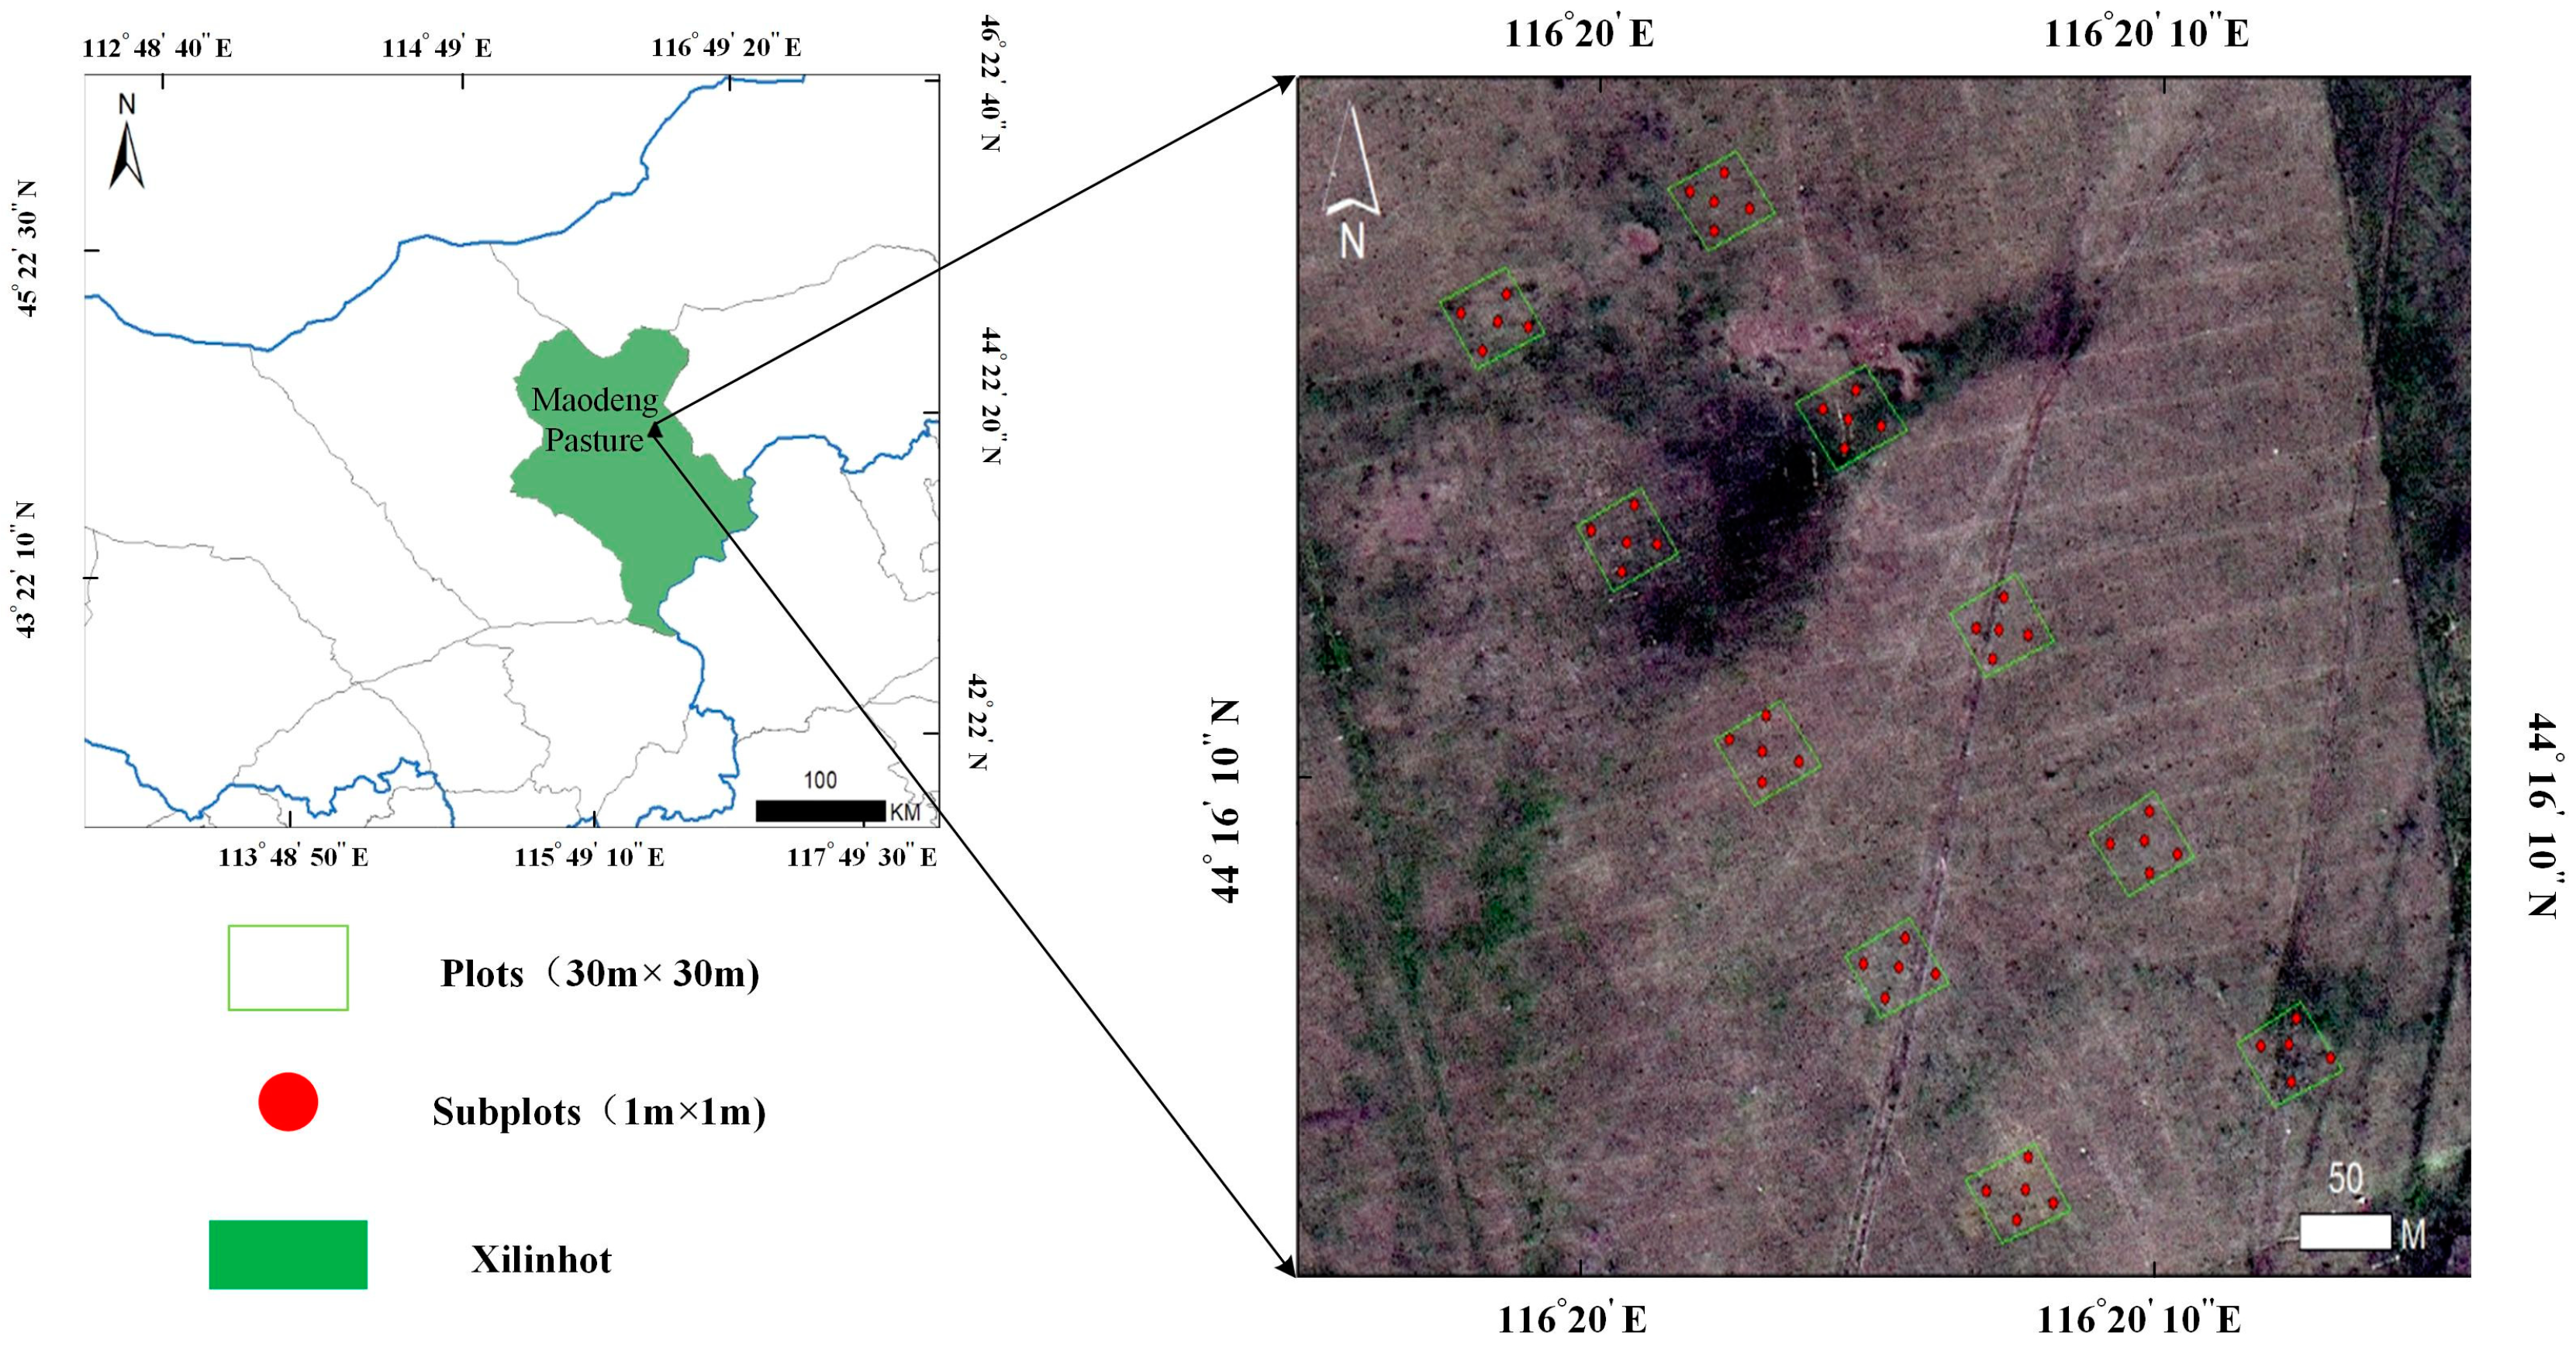
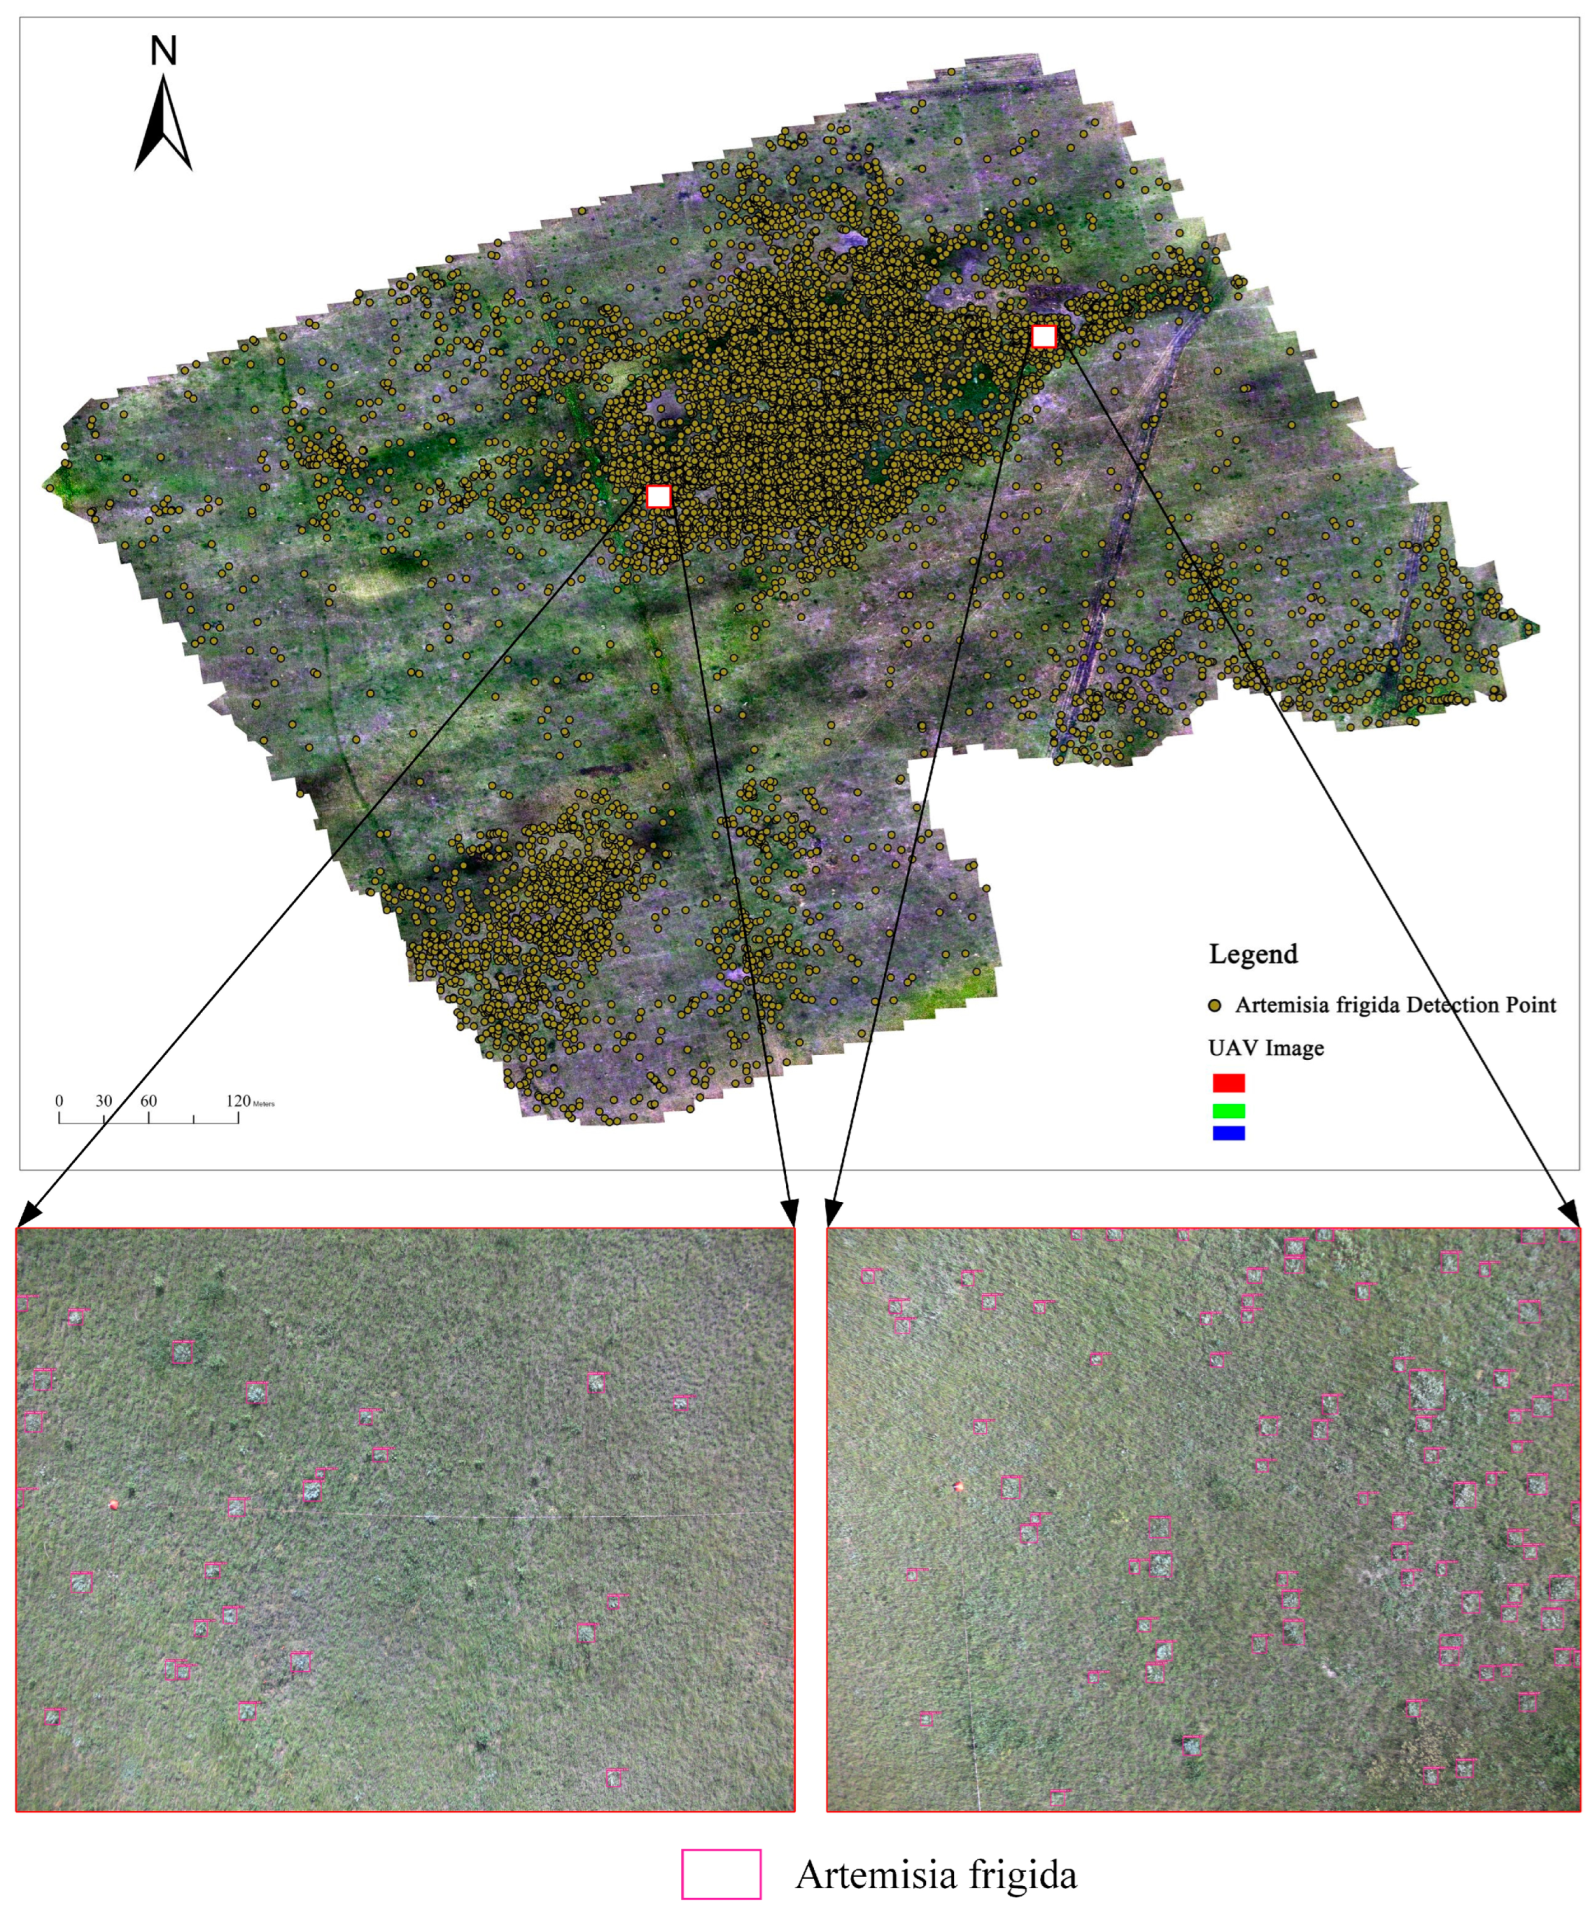
The Xilingol Grassland is located in the eastern part of the Xilingol Plateau in Inner Mongolia Autonomous Region, China. It is one of the largest grasslands in northern China, characterized by a predominantly continental arid and semi-arid climate. The elevation ranges from 760 to 1926 m, with an average annual temperature of 0 to 3 °C and an annual precipitation of 150 to 350 mm. The precipitation is concentrated mainly from July to September, exhibiting distinct seasonal characteristics with warm summers and cold winters. The grassland covers an area of approximately 179,600 square kilometers and includes diverse grassland types such as meadow grassland, typical grassland, and dune desert grassland. The experimental area selected for this study is located in the Maodeng Ranch, Xilinhot City, Inner Mongolia Autonomous Region, China (116.03° to 116.50° E, 44.80° to 44.82° N), as shown in
Figure 1. It is a typical grassland and is renowned as one of the prominent ranches on the Xilinhot Grassland. This area features a rich variety of plant species, with dominant vegetation including Poaceae, Fabaceae, and Asteraceae pasture grasses.
2.2. Data
We collected data in August 2022 using the DJI M300 RTK UAV (DJI, Inc., Shenzhen, China). The UAV adopts a new flight control system and motor system, with the characteristics of high-precision positioning, high stability and reliability. It has an endurance of approximately 55 min, can withstand a maximum wind speed of 15 m/s, has a maximum horizontal flight speed of 23 m/s, and a maximum range of 15 km. Equipped with the AQ600 multispectral camera (Yusense, Inc., Qingdao, China), this camera is lightweight, easy to install, and easy to operate, compatible with various UAV. It consists of one 12.3-megapixel RGB channel and five 3.2-megapixel multispectral channels. The RGB channel has a focal length of 7.2 mm, a field of view of 47.4° × 36.4°, and the imaging resolution is 4056 × 3040 pixels. The ground sampling distance for the RGB channel is 1.76 cm @ h80m. The five spectral bands of the multispectral channels are as follows: blue (450 nm ± 35 nm), green (555 nm ± 27 nm), red (660 nm ± 22 nm), red edge (720 nm ± 10 nm), and near-infrared (840 nm ± 30 nm), and the imaging resolution is 2048 × 1536 pixels. The ground sampling distance for the multispectral channel is 2.52 cm@h80m. Given the ability to recognize target species, to improve efficiency in field data collection, we set the flight altitude to 80 m, flight speed to 3 m/s, and the lateral and longitudinal overlap rates to 85%. A total of 23 flight lines are set, covering an area of 500 × 500 m. At a height of 80 m, the ground resolution of multispectral channel imagery is 2.52 cm, making it difficult to capture the smaller Artemisia frigida. Therefore, in this study, we only used RGB channel imagery for Artemisia frigida detection.
Before the flight, we set up 10 plots of 30 × 30 m each within a 500 × 500 m area. Within each plot, we placed 5 sample quadrats of 1 × 1 m each and recorded the coordinates of each plot and subplot. The distribution of plots and quadrats can be seen in
Figure 1. We conducted species surveys in each plot, meticulously recording the number of
Artemisia frigida within them. This data was used to validate the accuracy of
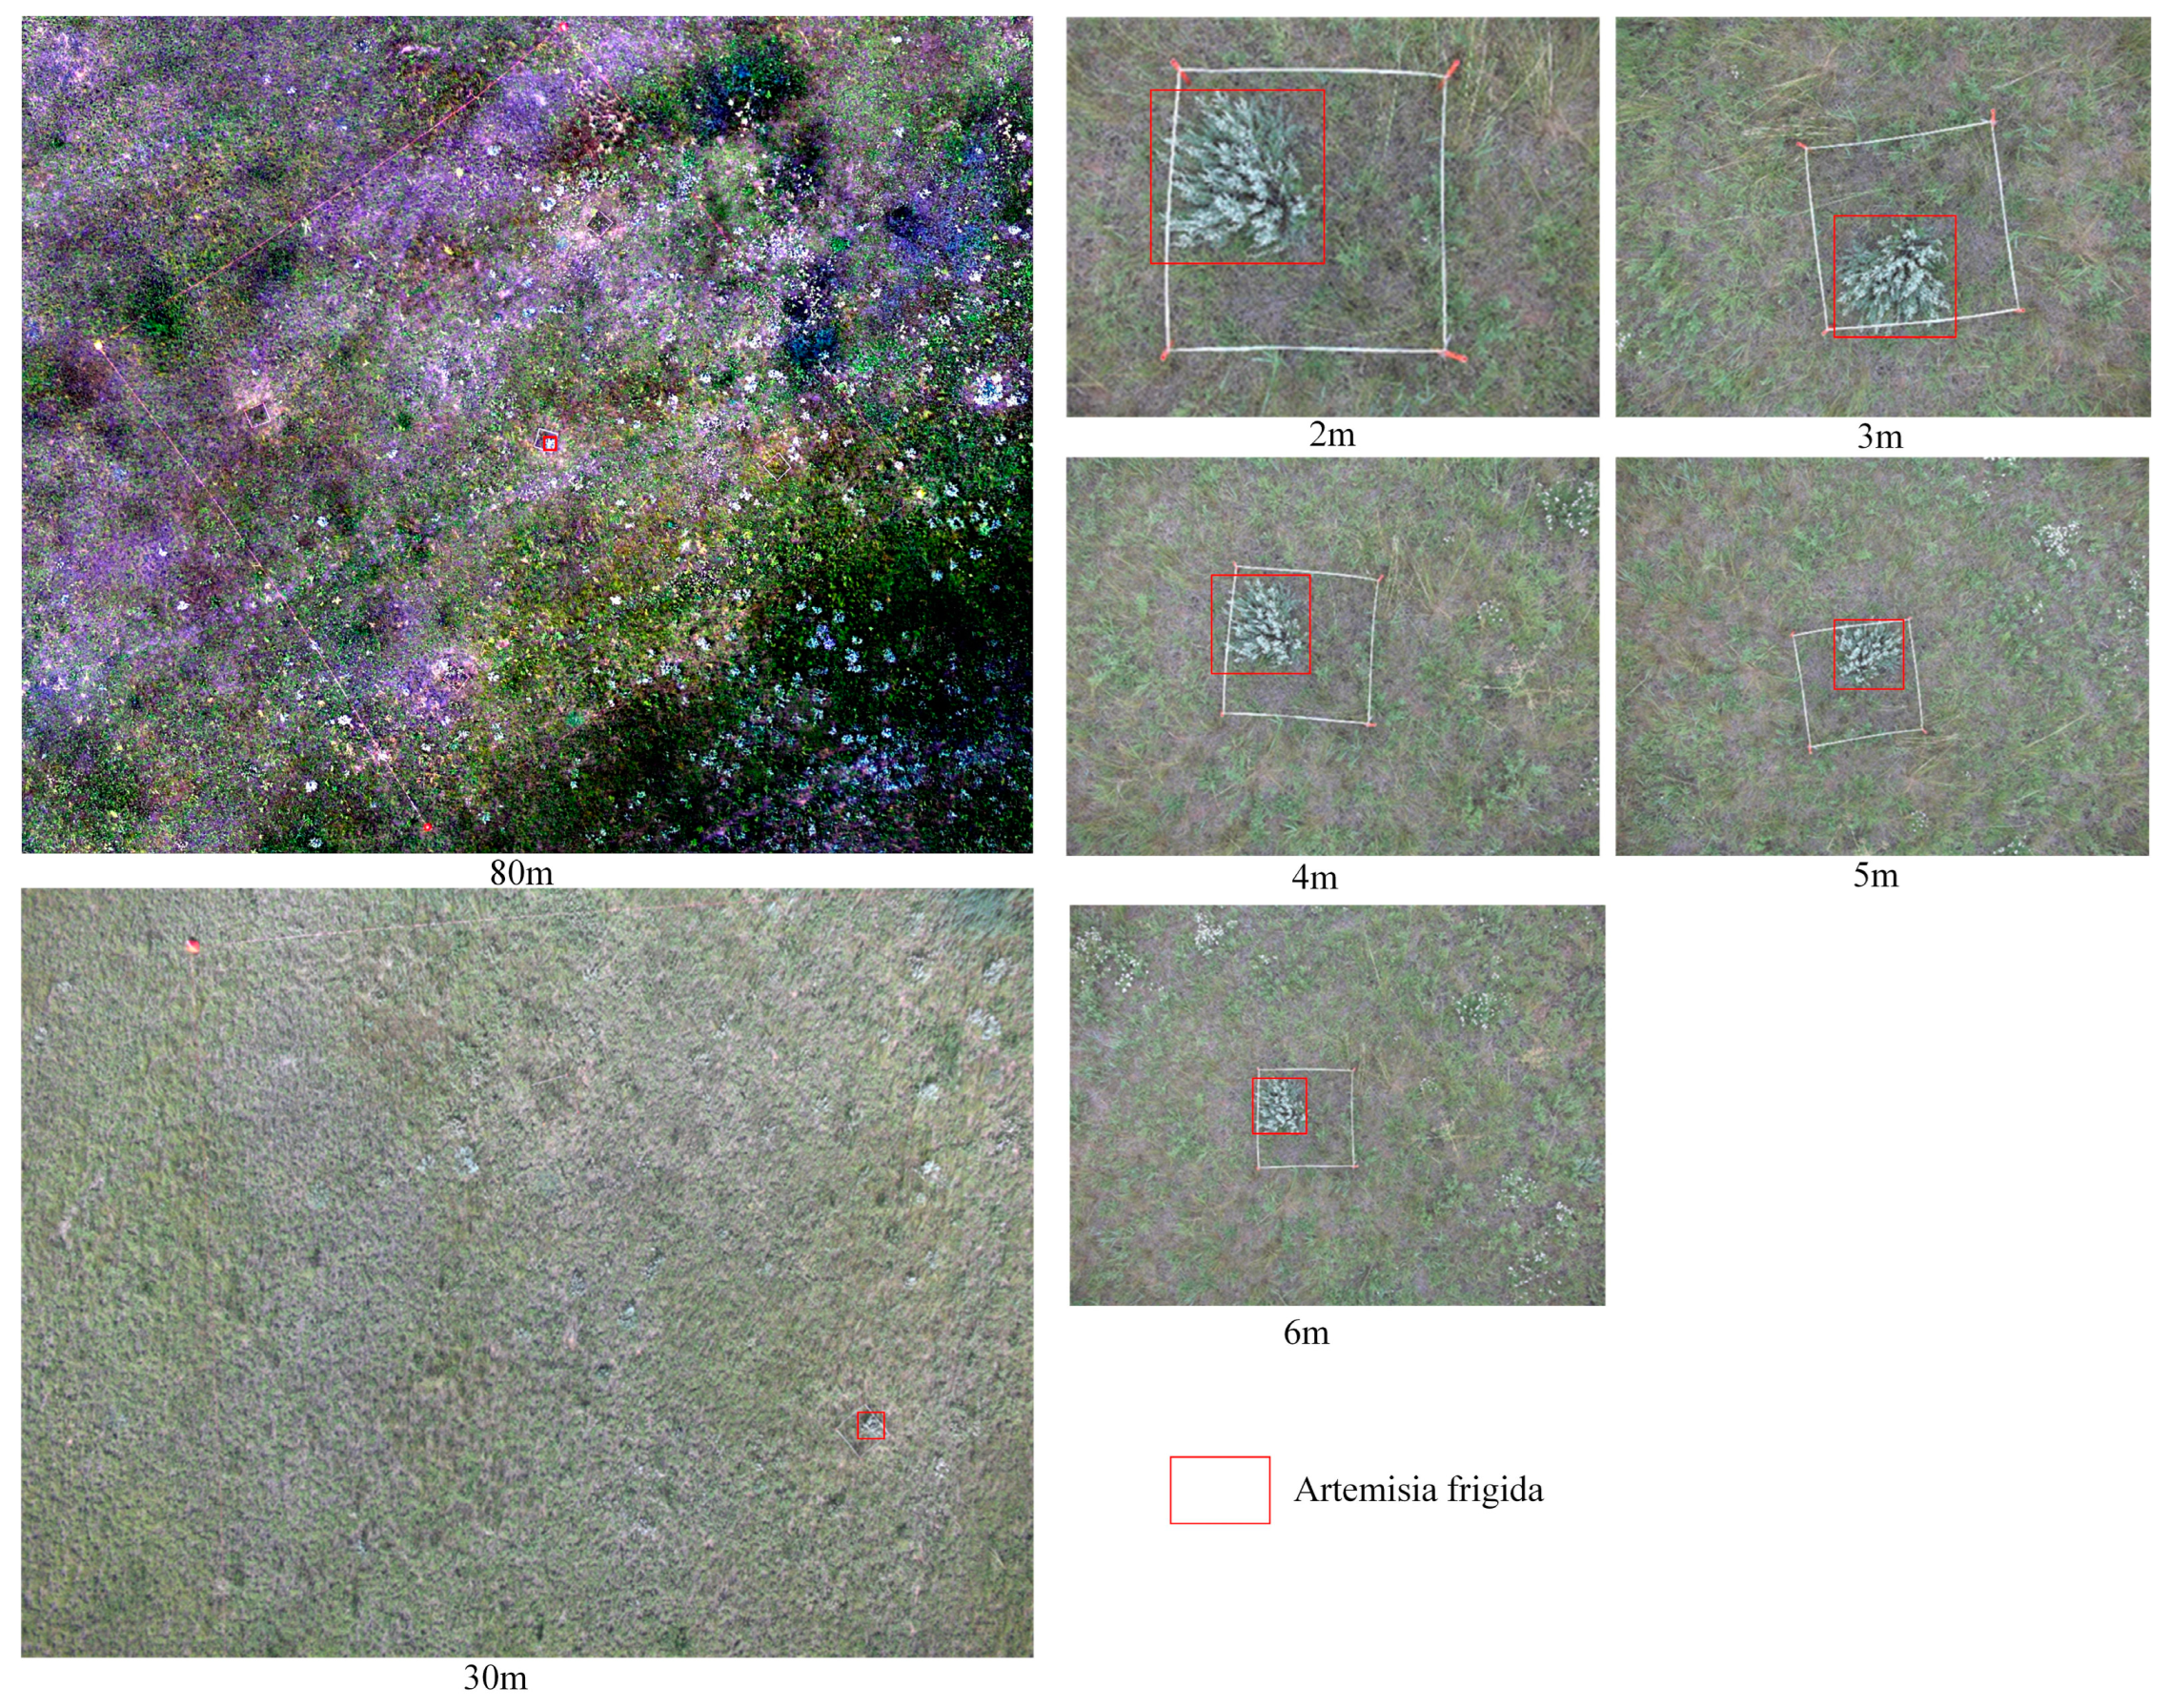
Artemisia frigida detection at the plot scale in subsequent analyses. To facilitate annotation in the future, we captured images of each plot at a height of 30 m, which serve as reference images for image annotation. Additionally, within each 30 × 30 m plot, we set 5 subplots and recorded the coordinates of each subplot. We then captured images within and around these subplots at heights ranging from 2–6 m with 1 m intervals, as shown in
Figure 2. These images serve as references for annotation.
2.3. Data Preprocessing and Annotation
A total of 790 RGB images were obtained during the flight. After the flight, the relative positions and orientations of the aerial images were reconstructed and merged into a large orthomosaic. An orthomosaic is a visual representation of an area, created from many photos that were stitched together in a geometrically corrected manner. We utilized the Structure from Motion approach implemented in Agisoft Metashape Professional version 2.0.2 for this purpose. Agisoft Metashape processes all aerial images as input and aligns them through bundle adjustment, enabling the generation of a point cloud representing the topography of the surveyed area. From this point cloud, a digital surface model was created to orthorectify the orthomosaic. During orthomosaic generation, we disabled blending to preserve the original image information without smearing. The final orthomosaic we generated was exported with a ground sample distance of 1 cm.
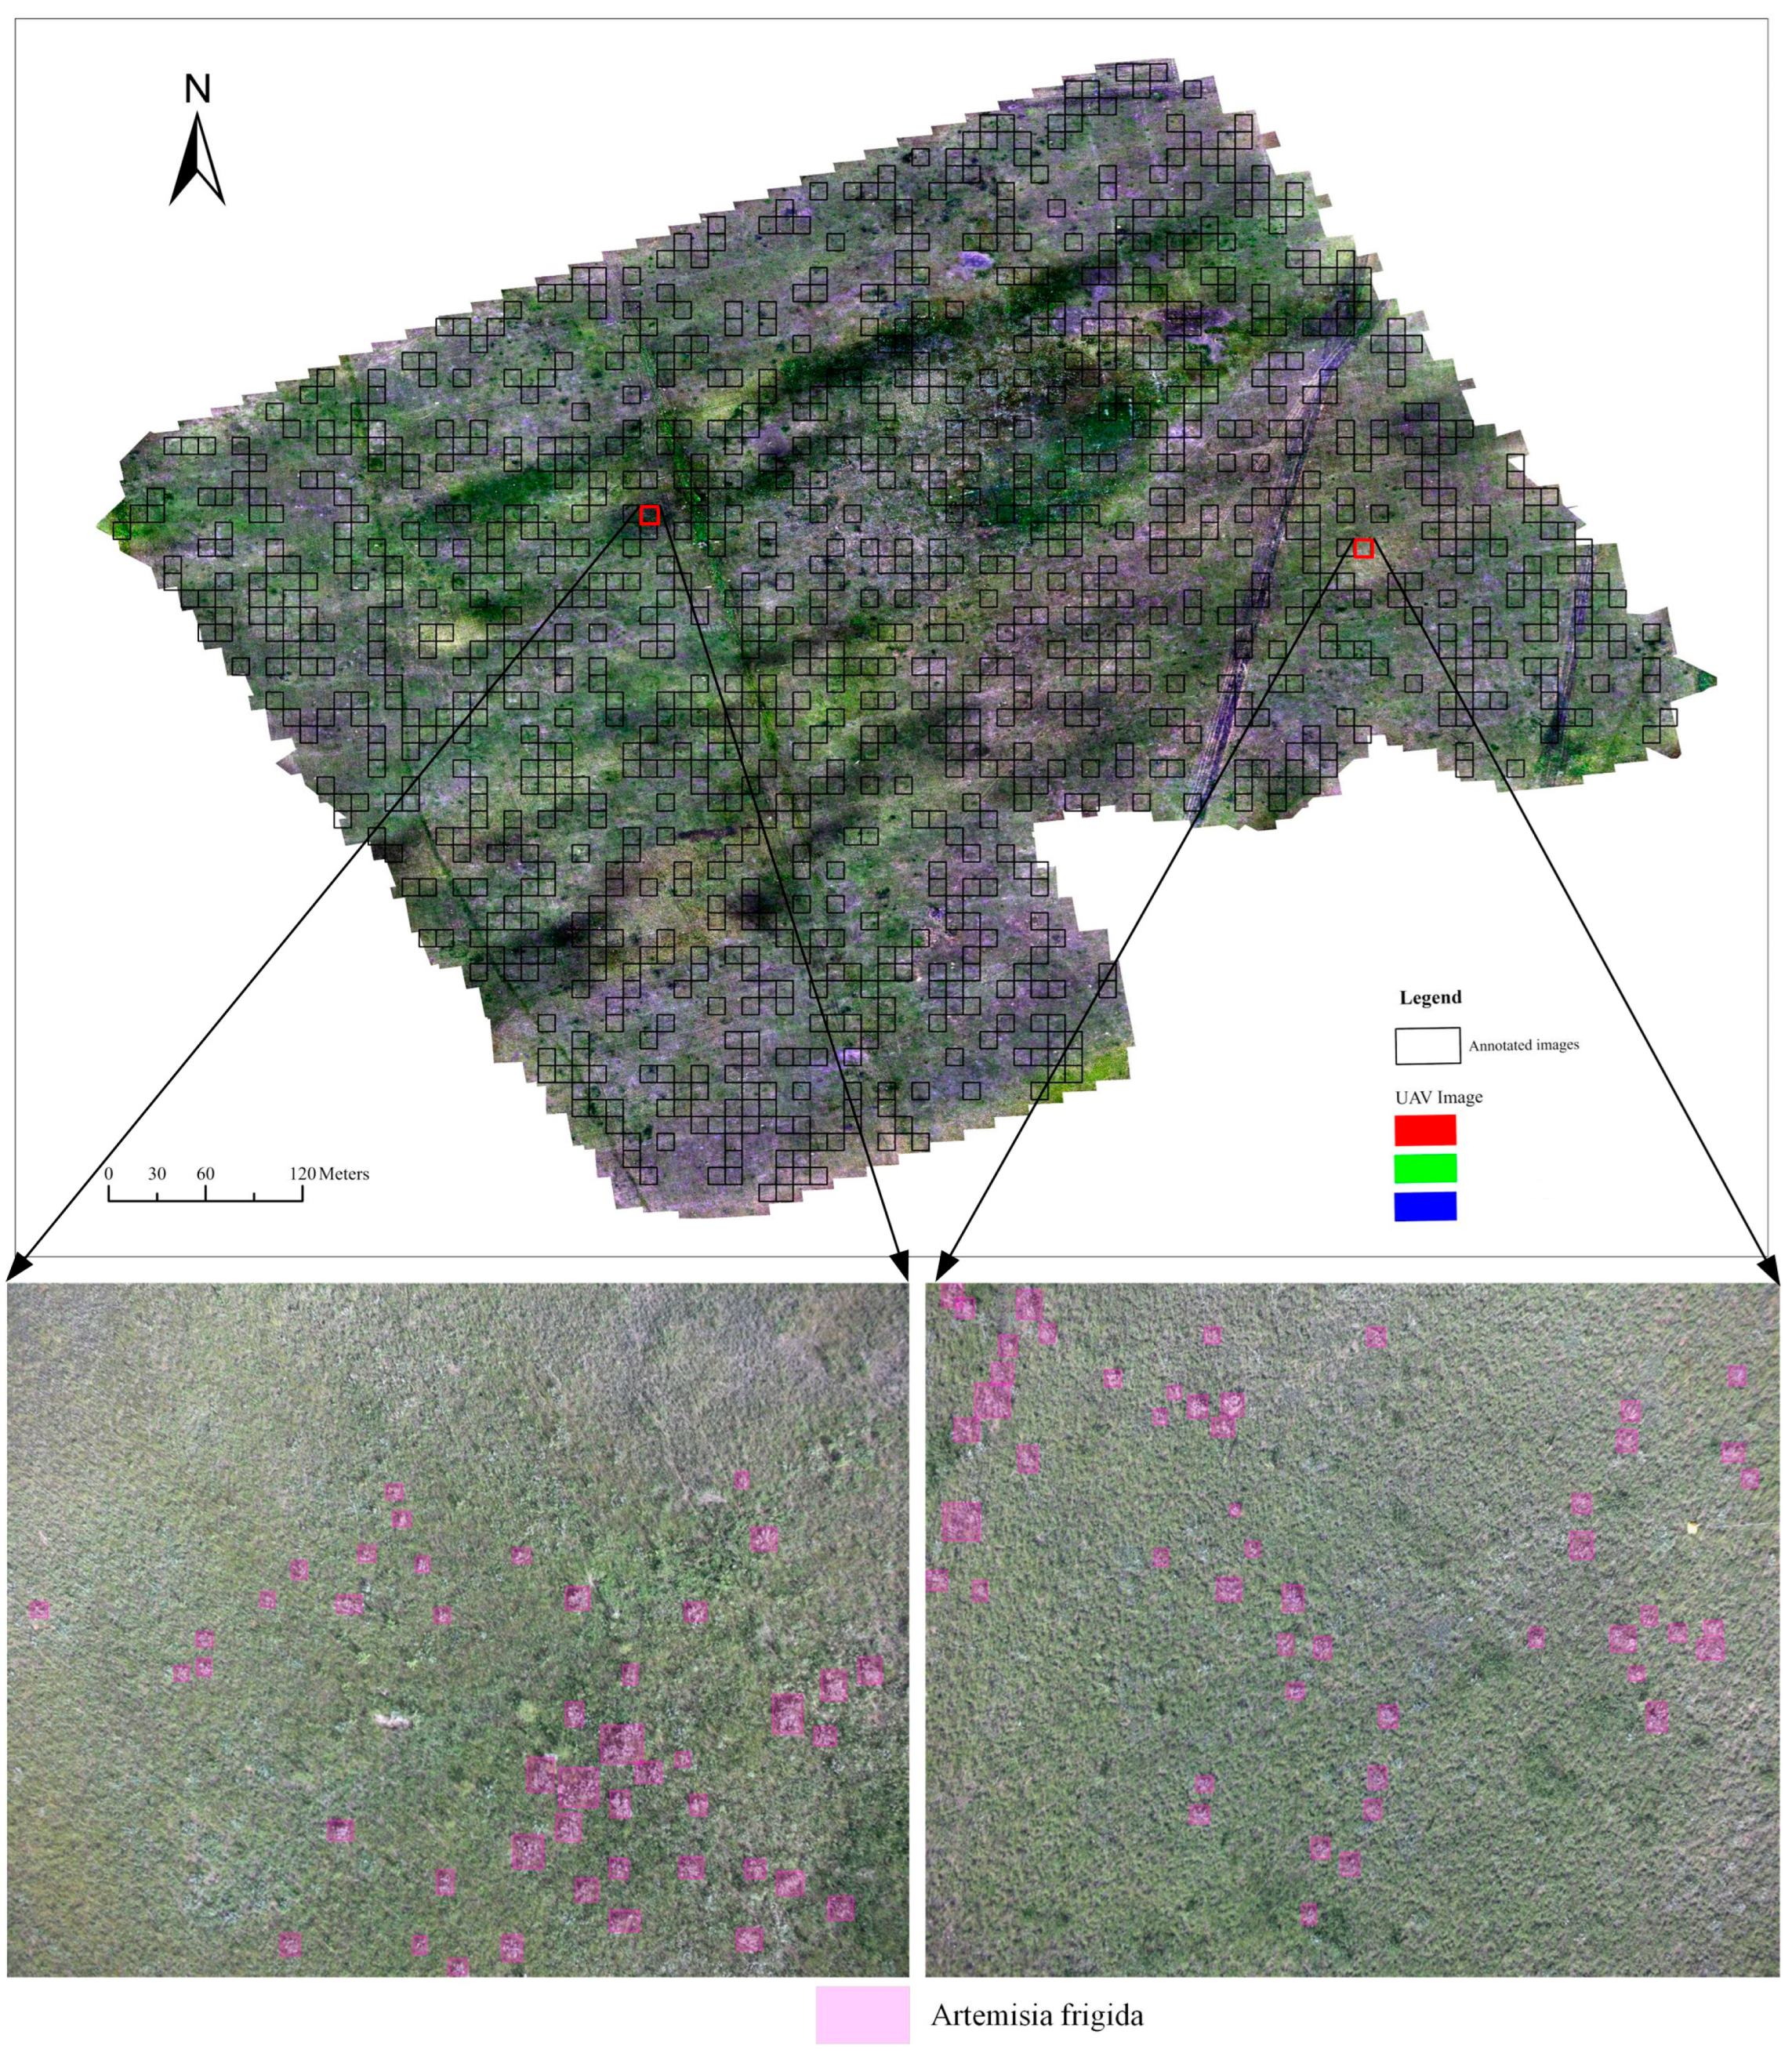
To ensure the quality of data annotation, we established an
Artemisia frigida UAV image annotation reference library based on ground plot survey data and UAV images captured at different heights. We randomly cropped 790 images captured at 80 m height, with a size of 4056 × 3040 pixels, resulting in a total of 4150 images with a size of 1280 × 1280 pixels. Out of these, 1200 images were randomly selected for annotation, as shown in
Figure 3, which was completed in the Label Studio annotation platform. During annotation, the
Artemisia frigida UAV image annotation library was referenced, and comparison was made with annotated images falling within the survey plot range and field survey
Artemisia frigida, ensuring the quality of annotation. The annotations were exported in YOLO format. The annotated images were divided into training, validation, and test sets, with 1000 images in the training set, 100 images in the validation set, and 100 images in the test set. Additionally, to expand the training set, we performed augmentation on the training images. The augmentation techniques included horizontal flipping, vertical flipping, random cropping, random translation scaling rotation, center cropping, and elastic transformation.
2.4. YOLOv7 Improvement
The YOLO series models utilize an end-to-end approach for object detection and localization in images, predicting both categories and positions simultaneously. A typical YOLO object detector comprises four main components: input, backbone network, neck, and head. To enhance training data diversity, data augmentation techniques are applied in the input module during the training phase. The diversified data then undergoes feature extraction at different scales in the backbone module. The neck module incorporates upsampling and feature concatenation layers for feature injection, providing additional details for the final stage. The head module compares the predicted object categories and positions with ground truth labels to generate the loss function results. Subsequently, backpropagation updates parameters in the backbone, neck, and head modules. Model training continues based on input data until the loss function stabilizes, indicating the completion of the training process [
16,
17,
18]. In terms of architecture, the YOLOv7 model introduces an extended efficient layer aggregation network ELAN-based extension known as E-ELAN. E-ELAN utilizes Expand, Shuffle, and Merge Cardinality to continuously enhance the network’s learning capability without destroying existing gradient paths. In terms of architecture, E-ELAN only changes the architecture of the computation blocks, while the architecture of the transition layer remains unchanged. Our strategy is to use group convolutions to expand the channels and cardinality of the computation blocks. We apply the same group parameters and channel multipliers to all computation blocks in the computation layer. Then, based on the group parameter
g, we shuffle the feature maps computed by each computation block into
g groups and then concatenate them together. At this point, the number of channels in each group of feature maps will be the same as the number of channels in the original architecture. Finally, we add
g groups of feature maps to perform merge cardinality. In addition to maintaining the original ELAN design architecture, E-ELAN can also guide computation modules from different groups to learn more diversified features [
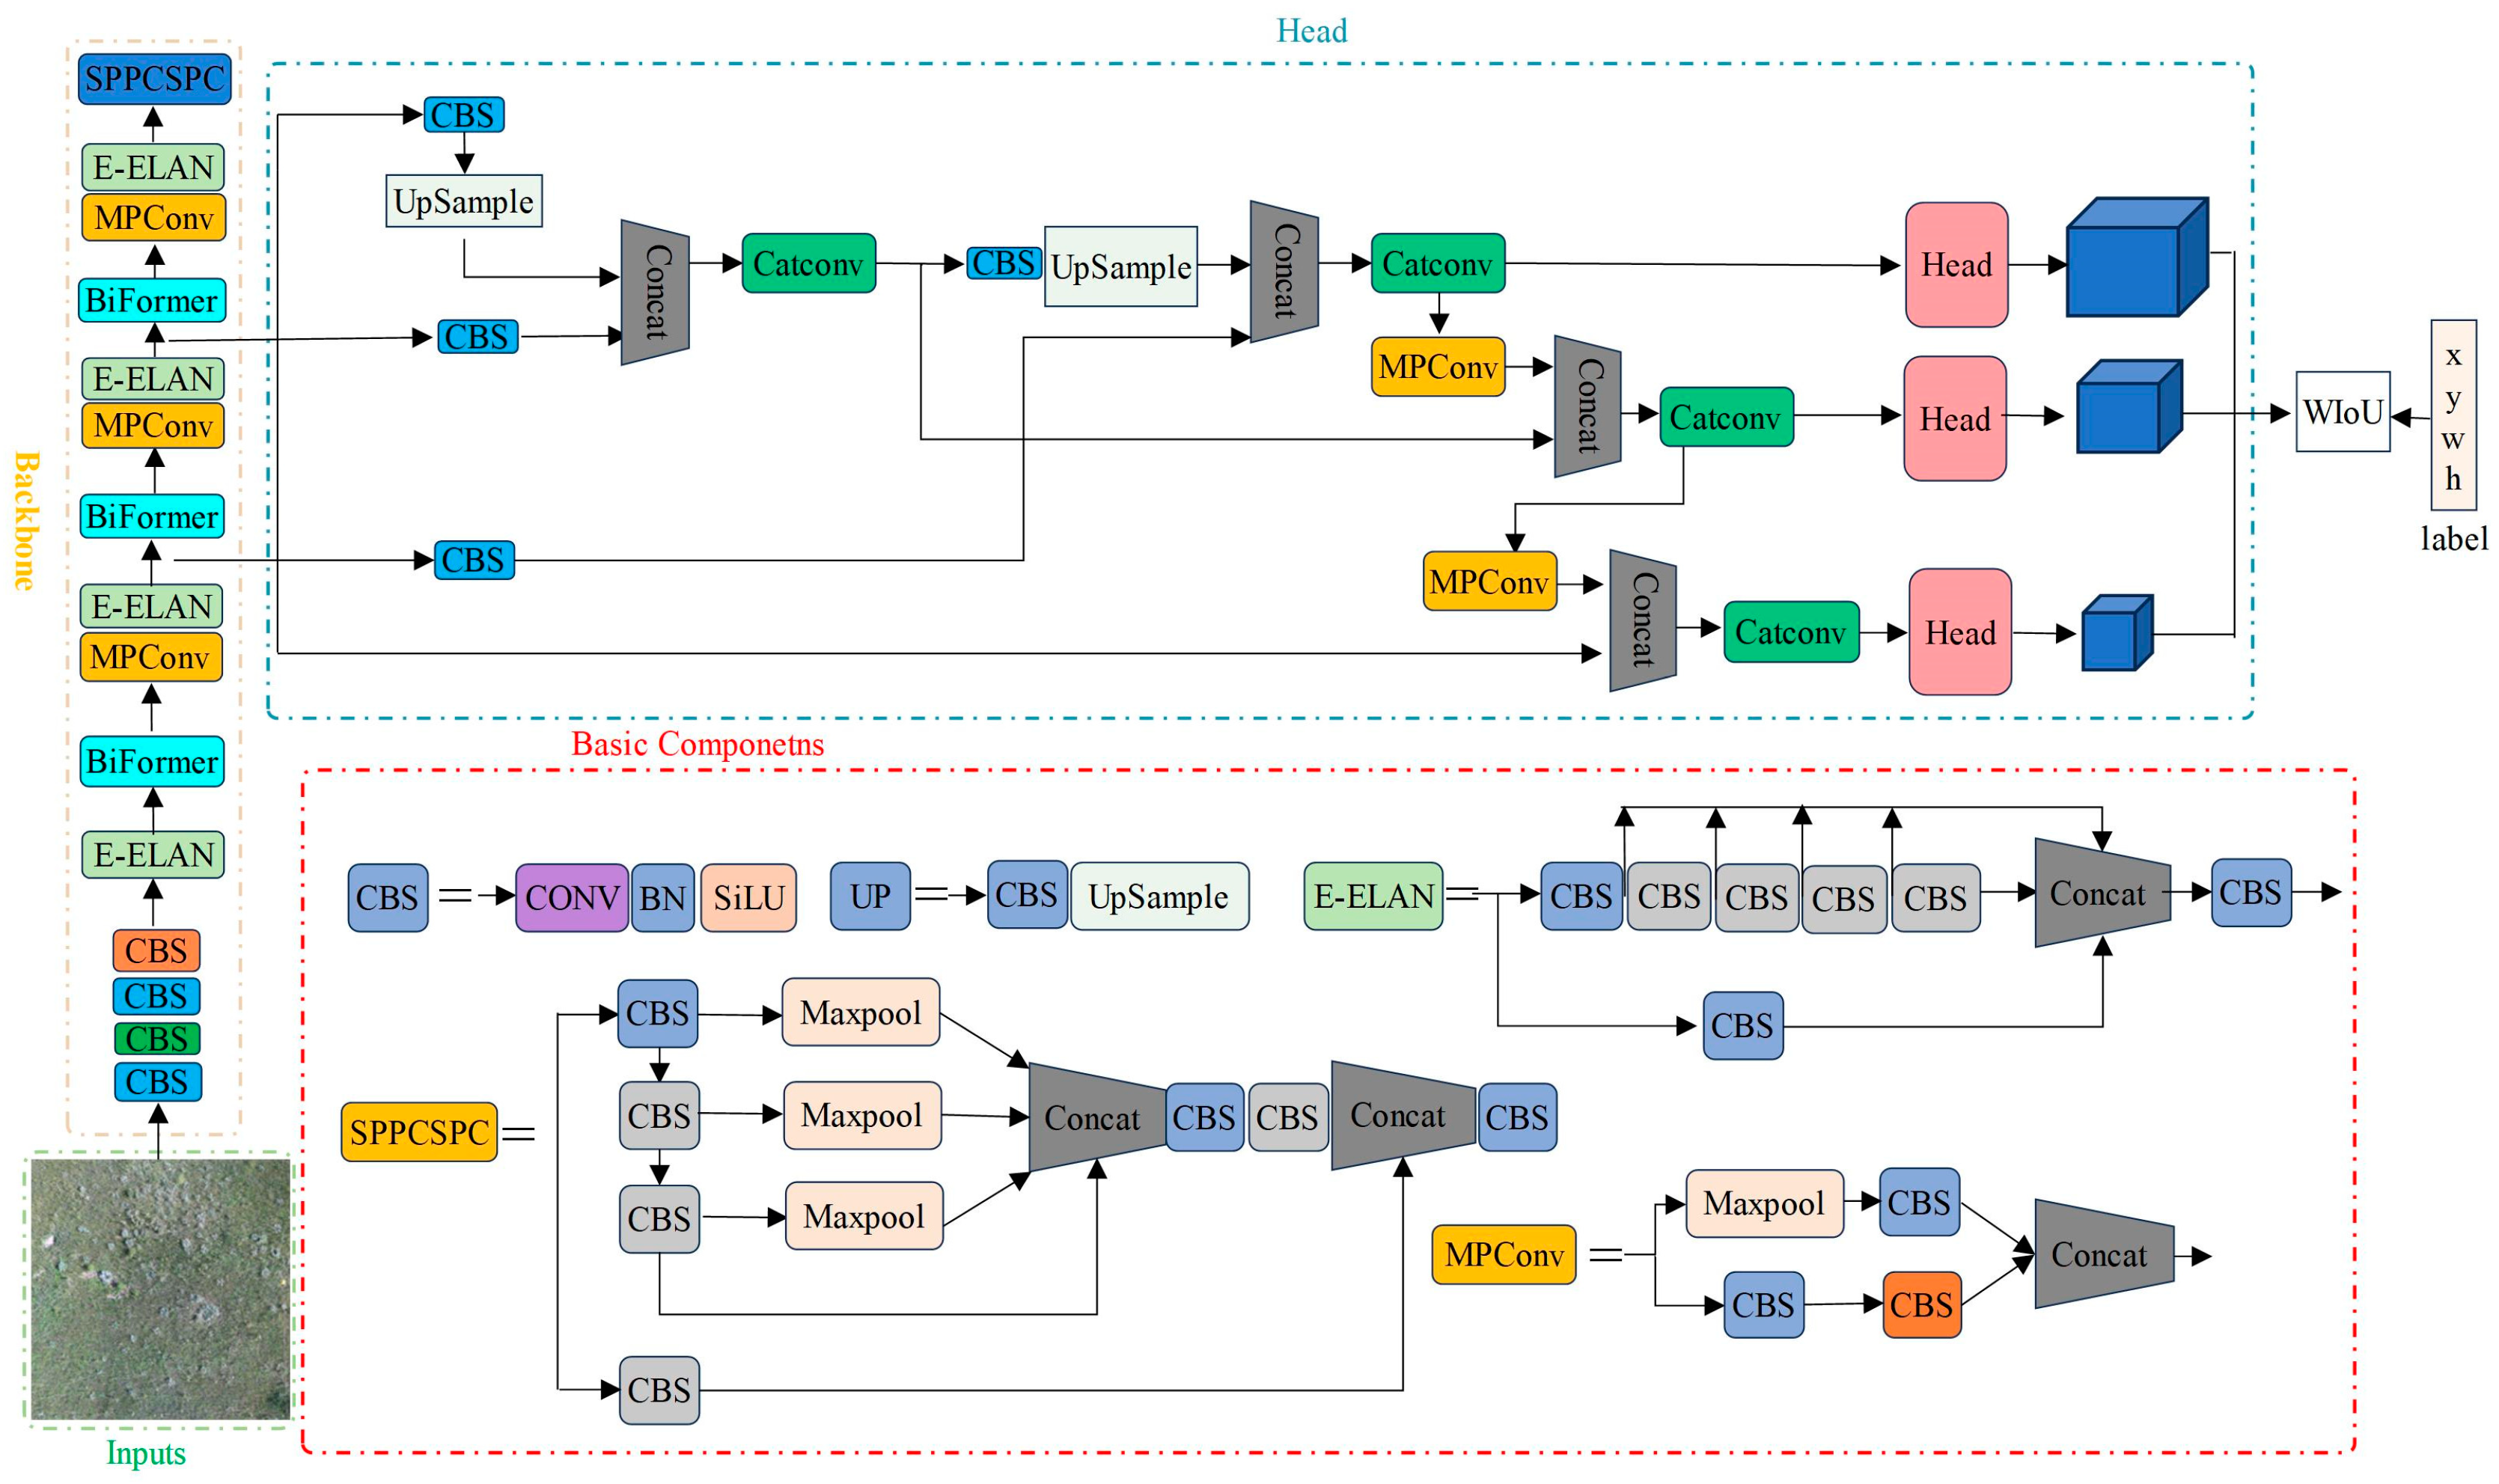
19]. Despite being considered one of the top-tier object detection models, YOLOv7 still faces challenges in detecting dense small objects. To address this, the Biformer module is introduced into the YOLOv7 backbone network to improve the detection capability of dense small objects. Simultaneously, to mitigate the impact of low-quality samples and enhance the overall detection performance of the model, the box loss of the YOLOv7 model is replaced with Wise-IoU (WIoU). The improved YOLOv7 network architecture is illustrated in
Figure 4.
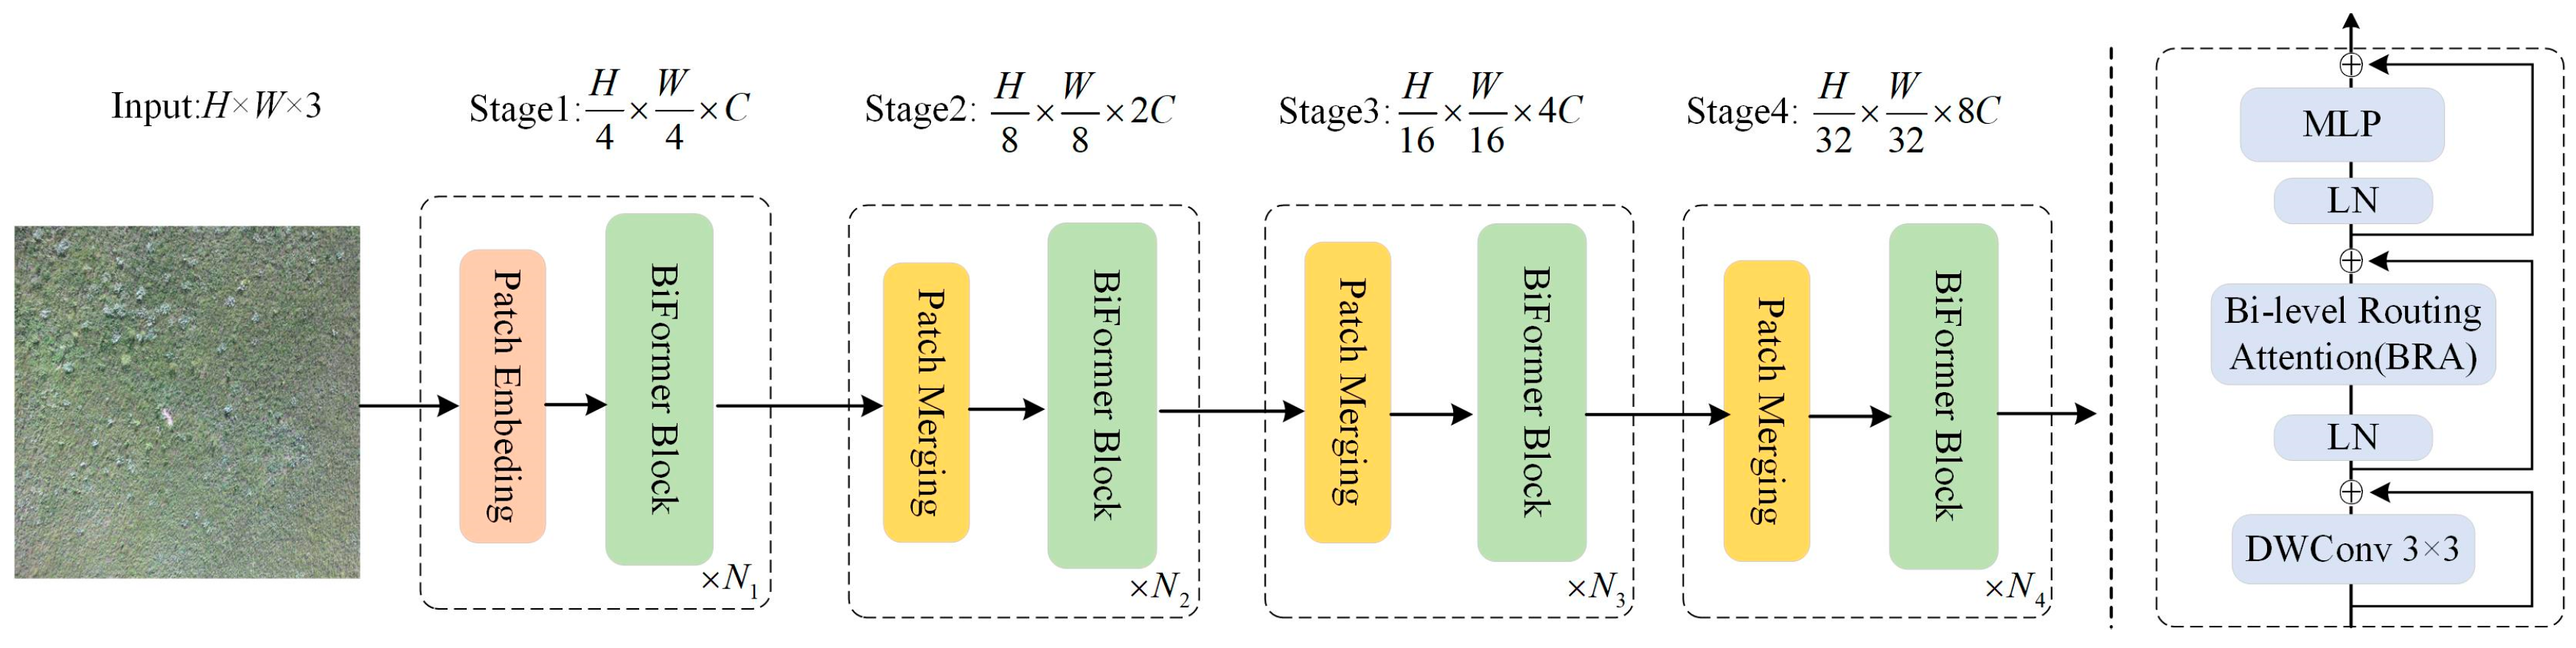
The network architecture of Biformer consists of the Bi-Level Routing Attention (BRA) module, as shown in
Figure 5. Due to its adaptive attention mechanism, which focuses on a small portion of relevant tokens without dispersing attention to unrelated tokens, it exhibits excellent performance and high computational efficiency in dense prediction tasks. This architecture follows the design principles of most vision transformer architectures and adopts a four-level pyramid structure, namely, a 32× downsampling. In the first stage, BiFormer employs overlapping block embeddings, while in the second to fourth stages, block merging modules are used to reduce the input spatial resolution while increasing the number of channels. Subsequently, continuous BiFormer blocks are applied for feature transformation. It is important to note that at the beginning of each block, depthwise convolutions are used to implicitly encode relative positional information. Following this, BRA modules and Multi-Layer Perceptron (MLP) modules with an expansion rate of 2 are sequentially applied, and used for modeling cross-location relationships and embedding at each position, respectively [
20,
21].
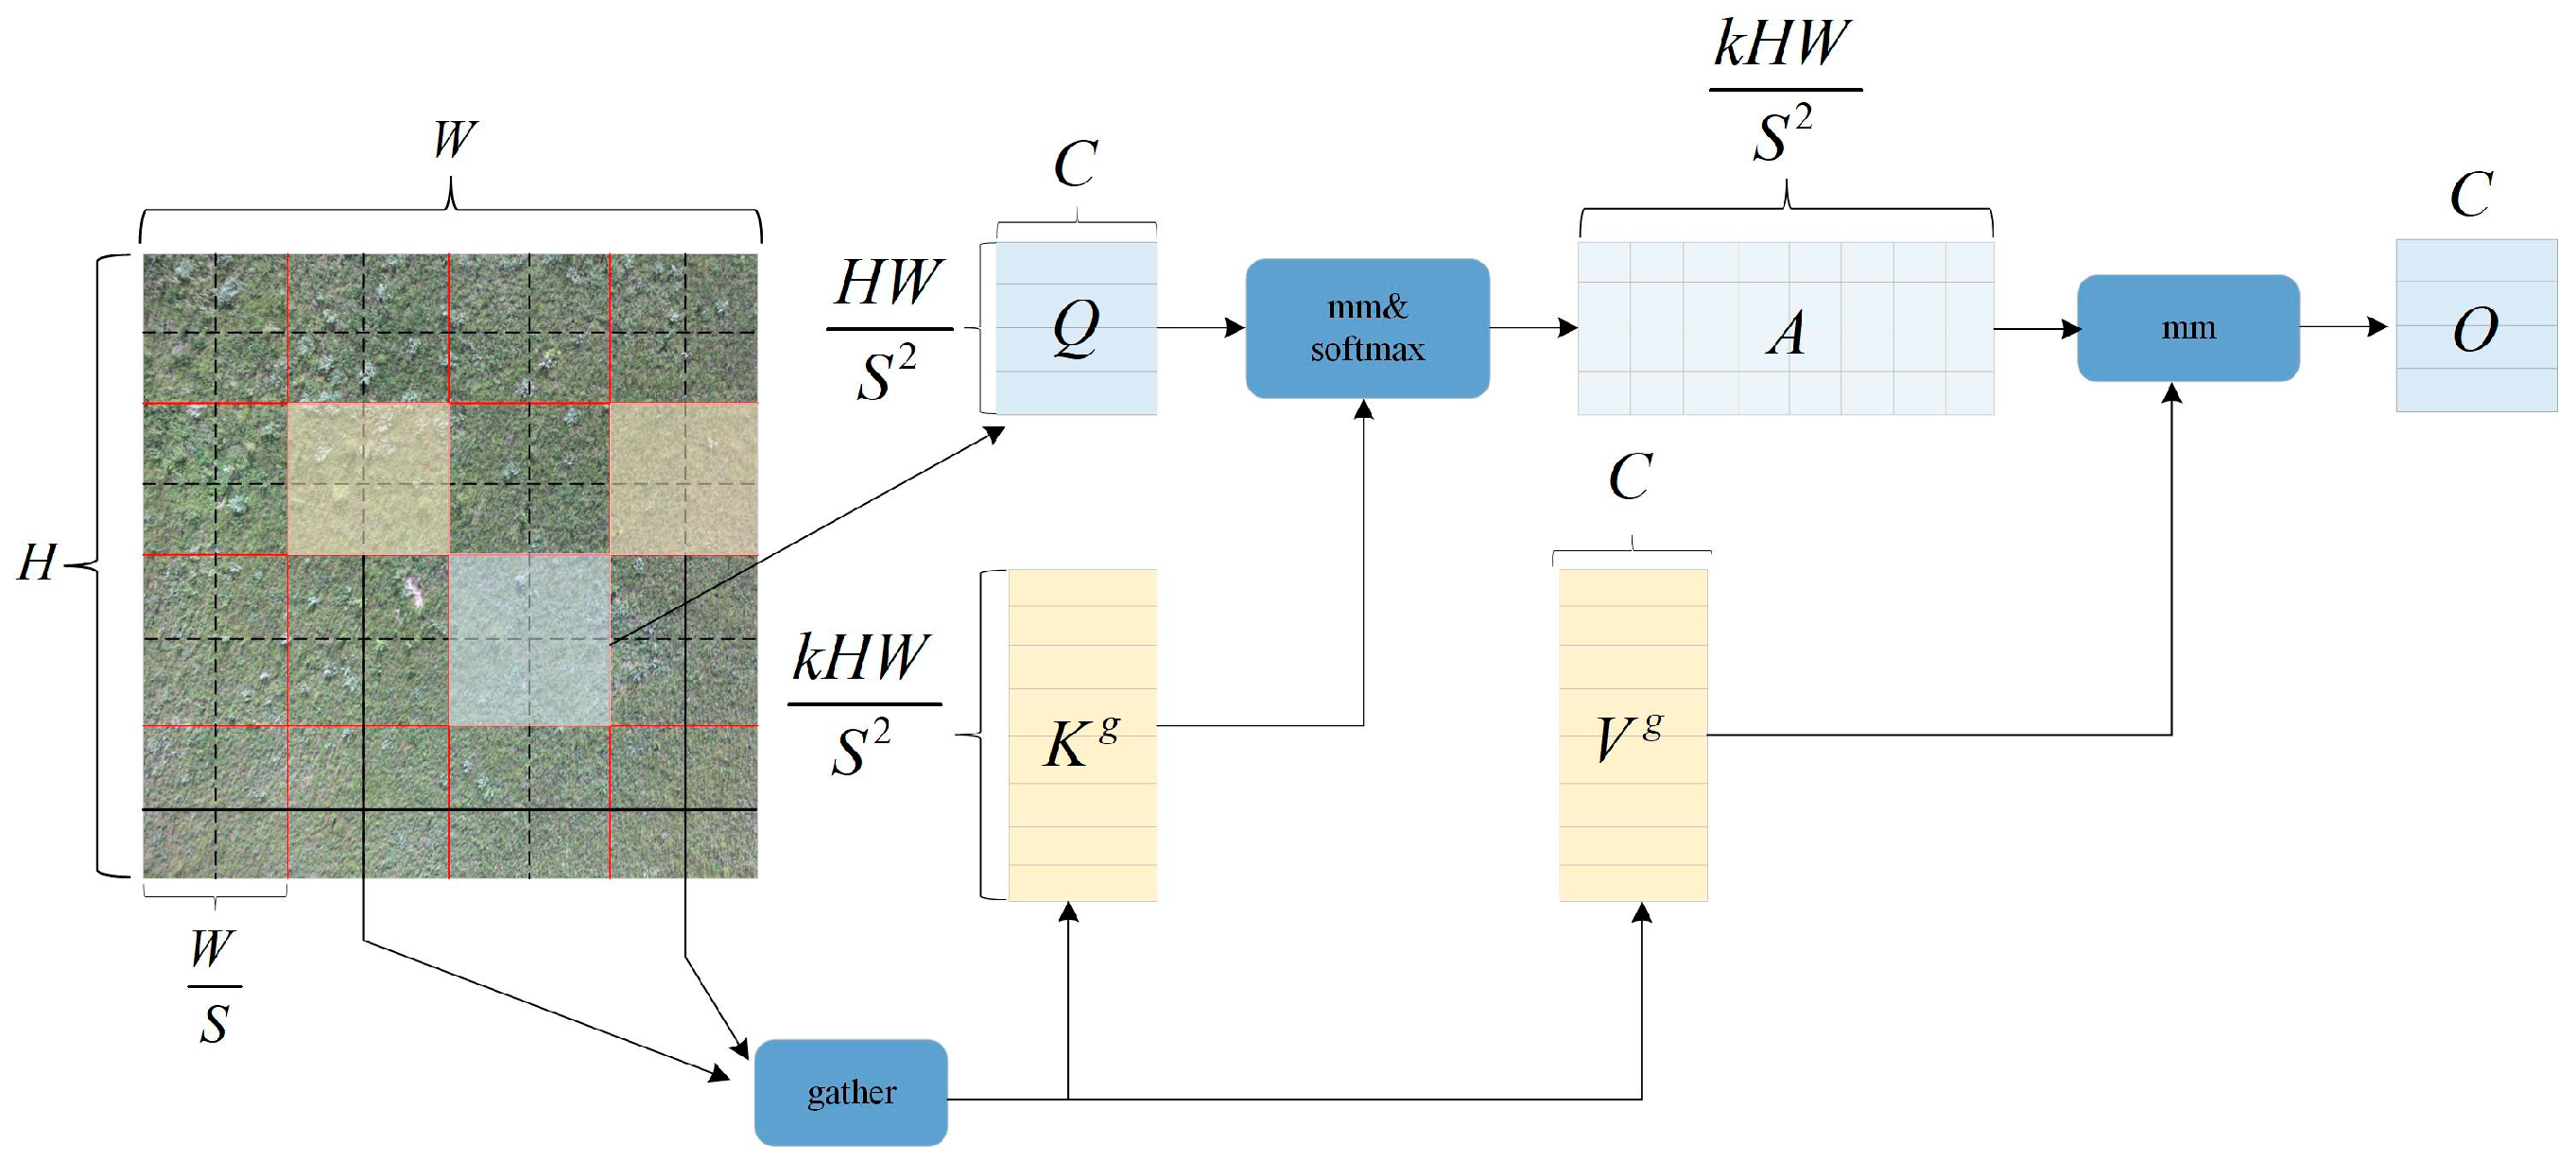
The BRA module is a different dynamic sparse attention mechanism that enables more flexible computation allocation and content awareness [
20], allowing the model to have dynamic query-aware sparsity. The BRA module is shown in
Figure 6. The process of BRA can be divided into three steps. Firstly, assuming we input a feature map, it is divided into multiple regions, and queries, keys, and values are obtained through linear projection. Secondly, we use an adjacency matrix to construct a directed graph to find the participating relationships corresponding to different key-value pairs, which can be understood as the regions each given region should participate in. Lastly, with the region-to-region routing index matrix, fine-grained token-to-token attention can be applied.
The bounding box loss function, a critical component of object detection loss, plays a pivotal role in significantly enhancing the performance of object detection models when well-defined. Existing research has predominantly operated under the assumption of high-quality training data samples, concentrating on improving the fitting capability of the bounding box loss. However, it has been observed that object detection training sets often include low-quality samples. Blindly intensifying bounding box regression on such low-quality examples poses a risk to localization performance. To address this issue, Focal-EIoU v1 was introduced as a solution [
22], but due to its static focusing mechanism (FM), the potential of non-monotonic FM was not fully exploited. Based on this idea, Tong et al. proposed Wise-IoU, incorporating a dynamic non-monotonic FM [
23]. The dynamic non-monotonic FM assesses the quality of anchor boxes using the outlier degree instead of intersection over union (IoU), offering a wise gradient gain allocation strategy. This strategy diminishes the competitiveness of high-quality anchor boxes while mitigating harmful gradients generated by low-quality examples. Consequently, WIoU focuses on anchor boxes of ordinary quality, enhancing the overall performance of the detector.
2.5. Model Application and Artemisia Frigida Distribution Mapping
Counting plants in representative plots within the experimental area and extrapolating these counts to the entire experimental area is a common method in field plant surveys. However, this sampling survey places high demands on the representativeness of the sampled plots. If the selected survey plots are not representative, it may lead to bias. Conducting global object detection in the experimental area based on high-resolution drone images can to some extent reduce the bias caused by sampling.
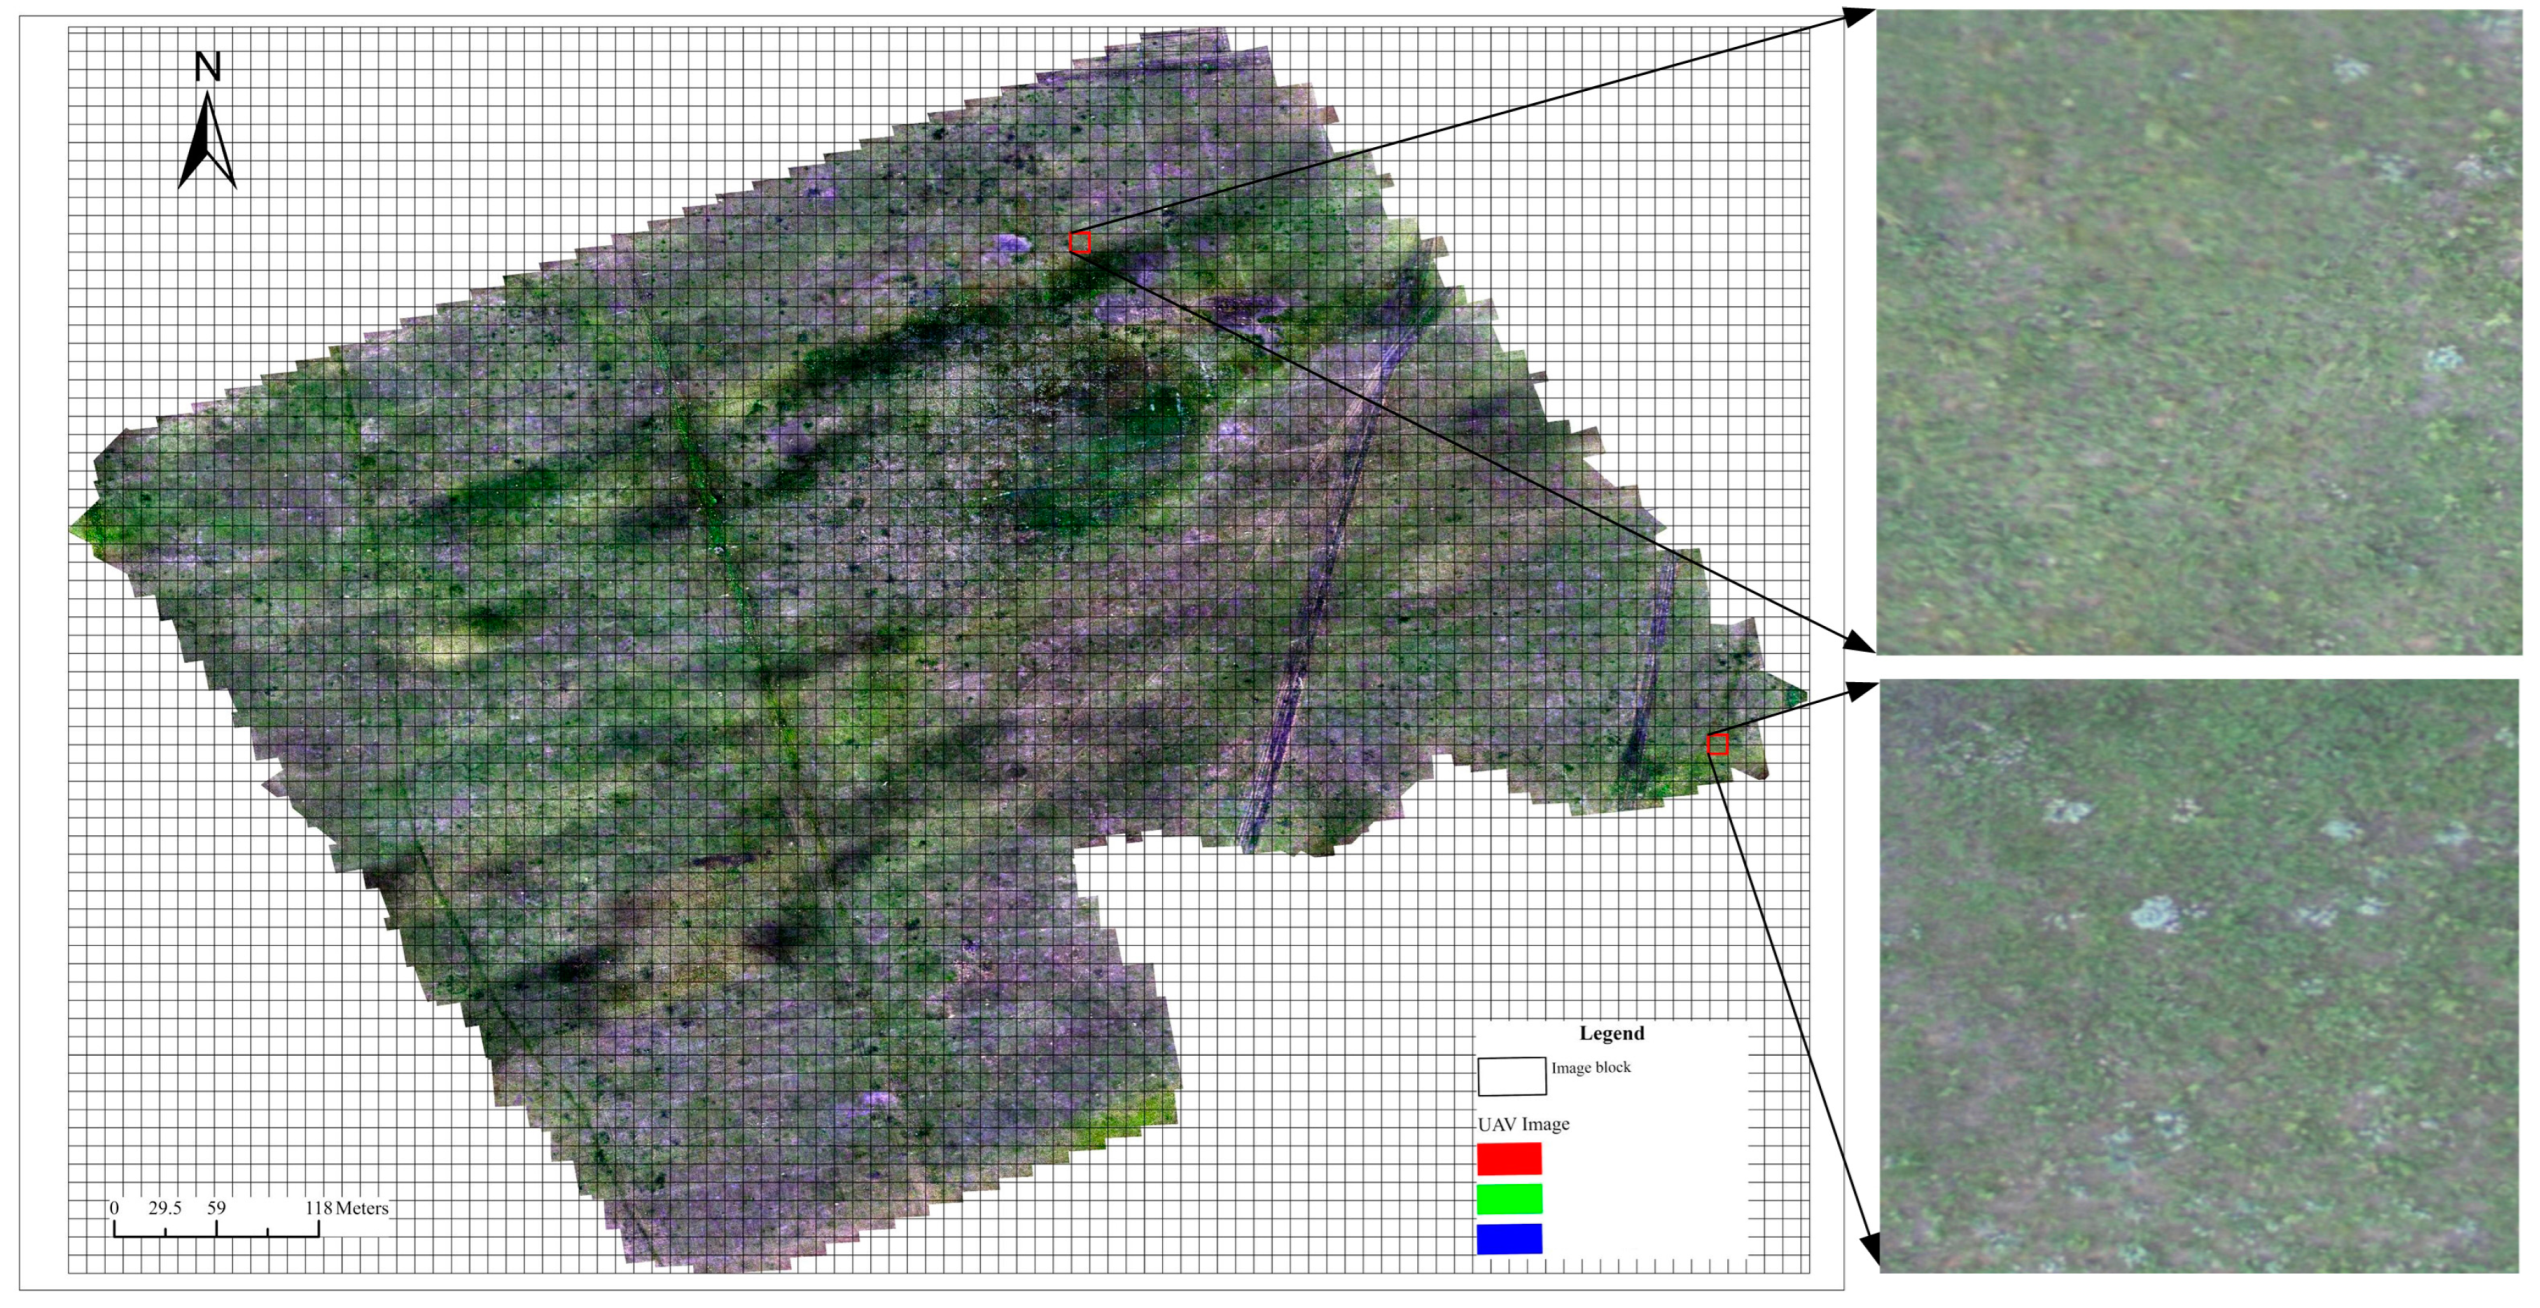
To obtain the distribution of
Artemisia frigida in the experimental area, we divided the orthomosaic of the experimental area into images of size 1280 × 1280 pixels, resulting in a total of 6624 images. The image blocks after slicing are shown in
Figure 7. We applied our improved YOLOv7 model to each image to obtain detection bounding boxes for
Artemisia frigida in each image. The bounding boxes were then transformed to obtain the coordinates of the centroid, which were recorded as the locations of
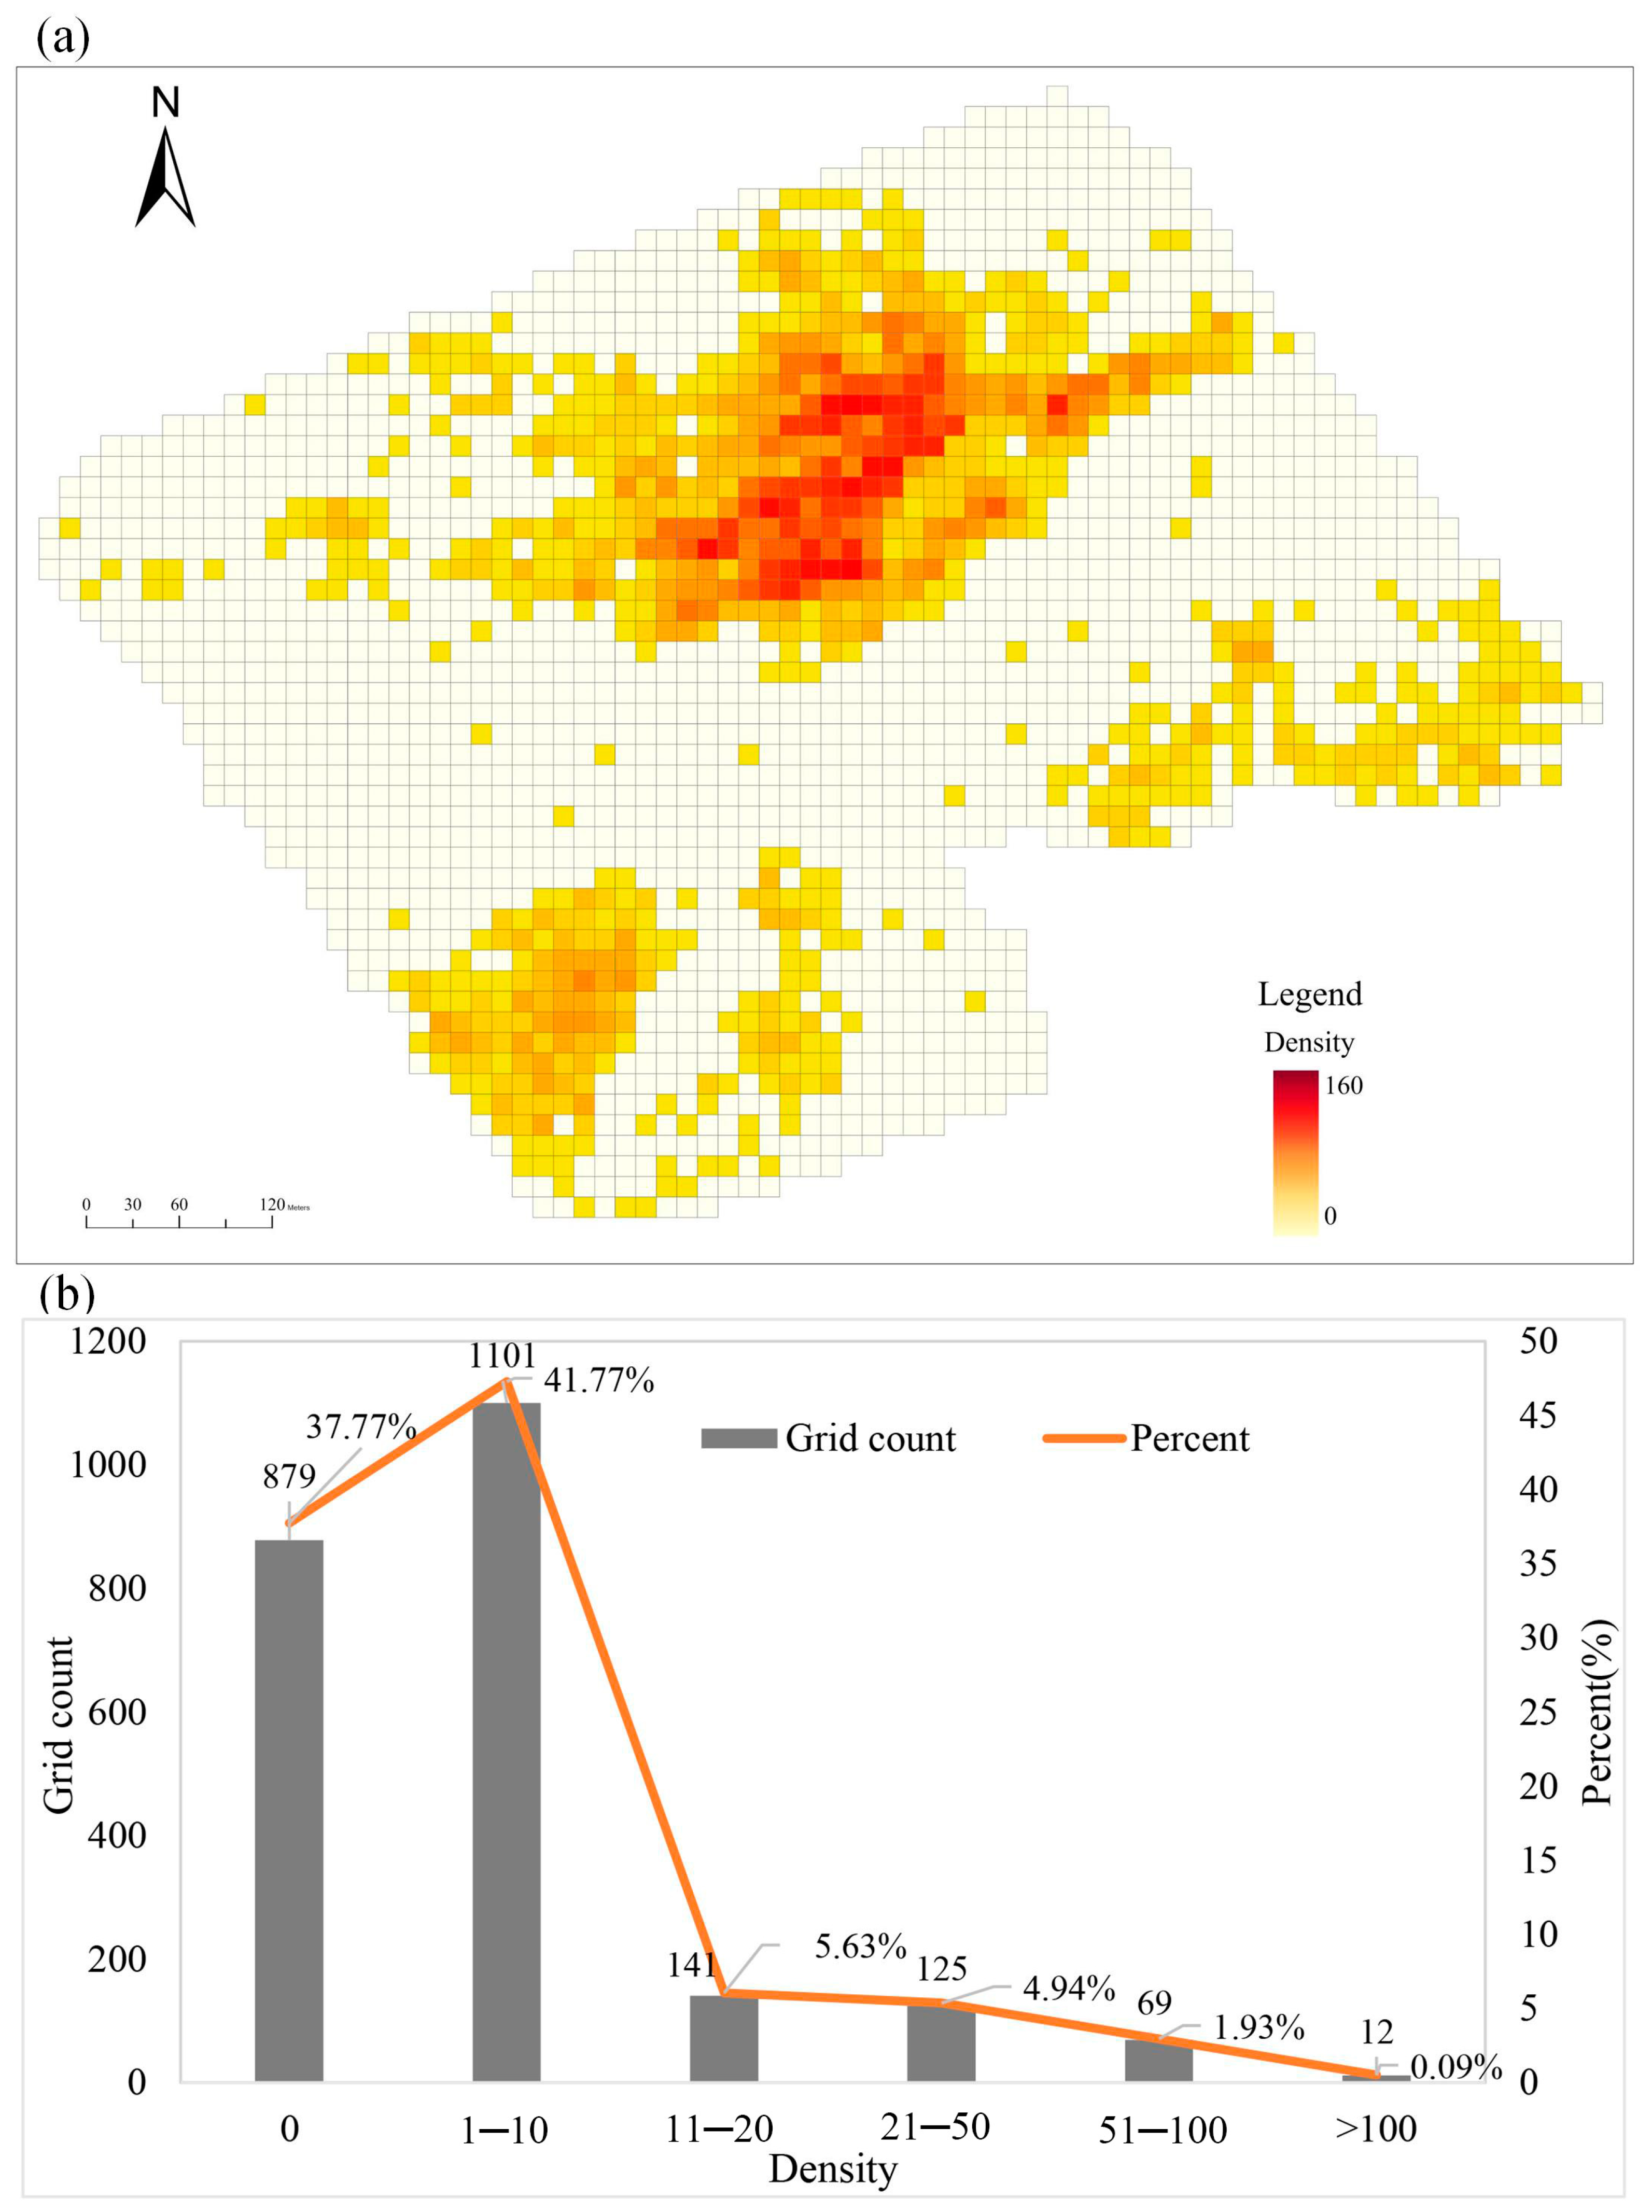
Artemisia frigida. To obtain the density of
Artemisia frigida distribution in the experimental area, we generated a grid of 10 × 10 m size across the entire experimental area and counted the
Artemisia frigida points in each grid, ultimately obtaining the distribution density of
Artemisia frigida in the experimental area.
2.6. Experimental Environment and Parameter Settings
The experimental platform for this study is a graphical workstation with an Intel(R) Core(TM) i9-13900K processor operating at 3.00 GHz, 128 GB of RAM, the GPU with the NVIDIA GeForce RTX 4090, 24 GB of VRAM, and the Ubuntu 20.04 operating system. The programs are written in Python 3.8, and model training is conducted on the PyTorch-2.0.0-gpu deep learning framework. The configuration of the experiment plays a crucial role in training deep learning models. The configuration of the experiment for this study is outlined in the
Table 1.
2.7. Evaluation
To evaluate the performance of the model in
Artemisia frigida detection, five metrics are employed in evaluation. These metrics include precision (
P), recall (
R), mean average precision (m
AP), parameters, frames per second (FPS). m
AP is a metric that better reflects the overall performance of the network. This study utilizes FPS to evaluate the real-time detection performance of the model. A higher FPS indicates faster model detection speed. The calculations for
P,
R, and m
AP are as follows:
where True Positive (
TP) represents accurate predictions made by the model, False Positive (
FP) indicates incorrect predictions, and False Negative (
FN) represents instances the model failed to detect.
AP denotes the area enclosed by the precision and recall curve. m
AP is the mean of the
AP values for various classes. m
AP@.5 refers to the mean average precision (m
AP) calculated with an IoU threshold set to 0.5. This means that a detection is considered valid only if the IoU between the predicted bounding box and the ground truth bounding box exceeds 0.5.
Q represents the total number of classes;
AP(
k) denotes the Average Precision (
AP) value for the
k-th class.
4. Discussion
Plant diversity can be measured at different scales, from satellite to ground level [
24]. However, current remote sensing-based methods for observing plant diversity are mostly focused on the community or landscape scale and have not yet achieved individual-scale monitoring that matches ground-based observations [
25]. With the development of near-ground remote sensing technologies such as UAV, high-resolution and ultra-high-resolution data can be obtained [
26]. Combined with methods like deep learning, this allows for the rapid localization and classification of plants, greatly enhancing the efficiency of biodiversity surveys and monitoring [
27,
28,
29].
In this study, the improvement of YOLOv7 model was implemented to enhance the detection performance of
Artemisia frigida in UAV images, but there is still room for improvement in performance. Factors influencing the detection of grassland plants, including
Artemisia frigida, mainly include the following. Firstly, it is necessary to obtain a sufficient amount of high-quality data. UAV can easily and quickly obtain images of the target area, but the resolution of the sensors and the environmental conditions during image acquisition may lead to some images not meeting the requirements for object detection data, ultimately affecting the detection performance [
30,
31]. Secondly, the quality of data annotation also affects the performance of the detection model.
Artemisia frigida exhibits significant differences in morphology and size during different growth stages, making it challenging to distinguish the boundaries from the background, posing challenges for annotation [
32]. Lastly, some
Artemisia frigida has small bodies, and there may be overlapping and unclear boundaries between individuals, which will affect the final detection results.
Therefore, for the detection of dense small targets such as grassland plants, improving the algorithm can to some extent enhance the model’s detection performance. However, data quality and sample quality directly impact the improved model’s detection performance. Therefore, collecting high-quality datasets and building high-quality samples are essential for improving model accuracy. Currently, with the use of high-definition cameras equipped on UAV, analyzing the actual characteristics of the detection targets and planning flight routes and parameter settings reasonably can yield a sufficient number of high-quality samples. When combined with high-quality model improvements, this approach will greatly enhance the detection performance of grassland plants [
33].
5. Conclusions
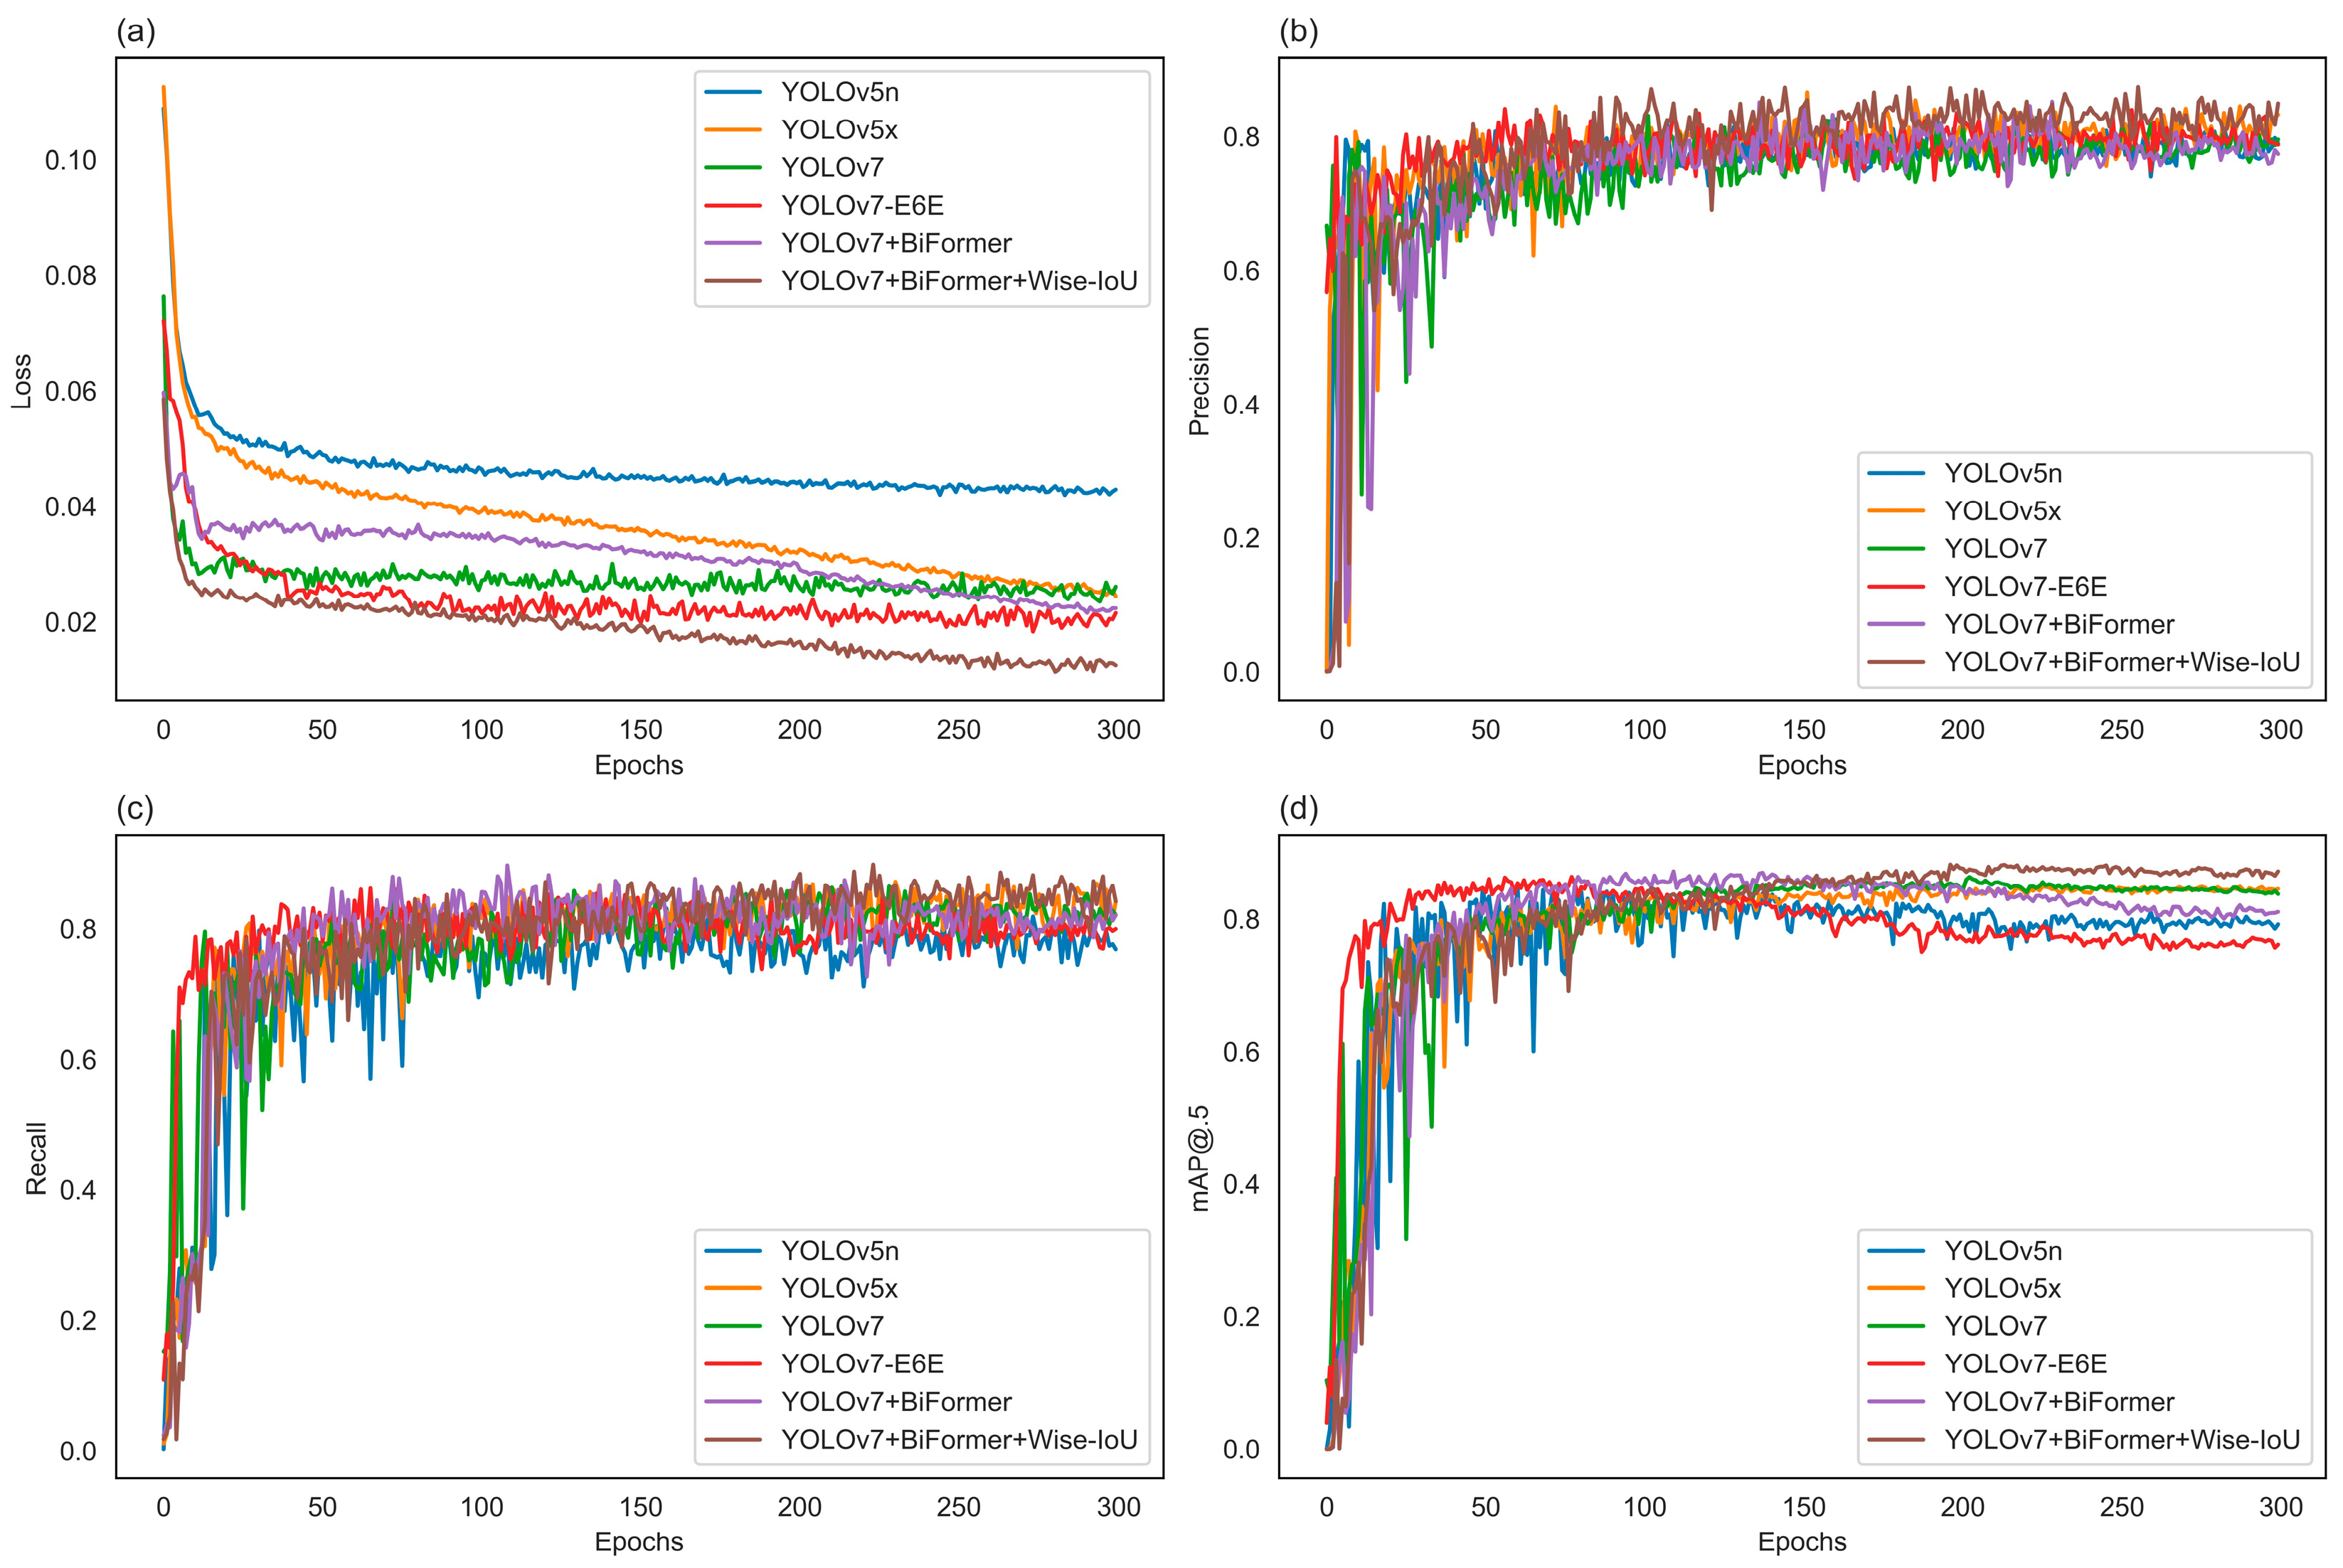
In this study, based on UAV imagery data, we conducted the detection of the grassland degradation indicator species, Artemisia frigida, by improving the YOLOv7 model. The results indicate that the improved YOLOv7 + Biformer + Wise-IoU model outperforms YOLOv7 overall, with a 6% improvement in precision and a 3% increase in mAP@0.5 compared to YOLOv7. The model has a reduced parameter count compared to YOLOv7, and its inference speed is close to that of YOLOv7. The YOLOv7 + Biformer + Wise-IoU model achieves an overall detection precision of 96% and a recall of 94% across 10 sample sites, demonstrating superior performance in the detection of Artemisia frigida at the site scale. Applying the model to predict Artemisia frigida across the entire experimental area and obtaining the density, the average density of Artemisia frigida in the entire experimental area is 7 per 100 m2, with a maximum density of 160 per 100 m2.
From the perspective of the model’s detection performance on Artemisia frigida and its application in the experimental area, fully leveraging the advantages of UAVs in terms of agility, flexibility, and high-resolution data acquisition, combined with the application scenarios of grassland plant recognition, developing or improving adapted high-quality object detection models holds broad prospects in grassland species distribution surveys. However, there is still significant room for improvement in the model’s detection accuracy and speed. Continuous iterations and optimizations are necessary to enhance the overall performance of the model, thereby expanding its applicable scenarios and deployable environments. Looking ahead to the requirements of future grassland surveys regarding the number of identifiable species and recognition accuracy, the research will focus on collecting UAV image data containing more grassland degradation indicator species and constructing high-quality UAV image samples of degradation indicator species. This will improve the model’s detection performance for degradation indicator species and even more grassland species, establishing a comprehensive solution encompassing UAV flight control, sensor selection, data acquisition, data processing, model training, model deployment, and application.


